THE EFFECT OF HSA-MIR-105 ON PROSTATE CANCER GROWTH
|
|
|
- Alison Wade
- 6 years ago
- Views:
Transcription
1 THE EFFECT OF HSA-MIR-105 ON PROSTATE CANCER GROWTH by David Rice Honeywell Bachelor of Science, Queen s University, 2010 THESIS SUBMITTED IN PARTIAL FULFILLMENT OF THE REQUIREMENTS FOR THE DEGREE OF MASTER OF SCIENCE In the Department of Biochemistry, Microbiology and Immunology David Rice Honeywell, Ottawa, Canada, 2012 All rights reserved. However, in accordance with the Copyright Act of Canada, this work may be reproduced, without authorization, under the conditions for Fair Dealing. Therefore, limited reproduction of this work for the purposes of private study, research, criticism, review and news reporting is likely to be in accordance with the law, particularly if cited appropriately.
2 ABSTRACT Micro (mi)rnas have recently been found to play an important role in cancer biology. In order to further understand how mirnas affect prostate tumour progression, we evaluated mirna expression in two invasive prostate tumour lines, PC3 and DU145. We then focused our evaluation on a novel mirna, mir-105, whose levels were significantly decreased in both tumour cell lines as compared to normal prostate epithelial cells. As mir- 105 levels were reduced in prostate tumour cell lines, we restored its expression following transfection of cells with mimic constructs to over-express mir-105 in both cell lines, in order to determine its effect on various tumourigenic properties. Over-expression caused decreased tumour cell proliferation, anchorage-independent growth and invasion in vitro and inhibited tumour growth in vivo. We further identified CDK6 as a putative target of mir- 105, which likely contributed to its inhibition of tumour cell growth. Our results suggest that mir-105 inhibits tumour cell proliferation and may be an interesting target to regulate tumour growth or potentially used as a biomarker to differentiate between less and more aggressive tumours in patients. ii
3 ACKNOWLEDGEMENTS First and foremost I would like to thank my supervisor, Dr. Christina Addison, for her constant support and advice throughout my studies. I would like to thank Grant Howe, Huijun (Jane) Zhao and Miguel Cabrita for the countless times they helped me in the lab with my experiments. I would like to thank my TAC members Dr. Jim Dimitroulakos and Dr. Bruce McKay for their valuable advice and criticism. I would like to thank everyone in the Cancer Centre who helped me, whether it was through advice, hands-on help or encouragement. Finally, I would like to thank my friends, family and significant other for their constant encouragement and support. iii
4 TABLE OF CONTENTS Abstract... ii Acknowledgements... iii Table of Contents... iv Abbreviations... vi List of Figures and Illustrations... ix List of Tables... x 1: Introduction Preamble Introduction to Prostate Cancer Prostate cancer background General models of prostate cancer Introduction to mirnas mirna background mirna biogenesis Mechanisms of gene regulation by mirna Role of mirnas in disease mirnas in disease mirnas in cancer mirnas in prostate cancer The role of mir-105 in prostate cancer mir-105 location and structure Preliminary findings for mir Summary, rationale and hypothesis Approach Objective 1: To validate microarray findings indicating that certain mirnas are dysregulated in metastatic prostate tumour cells compared with normal prostate epithelial cells Objective 2: To evaluate the effect of differentially regulated mirnas, specifically mir-105, on prostate cancer growth and invasion in vitro and in vivo Objective 3: To identify cellular targets of mir-105 that contribute to its effects on tumourigenesis : Materials and Methods Cells and Media Transfections Microarrays Quantitative Reverse Transcription-Polymerase Chain Reaction (RT-qPCR) MTT Assays iv
5 2.6 Apoptosis Assays Anchorage-independent 3D Growth Assays Scratch Wound Assays Invasion Assays In Vivo Tumour Xenograft Models Antibodies and Western Immunoblotting Graphical and Statistical Analysis : Results Differences in microrna expression between normal prostate epithelial cells and prostate cancer cell lines Characterization of efficacy of miridian mirna mimics Over-expression of mir-105 suppresses tumour cell growth in vitro mir-105 over-expression does not cause increased apoptosis in vitro mir-105 over-expression suppresses anchorage-independent growth in vitro Over-expression of mir-105 inhibits PC3 tumour cell migration and invasion Over-expression of mir-105 inhibits growth of prostate tumour cells in vivo in xenograft models mir-105 targets multiple proteins, including Cdk6, in prostate tumour cells : Discussion Modulation of tumorigenesis by over-expression of mir-105 in PC3 and DU145 cells Analysis of PrEC vs PC3 / DU145 cells using mirna microarrays mir-105 over-expression leads to altered in vitro tumour phenotypes mir-105 over-expression leads to altered in vivo tumour growth mir-105 targets Cdk6 to cause changes in cell proliferation Altered mirna expression levels in cancer Presence of mir-105 in expression studies Status of mir-105 in cancer cell lines and tissues Applications for mir-105 in the future mirnas as biomarkers mirnas in targeted therapies Conclusion Appendix Reference List Contributions of Collaborators Curriculum Vitae v
6 ABBREVIATIONS 3 untranslated region 3 UTR 5,10-methylenetetrahydrofolate reductase MTHFR 5 untranslated region 5 UTR androgen receptor Argonaute-2 basic fibroblast growth factor chronic lymphocytic leukemias cold-shock domain-containing protein 2 coronary heart disease cyclin-dependent kinase 6 cyclin-dependent kinase-8 Dead end 1 DNA-binding protein DiGeorge critical region 8 double-stranded RNA Dulbecco s Modified Eagle Medium E3 ubiquitin ligase identified by differential display epidermal growth factor epidermal growth factor receptor AR Ago2 bfgf CLL CSDC2 CHD Cdk6 Cdk8 Dnd1 DGCR8 dsrna DMEM EDD EGF EGFR vi
7 epithelial to mesenchymal transition eukaryotic initiation factor 4E extracellular matrix fetal bovine serum formalin-fixed, paraffin-embedded GABA A receptor alpha 3 subunit Gamma-aminobutyric acid glutathione S-transferase 1 hematoxylin and eosin heterogeneous nuclear ribonucleoprotein A1 inositol polyphosphate multikinase microrna mirna-induced silencing complex Neural precursor cell expressed, developmentally down-regulated 4 open-reading frame phosphatase and tensin homologue poly ADP ribose polymerase poly(a)-binding protein precursor mirna primary mirna processing bodies EMT eif4e ECM FBS FFPE GABRA3 GABA GSTP1 H&E hnrnp A1 IPMK mirna mirisc NEDD4 ORF PTEN PARP PABP pre-mirna pri-mirna P-bodies vii
8 propidium iodide prostate epithelial cell prostate-specific antigen protein activator of PKR Ran guanosine diphosphate Ran guanosine triphosphate Retinoblastoma Ribonuclease ribonuclease (RNase) III enzyme Drosha ribonucleoprotein complexes RISC loading complex RNA helicase A RNA-induced silecing complex single nucleotide polymorphism Soft-agarose Tar RNA binding protein Toll-like Receptor 2 tumour necrosis factor-alpha Tumour-growth factor-b II receptor PI PrEC PSA PACT Ran-GDP Ran-GTP RB RNase RNASEN RNP RLC RHA RISC SNP SA TRBP TLR2 TNF-alpha TGFBRII viii
9 LIST OF FIGURES AND ILLUSTRATIONS Figure 1: Standard view of the linear progression in mirna biogenesis Figure 2: Standard view of mirisc-related translational repression and mrna degradation by deadenylation and decapping Figure 3: Pre-miR and mature mir-105 sequences Figure 4: mir-105 levels are reduced and mir-720 levels are increased in prostate tumour cells compared to normal prostate epithelial cells Figure 5: Evaluation of efficacy of miridian mimics for modulation of mir-105 levels Figure 6: Over-expression of mir-105 inhibits tumour cell growth but does not induce apoptosis Figure 7: Effects of elevated mir-105 levels on A549 cell viability and anchorageindependent growth Figure 8: Over-expression of mir-105 inhibits anchorage-independent growth of prostate tumour cells Figure 9: Over-expression of mir-105 inhibits tumour cell migration and invasion Figure 10: Over-expression of mir-105 inhibits in vivo subcutaneous tumour growth in vivo Figure 11: mir-105 results in decreased Cdk6 expression at both the mrna and protein levels Figure 12: Diagram of mir-105's putative effect on Cdk6 and other cancer phenotypes ix
10 LIST OF TABLES Table 1: Differentially expressed mirnas in PC3 cells versus PrEC cells Table 2: Differentially expressed mirnas in DU145 cells versus PrEC cells x
11 1: INTRODUCTION 1.1 Preamble Prostate cancer is the most common cancer affecting Canadian men and its prevalence is increasing as our population grows older (48). Within Canada there will be an expected 26,500 new cases along with approximately 4000 deaths in 2012, which ranks prostate cancer third in terms of cancer mortality among males (183). Autopsies of men aged 30 to 40 revealed that up to 29 percent harboured prostatic carcinomas, and the percentage increased to 64 percent in the 60 to 70 age group (170). Many important genes are involved in the development of prostate cancer, including key targets such as androgen receptor (AR) (191), phosphatase and tensin homologue (PTEN) (118) and p27 Kip1 (32). Recently there is a new class of genes, called micrornas (mirnas), which have been shown to greatly influence prostate cancer progression. mirnas are small, nucleotide RNA molecules that target specific mrna sequences and usually repress or destroy their targets (76). Since their discovery in 1993 (113) (200) and subsequent understanding of their function, mirnas have risen in prominence as an additional layer of complexity in gene expression. It is estimated that over 60% of genes, which include many key signaling pathways within the cell, are regulated by mirnas (55). They are very important in the proper development of organs, such as the heart (50), brain (49) and reproductive organs (75), but also play a role in many diseases such as cancer (19), heart disease (190), and diabetes (101). mirnas are also highly involved in the development and progression of prostate cancer (74). One area of interest is 1
12 mirna involvement in prostate cancer metastasis. Most deaths in prostate cancer patients occur because the primary prostate tumour has metastasized and spread throughout the body, particularly to the bone (16). Understanding how mirnas affect prostate cancer metastasis would aid in the understanding, detection and future treatment of the disease. To this end the mirna expression of two metastatic prostate cancer cell lines, PC3 and DU145, was compared against that of normal prostate epithelial cells (PrECs). A novel target, hsa-mir- 105, was identified as being significantly repressed in both metastatic cells lines and its effects on cell proliferation, anchorage-independent growth and invasion were thus evaluated. 1.2 Introduction to Prostate Cancer Prostate cancer background Prostate cancer was first described in 1853 when Dr. John Adams performed a histological examination of a patient s prostate and lymph nodes and found cancerous masses (39). The progression of prostate cancer from normal prostatic epithelium to advanced metastatic cancer lies with the alteration of key genes such as glutathione S- transferase 1 (GSTP1), PTEN, p27 Kip1, and AR. GSTP1 is a caretaker gene that protects the genome from oxidative stress-induced damage, and hyper-methylation of its promoter is the most common epigenetic change in early prostate cancers (92). PTEN is a canonical tumoursuppressor gene that normally suppresses the Akt/PKB growth pathway, and its loss leads to metastatic prostate cancer (194). p27 Kip1 normally regulates the cell cycle, and its loss in prostate cancer leads to increased proliferation and tumour growth in conjunction with loss of PTEN (40). Finally, AR mutations are crucial to late-stage prostate cancer because they 2
13 allow the cell to become androgen-independent (191). In addition to these examples there are thousands of other possible prostate cancer mutations that allow tumours to grow, survive and metastasize. Today there are multiple therapeutic treatments available for prostate cancer, such as surgery, radiation therapy, hormonal therapy and chemotherapy. Radical prostatectomies were one of the first therapies used to treat prostate cancer. This method was pioneered in 1904 by Dr. Hugh Young when he performed the first radical perineal prostatectomy (85). Surgery, in combination with other advances such as improved biopsy techniques in 1988 (155) and prostate-specific antigen (PSA) tests in 1986 (103), led to increased survival rates for men with primary prostate cancers. Radiation therapy is another method that was initially used in the beginning of the 20 th century by inserting radium, a radioactive element, into a patient s prostate (37). However, this was very inaccurate and radiation therapy fell out of use until new technology allowed the accurate placement of radioactive materials (156), along with the invention of accurate external beam radiotherapy that did not damage surrounding tissues (6). The first drug-based therapy arrived in the early 1940s when Charles Huggins developed androgen-ablation therapy. It was based on the discovery that prostate cell growth is driven by androgen hormones such as testosterone, and reducing their levels by chemical inhibition or physical castration leads to significantly reduced prostate size and growth (79). When applied to human prostate cancer patients it significantly reduced prostate cancer growth, and became one of the first successful prostate cancer treatments (78). This therapy is often used in conjunction with surgery or radiation treatment. Finally, chemotherapy is used less in prostate cancer compared with other cancers (60). Current research is focusing on creating chemotherapeutics that have a significant effect on 3
14 metastatic cancers, with limited but improving success (151). Today, primary prostate cancer is often caught early because of physical examinations and PSA testing, and this early cancer responds well to treatments such as surgery, radiation and androgen-ablation therapy. However, if prostate cancer develops and metastasizes, then there are no effective treatment options except for palliative care (52) General models of prostate cancer Cancer research requires immortalized cancer cell lines to study the disease in vitro. The standard prostate cancer cell lines PC3 and DU145 were used in our study as models of metastatic prostate cancer. They were compared to the normal prostate epithelial cell line (PrEC). PrEC cells are the standard representative cell line of pubertal prostate epithelial cells (182). PrECs express both basal and luminal prostate cell markers, which indicates that they are derived from basal epithelial stem cells and show signs of transition into the luminal cell type. Unlike cancer cell lines PrEC cells are not immortalized and cells can only be used for between cell doublings. The PC3 cell line was derived from metastatic prostate tumours located in a lumbar vertebrae (89), and the DU145 cell line was derived from metastatic prostate tumour located in the central nervous system (139). PC3 cells are nonresponsive to androgen, do not respond to external growth factors such as epidermal growth factor (EGF) and basic fibroblast growth factor (bfgf) and are able to grow in both anchorage-independent and nude mouse environments (198) (1). DU145 cells are similar except for the fact that they still respond to external growth factors such as EGF and bfgf. Both contain mutations in important cancer genes. For example, PC3 cells are p53 null, while DU145 cells are p53 heterozygous (24). Recent research has shown that both also 4
15 harbour changes in mirnas that affect cancer phenotypes, such as mir-29b affecting epithelial to mesenchymal transition (EMT) in PC3 cells (169) and mir-375 affecting proliferation levels in DU145 cells (187). 1.3 Introduction to mirnas mirna background mirnas are small RNA inhibitors which have been shown to play an important role in regulating gene expression in a number of organisms. mirnas were first discovered in 1993 in C. elegans by two separate groups (113) (200). Both found that a small RNA product of the lin-4 gene was able to regulate levels of LIN14 protein. They determined that the small RNA contained complementary sequences to the 3 untranslated region (3 UTR) of the lin-14 mrna, but they did not know if the relationship was based around a stable or transient binding. In 1998 it was discovered that small RNAs could cause posttranscriptional silencing of mrna levels (53). A second mirna, let-7, was discovered by two groups in 2000 (148) (159). Then in 2001 three studies (112) (105) (107) simultaneously found that there were an abundance of these small RNA molecules not just in C. elegans but also in many animal species, including Drosophila melanogaster and Homo sapiens. The three groups agreed to name this new, abundant class of small RNAs micrornas, based on their small mature size of nucleotides. They also suggested the nomenclature mir-# and mir-# for individual mirnas and their genes, respectively. After this discovery came a flood of new mirna discoveries in many species of animals (142) and plants (124). The function of mirnas on their mrna targets was discovered in 2002 when multiple groups demonstrated that mirnas can act in a similar fashion to sirnas by causing the destruction 5
16 of their mrna partners by directing sequence-specific degradation (84) (125) (160). A breakthrough in mirna identification appeared in 2004 when researchers used directional cloning to develop small cdna libraries of endogenous small RNA molecules (27) (2). This was far more efficient at discovering large amounts of new mirnas than previous techniques utilizing forward genetics. In recent years new techniques have been created to discover mirnas such as the immunoprecipitation of Ago2 proteins, which are often bound to mirnas (189). Not all mirnas are involved in the destruction of their mrna targets. The first mirna, lin-4, is in fact a transcriptional repressor that down-regulates protein levels but does not decrease levels of its corresponding mrna (145). mirnas often bind to the 3 UTR of mrnas but have also been found to bind to the 5 untranslated region (5 UTR) (110), and even directly to genes by attaching to different promoter regions (152). Because of their importance in fine-tuning post-transcriptional gene expression, major dysregulation of important mirnas leads to negative effects on cells that manifest in diseases such as cancer (19), heart disease (190), and diabetes (101). Today, after over 10,000 papers have been written on the subject, researchers have discovered over 1000 human-specific mirnas and many more in other species (66), each regulating hundreds of potential gene targets (55) mirna biogenesis The transcription and processing of mirna into its mature form has been thoroughly investigated, but there are still new regulatory pathways and exceptions being discovered every year. mirna genes are located on each chromosome except for the Y chromosome in Homo sapiens, and often come in clusters of independent mirna genes (98). A large 6
17 percentage of mirna genes are found within already defined transcriptional units (167), located within gene introns or exons (116). For example, mirna genes can be located within the intronic regions of protein-coding genes (165) or non-coding genes (117). They can also be located in the intergenic regions between canonical protein-coding genes (215). The biogenesis of mirnas was originally viewed as a linear pathway that was universal for all micrornas (see Figure 1). With new research it is now understood that there are many different regulatory elements that control different parts of the process, and that mirnas can be processed in unique ways (202). mirna biogenesis always begins in the nucleus with the creation of long primary mirna (pri-mirna) transcript, often thousands of base pairs in length. Within this large transcript are multiple smaller hairpin loops containing a hairpin stem of about 33 base pairs that ends in a terminal loop (180). The strand is transcribed either by RNA Polymerase II (18) (116) or RNA Polymerase III (12). RNA polymerase II transcripts are usually capped at their 5 end with 7-methyl guanosine, and joined with a poly-adenosine tail at their 3 end (116). Polymerases choose their mirnas according to sequence, promoter or the genome context surrounding them, such as when RNA polymerase III transcribes mirnas surrounded by many Alu repeats (12). 7
18 Figure 1: Standard view of the linear progression in mirna biogenesis. Recent research has found many different mirna-specific pathways and regulatory elements that significantly complicate the process. Diagram adapted from Winter et al (202) 8
19 Figure 1: Standard view of the linear progression in mirna biogenesis. Figure adapted from Winter et al (202). The mirna gene is transcribed by RNA Polymerase II or III (RNA Pol II/III) into its primary-mirna (pri-mirna) form. This is then cleaved by the microprocessor complex, composed of the enzyme Drosha and its partner DNA-binding protein DiGeorge critical region 8 (DGCR8), into its precursor mirna (pre-mirna) form. This molecule is then exported from the nucleus by Exportin-5, where it is then cleaved into its mature mirna duplex form by the enzyme Dicer and its partner Tar RNA binding protein (TRBP). The mature mirna guide strand is attached to the Argonaute 2 (Ago2) protein, which joins with other associated proteins to form the RNAinduced silencing complex (RISC). The RISC uses the mature mirna to guide its effects by specific 3 UTR binding, and this binding is followed by mrna translational repression and degradation. 9
20 After edits, pri-mirnas are then transformed into precursor mirna (pre-mirna) transcripts by the ribonuclease (RNase) III enzyme Drosha (RNASEN) and the DNAbinding protein DiGeorge critical region 8 (DGCR8) (114). These two proteins form what is called the Drosha/DGCR8 microprocessor complex, which is necessary for mirna processing in all species (65). In this complex, DGCR8 binds to the pri-mirna transcript like a molecular anchor and makes sure the microprocessor is in the exact location necessary for correct cleavage by Drosha (72). Once the complex is bound, Drosha proceeds to cleave both the 5 and 3 sides of the hairpin stem exactly 11 base pairs above the junction where the stem and single stranded RNA meet. Because of the helical structure of dsrna, this results in a 2 nucleotide 3 overhang (71). The end result of this cleavage is a nucleotide pre-mirna transcript. The next step after pre-mirna creation is their export from the nucleus by the protein exportin-5, which is a member of the karyopherin β family of nuclear export proteins (214). This protein family helps shuttle almost all RNA molecules (with the exception of mrnas) out of the nucleus through nuclear pores. To successfully export pre-mirnas, exportin-5 must form a complex with Ran guanosine triphosphate (Ran-GTP), bind to the pre-mirna transcript and then undergo cytoplasmic hydrolysis of Ran-GTP to Ran guanosine diphosphate (Ran-GDP) to induce cargo (eg. mirna) release (131). This binding is highly specific to pre-mirnas as exportin-5 recognizes the entire hairpin stem and 3 overhang, with any errors such as loss of 3 overhang or existence of a 5 overhang being significantly inhibitory to binding (217). Loss of exportin-5 by sirna transfection causes a drop of 40-60% of mature mirnas in the cytoplasm, indicating the possibility of alternate 10
21 routes for pre-mirna export (131), or alternatively that that low levels of exportin-5 may be sufficient to maintain some level of pre-mirna export. Once the pre-mirnas have been shuttled into the cytoplasm they are then processed into their final mature form by the RISC loading complex (RLC), which consists of four central proteins. There are two double-stranded transactivation-responsive RNA-binding proteins known as PACT (protein activator of PKR) (115) and TRBP (Tar RNA binding protein) (69), along with the core Argonaute-2 (Ago2) protein and the RNase III endonuclease Dicer protein (63), which transforms the pre-mirna into its final form. The initial loading of pre-mirna into the RLC is accomplished in two steps, physical association and activation. The second step is rate-limiting and governed by the thermodynamic stability of the pre-mirna (67). Once loaded the pre-mirna is ready for processing by Dicer. Dicer cuts off the hairpin loop at the end of the molecule and creates an approximately 22 nucleotide duplex with 2 nucleotide 3 overhangs on either end (108). This is the new mature mirna duplex. Dicer is crucial to the mirna biogenesis pathway, as without it mature mirna levels are significantly down-regulated (83) and lack of Dicer leads to early embryonic lethality in mice (11). However, Dicer-independent pathways have been found that use the Ago proteins catalytic core to cleave the pre-mirna, such as in the case of mir-451 (26). Once cleaved, all the proteins disassociate from the RLC except for Ago2, which stays bound to the mirna duplex (120). Recent crystal structures of Ago2 bound to mir-21 have shown that the binding of the mature mirna to the Ago2 enzyme is remarkably stable and helps the complex exist for long periods of time (47). The mirna duplex, bound to Ago2, is unwound by a variety of helicases so that the functional mirna guide strand, 11
22 which will attach to the mrna, is separated from the non-functional passenger strand, which will be degraded. The guide strand is determined by whatever strand has the lower thermodynamic stability at the 5 terminus (97). The initiator of duplex unwinding is the N- domain of the Ago2 protein (104). Helicases involved with this process include RNA helicase A (RHA) (166) and p68 (171). It is possible that the various helicases involved in mirna unwinding represents another level of differential regulation specific to the certain mirna families. Once the mature, cleaved guide strand is attached to the Ago2 protein it is now ready to bind to its targets (64) Mechanisms of gene regulation by mirna mirnas are non-coding RNA transcripts whose purpose is to bind to specific sequences in mrna and DNA promoters. They are part of the mirna-induced silencing complex (mirisc) and are only involved in the targeting aspect of mirna down-regulation. The canonical function of the mature mirisc complex is to bind the 3 UTR region of a target mrna using a 5-7-nt seed sequence within the mature mirna strand (110). Once bound it can inhibit translation or degrade the mrna molecule. The end results of mirisc binding to its target mrna are accomplished by its main protein components, the Argonaute proteins (AGO1 through 4) (43) and Argonaute-bound GW182 (158), along with other proteins. Once the RLC disassembles the mirna duplex, the new mirna guide strand is attached to an Ago protein, which is then joined by the GW182 protein (51). In humans Ago2 is essential for the silencing effect of the mirisc complex (175). Ago2 was the first of the family known to associate with sirnas such as mirnas (70) and it controls the catalytic cleavage activity of the complex in mammalian cells (120). GW182 proteins are the 12
23 other main class of mirisc proteins. They are associated with processing bodies (P-bodies) inside the cytoplasm and were first shown in 2005 to be involved in mirna silencing (121). Since then they have proven crucial for mirisc silencing effects, as inhibition of the Ago- GW182 interaction caused significant repression of mirisc silencing (212). GW182 is also known to associate with other proteins that can act as modules that alter mirisc effects, such as the E3 ubiquitin ligase identified by differential display (EDD) protein (184) and poly(a)-binding protein (PABP) (56). The two main mechanisms of mirisc silencing are translational repression and mrna degradation (see Figure 2). Recent studies in vivo using fruitfly and zebrafish models indicate that this is usually a two step process, with repression of the mrna occurring first followed by degradation (41) (7). 13
24 Figure 2: Standard view of mirisc-related translational repression and mrna degradation by deadenylation and decapping. Diagram adapted from Fabian et al (51) 14
25 Figure 2: Standard view of mirisc-related translational repression and mrna degradation by deadenylation and decapping. Figure adapted from Fabian et al (51). The mirna-associated RNA-induced silencing complex (mirisc) down-regulates mrna activity by both translational repression and mrna decay mechanisms. The mirisc is composed of the Argonaute 2 (Ago2) protein and GW182 protein, as well as additional proteins such as CCR4-NOT, PAN2-PAN3 and Poly(A) binding protein (PABP). In mirna-mediated translational repression, the mirisc induces both an initiation block by interfering with 40S and 60S ribosomal subunits, along with a post initiation block on the translational machinery. In mirna-mediated mrna decay, the DCP1-DCP2 complex is directed to the decapping of the mrna. The CCR4- NOT and PAN2-PAN3 complexes are directed to deadenylation of the poly(a) tail. After the mrna has been stripped it is then degraded by RNA nucleases. 15
26 To ensure translational repression the mirisc often interferes with cap-dependent translation in the early initiation steps, such as eukaryotic initiation factor 4E (eif4e)-cap recognition (80), along with blocking the recruitment and binding of ribosomal subunits such as 60S (193). In mrna degradation, the CCR4-CAF1-NOT and PAN2-PAN3 deadenylase complexes attach to the mirisc through GW182 and deadenylate the poly(a) tail of the mrna (15). In addition to loss of its poly(a)-tail, the mrna also loses its 5 -cap because of DCP1-DCP2 action (158) (8) and is then degraded completely by the Xrn1 5-3 exonuclease (86). mirna-mrna complexes have been proven to specifically localize to nearby P-bodies (122) and most of the actions taken by the mirisc complex happen in the P-bodies as it contains many RISC-related factors such as deadenylase proteins, cap degradation proteins and the Xrn1 5-3 exonuclease (86). Overall in mammalian cell cultures it appears that mirna-induced mrna degradation plays a much larger role than inhibition of translation, but in real organisms the situation could be quite different (68) (81). Once their role is complete the mirnas themselves are degraded by Xrn1, Xrn2, the exosome or other nucleases, although no studies have proven conclusively that there is one central pathway (86). The entire mirisc silencing process may be modified by a number of additional proteins that may bind to either Ago or GW182, or bind directly on or beside the mrna binding region. For example, Dead end 1 (Dnd1) protein binds to mirna binding regions in the mrna, blocking the mirisc complex from attaching to its target (94). New findings suggest that there are other modes of mirna action besides the canonical 3 UTR targeting and subsequent inhibition and degradation of mrna. mirnas have been shown to target the 5 UTR and open-reading frame (ORF) regions in mrna, in addition to the 3 UTR. This regulation acts in a similar mechanistic fashion to 3 UTR 16
27 binding, for example when mir-2 binding to either the 5 UTR or ORF causes mrna deadenylation and cap degradation (141). However, compared with 3 UTR binding the overall effect on mrna and protein levels is significantly weaker, which helps explain why the normal 3 UTR sites are favoured by mirnas in nature. Another non-canonical mirna activity is their binding to genes directly, often on their promoters. The first study to discover this effect found a mir-373 target site directly inside the promoter regions of both E-cadherin and cold-shock domain-containing protein 2 (CSDC2) genes (152). Elevated mir-373 levels induced expression of both proteins, which was driven by mature mir-373 binding to the promoters of both genes. To bind to DNA, it is necessary for mirnas to return to the nucleus where they were created. mirisc complexes are able to travel back into the nucleus using proteins such as Importin-8 (199). Overall, mirnas attached to the RISC complex can accomplish multiple effects inside the cell. Even when miriscs are set on one course of action, such as translational repression, they can be modified by additional factors to regulate their function. In the future there will likely be new discoveries of more RISC-binding proteins and even entirely new modes of action for mirnas and the mirisc complex. 1.4 Role of mirnas in disease mirnas in disease Since their discovery two decades ago it has been shown that mirnas regulate many biological processes within cells as a result of their ability to target hundreds of different mrnas. These include crucial processes such as development (100), the cell cycle (22), and apoptosis (87). Thus in many diseases the alteration of mirna s normal expression patterns 17
28 or their ability to target certain mrnas can contribute to disease development and progression. Altered mirna levels because of gene mutation or dysfunctional biogenesis are found in diseases such as heart disease (206), diabetes (127) and cancer (192). Expression levels can be altered by affecting the mirna gene itself, such as modifying the methylation status of its promoter to knock-down gene expression (73). mirna levels can also be altered by interference in their normal biogenesis pathway, such as when exportin-5, the crucial premirna transporter, is down-regulated in cancer cells. Loss of exportin-5 leads to the downregulation of the many mirnas that use this transporter (137). Cancer is an informative example of the effect of altered mirna expression patterns because of the high levels of mutations and chromosomal damage that tumour cells undergo. Certain cancers benefit from shutting off expression of tumour suppressor mirnas that help control cell proliferation, apoptosis and DNA repair (144). Alternatively, cancers can also benefit from overexpression of certain mirnas because they are oncogenes that contribute to tumourigenic phenotypes such as uncontrolled cell growth and apoptosis evasion (173). mirnas may also affect disease when crucial mrnas escape their normal regulation through mutation or modification of their structure that stops proper mirna binding from occurring (61). One example is alteration of a target mrna s 3 UTR, either by a change in mirna seed site or certain physical changes. As previously discussed in section 1.22, the 3 UTR is the central site for effective mirisc silencing. If something impedes a mirna s ability to bind to the 3 UTR, such as loss of a mirna s normal seed site, then it can reduce regulation of the mrna. Alternatively, a mutation in the 3 UTR can cause the creation of new mirna seed sites that lead to aberrant mirisc silencing. One example of 18
29 3 UTR alteration is in coronary heart disease (CHD). The single nucleotide polymorphism (SNP) rs in the protein 5,10-methylenetetrahydrofolate reductase (MTHFR) caused hsa-mir-149 to bind to the mutated MTHFR 3 UTR when it normally does not (206). This caused a decrease in MTHFR protein levels and an increased risk of CHD in a Chinese Han population that contained this SNP. In addition to changing the seed site, other examples of 3 UTR change include the loss of 3 UTR length or structure, such as shortening of the region. The first study to discover this shortening effect found that loss of 3 UTR length corresponded with higher cell proliferation levels, and also that a smaller 3 UTR meant more protein synthesis, possibly because of decreased mirna binding sites and thus less regulation (172). Overall these are just a few of the most prominent ways that dysregulation of mirna expression and targets is involved in many disease states mirnas in cancer Every major type of cancer has been shown to have some degree of mirna dysregulation, which can affect crucial cell processes such as growth receptor pathway signaling or apoptosis. In 2002 the first study demonstrating that mirnas could be involved in cancer found that a small region of chromosome 13q14, which contained the mir15/16 genes, was deleted in over 65% of chronic lymphocytic leukemias (CLL) (20). Intriguingly this exact region was also lost in other cancers such as prostate (42), indicating that mir-15/16 deletion could play a role in multiple tumour types. In 2004 the same group then investigated all 186 human mirnas known at the time and how their genetic locations matched with fragile sites related to human cancer. They found that many of the mirnas corresponded with regularly deleted or mutated genomic areas in cancers such as lung, breast and colon (21). In 2003 one 19
30 of the first published studies to look for a direct link between mirnas and cancer investigated the expression levels of mirnas in colorectal cancer. It was discovered that mir-143 and mir-145 levels were down-regulated in neoplastic colorectal tissue as compared with normal tissue (138). One of the first papers on mirna regulation of a specific target associated with tumourigenesis showed that mir-15/16 repressed the apoptosis-related oncogene BCL2 in CLL (28), which helped explain why mir-15/16 are consistently deleted in that disease. This was one of the first examples of mirnas acting to suppress tumour characteristics. In 2005 one of the first mirna oncogenes was found in the study of mir-155 expression in human B cell lymphomas. Significantly high copy numbers of mir-155 were found in this cancer compared with normal circulating B cells (46), and later mir-155 was shown to increase lymphoma motility by down-regulation of certain targets (35). The first paper to examine global expression of every mirna across all cancers was published by Lu et al. in 2005 (128). They found that almost every mirna known at the time was differentially expressed in tumours versus normal tissue. They also determined that mirna expression patterns could provide a useful tool for classifying tumours and that the global levels of mirnas are down-regulated in cancer. In 2006 Volinia et al. undertook the first in depth analysis of mirna expression in six solid tumour types: lung, breast, stomach, prostate, colon and pancreatic. They found 26 over-expressed and 17 under-expressed mirnas in these tumour types and observed that the spectrum of expressed mirnas was very different in solid tumours compared with normal tissue (192). They also examined the levels of predicted gene targets such as Retinoblastoma (RB) and Tumour-growth factor-b II receptor (TGFBRII) and found that they were affected by mirna expression. After these 20
31 studies were published the cancer mirna field grew larger as researchers investigated the function of mirnas that had already been shown to play a part in cancer, discovered entirely new cancer-related mirnas and examined cancer-specific mirna expression levels more closely. mirnas have since been found to play important roles in all cancer types and areas of tumourigenesis. For example, important growth factor pathway proteins such as EGFR and Ras are affected by mirs such as mir-542-5p (210) and let-7a (143), respectively. Cell cycle regulation is affected by dysregulation of mir-449 in gastric cancer (13). Apoptotic pathways can be subverted by the aforementioned mir-15/16 deletion and the subsequent rise in anti-apoptotic Bcl2 protein (28). Reduction of mir-1 and mir-200 leads to increased EMT in prostate cancer (123), and loss of mir-101 in glioblastoma leads to increased angiogenesis (181). One of the main challenges facing researchers today is how to integrate all the new cancer mirna findings into a more complete picture of cancerspecific mirna dysregulation. There are many ways in which tumourigenesis can affect the expression levels and basic function of mirnas. As previously described, deletion of a specific chromosomal area (13q14) corresponded to loss of tumour-suppressors mir-15 and mir-16 in CLL (20). Following the reduction of the levels of these mirnas, the normally down-regulated expression levels of BCL2 were able to rise and protect tumour cells from apoptosis. In addition to deletion, many oncogenic mirnas are amplified in the cancer genome. For example, gene amplification of mir-26a was discovered in glioblastomas, which led to overexpression of the mirna and corresponding loss of its target, the tumour-suppressor PTEN (82). In some cases mirna genes are switched on or off according to cancer-related processes such as aberrant promoter methylation. It was found in the colorectal cancer cell 21
32 line HCT-116 that over 10% of the mirnas were down-regulated by DNA methylation activity against their promoters (73). Another example of mrna alteration in cancer is the loss of 3 UTR length in specific, often oncogenic mrnas. This leads to increased stability of mrnas and up to 10-fold increase in protein levels because of decreased regulation by mirnas (135). mirnas represent exciting new therapeutic options in the treatment of cancer. mirna profiles in different tumours could lead to new prognostic indicators of a cancer s stage, response to treatment and likelihood of metastasis by examining samples taken from biopsies or surgery. The use of mirnas as biomarkers in patient serum samples is also advancing as certain mirna levels are found to be correlated with patient outcomes (33). mirnas also represent potential therapeutic treatments, with positive attributes such as their ability to target many genes and pathways simultaneously and the fact that they are endogenous factors not recognized as foreign agents in human cells, unlike many artificial drugs (59). Limitations include effective targeted delivery of the synthetic mirna reagents to tumours and potential off-target effects in non-cancer cells. Overall, increasing our understanding of how mirnas are dysregulated in cancer will help determine how the disease progresses from initiation to metastasis. It will also lead to the identification of important novel therapeutic targets, predictive biomarkers and prognostic indicators that are able to identify important cancer characteristics and patient status mirnas in prostate cancer mirnas are involved in the tumourogenesis of prostate cancer and numerous studies have shown that mirna dysregulation occurs in the majority of prostate tumours 22
33 (176) (62) (74). In 2005 the first study to link mirnas and prostate cancer showed that prostate tumour samples exhibited a different global mirna expression pattern than normal prostate tissue (128). In 2006 the previously mentioned study by Volinia et al. examined the expression levels of mirnas in 6 solid tumours, including prostate, and found greatly altered patterns in tumour samples versus normal prostate tissue (192). One of the first mirnas to be specifically investigated in relation to prostate cancer was mir-125b, a functional homologue to lin-4. It was found that mir-125b was elevated in most prostate cancer samples, including both patient and cell line derived, and its down-regulation by specific hairpin inhibitors caused reduced growth (177). Subsequently, mir-125b was found to target Bak1, a Bcl2 family member and a pro-apoptotic regulator, which would explain why its reduced levels would facilitate prostate cancer growth by reducing apoptosis in tumour cells. In 2010 the first comprehensive, prostate cancer specific mirna study examined the difference in mirna expression levels between benign peripheral zone tissue and prostate cancer tissue from radical prostatectomies. They found widespread deregulation of most examined mirnas and altered expression of many novel mirnas (174). Today, many dysregulated mirnas have been identified that contribute to the prostate cancer phenotype by affecting crucial growth regulatory targets such as K-Ras (205), AR (178) and cyclin D1 (5). For example, mir-21 is a well-known prostate mirna that acts as an oncogene. It is over-expressed in numerous cancers such as prostate (161), breast (31), and lung (58), and it has been shown to target tumour suppressor genes such as PTEN in prostate cancer (218). Another example is the tumour-suppressing mir-143, which is down-regulated in many cancers including prostate and has been shown to regulate genes that promote proliferation and migration, such as K-Ras and cyclind1 (205). Experiments where mir
34 is artificially increased in PC3 prostate cancer cells showed decreased invasion and migration in vitro and decreased proliferation and bone metastasis in vivo (29). Overall, the study of prostate cancer mirnas is an exciting area of research that is still in its infancy. There is still much to be learned in order to fully understand how mirna dysregulation affects various prostate tumour phenotypes and how best to use this knowledge to detect and treat prostate cancer. 1.5 The role of mir-105 in prostate cancer mir-105 location and structure Hsa-miR-105 is one of many poorly understood and undescribed mirnas that exist. mir-105 was first discovered in 2002 by Mourelatos et al. (142), when they examined molecules associated with different ribonucleoprotein complexes (RNPs). mir-105 is located on the X-chromosome (Xq28), inside the Intron 1 region of the gammaaminobutyric acid (GABA) A receptor alpha 3 subunit (GABRA3) gene (106). Hsa-miR-767 also exists in this location (10). This receptor is involved in normal GABA neurotransmitter functioning and is associated with neurological diseases such as bipolar affective disorder (134). The sequence of mature mir-105 is 5 -UCAAAUGCUCAGACUCCUGUGGU-3 and is 23 nucleotides long (see Figure 3). The mature mir-105 strand targets hundreds of possible mrna 3 UTRs according to the mirwalk mirna target prediction program ( (45). 24
35 Figure 3: Pre-miR and mature mir-105 sequences. Figure adapted from Benakanakere et al (9) 25
36 Figure 3: Pre-miR and mature mir-105 sequences. Figure adapted from Benakanakere et al (10). The standard stem loop structure of the pre-mirna can be seen above the mature mirna strand, which shows the 23 nucleotide sequence of the mature single-stranded mir-105 guide strand. 26
37 1.5.2 Preliminary findings for mir-105 The only paper published to date which has directly studied mir-105 examined its role in Toll-like Receptor 2 (TLR2) regulation (9). The authors found that mir-105 directly targeted the TLR2 mrna and caused a decrease in its protein levels in human gingival keratinocytes. Their conclusion was that mir-105 is involved in the innate immune response in certain cells. The current literature gives some clues as to mir-105 s possible role in cancer. Research by Schmittgen et al. found that mir-105 belongs to a group of premirnas which are prevented from leaving the nucleus in pancreatic, colorectal, cervical and promyelocytic leukemia cancer cell lines after it is processed by Drosha/DGCR8 into its premirna form (109). More recently, a large meta-analysis of mirna expression datasets indicated that down-regulation of mir-105 was common in hepatocellular carcinomas (195). A paper by Mlyncek et al. found that mir-105 may influence proliferation of primary ovarian granulosa cells as its over-expression was found to alter proliferative marker expression levels, including PCNA and Cyclin B1 (179). PCNA is involved with the S phase of the cell cycle, and cyclin B1 is involved in forcing the cell into mitosis during the G2 phase. Since mir-105 activity caused both an increase in PCNA levels and a decrease in Cyclin B1 levels, its function may be dependent on cell cycle timing. mir-105 was also of interest to us based on previous experiments in our lab looking into the effect of the extracellular matrix on mirna levels. Given that previous research suggested mir-105 possibly alters cell proliferation and is down-regulated in multiple cancer cell lines, along with preliminary data from our laboratory suggesting it was down-regulated in metastatic prostate tumour cell lines as compared to normal prostate epithelial cells, we embarked on an investigation to determine the role of mir-105 in metastatic prostate cancer cell lines. 27
38 1.6 Summary, rationale and hypothesis Recent research has highlighted the important role of mirnas in modulating the tumourigenic phenotype, especially that of prostate cancer. Normal mirna expression is crucial for healthy cell function while aberrant mirna expression leads to cancer related effects such as uninhibited proliferation, increased invasion and inhibition of apoptosis. Many mirnas have been shown to play a role in the development and progression of prostate cancer, but mirnas that play a significant role in mediating the growth and invasion of aggressive prostate tumour cells have not been thoroughly examined. Previously, our lab performed a mirna microarray to compare mirna expression levels in normal prostate epithelial cells (PrEC) versus those of two well characterized metastatic prostate tumour lines (PC3 and DU145). Although a number of novel mirnas showed altered expression levels, we decided to characterize the role of certain differentially expressed mirnas which had not previously been indicated in prostate tumour progression. Therefore we began to examine the role of hsa-mir-105, one of these mirnas. RT-qPCR validation showed that mir-105 had decreased expression in prostate tumour cell lines as compared to PrEC. It has also been shown that mir-105 plays a role in cellular proliferation (179) and levels of mature mir-105 are inhibited in other cancer types (109). The fact that it is involved in crucial pathways such as cell proliferation indicated that its loss may lead to dysregulation of these pathways and a subsequent increase in tumourigenic phenotypes such as uninhibited cell proliferation and increased invasion. Thus it is possible that this mirna may act like other tumour-suppressing mirnas. The experiments presented herein are designed to test the hypothesis: MicroRNA-105 inhibits prostate tumour growth. 28
39 1.7 Approach Objective 1: To validate microarray findings indicating that certain mirnas are dysregulated in metastatic prostate tumour cells compared with normal prostate epithelial cells. RNA was collected from PC3 and DU145 cell lines and compared with RNA from PrEC cells by mirna microarray to yield an original list of putative differentially regulated mirnas. The mirnas that showed altered expression patterns were validated by RT-qPCR to confirm their differential expression levels in these cell lines Objective 2: To evaluate the effect of differentially regulated mirnas, specifically mir-105, on prostate cancer growth and invasion in vitro and in vivo. The efficacy of mir-105 mimic and hairpin constructs to modulate cellular mir-105 levels were tested in PC3 and DU145 cells. The in vitro effects of mir-105 over-expression on PC3 and DU145 cell viability, apoptosis, anchorage-independent growth and cell migration and invasion were assessed. The effects of mir-105 over-expression on subcutaneous prostate tumour growth were assessed using xenograft models in mice Objective 3: To identify cellular targets of mir-105 that contribute to its effects on tumourigenesis. mir-105 was over-expressed in PC3 cells using specific mimic constructs and cellular mrna expression was compared to cells treated with control mimic using a Human Gene microarray. Changes in expression of the putative novel targets identified in the array were validated at the mrna level by RT-qPCR, and protein level by the western immunoblot assay. 29
40 2: MATERIALS AND METHODS 2.1 Cells and Media PC3 and DU145 human prostate carcinoma and A549 human lung carcinoma cells were obtained from ATCC (Manassas, VA). These cells were grown in Dulbecco s Modified Eagle Medium (DMEM, Mediatech Inc, Manassas, VA) supplemented with 10% HyClone fetal bovine serum (FBS, Fisher Scientific Co., Toronto, ON). PrEC (Normal Prostate Epithelial Cells) were obtained from Lonza (Walkersville, MD), and were grown in PrEGM (Lonza, Walkersville, MD) for expansion. PrEC were only used between passages All cells were grown at 37 o C in 5% CO 2 in a HERAcell (Kendro Laboratory Products, Newtown, CT) incubator. The standard protocol for collecting cells was to wash twice with warm sterile PBS (Dulbecco s Phosphate Buffered Saline, Mediatech Inc., Manassas, VA) and trypsinise the cells for approximately 6 minutes. The cells were collected into 15 ml conical tubes then centrifuged at 1200 RPM for 5 minutes. The cell pellet was re-suspended in the appropriate amount of media then placed in 10 cm (BD Falcon, Franklin Lakes, NJ), 6 cm or 6 well / 24 well tissue culture plates (Corning Incorporated, Corning NY). Cell counting was performed in triplicate using a Bright-Line hemacytometer (Hausser Scientific, Horsham, PA). Cells were seeded in numbers corresponding to basic passaging needs or specific experimental designs. µl 30
41 2.2 Transfections Cells were seeded at ~40-50% density, or approximately 5x10 4 cells/ml, to achieve optimal distribution on 6 or 10 cm plates. Following adherence overnight, cells were transfected with 2, 10, 50 or 100 nm solutions of mir-105 specific mimics (based on the mature mir-105 sequence: 5 -UCAAAUGCUCAGACUCCUGUGGU-3 ), or their respective cel-mir-67 (based on the mature cel-mir-67 sequence: 5 - UCACAACCUCCUAGAAAGAGUAGA-3 ) mimic controls (all from Dharmacon, Lafayette, CO) using Oligofectamine (Invitrogen, Carlsbad, CA) in Opti-MEM (Invitrogen, Carlsbad, CA). Initially, a solution of 19% Oligofectamine and 81% Opti- MEM was mixed and left at room temperature for 5 minutes. This solution was added to Opti-MEM containing the appropriate concentration of mimic or hairpin reagents and left to incubate for minutes at room temperature. The seeded plates were washed with Opti-MEM, and a small volume of Opti-MEM was placed on top of the cells. The reagent mixture was added to the plate, which was then left in the incubator. Four hours later a solution of DMEM + 30% FBS was added to the dish. Transfection efficiencies were monitored by examination of the fluorescence of the tagged control mirnas and by quantitative reverse transcription polymerase chain reaction (RT-qPCR) for specific mirnas as described below. 31
42 2.3 Microarrays Genechip Human Gene 1.0 ST and Genechip microrna microarrays (Affymetrix, Santa Clara, CA) were used for microarray analysis of samples. RNA samples in both cases were prepared according to the manufacturer s protocol using the mirneasy kit (Qiagen, Velencia, CA). Samples for the Genechip Human Gene 1.0 ST were prepared using the Whole-transcript Sense Target Labeling Assay (Affymetrix, Santa Clara, CA). Samples for the Genechip microrna microarrays were prepared with the Flashtag Biotin HSR kit (Genisphere, Hatfield, PA). Prepared labelled samples were sent to Stemcore Laboratories (Ottawa, ON) for microarray processing. Data was analyzed using the program FlexArray (McGill University, Montreal, QC). The Affymetrix website ( was used to create target lists for Human Gene microarray data. 2.4 Quantitative Reverse Transcription-Polymerase Chain Reaction (RTqPCR) For microrna RT-qPCR: Samples of total RNA were prepared from either human cancer cells or mouse tumour tissue using the mirneasy kit (Qiagen, Valencia, CA). Total RNA concentration was assessed using a Nanodrop Spectrophotometer (Thermo Scientific, Wilmington, DE), RNA samples were diluted to 5 ng / µl in RNAse/DNAse free water and RT was performed using the Taqman microrna Reverse Transcription Kit (Applied Biosystems, Carlsbad, CA) as per manufacturer s instructions, primed from specific or endogenous control mirna primers (TaqMan primer sets of 5x and 20x used: hsa-mir-103: Cat. # , RNU24: Cat. # , hsa-mir-105: Cat. # ). For each RT 32
43 sample: 13 µl of master mix (MM) was created from µl 100mM dntp, 1.5 µl Reverse Transcriptase, 1.5 µl 10x RT Buffer, 0.19 µl RNAse inhibitor, 2.0 µl of each 5x TaqMan microrna Assay (Applied Biosystems, Carlsbad, CA) and the remaining volume with RNAse-free H 2 O. The MM was gently mixed, centrifuged and placed on ice. Subsequently, 13 µl of MM was combined with 2 µl of the diluted RNA to make a total of 15 µl reaction volume. These samples were mixed, centrifuged and placed in the PCR machine for amplification. The mirna RT program was then used for template amplification (Hold: 16 o C for 30 minutes, Hold: 42 o C for 30 minutes, Hold: 85 o C for 5 minutes, Hold: 4 o C indefinitely) on a GeneAmp PCR System 9700 (Applied Biosystems, Carlsbad, CA). For the qpcr analysis a new master mix (qmm) was created. For this, 9 µl of qmm was created from 5 µl TaqMan 2x PCR Master Mix (Roche, Branchburg, NJ), 3.5 µl ddh 2 O, and 0.5 µl 20x TaqMan microrna Assay (Applied Biosystems, Carlsbad, CA). This 9 µl of qmm was then mixed with 1 µl of the RT solution to form 10 µl in each well of a MicroAmp Fast Optical 96-well Reaction Plate with Barcode (Applied Biosystems, Carlsbad, CA). After the plate was loaded with solution, it was centrifuged at 500 RPM for 5 minutes at 4 o C, RT mirna templates, were then specifically amplified by qpcr using TaqMan primers (see above) in a 7500 Fast Real-Time PCR system (Applied Biosystems, Carlsbad, CA), using the following standard machine amplification conditions: Holding stages: 50 o C for 20 seconds, 95 o C for 10 minutes, Cycling stage (40 cycles): 95 o C for 15 seconds, 60 o C for 1 minute. Results were normalized to the levels of mir-103 or RNU24 and fold differences calculated using the integrated Applied Biosciences program. 33
44 For mrna qpcr: For each reaction with RNA, 1 ug total isolated RNA, 1 µl of a 50uM dilution of dn6 random primers and 1 µl of 10mM dntp mix (both from Invitrogen, Carlsbad, CA) were added to a nuclease-free microcentrifuge tube. Sterile distilled water was added to make the final volume in each tube 12 µl. The mixture was heated to 65 o C for 5 minutes then quickly chilled on ice. The contents were collected by brief centrifugation and further reagents were added: 4 µl of 5x First Strand buffer, 2 µl 0.1 M DTT and 1 µl RNaseOUT Recombinant Ribonuclease Inhibitor (all from Invitrogen, Carlsbad, CA). The tubes were gently mixed and incubated at 37 o C for 2 minutes. Following this, 1 µl of M- MLV Reverse Transcriptase (Invitrogen, Carlsbad, CA) was added, and the solution was gently mixed and incubated at room temperature for 10 minutes. The tubes were then incubated for 50 minutes at 37 o C and the reaction was then inactivated by heating the tubes at 70 o C for 15 minutes. For the quantitative PCR mix, each reaction in 10 µl total consisted of: 5.0 µl RT 2 Fast SYBR Green/Rox qpcr Master Mix (SABiosciences, Frederick, MD), 3.6 µl ddh2o, 1.0 µl from the previously made template cdna and 0.4 µl of custom gene-specific 10uM PCR primer pair stock (all ordered from Invitrogen, Carlsbad, CA). For quantitative PCR, specific templates were amplified using the following primer pairs: β-actin, Forward: 5 -GGGCATGGGTCAGAAGGAT-3, Reverse: 5 -GTGGCCATCTCTTGCTCGA-3 Cdk6, Forward: 5 -TGATCAACTAGGAAAAATCTTGGAC-3 Reverse: 5 -GGCAACATCTCTAGGCCAGT-3 34
45 The RT 2 Fast SYBR Green/Rox qpcr Master Mix (SABiosciences, Frederick, MD) was used for amplification in an ABI 7500 FAST Real Time PCR System under the following standard machine conditions: Holding stages: 50 o C for 20 seconds, 95 o C for 10 minutes, Cycling stage (40 cycles): 95 o C for 15 seconds, 60 o C for 1 minute, Melt curve stage in continuous mode: 95 o C for 15 seconds, 60 o C for 1 minute, 95 o C for 30 seconds, 60 o C for 15 seconds. The results were analyzed using the integrated Applied Biosciences program, and levels of specific targets were normalized to levels of β-actin for all cases. 2.5 MTT Assays Cells were transfected with mirna mimics or hairpin inhibitors as described in Section 1.2, and seeded 24 hours post-transfection into 96-well plates at 2500 cells per well. Each condition contained 8 wells for a total of 8 replicates. At 24 hour intervals, 42 µl of 5 mg/ml MTT (3-(4,5-dimethylthiazol-2-yl)-2,5-diphenyltetrazolium bromide) solution (Sigma, St.Louis, MO) was added to wells and incubated for a further 3-4 hours at 37 o C, followed by addition of 82 µl of lysis solution composed of 0.01 N HCl in 10% SDS (Fisher Scientific Co., Toronto, ON). The plate was then incubated overnight and read the following morning at 570nm in a Multiskan Ascent plate reader (MTX Lab Systems Inc., Vienna, VA). Absorbance readings were taken of plates which had been incubated for either 24, 48, 72 or 96 hours prior to addition of MTT reagent. 35
46 2.6 Apoptosis Assays Cells were transfected according to section 2.2. Twenty-four hours post-transfection, normal cell media was replaced by serum-free media. After 96 hours, cells were collected for either analysis by flow cytometry (FACS) or western blot. During cell collection the media in each well was collected along with two washes of warm sterile PBS and the trypsinized cell solution to ensure collection of any floating apoptotic cells. The collected cells were pelleted by 5 minutes of centrifugation at 1200 RPM. The pellet was washed twice with cold PBS and pelleted a final time. For FACS, cell pellets of non-adherent cells pooled with trypsinized adherent cells were washed with cold PBS and then permeabolized in 100% ethanol by incubation at -20 o C for a minimum of 24h. After incubation cells were again washed in PBS, followed by staining with propidium iodide (PI, Sigma, St.Louis, MO) solution (48 µg/ml propidium iodide, 40 µg/ml RNase A in PBS) followed by a 30 minute incubation at 4 o C. Samples were then analysed using a Coulter EPICS XL flow cytometer (Beckman-Coulter, Mississauga, ON) on the FL2 channel. The percentage of apoptotic cells was calculated by examining cells with less then 2N DNA content using FCS Express flow cytometry analysis software (De Novo Software, Los Angeles, CA). The proportion of cells in G1 and G2/M was determined using ModFit LT (Verity Software House, Topsham, ME). For western blot analysis, total protein lysates from harvested cells (adherent and non-adherent) were generated following lysis in Frack s lysis buffer as described in section Western blots were performed as described in Section 2.11, to visualize the cleavage of PARP as an indication of the degree of apoptosis occurring in treated cells. 36
47 2.7 Anchorage-independent 3D Growth Assays Cells were transfected as described in Section 1.2. Sterile ultrapure low-melting point agarose (Gibco-BRL, Rockville, MD) solutions (1% and 1.5%) were melted by heating in the microwave and placed overnight in a 37 o C water bath. The next day solutions of agar and media were created by combining the two at a 1:1 ratio in a pre-warmed TC bottle. For the base underlay, 1.5% LMP agarose was mixed with 2x αmem + 20% FBS to create a 0.75% agarose media solution. For the overlay 1.0% agarose was mixed with 2x αmem + 20% FBS to create a 0.5% agarose media solution. The solutions were stored in a water bath when not in use to prevent solidification. Initially, 400 µl of agarose base underlay was placed in each well of a 24 well tissue culture plate, and the base was allowed to solidify and was then stored in a 37 o C incubator until it was needed. Transfected cells were then trypsinized and counted according to Section 2.1. A total of 2.84 x 10 4 cells were placed in the first 15 ml conical tube, in a row of six, and then 5 ml of the 0.5% overlay agarose solution was mixed with the cells in the first tube. Subsequently 2.5ml of the cell-agarose solution was transferred to the next tube containing 2.5 ml of 0.5% agarose solution and mixed to create the next cell dilution. The solutions were then serially diluted down the row of tubes to create the required cell dilutions to plate 2000, 1000, 500, 250, 125 or 62.5 cells per well in 700µL total. This 700 µl was added to the solidified base underlays in triplicate for each dilution. The solutions were then cooled at room temperature for approximately 5-10 minutes until the overlay agarose mixture developed the desired viscous consistency. Plates were then incubated in a 37 o C incubator for 2 weeks. At the end of two weeks each well was assessed for number of colonies and their relative size. Plate identity was blinded by a labmate to eliminate bias. Representative photos were taken using an inverted light 37
48 microscope (Axiovert S100, Zeiss, Germany) with attached camera (Axiocam, Zeiss, Germany). 2.8 Scratch Wound Assays Cells were transfected as described in section 2.2. Subsequently, 24 hours posttransfection they were seeded into 6-well tissue culture plates at a density that would ensure cell confluency the next day. The following day the cell monolayers were scratched in a straight line using a sterile wounding tool, and four images per well were acquired with a digital camera (Nikon, Mississauga, ON) for time 0 hours. Additional photos were taken at 24 hours and 48 hours time-points using a 4x objective attached to an Eclipse TE2000-U microscope (Nikon). Wound diameters in images were measured and percentage wound closure was calculated as follows: [(wound diameter at 24 hours - wound diameter at 0 hours ) / wound diameter at 0 hours] x Invasion Assays Cells were transfected as described in Section 1.2. The next day, cells were trypsinized and collected according to Section 2.1. Matrigel-coated transwell invasion plates (BD Biocoat Growth-factor reduced Matrigel Invasion Chamber, PET membranes, Mississauga, ON) were thawed and prepared according to the manufacturer s instructions. In a 24 well tissue culture plate the invasion chambers were lowered into a solution of DMEM + 5% FBS, which acted as a chemoattractant. 5.0 x 10 4 transfected cells were suspended in serum-free DMEM and 500 µl, containing 2.5 x 10 4 cells, were placed on top of the Matrigel invasion chambers. The cells were left for 24 hours in a 37 o C incubator, which 38
49 allowed them to migrate through the Matrigel and 8 um pores towards the chemoattractant solution in the bottom well. After 24 hours the matrigel and all uninvaded cells were removed physically by dry and then moist sterile swabs. Invaded cells on the underside of the invasion filter were visualized following staining with Crystal Violet (0.5% crystal violet solution in 25% methanol). The invasion membranes were placed in the ice-cold Crystal Violet solution, gently washed in sterile water and then left to dry at room temperature in the tissue culture hood for at least 30 minutes. Invaded cells on the dried, stained membranes were then quantified using microscopic quantification at 10x magnification, across the entire membrane. Results are expressed as the mean of 2 wells, counting all the invaded cells per well, across three independent experiments In Vivo Tumour Xenograft Models Five-week old CD1 nude mice were purchased from Charles River Laboratories (Wilmington, MA) and housed in the Animal Care and Veterinary Services facility at the University of Ottawa. All protocols performed using mouse models were approved by the University of Ottawa Animal Care Committee and conformed to the guidelines set by the Animals for Research Act and the Canadian Council on Animal Care's Guide to the Care and Use of Experimental Animals, Vol. 1, 2nd edn., 1993) and meet standards of practice in the disciplines of laboratory animal science, laboratory animal veterinary medicine. For xenograft models, PC3 or DU145 cells were transfected as described in Section 2.2. Twenty-four hours post-transfection, 1x10 6 cells in 150 µl of sterile PBS were injected subcutaneously into both hind flanks of the mice. Tumour measurements were taken weekly following caliper measurements of visible subcutaneous tumours. Volume was calculated 39
50 using the formula [Volume = (width)^2 x (length/2)]. At necropsy, dissected tumours were measured in three dimensions to calculate tumour volume, wet tumour weight was obtained, and tumour, lung, liver and bone tissue samples were obtained and immediately fixed in 10% formalin solution (Sigma, St.Louis, MO) for histological analysis. After two weeks the lung, liver and tumour samples were sent to the Roger-Guindon Hall Pathology department (Ottawa, ON) to undergo hematoxylin and eosin (H&E) staining, along with creation of unstained slides of the tumour samples. After two weeks of formalin fixation the bone samples were treated with 10% EDTA in ph 8.0 PBS. This solution was changed every 4 days over the course of 3 weeks until the bones were sufficiently decalcified. The samples were then sent to the Pathology department for H&E staining. Tumour samples were taken and processed for RNA according to Section Antibodies and Western Immunoblotting Monoclonal mouse anti-β-actin from Sigma-Aldrich (St. Louis, MO) was used at a 1:10,000 dilution. Monoclonal rabbit anti-cdk6 (Novus Biologicals, Littleton, CO) was used at a 1:500 dilution. Polyclonal rabbit anti-parp (Cell Signaling, Danvers, MA) was used at a 1:000 dilution. Horse-radish peroxidase (HRP) conjugated secondary antibodies to mouse or rabbit IgG were obtained from Sigma and used at a 1:7000 dilution. Total protein from cells was generated following lysis in Frack s lysis buffer (10mM Tris-HCL, ph 7.4, 150mM NaCl, 5mM EDTA, 1% Triton X-100, ddh 2 O) on an ice-cold surface. Plates were scraped using rubber policemen and the lysis solution was transferred to a 1.5 ml tube and sonicated at 1.0 power in second bursts using a Sonicator
51 (Misonix, Newtown, CT). The homogenized samples were centrifuged for 30 minutes at 4 o C. Supernatants were stored at -20 o C. Total protein concentration was assessed using the BioRad Bradford (Hercules, CA) detection system according to the manufacturer s protocol and protein absorbance was measured at 595 nm. For western blot analysis, equal amounts of total protein per sample, normally 50 ug, were separated on a 10% SDS-PAGE gel (per 10 ml resolving gel: 4.0 ml ddh2o, % Acrylamide/Bis solution, 2.5 ml 1.5M Tris (ph 8.8), 0.1 ml 10% SDS, 0.1 ml 10% ammonium persulfate, ml TEMED. Per 5 ml stacking gel: 3.4 ml ddh2o, 0.83 ml Acrylamide/Bis solution, 0.63 ml 1.5M Tris (ph 8.8), 0.05 ml 10% SDS, 0.05 ml 10% ammonium persulfate, ml TEMED). The gels were placed in freshly made 1x Running Buffer (from 10x solution: 29g Tris base, 144 g Glycine, 10 g SDS, fill to 1L ddh 2 O ) and run at 100V. Proteins were then transferred to Hybond -C Extra nitrocellulose membranes (GE Healthcare, Piscataway, NJ) in 1x Transfer buffer (from 1x solution: 3g Tris base (12mM), 58g Glycine (96mM), 200mL methanol, fill to 1L ddh 2 O) with 20% methanol. The membranes were examined for successful transfers by staining for transferred protein using a Ponceau S stain (0.1% PonceauS (w/v) in 5% (v/v) acetic acid). For western blot detection, membranes were first washed with Tris-buffered saline with Tween (TBST containing 10nM Tris-HCL ph 8.0, 150mM NaCl, 0.05% Tween-20), and blocked using 5% skim milk powder in TBST (5% milk) or 5% bovine serum albumin (BSA) in TBST (5% BSA) for an hour. The membrane was then placed in a solution of diluted primary antibody in 5% milk or 5% BSA and was left to incubate in antibody with rocking overnight at 4 o C. The next day membranes were washed with TBST 3 times for 5 minutes each, and rabbit or mouse horse-radish peroxidase (HRP) conjugated secondary 41
52 antibodies were added, followed by incubation at room temperature for 1 hour. Membranes were again washed 5 times for 5 minutes each with TBST, and blots visualized using the Immobilon Western chemiluminescent HRP substrate (Millipore, Billerica, MA) and exposure of HyBlot CL autoradiography sheets (Denville Scientific, Metuchen, NJ). For reprobing of blots, membranes were stripped using Restore PLUS Western Blot stripping buffer (Thermo Scientific, Rockford, IL) and re-probed with additional antibodies Graphical and Statistical Analysis All data was plotted using GraphPad Prism software (version 3.02, GraphPad Software, San Diego, CA). Statistical differences for single comparison tests were determined using two-tailed unpaired t-test with a 95% confidence interval. For multiple comparisons parametric one-way ANOVA tests with a 95% confidence interval were used along with Tukey s post-test. Tests were performed using the statistical programs within the GraphPad Prism software (version 3.02, GraphPad Software, San Diego, CA). Results with a p-value of less than 0.05 were deemed significant. 42
53 3: RESULTS The status of mirnas in metastatic prostate cancer has not yet been fully determined. To this end, we performed a microrna microarray comparing the metastatic prostate cancer cell lines PC3 and DU145 with the normal prostate epithelial cell line PrEC. We discovered many mirnas that were differentially expressed in metastatic prostate cells. We then proceeded to validate targets of interest using RT-qPCR. One of those validated targets, hsamir-105, was investigated further for its effect on processes important for cancer progression. Cell growth was measured with cell viability assays and data was supplemented with the use of apoptosis assays to more closely define the reasons for differences in viability. Soft agarose assays were used to measure differences in anchorage-independent growth, and scratch wound assay and Matrigel invasion assay were used to measure cell migration and invasion, respectively. An in vivo xenograft experiment was performed in nude mice to measure the effect of mir-105 over-expression on subcutaneous tumour growth. Finally, potential mir-105 targets were determined by a human gene microarray, and novel targets were validated for differences in mrna and protein levels by RT-qPCR and western blot, respectively. 43
54 3.1 Differences in microrna expression between normal prostate epithelial cells and prostate cancer cell lines We were interested in determining whether various mirnas were differentially expressed in prostate tumour cells as compared to normal prostate epithelial cells. To this end, we isolated mirna from normal prostate epithelial cells (PrECs) and compared its profile to that isolated from PC3 and DU145 prostate cancer cell lines using Affymetrix chip profiling as described in section 2.3. A number of mirnas were found to be differentially expressed between the two tumour cell lines as compared to PrEC, including many mirnas already shown to be associated with prostate cancer (Tables 1 and 2 for PC3 and DU145 cells, respectively). The changes seen in many of these microarray mirnas corresponded to the changes in expression seen in other cancer studies, such as the down-regulation of mir- 205 (57) and mir-200c (102) and the up-regulation of mir-210 (77). As the roles for many of these mirnas have been previously well described, we were interested in looking at the mirnas on our list whose roles in cancer have not yet been defined. It should be noted that although this microarray revealed many interesting targets, it was only performed once, and thus could only be regarded as a guide to possible targets of interest. Validation of targets of interest was performed by RT-qPCR on PrEC, PC3 and DU145 RNA samples. Examples of validated targets such as mir-105 and mir-720 are shown in Figure 4 (4A and 4B respectively) and showed changes in expression that mirrored those observed in the microarray. We chose to look at a novel target, mir-105, which was found to be downregulated in both PC3 and DU145 cells as compared to PrEC cells. 44
55 Table 1: Differentially expressed mirnas in PC3 cells versus PrEC cells. Human mirnas that showed the greatest increase or decrease in expression in the microrna microarray comparing PC3 and PrEC cells are shown here. Table 2: Differentially expressed mirnas in DU145 cells versus PrEC cells. Human mirnas that showed the greatest increase or decrease in expression in the microrna microarray comparing DU145 and PrEC cells are shown here. 45
56 Table 1: Differentially expressed mirnas in PC3 cells versus PrEC cells. Human mirnas that showed the greatest increase or decrease in expression in the microrna microarray comparing PC3 and PrEC cells are shown here. mir-105 is shown at the bottom of the down-regulated mirs table. Table 2: Differentially expressed mirnas in DU145 cells versus PrEC cells. Human mirnas that showed the greatest increase or decrease in expression in the microrna microarray comparing DU145 and PrEC cells are shown here. mir-105 is shown at the bottom of the down-regulated mirs table. 46
57 Figure 4: mir-105 levels are reduced and mir-720 levels are increased in prostate tumour cells compared to normal prostate epithelial cells. Levels of mir-105 (A) and mir-720 (B) were quantified in PrEC, PC3 and DU145 cells using TaqMan RT-qPCR. Relative levels of mir-105 and mir-720 were normalized to endogenous levels of RNU24 and mir-103 as a control then expressed as relative levels compared to PrEC. Levels were quantified in 8 replicates for each cell line and the graph represents the pooled mean and standard error of 8 replicates from two independent experiments. The relative levels of mir-105 were significantly decreased (p<0.05) in PC3 and DU145 cells compared to PrEC. The relative levels of mir-720 were significantly increased in PC3 (p<0.001) and DU145 (p<0.05) cells compared to PrEC. 47
58 Figure 4: mir-105 levels are reduced and mir-720 levels are increased in prostate tumour cells compared to normal prostate epithelial cells. Levels of mir-105 (A) and mir-720 (B) were quantified in PrEC, PC3 and DU145 cells using TaqMan RT-qPCR. Relative levels of mir-105 and mir-720 were normalized to endogenous levels of RNU24 and mir-103 as a control then expressed as relative levels compared to PrEC. Levels were quantified in 8 replicates for each cell line and the graph represents the pooled mean and standard error of 8 replicates from two independent experiments. The relative levels of mir-105 were significantly decreased (p<0.05) in PC3 and DU145 cells compared to PrEC. The relative levels of mir-720 were significantly increased in PC3 (p<0.001) and DU145 (p<0.05) cells compared to PrEC. 48
59 As mir-105 was also found to be a mirna that was regulated in cells following integrin signalling which was another avenue of investigation of great interest to us, we chose to focus on its role in prostate cancer as opposed to some of the identified mirnas that may have been more highly downregulated in tumour cells for this reason. Endogenous levels of RNU24 and mir-103 were used as normalization controls as both have been shown to be very stably expressed in tumour and normal cells (23) (149). Specifically, the expression level of mir-105 was found to be reduced by 62% and 67% in PC3 and DU145 cells, respectively, as compared to PrEC cells (Fig.4A). Given that mir-105 is reduced in both metastatic prostate tumour cell lines compared to normal prostate epithelium, we hypothesized that mir-105 expression may inhibit prostate tumour cell growth or invasion. 3.2 Characterization of efficacy of miridian mirna mimics As we wished to study the effects of modulation of mir-105 expression on various aspects of tumourigenesis, we evaluated the utility of using miridian mirna mimics (Dharmacon) for this purpose. Hsa-miR-105 and cel-mir-67 were used as the specific and control mimic mirnas, respectively. mirnas were transfected into PC3 or DU145 cells using Oligofectamine as described in section 2.2. To determine the most effective mimic concentration for use in mir-105 over-expression, we initially transfected different concentrations (2nM, 10nM, 50nM, and 100nM) of mimics and compared the level of mir- 105 expression in the transfected cells using RT-qPCR (Fig.5A). We found that 50nM of mimic was sufficient to significantly over-express mir-105. mir-105 over-expression at this concentration in transfected PC3 cells was significantly higher than normal mir-105 levels seen in non-transfected PrEC cells. 49
60 Figure 5: Evaluation of efficacy of MIRIDIAN mimics for modulation of mir-105 levels. (A) PC3 cells were treated with increasing concentrations (2, 10, 50, 100 nm) of mir-105 specific or 100nM control (cel-mir-67) mimics (Dharmacon). After 48 hours samples were evaluated for relative levels of mir-105 using TaqMan RT-qPCR. mir-105 levels specifically increased in a dose-dependent fashion in mir-105 compared to control mimic transfected cells. The graph represents the mean and standard error of 8 replicates from one experiment. Statistical analysis showed that the 50 nm and 100 nm transfections showed significantly greater mir-105 levels than the mimic control (p<0.001). (B) PC3 cells were treated with 50nM of mir-105 or control cel-mir-67 mimics, and relative levels of expression of mir-105 were assessed over time using TaqMan RT-qPCR. mir-105 expression increased over time, and peaked at 120 hours post-transfection before declining, while mir-105 levels in control transfected cells showed no change between 24 h and 7 days post transfection. In all cases levels were normalized to endogenous levels of RNU24 as an internal control. The graph represents the mean and standard error of 3 replicates from one 50
61 experiment. Statistical analysis showed that all time points showed significantly greater mir-105 levels compared to mimic control (p<0.001). Figure 5: Evaluation of efficacy of miridian mimics for modulation of mir-105 levels. (A) PC3 cells were treated with increasing concentrations (2, 10, 50, 100 nm) of mir-105 specific or 100nM control (cel-mir-67) mimics (Dharmacon). After 48 hours samples were evaluated for relative levels of mir-105 using TaqMan RT-qPCR. mir-105 levels specifically increased in a dose-dependent fashion in mir-105 compared to control mimic transfected cells. The graph represents the mean and standard error of 8 replicates from one experiment. Statistical analysis showed that the 50 nm and 100 nm transfections showed significantly greater mir-105 levels than the mimic control (p<0.001). (B) PC3 cells were treated with 50nM of mir-105 or control cel-mir-67 mimics, and relative levels of expression of mir-105 were assessed over time using TaqMan RT-qPCR. mir-105 expression increased over time, and peaked at 120 hours post-transfection before declining, while mir-105 levels in control transfected cells showed no change between 24 h and 7 days post transfection. In all cases levels were normalized to endogenous levels of RNU24 as an internal control. The graph represents the mean and standard error of 3 replicates from one experiment. Statistical analysis showed that all time points showed significantly greater mir-105 levels compared to mimic control (p<0.001). 51
62 We next tested the duration of over-expression of mir-105 following transfection of specific mimic at the 50nM concentration, and quantified mir-105 levels over 7 days posttransfection (Fig.5B). We found that the levels of mir-105 expression peaked at 120 hours (5 days) post-transfection of mimic, and began to decline at 7 days. Control mirna-treated cells showed no change in expression of mir-105 levels over the course of the week. In all cases, mir-105 levels were normalized to the levels of RNU24 as the endogenous control. 3.3 Over-expression of mir-105 suppresses tumour cell growth in vitro. In order to evaluate the effects of mir-105 over-expression on tumourigenic properties, we transfected prostate cancer cell lines with hsa-mir-105 specific or cel-mir-67 control mimics at 50nM as described in section 2.2. Cells were used in the various assays described below at 24 hours post-transfection when sufficient levels of mir-105 overexpression were detectable (Fig. 5B). We initially examined the effect of mir-105 overexpression on tumour cell growth and viability in PC3 (Fig. 6A) and DU145 (Fig. 6B) cells using the MTT assay system in 96-well plates as described in section 2.5. Cell viability was assessed over time, and at 96 hours post-seeding (120 hours post-transfection) we found that elevated mir-105 levels significantly reduced the relative viable cell number by 55% and 18% for PC3 and DU145 respectively, as compared to cel-mir-67 control over-expressing cells. We also found that cell viability in A549 lung carcinoma cells was decreased by mir- 105 over-expression (Fig. 7A). Thus mir-105 over-expression inhibited prostate cancer cell viability in vitro, but as MTT is a measure of viable cell number, the results could be attributed to mir-105 affecting either cell proliferation or apoptosis. 52
63 Figure 6: Over-expression of mir-105 inhibits tumour cell growth but does not induce apoptosis. 53
64 Figure 6: Over-expression of mir-105 inhibits tumour cell growth but does not induce apoptosis. (A-B) Tumour cells were transfected with either 50 nm mir-105 or control mimic and subsequently seeded into 96-well plates in replicates of 8. Cell viability was assessed over time using the MTT assay as described in section 2.5. Graphs represent the pooled mean and standard error of 8 replicates from three independent experiments. Both mir-105 overexpressing PC3 (A) and DU145 (B) cells showed a significant decrease in cell number/viability at 96 hours (p<0.001 and p<0.01 respectively) as compared to control mimic transfected cells. (C-E) To analyze apoptosis, cells were transfected with 50 nm of mir-105 or control mimic as described in section 2.2 and then serum-starved over 96 hours. The percentage of all sub-g1 cells representing the apoptotic portion was assessed by FACS as described in section 2.6. Bars represent the pooled mean and standard error of duplicate dishes from two independent experiments. There was no significant difference in the number of apoptotic cells between the mir-105 and control mimic-treated populations for either the PC3 (C) or DU145 (D) cells. (E) Serum starved cells as described above, were also analyzed for PARP cleavage by specific western blot analysis. A small decrease in both uncleaved and cleaved PARP was observed in PC3 cells, but this change was likely due to loading issues. No differences in the levels of PARP were observed in DU145 cells. β-actin was used as a loading control for equivalent amounts of total protein. 54
65 Figure 7: Effects of elevated mir-105 levels on A549 cell viability and anchorageindependent growth. (A) A549 lung carcinoma cells were transfected with either 50 nm mir-105 or control mimic and subsequently seeded into 96-well plates in replicates of 8. Cell viability was assessed over time using the MTT assay as described in section 2.5. Graph represents the pooled mean and standard error of 8 replicates from three independent experiments. mir-105 over-expressing A549 cells showed a significant decrease in cell number/viability over time (p<0.01) as compared to control mimic transfected cells. (B) A549 cells were transfected with either 50 nm mir-105 or control mimic and 24 hours post-transfection were seeded in a soft-agarose. The number of colonies were then counted in the wells generated from the 1000 cell dilution in triplicate wells. Bars represent the pooled mean and standard error for triplicate wells from two independent experiments. mir-105 over-expressing A549 cells showed a significant decrease in colony number (p<0.05) as compared to control mimic transfected cells. 55
66 Figure 7: Effects of elevated mir-105 levels on A549 cell viability and anchorageindependent growth. (A) A549 lung carcinoma cells were transfected with either 50 nm mir-105 or control mimic and subsequently seeded into 96-well plates in replicates of 8. Cell viability was assessed over time using the MTT assay as described in section 2.5. Graph represents the pooled mean and standard error of 8 replicates from three independent experiments. mir- 105 over-expressing A549 cells showed a significant decrease in cell number/viability over time (p<0.01) as compared to control mimic transfected cells. (B) A549 cells were transfected with either 50 nm mir-105 or control mimic and 24 hours post-transfection were seeded in a soft-agarose. The number of colonies were then counted in the wells generated from the 1000 cell dilution in triplicate wells. Bars represent the pooled mean and standard error for triplicate wells from two independent experiments. mir-105 over-expressing A549 cells showed a significant decrease in colony number (p<0.05) as compared to control mimic transfected cells. 56
67 To test whether mir-105 has an effect on either of these processes, we further examined the effect of mir-105 on apoptosis in the prostate cancer cell lines. 3.4 mir-105 over-expression does not cause increased apoptosis in vitro. As cell number/viability was assessed by MTT assay, the reduction observed following mir-105 over-expression could be due to either increased levels of apoptosis or decreased cell proliferation. To determine whether mir-105 over-expression induced tumour cell apoptosis, we evaluated apoptosis of PC3 and DU145 cells using two standard methods: propidium iodide (PI) flow cytometry and detection of PARP protein cleavage by western blot analysis. The PI flow cytometry method allowed quantification of the percentage of cells in the subg1 population in treated cell samples, which represented the total proportion of apoptotic cells (Fig.6C and 6D for PC3 and DU145 cells respectively). Apoptosis was also assessed by evaluating the level of PARP cleavage in treated cells by western blot (Fig. 6E). In this assay, increased levels of cleaved PARP (lower band) compared to uncleaved PARP (upper band) represents an increase in apoptosis. In PC3 cells we observed no increase in the apoptosis of mir-105 over-expressing cells when measured by PI flow cytometry (Fig. 6C). Similarly, there was no increase in the relative proportion of cleaved to un-cleaved PARP in mir-105 compared to control mimic transfected cells, although there was a drop in overall protein levels which could be attributed to loading issues. With DU145 cells, although we observed reduced numbers of apoptotic cells by PI flow cytometry, this decrease was not statistically significant (Fig. 6D). These findings were supported by the analysis of PARP cleavage, where the levels of cleaved PARP were similar between mir- 105 over-expressing cells and control cells (Fig. 6E). Under non serum-starvation 57
68 conditions, with cells collected at 48 hours past transfection, we observed a 5-10% increase in the percentage of mir-105 over-expressing PC3 cells in the G1 phase versus the control transfected PC3 cells. This indicated that mir-105 was affecting cell cycle mechanisms, such as G1 checkpoint activity. Overall, as we did not observe significant increases in apoptosis in either PC3 or DU145 mir-105 over-expressing cells, this suggests that the reduced viable cell numbers observed in the MTT assays were likely a result of inhibition of tumour cell proliferation, not induction of apoptosis. 3.5 mir-105 over-expression suppresses anchorage-independent growth in vitro. We tested the effect of mir-105 over-expression on the ability of prostate tumour cell lines to grow under anchorage-independent 3D conditions using soft-agarose assays as described in section 2.7. Anchorage-independent growth is an important measure of cell tumourigenicity (93). Normal non-cancerous cells are unable to grow in the isolated agarose environment, while cancer cells are able to proliferate and form colonies. Cell types with higher tumourigenicity are able to form colonies more readily and at increased frequency. After a two week incubation period, the number of colonies was counted in each well at appropriate dilutions. The ability of mir-105 over-expressing PC3 (Fig. 8A) or DU145 (Fig. 8B) cells to form colonies in 3D was reduced by 36% and 43% respectively, as compared to the control-treated cells. A549 lung carcinoma cells also showed a reduction in colonyforming ability (Fig. 7B). Representative photos were taken of the PC3 and DU145 colonies (Fig. 8C and D) There was no qualitative change in colony size or shape between mir-105 and control-treated cells at the end of the 2 weeks in any cell line. 58
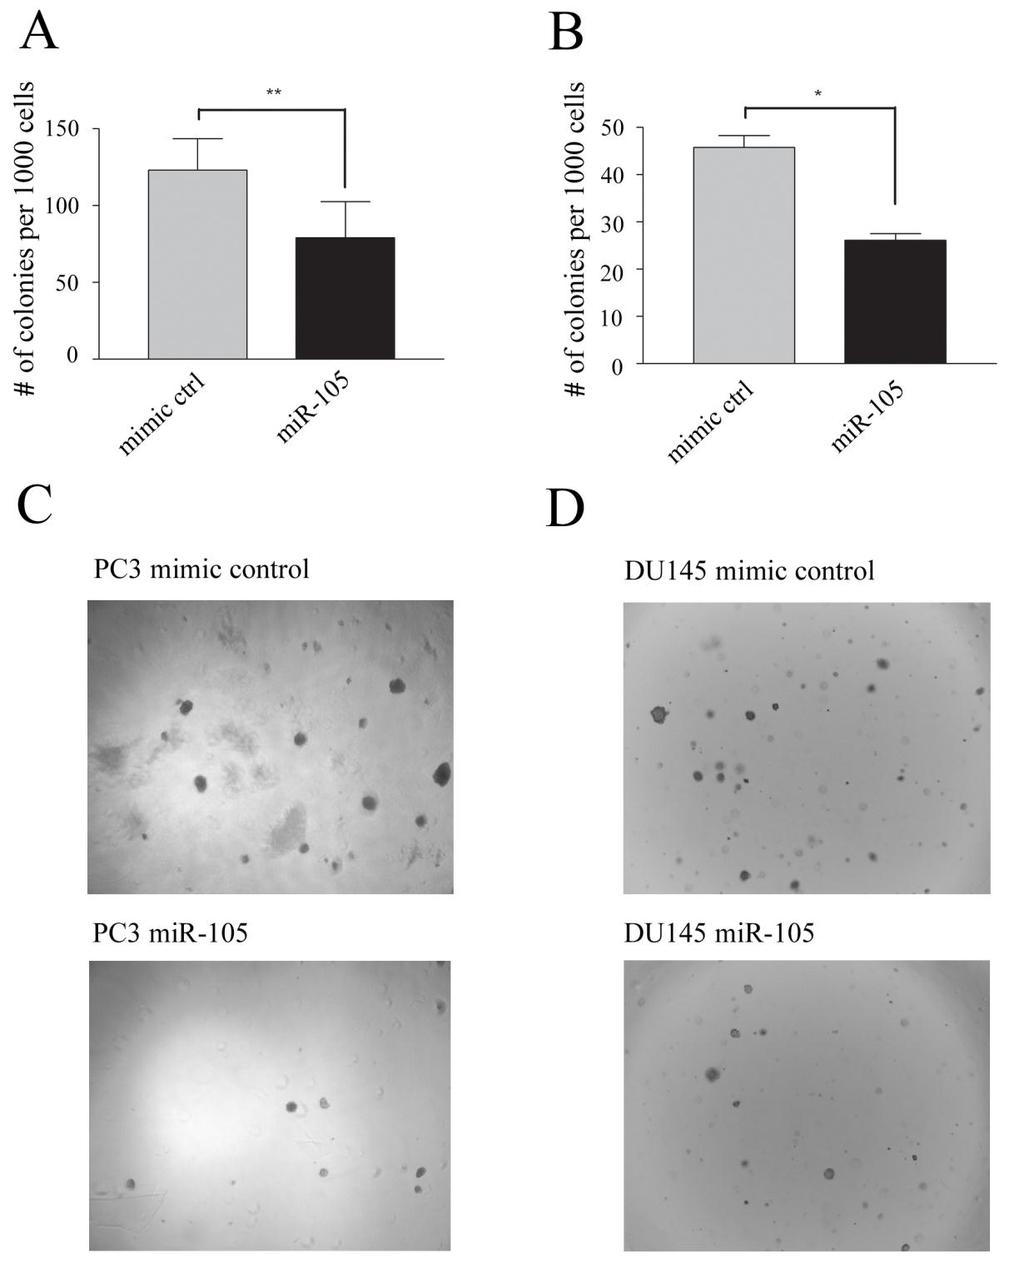
69 59
70 Figure 8: Over-expression of mir-105 mimic inhibits anchorage-independent growth of prostate tumour cells. Figure 8: Over-expression of mir-105 inhibits anchorage-independent growth of prostate tumour cells. (A-D) PC3 (A) and DU145 (B) cells were transfected with either 50 nm mir-105 or control mimic and 24 hours post-transfection were seeded into soft-agarose. The number of colonies were then counted 14 days later in the wells generated from the 1000 cell dilution in triplicate wells. Bars represent the pooled mean and standard error for triplicate wells from three independent experiments. There was a significant decrease in colony formation in cells treated with mir-105 as compared to control mimic-transfected cells for both PC3 (p<0.01) and DU145 (p<0.05) cells. (C-D) Representative photos showing reduced colony formation in soft-agarose for mir-105 versus control mimic transfected PC3 (C) and DU145 (D). 60
71 Taken together, our results suggest that increased levels of mir-105 suppress 2D and 3D growth in PC3, DU145 and A549 cells. 3.6 Over-expression of mir-105 inhibits PC3 tumour cell migration and invasion. We next evaluated whether mir-105 over-expression affected tumour cell migration or invasion as described in sections 2.8 and 2.9, respectively. To test the effects of mir-105 over-expression on cell migration, transfected PC3 cells were used in a scratch wound assay. Confluent cell monolayers were scratched to create a wound opening, and then the percentage wound closure at various times was calculated following comparison to the wound diameter at time 0. We found that the migration of mir-105 mimic treated PC3 cells over a 48 hour time period was significantly inhibited as compared to control mimic transfected cells (Fig. 9A and B). However, as wound closure rates can be influenced by cell proliferation, and we had previously noted the ability of mir-105 to inhibit PC3 cell growth, we investigated the ability of mir-105 to inhibit tumour cell invasion using Matrigel-coated transwell invasion chambers. As this assay is of shorter duration, the influence of differences in cell proliferation play a less significant role and effects are mostly attributable to direct effects in cell migration and invasive capabilities. In this assay system we found that the number of invaded cells transfected with mir-105 mimics was significantly reduced as compared to control mimic transfected cells (Fig.9C). Thus, over-expression of mir-105 also appears to inhibit PC3 cell invasion in vitro. 61

72 Figure 9: Over-expression of mir-105 mimic inhibits tumour cell migration and invasion. 62
73 Figure 9 Over-expression of mir-105 inhibits tumour cell migration and invasion. (A) Representative photos of scratch wound assays at 0 and 48 hours post wounding for mir-105 compared to control mimic transfected PC3 cells showing impaired wound closure in mir-105 mimic over-expressing cells. Photos were taken at 10x magnification. (B) PC3 migration was measured as percentage wound closure in assays in (A) as described in section 2.8. Average wound closure measurements at three different points along wound edge was quantified in each of two independent wells. Bars represent pooled mean and standard error of duplicates in each of two independent experiments. Wound closure after 48 hours was significantly less (p<0.01) in the mir-105 mimic expressing compared to control mimic transfected cells. (C) PC3 invasion was measured over 24 hours using Matrigel coated transwells as described in section 2.9. The total number of invaded cells on the underside of each filter were counted and expressed in the graph as the pooled mean and standard error from duplicate wells in three independent experiments. There were significantly less (p<0.05) mir-105 mimic over-expressing invaded cells compared to control cells. 63
74 3.7 Over-expression of mir-105 inhibits growth of prostate tumour cells in vivo in xenograft models. We decided to examine the effects of mir-105 over-expression on in vivo tumour growth using xenografts in immunocompromised mouse models as described in section PC3 or DU145 cells were transfected with either mir-105 specific mimic or control mimics, and 24 hours later were harvested and 1x10 6 cells were injected subcutaneously into both flanks of each nude mouse. A total of 8 mice were used in each experiment, with 4 receiving bilateral injections of mir-105 treated cells and 4 receiving control cells, for a total of 16 PC3 and 16 DU145 tumours. Tumour growth was measured weekly, and tumour volumes over time assessed for PC3 (Fig. 10A) and DU145 (Fig. 10B) tumours. We found that the growth of PC3 tumours was significantly inhibited following over-expression of mir-105 mimics as compared to control mimic transfected PC3 cells (Fig. 10A). At the termination of the experiment, wet tumour weight was also determined, and it was confirmed that mir-105 over-expressing tumours weighed on average 73% less than the control tumours (Fig.10C). Although not statistically significant, we also observed reduced DU145 tumour growth in mir-105 transfected as compared to control mimic transfected cells over time (Fig.10B). At endpoint, the weight of tumours derived from mir-105 transfected DU145 cells were approximately 82% less than those derived from control mimic transfected cells (Fig.10D). In addition, sections of tumour sample were taken, H&E stained and photographed. Both PC3 (Fig.10E) and DU145 (Fig.10F) tumours showed no major histological differences between control-treated and mir-105-treated cells. At endpoint, total RNA was extracted from tumour samples and the levels of mir-105 expression were assessed using RT-qPCR (Fig.10G). Slightly higher levels of mir-105 expression were observed in PC3 tumours 64
75 derived from mir-105 mimic transfected cells as compared to control mimic transfected cells following analysis by RT-qPCR. These results support our contention that mir-105 inhibits prostate tumour cell growth, which results in delayed tumour progression. 65

76 66 Figure 10: Over-
mirna Dr. S Hosseini-Asl
 mirna Dr. S Hosseini-Asl 1 2 MicroRNAs (mirnas) are small noncoding RNAs which enhance the cleavage or translational repression of specific mrna with recognition site(s) in the 3 - untranslated region
MicroRNA and Male Infertility: A Potential for Diagnosis
 Review Article MicroRNA and Male Infertility: A Potential for Diagnosis * Abstract MicroRNAs (mirnas) are small non-coding single stranded RNA molecules that are physiologically produced in eukaryotic
MicroRNA expression profiling and functional analysis in prostate cancer. Marco Folini s.c. Ricerca Traslazionale DOSL
 MicroRNA expression profiling and functional analysis in prostate cancer Marco Folini s.c. Ricerca Traslazionale DOSL What are micrornas? For almost three decades, the alteration of protein-coding genes
MicroRNA in Cancer Karen Dybkær 2013
 MicroRNA in Cancer Karen Dybkær RNA Ribonucleic acid Types -Coding: messenger RNA (mrna) coding for proteins -Non-coding regulating protein formation Ribosomal RNA (rrna) Transfer RNA (trna) Small nuclear
MicroRNA dysregulation in cancer. Systems Plant Microbiology Hyun-Hee Lee
 MicroRNA dysregulation in cancer Systems Plant Microbiology Hyun-Hee Lee Contents 1 What is MicroRNA? 2 mirna dysregulation in cancer 3 Summary What is MicroRNA? What is MicroRNA? MicroRNAs (mirnas) -
Transcriptional control in Eukaryotes: (chapter 13 pp276) Chromatin structure affects gene expression. Chromatin Array of nuc
 Chromatin structure affects gene expression. Chromatin Array of nuc") Transcriptional control in Eukaryotes: (chapter 13 pp276) Chromatin structure affects gene expression Chromatin Array of nuc 1 Transcriptional control in Eukaryotes: Chromatin undergoes structural changes
Transcriptional control in Eukaryotes: (chapter 13 pp276) Chromatin structure affects gene expression Chromatin Array of nuc 1 Transcriptional control in Eukaryotes: Chromatin undergoes structural changes
Bi 8 Lecture 17. interference. Ellen Rothenberg 1 March 2016
 Bi 8 Lecture 17 REGulation by RNA interference Ellen Rothenberg 1 March 2016 Protein is not the only regulatory molecule affecting gene expression: RNA itself can be negative regulator RNA does not need
Ch. 18 Regulation of Gene Expression
 Ch. 18 Regulation of Gene Expression 1 Human genome has around 23,688 genes (Scientific American 2/2006) Essential Questions: How is transcription regulated? How are genes expressed? 2 Bacteria regulate
V16: involvement of micrornas in GRNs
 What are micrornas? V16: involvement of micrornas in GRNs How can one identify micrornas? What is the function of micrornas? Elisa Izaurralde, MPI Tübingen Huntzinger, Izaurralde, Nat. Rev. Genet. 12,
Regulation of Gene Expression in Eukaryotes
 Ch. 19 Regulation of Gene Expression in Eukaryotes BIOL 222 Differential Gene Expression in Eukaryotes Signal Cells in a multicellular eukaryotic organism genetically identical differential gene expression
Chapter 10 - Post-transcriptional Gene Control
 Chapter 10 - Post-transcriptional Gene Control Chapter 10 - Post-transcriptional Gene Control 10.1 Processing of Eukaryotic Pre-mRNA 10.2 Regulation of Pre-mRNA Processing 10.3 Transport of mrna Across
MicroRNAs and Cancer
 MicroRNAs and Cancer MicroRNAs are an abundant class of small (20-25 nucleotides) non-protein coding RNAs that function as negative gene regulators. The human genome contains up to 1000 micrornas which
Alternative RNA processing: Two examples of complex eukaryotic transcription units and the effect of mutations on expression of the encoded proteins.
 Alternative RNA processing: Two examples of complex eukaryotic transcription units and the effect of mutations on expression of the encoded proteins. The RNA transcribed from a complex transcription unit
MicroRNAs: molecular features and role in cancer.
 MicroRNAs: molecular features and role in cancer. Elodie Lages, Hélène Ipas, Audrey Guttin, Houssam Nesr, François Berger, Jean-Paul Issartel To cite this version: Elodie Lages, Hélène Ipas, Audrey Guttin,
reported to underlie diverse aspects of biology, including developmental timing, differentiation, proliferation, cell death, and metabolism.
 1100 MicroRNA in Cancer: The Involvement of Aberrant MicroRNA Biogenesis Regulatory Pathways Genes & Cancer 1(11) 1100 1114 The Author(s) 2011 Reprints and permission: sagepub.com/journalspermissions.nav
Introduction. Cancer Biology. Tumor-suppressor genes. Proto-oncogenes. DNA stability genes. Mechanisms of carcinogenesis.
 Cancer Biology Chapter 18 Eric J. Hall., Amato Giaccia, Radiobiology for the Radiologist Introduction Tissue homeostasis depends on the regulated cell division and self-elimination (programmed cell death)
Overview: Conducting the Genetic Orchestra Prokaryotes and eukaryotes alter gene expression in response to their changing environment
 Overview: Conducting the Genetic Orchestra Prokaryotes and eukaryotes alter gene expression in response to their changing environment In multicellular eukaryotes, gene expression regulates development
Novel RNAs along the Pathway of Gene Expression. (or, The Expanding Universe of Small RNAs)
") Novel RNAs along the Pathway of Gene Expression (or, The Expanding Universe of Small RNAs) Central Dogma DNA RNA Protein replication transcription translation Central Dogma DNA RNA Spliced RNA Protein
Novel RNAs along the Pathway of Gene Expression (or, The Expanding Universe of Small RNAs) Central Dogma DNA RNA Protein replication transcription translation Central Dogma DNA RNA Spliced RNA Protein
microrna Presented for: Presented by: Date:
 microrna Presented for: Presented by: Date: 2 micrornas Non protein coding, endogenous RNAs of 21-22nt length Evolutionarily conserved Regulate gene expression by binding complementary regions at 3 regions
MicroRNAs, RNA Modifications, RNA Editing. Bora E. Baysal MD, PhD Oncology for Scientists Lecture Tue, Oct 17, 2017, 3:30 PM - 5:00 PM
 MicroRNAs, RNA Modifications, RNA Editing Bora E. Baysal MD, PhD Oncology for Scientists Lecture Tue, Oct 17, 2017, 3:30 PM - 5:00 PM Expanding world of RNAs mrna, messenger RNA (~20,000) trna, transfer
CELL BIOLOGY - CLUTCH CH CANCER.
 !! www.clutchprep.com CONCEPT: OVERVIEW OF CANCER Cancer is a disease which is primarily caused from misregulated cell division, which form There are two types of tumors - Benign tumors remain confined
Genetics. Instructor: Dr. Jihad Abdallah Transcription of DNA
 Genetics Instructor: Dr. Jihad Abdallah Transcription of DNA 1 3.4 A 2 Expression of Genetic information DNA Double stranded In the nucleus Transcription mrna Single stranded Translation In the cytoplasm
Phenomena first observed in petunia
 Vectors for RNAi Phenomena first observed in petunia Attempted to overexpress chalone synthase (anthrocyanin pigment gene) in petunia. (trying to darken flower color) Caused the loss of pigment. Bill Douherty
We are IntechOpen, the world s leading publisher of Open Access books Built by scientists, for scientists. International authors and editors
 We are IntechOpen, the world s leading publisher of Open Access books Built by scientists, for scientists 4,000 116,000 120M Open access books available International authors and editors Downloads Our
BIO360 Fall 2013 Quiz 1
 BIO360 Fall 2013 Quiz 1 1. Examine the diagram below. There are two homologous copies of chromosome one and the allele of YFG carried on the light gray chromosome has undergone a loss-of-function mutation.
10/31/2017. micrornas and cancer. From the one gene-one enzyme hypothesis to. microrna DNA RNA. Transcription factors.
 micrornas and cancer Cellular and Molecular Biology of Cancer (PATH G4500-001) November 1 st, 2017 -Katia Basso- Columbia University Katia Basso, PhD Office: ICRC RM506 E-mail: kb451@cumc.columbia.edu
Profiles of gene expression & diagnosis/prognosis of cancer. MCs in Advanced Genetics Ainoa Planas Riverola
 Profiles of gene expression & diagnosis/prognosis of cancer MCs in Advanced Genetics Ainoa Planas Riverola Gene expression profiles Gene expression profiling Used in molecular biology, it measures the
Cancer and Gene Alterations - 1
 Cancer and Gene Alterations - 1 Cancer and Gene Alteration As we know, cancer is a disease of unregulated cell growth. Although we looked at some of the features of cancer when we discussed mitosis checkpoints,
Chapter 12. Regulation of Cell Division. AP Biology
 Chapter 12. Regulation of Cell Division Coordination of cell division! Multicellular organism " need to coordinate across different parts of organism! timing of cell division! rates of cell division "
Post-transcriptional regulation of an intronic microrna
 Post-transcriptional regulation of an intronic microrna Carl Novina Dana-Farber Cancer Institute Harvard Medical School Broad Institute of Harvard and MIT Qiagen Webinar 05-17-11 Outline 1. The biology
Circular RNAs (circrnas) act a stable mirna sponges
 act a stable mirna sponges") Circular RNAs (circrnas) act a stable mirna sponges cernas compete for mirnas Ancestal mrna (+3 UTR) Pseudogene RNA (+3 UTR homolgy region) The model holds true for all RNAs that share a mirna binding
Circular RNAs (circrnas) act a stable mirna sponges cernas compete for mirnas Ancestal mrna (+3 UTR) Pseudogene RNA (+3 UTR homolgy region) The model holds true for all RNAs that share a mirna binding
The Biology and Genetics of Cells and Organisms The Biology of Cancer
 The Biology and Genetics of Cells and Organisms The Biology of Cancer Mendel and Genetics How many distinct genes are present in the genomes of mammals? - 21,000 for human. - Genetic information is carried
Intrinsic cellular defenses against virus infection
 Intrinsic cellular defenses against virus infection Detection of virus infection Host cell response to virus infection Interferons: structure and synthesis Induction of antiviral activity Viral defenses
Prokaryotes and eukaryotes alter gene expression in response to their changing environment
 Chapter 18 Prokaryotes and eukaryotes alter gene expression in response to their changing environment In multicellular eukaryotes, gene expression regulates development and is responsible for differences
Utility of Circulating micrornas in Cardiovascular Disease
 Utility of Circulating micrornas in Cardiovascular Disease Pil-Ki Min, MD, PhD Cardiology Division, Gangnam Severance Hospital, Yonsei University College of Medicine Introduction Biology of micrornas Circulating
Computer Science, Biology, and Biomedical Informatics (CoSBBI) Outline. Molecular Biology of Cancer AND. Goals/Expectations. David Boone 7/1/2015
 Outline. Molecular Biology of Cancer AND. Goals/Expectations. David Boone 7/1/2015") Goals/Expectations Computer Science, Biology, and Biomedical (CoSBBI) We want to excite you about the world of computer science, biology, and biomedical informatics. Experience what it is like to be a
Goals/Expectations Computer Science, Biology, and Biomedical (CoSBBI) We want to excite you about the world of computer science, biology, and biomedical informatics. Experience what it is like to be a
The functional investigation of the interaction between TATA-associated factor 3 (TAF3) and p53 protein
 and p53 protein") THESIS BOOK The functional investigation of the interaction between TATA-associated factor 3 (TAF3) and p53 protein Orsolya Buzás-Bereczki Supervisors: Dr. Éva Bálint Dr. Imre Miklós Boros University of
THESIS BOOK The functional investigation of the interaction between TATA-associated factor 3 (TAF3) and p53 protein Orsolya Buzás-Bereczki Supervisors: Dr. Éva Bálint Dr. Imre Miklós Boros University of
Human Genome: Mapping, Sequencing Techniques, Diseases
 Human Genome: Mapping, Sequencing Techniques, Diseases Lecture 4 BINF 7580 Fall 2005 1 Let us review what we talked about at the previous lecture. Please,... 2 The central dogma states that the transfer
VIII Curso Internacional del PIRRECV. Some molecular mechanisms of cancer
 VIII Curso Internacional del PIRRECV Some molecular mechanisms of cancer Laboratorio de Comunicaciones Celulares, Centro FONDAP Estudios Moleculares de la Celula (CEMC), ICBM, Facultad de Medicina, Universidad
NOVEL FUNCTION OF mirnas IN REGULATING GENE EXPRESSION. Ana M. Martinez
 NOVEL FUNCTION OF mirnas IN REGULATING GENE EXPRESSION Ana M. Martinez Switching from Repression to Activation: MicroRNAs can Up-Regulate Translation. Shoba Vasudevan, Yingchun Tong, Joan A. Steitz AU-rich
Introduction to Cancer Biology
 Introduction to Cancer Biology Robin Hesketh Multiple choice questions (choose the one correct answer from the five choices) Which ONE of the following is a tumour suppressor? a. AKT b. APC c. BCL2 d.
Control of Cell Cycle. Unit 2 Part f III
 Control of Cell Cycle Unit 2 Part f III How often do cells divide and why? The timing and rate of cell division in different parts of the plant or animals are crucial to normal growth, development and
Molecular biology :- Cancer genetics lecture 11
 Molecular biology :- Cancer genetics lecture 11 -We have talked about 2 group of genes that is involved in cellular transformation : proto-oncogenes and tumour suppressor genes, and it isn t enough to
he micrornas of Caenorhabditis elegans (Lim et al. Genes & Development 2003)
") MicroRNAs: Genomics, Biogenesis, Mechanism, and Function (D. Bartel Cell 2004) he micrornas of Caenorhabditis elegans (Lim et al. Genes & Development 2003) Vertebrate MicroRNA Genes (Lim et al. Science
MicroRNAs: Genomics, Biogenesis, Mechanism, and Function (D. Bartel Cell 2004) he micrornas of Caenorhabditis elegans (Lim et al. Genes & Development 2003) Vertebrate MicroRNA Genes (Lim et al. Science
Cellular MicroRNA and P Bodies Modulate Host-HIV-1 Interactions. 指導教授 : 張麗冠博士 演講者 : 黃柄翰 Date: 2009/10/19
 Cellular MicroRNA and P Bodies Modulate Host-HIV-1 Interactions 指導教授 : 張麗冠博士 演講者 : 黃柄翰 Date: 2009/10/19 1 MicroRNA biogenesis 1. Pri mirna: primary mirna 2. Drosha: RNaseIII 3. DCR 1: Dicer 1 RNaseIII
number Done by Corrected by Doctor Maha Shomaf
 number 19 Done by Waseem Abo-Obeida Corrected by Abdullah Zreiqat Doctor Maha Shomaf Carcinogenesis: the molecular basis of cancer. Non-lethal genetic damage lies at the heart of carcinogenesis and leads
Cancer. October is National Breast Cancer Awareness Month
 Cancer October is National Breast Cancer Awareness Month Objectives 1: Gene regulation Explain how cells in all the different parts of your body develop such different characteristics and functions. Contrast
Cancer. Questions about cancer. What is cancer? What causes unregulated cell growth? What regulates cell growth? What causes DNA damage?
 Questions about cancer What is cancer? Cancer Gil McVean, Department of Statistics, Oxford What causes unregulated cell growth? What regulates cell growth? What causes DNA damage? What are the steps in
Oncolytic virus strategy
 Oncolytic viruses Oncolytic virus strategy normal tumor NO replication replication survival lysis Oncolytic virus strategy Mechanisms of tumor selectivity of several, some of them naturally, oncolytic
Dottorato di Ricerca in Genetica e Biologia Cellulare. MUTANT P53 INHIBITS microrna BIOGENESIS BY INTERFERING WITH THE MICROPROCESSOR COMPLEX
 Dipartimento di Ecologia e Biologia Dottorato di Ricerca in Genetica e Biologia Cellulare Ciclo XXVII Settore scientifico-disciplinare BIO/11 MUTANT P53 INHIBITS microrna BIOGENESIS BY INTERFERING WITH
MicroRNAs as Prognostic Biomarkers in Prostate Cancer
 MicroRNAs as Prognostic Biomarkers in Prostate Cancer by Aida Gordanpour A thesis submitted in conformity with the requirements for the degree of Doctor of Philosophy Department of Laboratory Medicine
Eukaryotic Gene Regulation
 Eukaryotic Gene Regulation Chapter 19: Control of Eukaryotic Genome The BIG Questions How are genes turned on & off in eukaryotes? How do cells with the same genes differentiate to perform completely different,
Regulation of Cell Division. AP Biology
 Regulation of Cell Division 2006-2007 Coordination of cell division A multicellular organism needs to coordinate cell division across different tissues & organs critical for normal growth, development
p53 and Apoptosis: Master Guardian and Executioner Part 2
 p53 and Apoptosis: Master Guardian and Executioner Part 2 p14arf in human cells is a antagonist of Mdm2. The expression of ARF causes a rapid increase in p53 levels, so what would you suggest?.. The enemy
Functional Limitations
 Regulation of the Cell Cycle Chapter 12 Pg. 228 245 Functional Limitations Various factors determine whether and when a cell divides. Two functional limitations for cell size limit growth or influence
Cancer Problems in Indonesia
 mirna and Cancer : mirna as a Key Regulator in Cancer Sofia Mubarika 2 nd Symposium Biomolecular Update in Cancer PERABOI Padang 18 Mei 2013 Cancer Problems in Indonesia 1. Chemoresistency / recurrency
Regulation of Cell Division (Ch. 12)
") Regulation of Cell Division (Ch. 12) Coordination of cell division A multicellular organism needs to coordinate cell division across different tissues & organs critical for normal growth, development &
Regulation of Cell Division (Ch. 12) Coordination of cell division A multicellular organism needs to coordinate cell division across different tissues & organs critical for normal growth, development &
Unit 9: The Cell Cycle
 Unit 9: The Cell Cycle Name: Period: Test Date: 1 Table of Contents Title of Page Page Number Teacher Stamp Unit 9 Warm-Ups 3-4 Cell Cycle/Interphase Notes 5-6 DNA Replication Notes 7-8 DNA replication
Biochemistry of Carcinogenesis. Lecture # 35 Alexander N. Koval
 Biochemistry of Carcinogenesis Lecture # 35 Alexander N. Koval What is Cancer? The term "cancer" refers to a group of diseases in which cells grow and spread unrestrained throughout the body. It is difficult
Src-INACTIVE / Src-INACTIVE
 Biology 169 -- Exam 1 February 2003 Answer each question, noting carefully the instructions for each. Repeat- Read the instructions for each question before answering!!! Be as specific as possible in each
Biochemistry of Cancer and Tumor Markers
 Biochemistry of Cancer and Tumor Markers The term cancer applies to a group of diseases in which cells grow abnormally and form a malignant tumor. It is a long term multistage genetic process. The first
Cancer Biology How a cell responds to DNA Damage
 1 Cancer Biology How a cell responds to DNA Damage Jann Sarkaria Department of Oncology Mayo Clinic 2 EDUCATIONAL GOALS How proteins can transmit signals to each other. The definition of a tumor suppressor
Transformation of Normal HMECs (Human Mammary Epithelial Cells) into Metastatic Breast Cancer Cells: Introduction - The Broad Picture:
 into Metastatic Breast Cancer Cells: Introduction - The Broad Picture:") Transformation of Normal HMECs (Human Mammary Epithelial Cells) into Metastatic Breast Cancer Cells: Introduction - The Broad Picture: Spandana Baruah December, 2016 Cancer is defined as: «A disease caused
Transformation of Normal HMECs (Human Mammary Epithelial Cells) into Metastatic Breast Cancer Cells: Introduction - The Broad Picture: Spandana Baruah December, 2016 Cancer is defined as: «A disease caused
Diagnostic test Suggested website label Description Hospitals available
 Diagnostic test Suggested website label Description Hospitals available Abbott Molecular Inc, PATHVYSION HER-2 DNA Probe Kit (FISH) PathVysion kit A diagnostic tool used to determine whether a particular
Chapt 15: Molecular Genetics of Cell Cycle and Cancer
 Chapt 15: Molecular Genetics of Cell Cycle and Cancer Student Learning Outcomes: Describe the cell cycle: steps taken by a cell to duplicate itself = cell division; Interphase (G1, S and G2), Mitosis.
Molecular Biology (BIOL 4320) Exam #2 May 3, 2004
 Exam #2 May 3, 2004") Molecular Biology (BIOL 4320) Exam #2 May 3, 2004 Name SS# This exam is worth a total of 100 points. The number of points each question is worth is shown in parentheses after the question number. Good
Molecular Biology (BIOL 4320) Exam #2 May 3, 2004 Name SS# This exam is worth a total of 100 points. The number of points each question is worth is shown in parentheses after the question number. Good
Eukaryotic mrna is covalently processed in three ways prior to export from the nucleus:
 RNA Processing Eukaryotic mrna is covalently processed in three ways prior to export from the nucleus: Transcripts are capped at their 5 end with a methylated guanosine nucleotide. Introns are removed
Molecular Mechanism of MicroRNA-203 Mediated Epidermal Stem Cell Differentiation
 University of Colorado, Boulder CU Scholar Undergraduate Honors Theses Honors Program Spring 2011 Molecular Mechanism of MicroRNA-203 Mediated Epidermal Stem Cell Differentiation Sarah Jackson University
BIO360 Quiz #1. September 14, Name five of the six Hallmarks of Cancer (not emerging hallmarks or enabling characteristics ): (5 points)
: (5 points)") Name: BIO360 Quiz #1 September 14, 2012 1. Name five of the six Hallmarks of Cancer (not emerging hallmarks or enabling characteristics ): (5 points) 2. The controversial hypothesis that only a small subset
Name: BIO360 Quiz #1 September 14, 2012 1. Name five of the six Hallmarks of Cancer (not emerging hallmarks or enabling characteristics ): (5 points) 2. The controversial hypothesis that only a small subset
TRANSCRIPTION. DNA à mrna
 TRANSCRIPTION DNA à mrna Central Dogma Animation DNA: The Secret of Life (from PBS) http://www.youtube.com/watch? v=41_ne5ms2ls&list=pl2b2bd56e908da696&index=3 Transcription http://highered.mcgraw-hill.com/sites/0072507470/student_view0/
Regarding techniques of proteomics, there is:
 Molecular الحلقة biology 14 واألخيرة To put you back in the context; the discussion was about Trancriptomics (the study of transcription). The following topic will be PROTEOMICS, which is the study of
AP: CELL CYCLE REGULATION
 AP: CELL CYCLE REGULATION CELL CYCLE 2 crucial factors for normal growth: Timing and rate of cell division Cell division frequency depends on cell type: skin cells: frequently Liver cells: can divide when
micrornas (mirna) and Biomarkers
 and Biomarkers") micrornas (mirna) and Biomarkers Small RNAs Make Big Splash mirnas & Genome Function Biomarkers in Cancer Future Prospects Javed Khan M.D. National Cancer Institute EORTC-NCI-ASCO November 2007 The Human
micrornas (mirna) and Biomarkers Small RNAs Make Big Splash mirnas & Genome Function Biomarkers in Cancer Future Prospects Javed Khan M.D. National Cancer Institute EORTC-NCI-ASCO November 2007 The Human
Polyomaviridae. Spring
 Polyomaviridae Spring 2002 331 Antibody Prevalence for BK & JC Viruses Spring 2002 332 Polyoma Viruses General characteristics Papovaviridae: PA - papilloma; PO - polyoma; VA - vacuolating agent a. 45nm
Regulation of Cell Division
 Regulation of Cell Division Two HeLa cancer cells are just completing cytokinesis. Explain how the cell division of cancer cells like these is misregulated. Identify genetic and other changes that might
Chapter 11 How Genes Are Controlled
 Chapter 11 How Genes Are Controlled PowerPoint Lectures for Biology: Concepts & Connections, Sixth Edition Campbell, Reece, Taylor, Simon, and Dickey Copyright 2009 Pearson Education, Inc. Lecture by Mary
Genome of Hepatitis B Virus. VIRAL ONCOGENE Dr. Yahwardiah Siregar, PhD Dr. Sry Suryani Widjaja, Mkes Biochemistry Department
 Genome of Hepatitis B Virus VIRAL ONCOGENE Dr. Yahwardiah Siregar, PhD Dr. Sry Suryani Widjaja, Mkes Biochemistry Department Proto Oncogen and Oncogen Oncogen Proteins that possess the ability to cause
Multistep nature of cancer development. Cancer genes
 Multistep nature of cancer development Phenotypic progression loss of control over cell growth/death (neoplasm) invasiveness (carcinoma) distal spread (metastatic tumor) Genetic progression multiple genetic
mirnas as Biomarkers for Diagnosis and Assessment of Prognosis of Coronary Artery Disease
 Open Journal of Internal Medicine, 2018, 8, 54-63 http://www.scirp.org/journal/ojim ISSN Online: 2162-5980 ISSN Print: 2162-5972 mirnas as Biomarkers for Diagnosis and Assessment of Prognosis of Coronary
BIO360 Fall 2013 Quiz 1
 BIO360 Fall 2013 Quiz 1 Name: Key 1. Examine the diagram below. There are two homologous copies of chromosome one and the allele of YFG carried on the light gray chromosome has undergone a loss-of-function
RNA Processing in Eukaryotes *
 OpenStax-CNX module: m44532 1 RNA Processing in Eukaryotes * OpenStax This work is produced by OpenStax-CNX and licensed under the Creative Commons Attribution License 3.0 By the end of this section, you
Mitosis and the Cell Cycle
 Mitosis and the Cell Cycle Chapter 12 The Cell Cycle: Cell Growth & Cell Division Where it all began You started as a cell smaller than a period at the end of a sentence Getting from there to here Cell
Neoplasia 18 lecture 6. Dr Heyam Awad MD, FRCPath
 Neoplasia 18 lecture 6 Dr Heyam Awad MD, FRCPath ILOS 1. understand the role of TGF beta, contact inhibition and APC in tumorigenesis. 2. implement the above knowledge in understanding histopathology reports.
Last time we talked about the few steps in viral replication cycle and the un-coating stage:
 Zeina Al-Momani Last time we talked about the few steps in viral replication cycle and the un-coating stage: Un-coating: is a general term for the events which occur after penetration, we talked about
Oncogenes and Tumor Suppressors MCB 5068 November 12, 2013 Jason Weber
 Oncogenes and Tumor Suppressors MCB 5068 November 12, 2013 Jason Weber jweber@dom.wustl.edu Oncogenes & Cancer DNA Tumor Viruses Simian Virus 40 p300 prb p53 Large T Antigen Human Adenovirus p300 E1A
L I F E S C I E N C E S
 1a L I F E S C I E N C E S 5 -UUA AUA UUC GAA AGC UGC AUC GAA AAC UGU GAA UCA-3 5 -TTA ATA TTC GAA AGC TGC ATC GAA AAC TGT GAA TCA-3 3 -AAT TAT AAG CTT TCG ACG TAG CTT TTG ACA CTT AGT-5 NOVEMBER 2, 2006
RNA (Ribonucleic acid)
") RNA (Ribonucleic acid) Structure: Similar to that of DNA except: 1- it is single stranded polunucleotide chain. 2- Sugar is ribose 3- Uracil is instead of thymine There are 3 types of RNA: 1- Ribosomal
RNA (Ribonucleic acid) Structure: Similar to that of DNA except: 1- it is single stranded polunucleotide chain. 2- Sugar is ribose 3- Uracil is instead of thymine There are 3 types of RNA: 1- Ribosomal
Division Ave. High School AP Biology
 Regulation of Cell Division 2008-2009 Coordination of cell division A multicellular organism needs to coordinate cell division across different tissues & organs u critical for normal growth, development
Genetics and Genomics in Medicine Chapter 6 Questions
 Genetics and Genomics in Medicine Chapter 6 Questions Multiple Choice Questions Question 6.1 With respect to the interconversion between open and condensed chromatin shown below: Which of the directions
BIT 120. Copy of Cancer/HIV Lecture
 BIT 120 Copy of Cancer/HIV Lecture Cancer DEFINITION Any abnormal growth of cells that has malignant potential i.e.. Leukemia Uncontrolled mitosis in WBC Genetic disease caused by an accumulation of mutations
1. Identify and characterize interesting phenomena! 2. Characterization should stimulate some questions/models! 3. Combine biochemistry and genetics
 1. Identify and characterize interesting phenomena! 2. Characterization should stimulate some questions/models! 3. Combine biochemistry and genetics to gain mechanistic insight! 4. Return to step 2, as
RNA interference (RNAi)
") RN interference (RNi) Natasha aplen ene Silencing Section Office of Science and Technology Partnerships Office of the Director enter for ancer Research National ancer Institute ncaplen@mail.nih.gov Plants
RN interference (RNi) Natasha aplen ene Silencing Section Office of Science and Technology Partnerships Office of the Director enter for ancer Research National ancer Institute ncaplen@mail.nih.gov Plants
Investigating the regulation of mirna biogenesis and Argonaute2 by RNA binding proteins
 Investigating the regulation of mirna biogenesis and Argonaute2 by RNA binding proteins Patrick Peter Connerty Supervisor: Gyorgy Hutvagner Thesis Submitted for the Degree of Doctor of Philosophy (Science)
MCB Chapter 11. Topic E. Splicing mechanism Nuclear Transport Alternative control modes. Reading :
 MCB Chapter 11 Topic E Splicing mechanism Nuclear Transport Alternative control modes Reading : 419-449 Topic E Michal Linial 14 Jan 2004 1 Self-splicing group I introns were the first examples of catalytic
The clinical relevance of circulating, cell-free and exosomal micrornas as biomarkers for gynecological tumors
 Department of Tumor Biology The clinical relevance of circulating, cell-free and exosomal micrornas as biomarkers for gynecological tumors cfdna Copenhagen April 6-7, 2017 Heidi Schwarzenbach, PhD Tumor
micrornas: the future for cancer therapy?
 micrornas: the future for cancer therapy? Improving cervical cancer treatment Tim Huitema - 02-07-2010 Medical Oncology and Gynaecological Oncology, UMC Groningen Supervisor: Dr. Bea Wisman Abstract Cervical
Molecular Cell Biology - Problem Drill 10: Gene Expression in Eukaryotes
 Molecular Cell Biology - Problem Drill 10: Gene Expression in Eukaryotes Question No. 1 of 10 1. Which of the following statements about gene expression control in eukaryotes is correct? Question #1 (A)
MicroRNAs: novel regulators in skin research
 MicroRNAs: novel regulators in skin research Eniko Sonkoly, Andor Pivarcsi KI, Department of Medicine, Unit of Dermatology and Venerology What are micrornas? Small, ~21-mer RNAs 1993: The first mirna discovered,
Bihong Zhao, M.D, Ph.D Department of Pathology
 Bihong Zhao, M.D, Ph.D Department of Pathology 04-28-2009 Is tumor self or non-self? How are tumor antigens generated? What are they? How does immune system respond? Introduction Tumor Antigens/Categories
Part-4. Cell cycle regulatory protein 5 (Cdk5) A novel target of ERK in Carb induced cell death
 A novel target of ERK in Carb induced cell death") Part-4 Cell cycle regulatory protein 5 (Cdk5) A novel target of ERK in Carb induced cell death 95 1. Introduction The process of replicating DNA and dividing cells can be described as a series of coordinated
Part-4 Cell cycle regulatory protein 5 (Cdk5) A novel target of ERK in Carb induced cell death 95 1. Introduction The process of replicating DNA and dividing cells can be described as a series of coordinated