SUSAN G. KOMEN GREATER ATLANTA
|
|
|
- Kellie Miller
- 6 years ago
- Views:
Transcription


1 SUSAN G. KOMEN GREATER ATLANTA
2 Table of Contents Table of Contents... 2 Acknowledgments... 3 Executive Summary... 4 Introduction to the Community Profile Report... 4 Quantitative Data: Measuring Breast Cancer Impact in Local Communities... 5 Health System and Public Policy Analysis... 6 Qualitative Data: Ensuring Community Input... 7 Mission Action Plan... 8 Introduction Affiliate History Affiliate Organizational Structure Affiliate Service Area Purpose of the Community Profile Report Quantitative Data: Measuring Breast Cancer Impact in Local Communities Quantitative Data Report Selection of Target Communities Health Systems and Public Policy Analysis Health Systems Analysis Data Sources Health Systems Overview Public Policy Overview Health Systems and Public Policy Analysis Findings Qualitative Data: Ensuring Community Input Qualitative Data Sources and Methodology Overview Qualitative Data Overview Qualitative Data Findings Mission Action Plan Breast Health and Breast Cancer Findings of the Target Communities Mission Action Plan References P age
3 Acknowledgments The Community Profile Report could not have been accomplished without the exceptional work, effort, time and commitment from many people involved in the process. would like to extend its deepest gratitude to the Board of Directors and staff and the following individuals who participated on the 2015 Community Profile Team: Michael Cohen, MD Director, Division of Breast Imaging Emory Health Care Professor, Department of Radiology Emory University School of Medicine Kim Hartsock Partner Warren Averett, LLC Board President Susan G. Komen Greater Atlanta Lila L. Hertz Grants Committee Chairperson Susan G. Komen Greater Atlanta Meredith Sidewater Senior Vice President and General Counsel LexisNexis A special thank you to the following for their assistance with data collection and analyses, as well as providing information included in this report: Poorvi Soni Louise Palmer Komen Greater Atlanta grantees and community partners (names withheld for anonymity) Report Prepared by: 3525 Piedmont Road Building 5, Suite 215 Atlanta, Georgia P age
4 Executive Summary Introduction to the Community Profile Report Nancy G. Brinker promised her dying sister, Susan G. Komen, she would do everything in her power to end breast cancer forever. In 1982, that promise became Susan G. Komen, which is the world s largest breast cancer organization and the largest source of nonprofit funds dedicated to the fight against breast cancer. was founded in 1991 by an all-volunteer board. Komen Greater Atlanta serves as a resource for those seeking opportunities for breast health education, screening, and treatment support and hosts several events and programs to raise awareness and educate the community about the benefits of early detection in the fight against breast cancer. Komen Greater Atlanta s thirteen-county service area includes more than 47 percent of the state's population and is comprised of more than 4.7 million people. The thirteencounty service area includes: Cherokee, Cobb, Clayton, Coweta, DeKalb, Douglas, Fayette, Forsyth, Fulton, Gwinnett, Henry, Newton, and Rockdale counties. Through annual events including the Susan G. Komen Race for the Cure, Bubbles & Bling and other fundraising, Komen Greater Atlanta raises funds that enable women and men to detect and survive breast cancer. Up to 75 percent of all funds raised by Komen Greater Atlanta stay in Atlanta to fund breast health programs for those who would not otherwise have access to screening and treatment support. Twenty-five percent of funds raised support the national Komen Foundation Award and Research Grant Program. Since its inception, Komen Greater Atlanta has raised over $41 million to provide breast health education, screenings, diagnostics, and support to breast cancer patients and their families and to support breast cancer research. Purpose of the Community Profile Report The purpose of the Susan G. Komen Greater Atlanta Community Profile is to provide current and comprehensive information about the status of breast health, breast cancer, and related services within the Komen Greater Atlanta 13-county service area. The 2015 Community Profile is meant to build upon previous editions of the report, and it provides an expanded overview of both quantitative and qualitative data. The information contained in this report comes from a variety of local, state, and federal sources. It also includes information collected from a diverse group of individuals living and providing services within the service area. While preparing the report, Komen Greater Atlanta made a concerted effort to include varied data sources and community voices to ensure a wellrounded perspective of breast health and breast cancer services within the Komen Greater Atlanta community. Findings from the 2015 Community Profile are instrumental in identifying specific strategies to address the gaps and barriers to accessing care, assessing the availability of breast health services and supporting Komen Greater Atlanta s mission to enable women and men to detect and survive breast cancer. Research contained in this document will help to: Shape the future direction for the organization s grant programs, Guide future public policy initiatives, Drive inclusion and access to care efforts in the community, Help expand community education and mobilization efforts and Develop strong collaborations and partnerships. 4 P age
5 The completed Community Profile will be shared with stakeholders in the local breast cancer community via normal Komen Greater Atlanta public relations vehicles, including the organization s annual report and print, television, and online media efforts. Additionally, information sessions will be held for current and potential community partners, health care providers, and volunteers. Quantitative Data: Measuring Breast Cancer Impact in Local Communities Komen Greater Atlanta s service area as a whole has higher age-adjusted breast cancer incidence rates, death rates, and late-stage diagnosis rates than the state as a whole, and Georgia fares worse on these measures than does the general population in the United States. Komen Greater Atlanta endeavors to serve individuals throughout all 13 counties because the need is high throughout the service area. However, in order to focus the organization s resources and goals over the next four years, Komen Greater Atlanta has chosen five target communities within the service area. Target communities are those that are at the greatest risk for experiencing gaps in breast health services, barriers in access to care, or those that are home to populations most vulnerable to experiencing poor breast health outcomes. The selection of Komen Greater Atlanta s target communities was based primarily on data from Healthy People 2020, a comprehensive United States federal government initiative that sets measurable objectives for improving community health outcomes. While Healthy People 2020 measures a variety of health outcomes, Komen Greater Atlanta reviewed goals relating to reducing late-stage breast cancer diagnosis (defined as regional and distant stages) and breast cancer deaths. Target communities were chosen based on the amount of time communities are anticipated to need in order to meet Healthy People 2020 breast cancer targets. In addition to Healthy People 2020 data, Komen Greater Atlanta also reviewed the following county level data when selecting target communities: Incidence rates and trends Death rates and trends Late-stage rates and trends Breast cancer screening percentages Percentage of residents living below the federal poverty level Percentage of residents living without health insurance Unemployment levels Percentage of residents who are linguistically isolated and/or foreign born. Based on these criteria, Komen Greater Atlanta has chosen the following target communities: Cherokee County Clayton County DeKalb County Fulton County Henry County 5 P age
6 Health System and Public Policy Analysis The Health Systems Analysis is intended to identify facilities and providers through which individuals in the service area may enter the breast health continuum of care, as well as to identify coverage gaps in the target communities. Data for the Health Systems Analysis was compiled from a wide variety of local, state, and federal resources listing breast health resources including: The Food and Drug Administration s list of certified mammography centers The National Association of County and City Health Official s list of health departments Lists of Health Centers and Free Clinics Lists of specially accredited or certified centers Komen Greater Atlanta staff also used existing relationships with the local breast cancer community to identify facilities, in addition to conducting internet searches to locate any services and resources that may have previously been unknown to Komen Greater Atlanta. The Health Systems Analysis found that Cherokee, Clayton, and Henry counties lack adequate numbers of breast health care providers who see uninsured or underinsured women. While there are several providers in Fulton and DeKalb Counties, these counties continue to see high breast cancer death rates. This indicates that, while services are widely available within these areas, there still must be significant barriers preventing women from accessing them. In addition to assessing the structure and availability of services in the target communities, Komen Greater Atlanta also conducted an assessment of local, state, and federal policies that impact access to breast health care in the service area. Based on this policy review, Komen Greater Atlanta s public policy priorities are: Expand Medicaid: Despite the restrictions placed on Medicaid expansion, Georgia would greatly benefit in expanding Medicaid to low-income, childless adults. Increased accessibility to insurance and health care would allow for thousands of women to receive recommended screenings, address risk factors, and receive necessary treatment for breast cancer. Additionally, by providing coverage to this population of women, funding for National Breast and Cervical Cancer Early Detection Program services can be redirected to reach additional populations not covered by insurance, especially immigrant women and women with language and literacy barriers that limit their utilization of screenings and services. Further reduce the cost of oral anticancer medication: Although the passage of the Cancer Fairness Treatment Act greatly improves upon the parity issue surrounding oral therapies, the cap on out-of-pocket costs to the patient remains too high for many lowincome patients. Consequently, treatment compliance will be negatively affected within this population, hindering successful treatment and recovery. Despite the many recent changes to preventative measures and access to care, gaps still exist among women in Komen Greater Atlanta s service area. Undocumented immigrants are exempt from receiving federal or state financed health coverage and represent a significant population that lacks proper access to screening and treatment services. Additionally, women with language and literacy barriers are often unaware of their screening options and providers. Consequently, Komen Greater Atlanta seeks to improve accessibility of services among this population with outreach efforts and by funding service providers within immigrant populations to facilitate communication and better use of offered services. 6 P age
7 Qualitative Data: Ensuring Community Input Since there is often a disconnect between provider suggestions and recommendations and what the community expresses that they want and need, the Affiliate sought to gain input from the community members themselves. This section of the Community Profile aimed to assess barriers to care that may not be captured by quantitative data. Focus groups and key informant interviews were conducted to determine the breast health knowledge, screening behaviors, identified barriers and awareness of women living within the five target counties. Women in the target communities who had sought access to breast screenings in the last two years (whether or not the screening was completed) and breast cancer survivors were primarily involved in the focus groups. Breast health care providers participated in key informant interviews to explain barriers to care from an institutional perspective or those they have experienced as they navigate patients through the continuum of care. Ten focus groups and forty key informant interviews were attempted; seven focus groups and 28 interviews were completed. The interviews and focus groups were designed to investigate three primary questions: To what extent are there barriers to accessing breast health services* in Clayton, Cherokee, Dekalb, Fulton, and Henry Counties? To what extent are there gaps in breast health continuum of care in Clayton, Cherokee, Dekalb, Fulton, and Henry Counties? To what extent are women satisfied with the breast health services they have received in Clayton, Cherokee, Dekalb, Fulton, and Henry Counties? *Breast health services include breast cancer screening, diagnosis, and treatment services The focus groups explored what, if any, challenges prevent women from accessing breast cancer screening, diagnosis, and treatment services. Across counties, several common barriers emerged that prevent women from accessing breast health care services across the breast cancer care spectrum, from risk reduction to treatment including: Finances and the inability to pay for services Attitudes towards breast cancer, such as fear and stigma Factors related to culture and race/ethnicity, such as a lack of culturally appropriate information and providers Challenges navigating the health care system for services and resources Lack of prioritization of breast cancer as an urgent health issue affecting their community Lack of free or low cost transportation to health care facilities Lack of knowledge about breast cancer in the community at large Key informant interviews largely supported the findings of the focus groups but also showed that providers lack knowledge about how and where to refer uninsured and underinsured patients for breast health services. 7 P age
8 Mission Action Plan Based on the findings of the Community Profile, Komen Greater Atlanta developed five problem statements to summarize the gaps in care in the target communities. Komen Greater Atlanta then developed the Mission Action Plan to guide the organization s mission work for the next two years. The Mission Action Plan will be updated biannually and rewritten with the Community Profile every four years so that Komen Greater Atlanta s mission work will remain focused on the populations in the service area who experience the most barriers in accessing high quality breast health care and achieving positive breast cancer outcomes. Problem Statements According to the Quantitative Data, nine out of13 counties within the service area are 13 or more years away from meeting either the Healthy People 2020 breast cancer death rate target or the late-stage diagnosis target. Of these, four counties (Clayton, DeKalb, Fulton and Henry) are projected to need more than 13 years to meet both targets. Cherokee County is projected to need more than 13 years to meet the late-stage diagnosis target and more than seven years to meet the death rate target. According to the Quantitative Data, despite mammography rates at or above the national average, women in the service area experience high late-stage breast cancer diagnosis rates and high breast cancer death rates. According to the Qualitative Data, individuals in the service area have difficulty accessing affordable mammography and other breast health services. According to the Qualitative Data, culturally competent education and care are not widely available for all people seeking breast health services. Women of color, LGBT individuals, recent immigrants and individuals living below 250 percent of the federal poverty level may be disproportionately impacted and may delay or be denied care due to their socioeconomic status. According to the Qualitative Data, breast cancer survivors in the service area have limited access to navigation and support services after their active treatment phase is completed. Health Systems Change Priority 1: Increase the number of free or affordable breast health services available in the service area with a focus on Cherokee, Clayton, DeKalb, Fulton and Henry counties. Objective 1: By December 2015, recruit at least two new grant applicants focused on providing services in one or more of the target counties. Objective 2: Beginning with the FY2017 Community Grant Request for Application (RFA), programs that provide breast screenings serial and other as well as diagnostic services in the target counties will be a funding priority. Objective 3: Programs that offer co-pay assistance to under-insured women in the target communities will be a funding priority beginning with the FY2018 Community Grant Request for Application (RFA). Priority 2: Reduce non-financial socioeconomic barriers to screening and diagnostic services in the target communities. Objective 1: By December 2015, host a conversation for grant applicants and grantees to discuss transportation and translation challenges. 8 P age
9 Objective 2: By the end of FY 2017, ensure that grantees in all counties have transportation and translation service plans in place as indicated by the Community Grant RFA. Objective 3: By the close of FY19, develop a strategy to build trust in the Black/African- American community to alleviate fear and increase the number of women screened from the highest need communities by 5%. Education and Outreach Priority 1: Provide only evidence based breast health education in target communities. Objective 1: By the end of FY 2016, eliminate broad education funding to other organizations and bring overall education funding to below ten percent of total grant expenses. Provide education grants only to grantees that show specific education needs in their target communities. Objective 2: By December 2015, through site visits and reporting confirm that all grantees are in compliance with Komen Breast Self-Awareness messages. Objective 3: By the end of FY 2017, hold at least three Komen Greater Atlanta survivorship events in different target communities in the service area. Objective 4: In cooperation with grantees or community partners, present ten educational programs to members of Black/African-American, Hispanic/Latina, LGBTQ or recent immigrant communities by December Partnerships Priority 1: Increase access to the breast health continuum of care through developing partnerships in the target communities. Objective 1: By the end of FY 2019, establish two partnerships outside of the grant making process to maximize the reach & expertise of each organization to increase the impact on target communities. Public Policy Priority 1: Develop and utilize partnerships to enhance public policy efforts in order to improve breast health outcomes in the service area. Objective 1: By December 2016, have five meetings or co-sponsored events with state and/or federal lawmakers in order to encourage policy that supports access to breast health services. Objective 2: By the end of FY 2016, partner with one other Komen or local organization to host an event highlighting Komen Greater Atlanta public policy efforts and priorities. Objective 3: By the end of FY 2019, collaborate with two organizations that have an established advocacy program that supports Komen s public policy priorities. Disclaimer: Comprehensive data for the Executive Summary can be found in the 2015 Susan G. Komen Greater Atlanta Community Profile Report. 9 P age

10 Introduction Affiliate History Nancy G. Brinker promised her dying sister, Susan G. Komen, she would do everything in her power to end breast cancer forever. In 1982, that promise became Susan G. Komen, which is the world s largest breast cancer organization and the largest source of nonprofit funds dedicated to the fight against breast cancer. was founded in 1991 by an all-volunteer board. Komen Greater Atlanta serves as a resource for those seeking opportunities for breast health education, screening, treatment and support and hosts several events and programs to raise awareness and educate the community about the benefits of early detection in the fight against breast cancer. Komen Greater Atlanta s thirteen-county service area includes more than 47 percent of the state's population, serving more than 4.6 million people. The thirteen-county service area includes: Cherokee, Cobb, Coweta, Clayton, DeKalb, Douglas, Fayette, Forsyth, Fulton, Gwinnett, Henry, Newton and Rockdale Counties. Through annual events including the Race for the Cure, Bubbles & Bling and other fundraising, Komen Greater Atlanta raises funds that enable women and men to detect and survive breast cancer. Up to 75 percent of all funds raised by Komen Greater Atlanta stay in Atlanta to fund breast health programs for those who would not otherwise have access to screening and treatment. Twenty-five percent of funds raised support the national Komen Foundation Award and Research Grant Program. Since its inception, Komen Greater Atlanta has raised over $38 million to provide breast health education, screenings, diagnostics, and support to breast cancer patients and their families and to support breast cancer research (Figure 1.1). $2,500, $2,250, $2,000, $1,750, $1,500, $1,250, $1,000, $750, $500, $250, $ Figure 1.1. Amount of funding Komen Greater Atlanta has distributed to the local service area The first Komen Greater Atlanta community grants were awarded in 1993 to three local organizations in the total amount of $22,000. Seventeen years later, Komen Greater Atlanta awarded 100 times that original amount, providing $2.2 million to 26 different grant programs in 10 P age
11 2010. In 2014, Komen Greater Atlanta granted nearly $1.6 million to 18 screening, diagnostic, and treatment support initiatives serving the most medically underserved residents of metro Atlanta. Komen Greater Atlanta also serves as a leader in breast health education and advocacy in metro Atlanta and the state of Georgia. Komen Greater Atlanta is regularly sought out to provide expertise and opinions on the state of breast health and access to breast health care and is a leader in coalitions to advocate for individuals with metastatic breast cancer and for oral chemotherapy parity in insurance coverage. Komen Greater Atlanta provides breast health education to more than 115,000 people annually, and its flagship education program, Worship in Pink, was awarded a Georgia Access to Care, Treatment, and Services (ACTS) Breast Cancer Grant in 2012 and in 2014 to expand its successful education programs into communities with high incidence of late-stage breast cancer diagnoses and high breast cancer death rates. Affiliate Organizational Structure Executive Director Mission Manager Operations Manager Development Manager Special Events & Volunteer Manager Special Events Coordinator Affiliate Service Area Figure 1.2. Komen Greater Atlanta organizational structure According to 2013 US Census Bureau estimates, the population of the state of Georgia is approximately 9,992,167 people, and the thirteen-county Komen Greater Atlanta service area is home to 4,737,275 people in the northern and central portions of the state. This accounts for more than 47 percent of the state s general population and 46 percent of the state s female population. At the core of Komen Greater Atlanta s service area (Figure 1.3) is the City of Atlanta, the state capitol and a large urban metropolitan area, located in Fulton and DeKalb Counties. Other counties in the service area are comprised of suburban, exurban, and rural areas. 11 P age


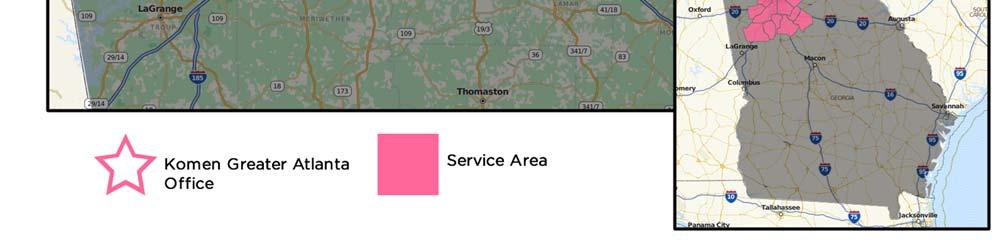
12 Figure 1.3. Susan G. Komen Greater Atlanta service area 12 P age


13 Availability of public services including public transit varies between counties with central counties having rail and bus service and peripheral counties having no public transit or taxi services. The population of the Komen Greater Atlanta service area is racially and culturally diverse with 56 percent of the female population identifying as White and 44 percent identifying as non-white (Table 1.1 and Figure 1.4). Hispanic and/or Latina women comprise 9.5 percent of the population (Figure 1.5). More than 15 percent of people in the service area are foreign-born, and nearly five percent are linguistically isolated. The service area is also disproportionately comprised of medically underserved communities and communities in poverty. Approximately one in five people in the state and service area have no health insurance. Table 1.1. Socioeconomic characteristics of the service area Income Below Income Below Linguistically Medically Underserved No Health 100% Poverty 250% Poverty Unemployed Foreign Born Isolated Rural Areas Area Insurance Komen Atlanta Service Area 13.3% 31.7% 10.0% 15.1% 4.8% 5.1% 17.8% 20.6% Cherokee County 7.7% 24.4% 7.3% 8.5% 2.7% 17.1% 12.3% 18.1% Clayton County 18.4% 48.1% 14.4% 14.7% 5.9% 90.0% 0.0% 25.3% Cobb County 11.3% 26.2% 8.5% 15.2% 4.0% 20.0% 0.0% 18.2% Coweta County 11.1% 28.7% 7.0% 5.7% 2.1% 32.9% 91.6% 16.6% DeKalb County 17.1% 36.4% 12.5% 16.3% 5.6% 30.0% 9.0% 23.1% Douglas County 12.7% 34.1% 12.3% 8.6% 2.3% 15.8% 0.0% 20.0% Fayette County 5.9% 16.1% 7.0% 9.1% 1.6% 18.2% 0.1% 11.4% Forsyth County 6.6% 16.8% 7.4% 13.2% 3.6% 9.9% 100.0% 14.6% Fulton County 15.9% 34.8% 9.8% 12.8% 3.8% 1.1% 13.0% 22.1% Gwinnett County 12.4% 31.6% 9.2% 25.5% 9.8% 50.0% 0.0% 22.3% Henry County 9.5% 29.8% 9.6% 7.4% 1.5% 13.9% 100.0% 17.8% Newton County 14.0% 40.2% 12.6% 6.5% 1.3% 31.2% 100.0% 22.1% Rockdale County 12.9% 35.5% 12.6% 11.4% 3.0% 14.9% 0.0% 22.1% KOMEN GREATER ATLANTA SERVICE AREA BY RACE KOMEN GREATER ATLANTA SERVICE AREA ETHNICITY White Black Non Hispanic/Latina Hispanic/Latina American Indian/Alaska Native Asian Pacific Islander Figures 1.4 and 1.5. Racial and ethnic characteristics of the service area 13 P age
14 Purpose of the Community Profile Report The purpose of the Susan G. Komen Greater Atlanta Community Profile is to provide current and comprehensive information about the status of breast health, breast cancer, and related services within the Komen Greater Atlanta 13-county service area. The 2015 Community Profile is meant to build upon previous editions of the report, and it provides an expanded overview of both quantitative and qualitative data. The information contained in this report comes from a variety of local, state, and federal sources. It also includes information collected from a diverse group of individuals living and providing services within the service area. While preparing the report, Komen Greater Atlanta made a concerted effort to include varied data sources and community voices to ensure a wellrounded perspective of breast health and breast cancer services within the Komen Greater Atlanta community. Findings from the 2015 Community Profile are instrumental in identifying specific strategies to address the gaps and barriers to accessing care, assessing the availability of breast health services and supporting Komen Greater Atlanta s mission to enable women and men to detect and survive breast cancer. Research contained in this document will help to: Shape the future direction for the organization s grant programs, Guide future public policy initiatives, Drive inclusion and access to care efforts in the community, Help expand community education and mobilization efforts and Develop strong collaborations and partnerships. The completed Community Profile will be shared with stakeholders in the local breast cancer community via normal Komen Greater Atlanta public relations vehicles including the organization s annual report and print, television, and online media efforts. Additionally, information sessions will be held for current and potential community partners, health care providers, and volunteers. 14 P age
15 Quantitative Data: Measuring Breast Cancer Impact in Local Communities Quantitative Data Report Introduction The purpose of the quantitative data report for is to combine evidence from many credible sources and use the data to identify the highest priority areas for evidence-based breast cancer programs. The data provided in the report are used to identify priorities within the Affiliate s service area based on estimates of how long it would take an area to achieve Healthy People 2020 objectives for breast cancer late-stage diagnosis and death rates ( The following is a summary of Komen Greater Atlanta s Quantitative Data Report. For a full report please contact the Affiliate. Breast Cancer Statistics Incidence rates The breast cancer incidence rate shows the frequency of new cases of breast cancer among women living in an area during a certain time period (Table 2.1). Incidence rates may be calculated for all women or for specific groups of women (e.g. for Asian/Pacific Islander women living in the area). The female breast cancer incidence rate is calculated as the number of females in an area who were diagnosed with breast cancer divided by the total number of females living in that area. Incidence rates are usually expressed in terms of 100,000 people. For example, suppose there are 50,000 females living in an area and 60 of them are diagnosed with breast cancer during a certain time period. Sixty out of 50,000 is the same as 120 out of 100,000. So the female breast cancer incidence rate would be reported as 120 per 100,000 for that time period. When comparing breast cancer rates for an area where many older people live to rates for an area where younger people live, it s hard to know whether the differences are due to age or whether other factors might also be involved. To account for age, breast cancer rates are usually adjusted to a common standard age distribution. Using age-adjusted rates makes it possible to spot differences in breast cancer rates caused by factors other than differences in age between groups of women. To show trends (changes over time) in cancer incidence, data for the annual percent change in the incidence rate over a five-year period were included in the report. The annual percent change is the average year-to-year change of the incidence rate. It may be either a positive or negative number. A negative value means that the rates are getting lower. A positive value means that the rates are getting higher. A positive value (rates getting higher) may seem undesirable and it generally is. However, it s important to remember that an increase in breast cancer incidence could also mean that more breast cancers are being found because more women are getting mammograms. So higher rates don t necessarily mean that there has been an increase in the occurrence of breast cancer. 15 P age
16 Death rates The breast cancer death rate shows the frequency of death from breast cancer among women living in a given area during a certain time period (Table 2.1). Like incidence rates, death rates may be calculated for all women or for specific groups of women (e.g. Black/African-American women). The death rate is calculated as the number of women from a particular geographic area who died from breast cancer divided by the total number of women living in that area. Death rates are shown in terms of 100,000 women and adjusted for age. Data are included for the annual percent change in the death rate over a five-year period. The meanings of these data are the same as for incidence rates, with one exception. Changes in screening don t affect death rates in the way that they affect incidence rates. So a negative value, which means that death rates are getting lower, is always desirable. A positive value, which means that death rates are getting higher, is always undesirable. Late-stage incidence rates For this report, late-stage breast cancer is defined as regional or distant stage using the Surveillance, Epidemiology and End Results (SEER) Summary Stage definitions ( State and national reporting usually uses the SEER Summary Stage. It provides a consistent set of definitions of stages for historical comparisons. The late-stage breast cancer incidence rate is calculated as the number of women with regional or distant breast cancer in a particular geographic area divided by the number of women living in that area (Table 2.1). Late-stage incidence rates are shown in terms of 100,000 women and adjusted for age. 16 P age
17 Table 2.1. Female breast cancer incidence rates and trends, death rates and trends, and late-stage rates and trends Incidence Rates and Trends Death Rates and Trends Late-stage Rates and Trends Population Group Female Population (Annual Average) # of New Cases (Annual Average) Ageadjusted Rate/ 100,000 Trend (Annual Percent Change) # of Deaths (Annual Average) Ageadjusted Rate/ 100,000 Trend (Annual Percent Change) # of New Cases (Annual Average) Ageadjusted Rate/ 100,000 Trend (Annual Percent Change) US 154,540, , % 40, % 64, % HP * * - Georgia 4,838,820 5, % 1, % 2, % Komen Greater Atlanta Service Area 2,249,867 2, % NA 1, % White 1,270,141 1, % NA % Black/African-American 841, % NA % American Indian/Alaska Native (AIAN) Asian Pacific Islander (API) 11,834 SN SN SN SN SN SN SN SN SN 126, % NA % Non-Hispanic/ Latina 2,036,045 2, % NA % Hispanic/ Latina 213, % NA % Cherokee County - GA 104, % % % Clayton County - GA 135, % % % Cobb County - GA 347, % % % Coweta County - GA 61, % % % DeKalb County - GA 357, % % % Douglas County - GA 66, % % % Fayette County - GA 54, % % % Forsyth County - GA 82, % % % Fulton County - GA 453, % % % Gwinnett County - GA 392, % % % Henry County - GA 100, % % % Newton County - GA 50, % % % Rockdale County - GA 43, % % % *Target as of the writing of this report. NA data not available SN data suppressed due to small numbers (15 cases or fewer for the 5-year data period). Data are for years Rates are in cases or deaths per 100,000. Age-adjusted rates are adjusted to the 2000 US standard population. Source of incidence and late-stage data: : North American Association of Central Cancer Registries (NAACCR) Cancer in North America (CINA) Deluxe Analytic File. Source of death rate data: Centers for Disease Control and Prevention (CDC) National Center for Health Statistics (NCHS) death data in SEER*Stat. Source of death trend data: National Cancer Institute (NCI)/CDC State Cancer Profiles. Incidence rates and trends summary Overall, the breast cancer incidence rate in the Komen Greater Atlanta service area was higher than that observed in the US as a whole and the incidence trend was slightly higher than the US 17 P age
18 as a whole. The incidence rate of the service area was significantly higher than that observed for the State of Georgia and the incidence trend was not significantly different than the State of Georgia. For the United States, breast cancer incidence in Blacks/African-Americans is lower than in Whites overall. The most recent estimated breast cancer incidence rates for Asians and Pacific Islanders (APIs) and American Indians and Alaska Natives (AIANs) were lower than for Non- Hispanic Whites and Blacks/African-Americans. The most recent estimated incidence rates for Hispanics/Latinas were lower than for Non-Hispanic Whites and Blacks/African-Americans. For the service area as a whole, the incidence rate was slightly lower among Blacks/African- Americans than Whites and lower among APIs than Whites. There were not enough data available within the service area to report on AIANs so comparisons cannot be made for this racial group. The incidence rate among Hispanics/Latinas was lower than among Non- Hispanics/Latinas. None of the counties in the service area had substantially different incidence rates than the service area as a whole. It s important to remember that an increase in breast cancer incidence could also mean that more breast cancers are being found because more women are getting mammograms. Death rates and trends summary Overall, the breast cancer death rate in the Komen Greater Atlanta service area was slightly higher than that observed in the US as a whole and the death rate trend was not available for comparison with the US as a whole. The death rate of the service area was not significantly different than that observed for the State of Georgia. For the United States, breast cancer death rates in Blacks/African-Americans are substantially higher than in Whites overall. The most recent estimated breast cancer death rates for APIs and AIANs were lower than for Non-Hispanic Whites and Blacks/African-Americans. The most recent estimated death rates for Hispanics/Latinas were lower than for Non-Hispanic Whites and Blacks/African-Americans. For the service area as a whole, the death rate was higher among Blacks/African-Americans than Whites and lower among APIs than Whites. There were not enough data available within the service area to report on AIANs so comparisons cannot be made for this racial group. The death rate among Hispanics/Latinas was lower than among Non- Hispanics/Latinas. The following county had a death rate significantly higher than the service area as a whole: Fulton County The death rate was significantly lower in the following county: Forsyth County Significantly less favorable trends in breast cancer death rates were observed in the following county: Clayton County The rest of the counties had death rates and trends that were not significantly different than the service area as a whole. Late-stage incidence rates and trends summary Overall, the breast cancer late-stage incidence rate in the Komen Greater Atlanta service area was slightly higher than that observed in the US as a whole and the late-stage incidence trend 18 P age
19 was higher than the US as a whole. The late-stage incidence rate and trend of the service area were not significantly different than that observed for the State of Georgia. For the United States, late-stage incidence rates in Blacks/African-Americans are higher than among Whites. Hispanics/Latinas tend to be diagnosed with late-stage breast cancers more often than Whites. For the service area as a whole, the late-stage incidence rate was higher among Blacks/African-Americans than Whites and lower among APIs than Whites. There were not enough data available within the service area to report on AIANs so comparisons cannot be made for this racial group. The late-stage incidence rate among Hispanics/Latinas was lower than among Non-Hispanics/Latinas. The following county had a late-stage incidence rate significantly higher than the service area as a whole: DeKalb County The rest of the counties had late-stage incidence rates and trends that were not significantly different than the service area as a whole. Mammography Screening Getting regular screening mammograms (and treatment if diagnosed) lowers the risk of dying from breast cancer. Screening mammography can find breast cancer early, when the chances of survival are highest. Table 2.2 shows some screening recommendations among major organizations for women at average risk. Table 2.2. Breast cancer screening recommendations for women at average risk* American Cancer Society National Comprehensive Cancer Network US Preventive Services Task Force Informed decision-making with a health care provider at age 40 Mammography every year starting at age 45 Mammography every other year beginning at age 55 *As of October 2015 Mammography every year starting at age 40 Informed decision-making with a health care provider ages Mammography every 2 years ages Because having regular mammograms lowers the chances of dying from breast cancer, it s important to know whether women are having mammograms when they should. This information can be used to identify groups of women who should be screened who need help in meeting the current recommendations for screening mammography. The Centers for Disease Control and Prevention s (CDC) Behavioral Risk Factors Surveillance System (BRFSS) collected the data on mammograms that are used in this report. The data come from interviews with women age 50 to 74 from across the United States. During the interviews, each woman was asked how long it has been since she has had a mammogram. The proportions in Table 19 P age
20 2.3 are based on the number of women age 50 to 74 who reported in 2012 having had a mammogram in the last two years. The data have been weighted to account for differences between the women who were interviewed and all the women in the area. For example, if 20.0 percent of the women interviewed are Hispanic/Latina, but only 10.0 percent of the total women in the area are Hispanic/Latina, weighting is used to account for this difference. The report uses the mammography screening proportion to show whether the women in an area are getting screening mammograms when they should. Mammography screening proportion is calculated from two pieces of information: The number of women living in an area whom the BRFSS determines should have mammograms (i.e. women age 50 to 74). The number of these women who actually had a mammogram during the past two years. The number of women who had a mammogram is divided by the number who should have had one. For example, if there are 500 women in an area who should have had mammograms and 250 of those women actually had a mammogram in the past two years, the mammography screening proportion is 50.0 percent. Because the screening proportions come from samples of women in an area and are not exact, Table 2.3 includes confidence intervals. A confidence interval is a range of values that gives an idea of how uncertain a value may be. It s shown as two numbers a lower value and a higher one. It is very unlikely that the true rate is less than the lower value or more than the higher value. For example, if screening proportion was reported as 50.0 percent, with a confidence interval of 35.0 to 65.0 percent, the real rate might not be exactly 50.0 percent, but it s very unlikely that it s less than 35.0 or more than 65.0 percent. In general, screening proportions at the county level have fairly wide confidence intervals. The confidence interval should always be considered before concluding that the screening proportion in one county is higher or lower than that in another county. 20 P age
21 Table 2.3. Proportion of women ages with screening mammography in the last two years, self-report Population Group # of Women Interviewed (Sample Size) # w/ Self- Reported Mammogram Proportion Screened (Weighted Average) Confidence Interval of Proportion Screened US 174, , % 77.2%-77.7% Georgia 2,341 1, % 78.8%-83.1% Komen Greater Atlanta Service Area % 79.9%-86.9% White % 76.2%-84.9% Black/African-American % 81.9%-93.3% AIAN SN SN SN SN API SN SN SN SN Hispanic/ Latina % 65.5%-99.2% Non-Hispanic/ Latina % 79.2%-86.4% Cherokee County - GA % 57.2%-89.9% Clayton County - GA % 75.6%-94.9% Cobb County - GA % 67.3%-88.6% Coweta County - GA % 54.1%-92.8% DeKalb County - GA % 75.9%-91.6% Douglas County - GA % 60.7%-94.4% Fayette County - GA % 66.8%-97.0% Forsyth County - GA % 56.7%-92.0% Fulton County - GA % 76.4%-92.6% Gwinnett County - GA % 70.8%-91.6% Henry County - GA % 66.1%-96.3% Newton County - GA % 51.7%-93.1% Rockdale County - GA % 56.3%-93.2% SN data suppressed due to small numbers (fewer than 10 samples). Data are for Source: CDC Behavioral Risk Factor Surveillance System (BRFSS). Breast cancer screening proportions summary The breast cancer screening proportion in the Komen Greater Atlanta service area was significantly higher than that observed in the US as a whole. The screening proportion of the service area was not significantly different than the State of Georgia. For the United States, breast cancer screening proportions among Blacks/African-Americans are similar to those among Whites overall. APIs have somewhat lower screening proportions than Whites and Blacks/African-Americans. Although data are limited, screening proportions among AIANs are similar to those among Whites. Screening proportions among Hispanics/Latinas are similar to those among Non-Hispanic Whites and Blacks/African- Americans. For the service area as a whole, the screening proportion was not significantly different among Blacks/African-Americans than Whites. There were not enough data available within the service area to report on APIs and AIANs so comparisons cannot be made for these racial groups. The screening proportion among Hispanics/Latinas was not significantly different than among Non-Hispanics/Latinas. 21 P age
22 None of the counties in the service area had substantially different screening proportions than the service area as a whole. Population Characteristics The report includes basic information about the women in each area (demographic measures) and about factors like education, income, and unemployment (socioeconomic measures) in the areas where they live (Tables 2.4 and 2.5). Demographic and socioeconomic data can be used to identify which groups of women are most in need of help and to figure out the best ways to help them. It is important to note that the report uses the race and ethnicity categories used by the US Census Bureau, and that race and ethnicity are separate and independent categories. This means that everyone is classified as both a member of one of the four race groups as well as either Hispanic/Latina or Non-Hispanic/Latina. The demographic and socioeconomic data in this report are the most recent data available for US counties. All the data are shown as percentages. However, the percentages weren t all calculated in the same way. The race, ethnicity, and age data are based on the total female population in the area (e.g. the percent of females over the age of 40). The socioeconomic data are based on all the people in the area, not just women. Income, education and unemployment data don t include children. They re based on people age 15 and older for income and unemployment and age 25 and older for education. The data on the use of English, called linguistic isolation, are based on the total number of households in the area. The Census Bureau defines a linguistically isolated household as one in which all the adults have difficulty with English. 22 P age
23 Population Group Table 2.4. Population characteristics demographics White Black /African- American AIAN API Non- Hispanic /Latina Hispanic /Latina Female Age 40 Plus Female Age 50 Plus Female Age 65 Plus US 78.8 % 14.1 % 1.4 % 5.8 % 83.8 % 16.2 % 48.3 % 34.5 % 14.8 % Georgia 62.8 % 32.9 % 0.5 % 3.7 % 91.8 % 8.2 % 45.5 % 31.0 % 12.3 % Komen Greater Atlanta Service Area 55.3 % 38.1 % 0.6 % 6.0 % 89.6 % 10.4 % 43.9 % 28.2 % 10.0 % Cherokee County - GA 90.3 % 6.9 % 0.6 % 2.3 % 90.9 % 9.1 % 46.0 % 29.7 % 10.7 % Clayton County - GA 24.7 % 69.3 % 0.7 % 5.3 % 88.2 % 11.8 % 39.8 % 24.8 % 7.7 % Cobb County - GA 66.5 % 27.9 % 0.5 % 5.1 % 88.4 % 11.6 % 45.0 % 29.0 % 10.0 % Coweta County - GA 78.2 % 19.3 % 0.4 % 2.1 % 93.8 % 6.2 % 46.7 % 30.8 % 11.8 % DeKalb County - GA 36.6 % 57.5 % 0.6 % 5.4 % 91.8 % 8.2 % 44.0 % 29.4 % 10.7 % Douglas County - GA 55.1 % 42.4 % 0.5 % 2.0 % 92.0 % 8.0 % 44.2 % 27.7 % 9.9 % Fayette County - GA 73.2 % 21.7 % 0.4 % 4.7 % 93.7 % 6.3 % 56.4 % 39.0 % 14.8 % Forsyth County - GA 88.8 % 3.5 % 0.5 % 7.1 % 91.0 % 9.0 % 46.0 % 27.3 % 10.1 % Fulton County - GA 46.2 % 47.5 % 0.4 % 5.8 % 92.7 % 7.3 % 42.7 % 28.3 % 10.6 % Gwinnett County - GA 60.8 % 26.8 % 0.9 % 11.4 % 81.0 % 19.0 % 42.1 % 25.5 % 8.1 % Henry County - GA 56.2 % 39.8 % 0.4 % 3.6 % 94.2 % 5.8 % 44.4 % 27.1 % 9.5 % Newton County - GA 55.0 % 43.4 % 0.3 % 1.2 % 95.5 % 4.5 % 44.6 % 29.0 % 11.3 % Rockdale County - GA 48.3 % 49.1 % 0.4 % 2.2 % 91.5 % 8.5 % 48.1 % 32.3 % 12.2 % Data are for Data are in the percentage of women in the population. Source: US Census Bureau Population Estimates 23 P age
24 Population Group Less than HS Education Table 2.5. Population characteristics socioeconomics Income Below 100% Poverty Income Below 250% Poverty (Age: 40-64) Unemployed Foreign Born Linguistically Isolated In Rural Areas In Medically Underserved Areas No Health Insurance (Age: 40-64) US 14.6 % 14.3 % 33.3 % 8.7 % 12.8 % 4.7 % 19.3 % 23.3 % 16.6 % Georgia 16.0 % 16.5 % 37.6 % 9.9 % 9.7 % 3.3 % 24.9 % 37.3 % 20.7 % Komen Greater Atlanta Service Area 11.5 % 13.3 % 31.7 % 10.0 % 15.1 % 4.8 % 5.1 % 17.8 % 20.6 % Cherokee County - GA 11.0 % 7.7 % 24.4 % 7.3 % 8.5 % 2.7 % 17.1 % 12.3 % 18.1 % Clayton County - GA 17.9 % 18.4 % 48.1 % 14.4 % 14.7 % 5.9 % 0.9 % 0.0 % 25.3 % Cobb County - GA 9.5 % 11.3 % 26.2 % 8.5 % 15.2 % 4.0 % 0.2 % 0.0 % 18.2 % Coweta County - GA 12.8 % 11.1 % 28.7 % 7.0 % 5.7 % 2.1 % 32.9 % 91.6 % 16.6 % DeKalb County - GA 11.7 % 17.1 % 36.4 % 12.5 % 16.3 % 5.6 % 0.3 % 9.0 % 23.1 % Douglas County - GA 13.7 % 12.7 % 34.1 % 12.3 % 8.6 % 2.3 % 15.8 % 0.0 % 20.0 % Fayette County - GA 6.5 % 5.9 % 16.1 % 7.0 % 9.1 % 1.6 % 18.2 % 0.1 % 11.4 % Forsyth County - GA 9.4 % 6.6 % 16.8 % 7.4 % 13.2 % 3.6 % 9.9 % % 14.6 % Fulton County - GA 9.9 % 15.9 % 34.8 % 9.8 % 12.8 % 3.8 % 1.1 % 13.0 % 22.1 % Gwinnett County - GA 12.9 % 12.4 % 31.6 % 9.2 % 25.5 % 9.8 % 0.5 % 0.0 % 22.3 % Henry County - GA 10.3 % 9.5 % 29.8 % 9.6 % 7.4 % 1.5 % 13.9 % % 17.8 % Newton County - GA 16.4 % 14.0 % 40.2 % 12.6 % 6.5 % 1.3 % 31.2 % % 22.1 % Rockdale County - GA 14.9 % 12.9 % 35.5 % 12.6 % 11.4 % 3.0 % 14.9 % 0.0 % 22.1 % Data are in the percentage of people (men and women) in the population. Source of health insurance data: US Census Bureau Small Area Health Insurance Estimates (SAHIE) for Source of rural population data: US Census Bureau Census Source of medically underserved data: Health Resources and Services Administration (HRSA) for Source of other data: US Census Bureau American Community Survey (ACS) for Population characteristics summary Proportionately, the Komen Greater Atlanta service area has a substantially smaller White female population than the US as a whole, a substantially larger Black/African-American female population, a slightly larger Asian and Pacific Islander (API) female population, a slightly smaller American Indian and Alaska Native (AIAN) female population, and a substantially smaller Hispanic/Latina female population. The Affiliate s female population is slightly younger than that of the US as a whole. The Affiliate s education level is slightly higher than and income level is slightly higher than those of the US as a whole. There are a slightly larger percentage of people who are unemployed in the service area. The service area has a slightly larger percentage of people who are foreign born and a slightly larger percentage of people who are linguistically isolated. There are a substantially smaller percentage of people living in rural areas, a slightly larger percentage of people without health insurance, and a substantially smaller percentage of people living in medically underserved areas. The following counties have substantially larger Black/African-American female population percentages than that of the service area as a whole: Clayton County DeKalb County Fulton County Newton County Rockdale County 24 P age
25 The following county has a substantially larger API female population percentage than that of the service area as a whole: Gwinnett County The following county has a substantially larger Hispanic/Latina female population percentage than that of the service area as a whole: Gwinnett County The following county has a substantially lower education level than that of the service area as a whole: Clayton County The following county has a substantially lower income level than that of the service area as a whole: Clayton County The following county has a substantially lower employment level than that of the service area as a whole: Clayton County The county with a substantial foreign born and linguistically isolated population is: Gwinnett County Priority Areas Healthy People 2020 forecasts Healthy People 2020 (HP2020) is a major federal government initiative that provides specific health objectives for communities and for the country as a whole. Many national health organizations use HP2020 targets to monitor progress in reducing the burden of disease and improve the health of the nation. Likewise, Komen believes it is important to refer to HP2020 to see how areas across the country are progressing towards reducing the burden of breast cancer. HP2020 has several cancer-related objectives, including: Reducing women s death rate from breast cancer (Target as of the writing of this report: 20.6 cases per 100,000 women). Reducing the number of breast cancers that are found at a late-stage (Target as of the writing of this report: 41.0 cases per 100,000 women). To see how well counties in the Komen Greater Atlanta service area are progressing toward these targets, the report uses the following information: County breast cancer death rate and late-stage diagnosis data for years 2006 to Estimates for the trend (annual percent change) in county breast cancer death rates and late-stage diagnoses for years 2006 to Both the data and the HP2020 target are age-adjusted. These data are used to estimate how many years it will take for each county to meet the HP2020 objectives. Because the target date for meeting the objective is 2020, and 2008 (the middle of the period) was used as a starting point, a county has 12 years to meet the target. 25 P age
26 Death rate and late-stage diagnosis data and trends are used to calculate whether an area will meet the HP2020 target, assuming that the trend seen in years 2006 to 2010 continues for 2011 and beyond. Identification of priority areas The purpose of this report is to combine evidence from many credible sources and use the data to identify the highest priority areas for breast cancer programs (i.e. the areas of greatest need). Classification of priority areas are based on the time needed to achieve HP2020 targets in each area. These time projections depend on both the starting point and the trends in death rates and late-stage incidence. Late-stage incidence reflects both the overall breast cancer incidence rate in the population and the mammography screening coverage. The breast cancer death rate reflects the access to care and the quality of care in the health care delivery area, as well as cancer stage at diagnosis. There has not been any indication that either one of the two HP2020 targets is more important than the other. Therefore, the report considers them equally important. Counties are classified as follows (Table 2.6): Counties that are not likely to achieve either of the HP2020 targets are considered to have the highest needs. Counties that have already achieved both targets are considered to have the lowest needs. Other counties are classified based on the number of years needed to achieve the two targets. Table 2.6. Needs/priority classification based on the projected time to achieve HP2020 breast cancer targets Time to Achieve Late-stage Incidence Reduction Target 13 years or 7-12 yrs. 0 6 yrs. Currently Unknown longer meets target Time to Achieve Death Rate Reduction Target 13 years or longer 7-12 yrs. Highest High 0 6 yrs. Medium High Currently meets target Medium Unknown Highest High Medium High Medium Medium Low Medium High Medium High Medium Medium Low Medium Medium Low Low Highest Medium High Medium Low Low Lowest Lowest Medium Low Lowest Unknown If the time to achieve a target cannot be calculated for one of the HP2020 indicators, then the county is classified based on the other indicator. If both indicators are missing, then the county is not classified. This doesn t mean that the county may not have high needs; it only means that sufficient data are not available to classify the county. Service Area Healthy People 2020 Forecasts and Priority Areas The results presented in Table 2.7 help identify which counties have the greatest needs when it comes to meeting the HP2020 breast cancer targets. 26 P age
27 For counties in the 13 years or longer category, current trends would need to change to achieve the target. Some counties may currently meet the target but their rates are increasing and they could fail to meet the target if the trend is not reversed. Trends can change for a number of reasons, including: Improved screening programs could lead to breast cancers being diagnosed earlier, resulting in a decrease in both late-stage incidence rates and death rates. Improved socioeconomic conditions, such as reductions in poverty and linguistic isolation could lead to more timely treatment of breast cancer, causing a decrease in death rates. The data in this table should be considered together with other information on factors that affect breast cancer death rates such as screening percentages and key breast cancer death determinants such as poverty and linguistic isolation. Table 2.7. Intervention priorities for Komen Greater Atlanta service area with predicted time to achieve the HP2020 breast cancer targets and key population characteristics County Priority Predicted Time to Achieve Death Rate Target Predicted Time to Achieve Late-stage Incidence Target Key Population Characteristics Clayton County - GA Highest 13 years or longer 13 years or longer %Black/African-American, education, poverty, employment DeKalb County - GA Highest 13 years or longer 13 years or longer %Black/African-American Fulton County - GA Highest 13 years or longer 13 years or longer %Black/African-American Henry County - GA Highest 13 years or longer 13 years or longer Rural, medically underserved Cherokee County - GA High 7 years 13 years or longer Rural Douglas County - GA Medium High 13 years or longer 3 years Rural Fayette County - GA Medium High 1 year 13 years or longer Rural Gwinnett County - GA Medium High 4 years 13 years or longer %API, %Hispanic/Latina, foreign, language Cobb County - GA Medium 7 years 2 years Newton County - GA Medium 13 years or longer Currently meets target %Black/African-American, rural, medically underserved Coweta County - GA Medium Low 2 years 2 years Rural, medically underserved Rockdale County - GA Low 2 years Currently meets target Forsyth County - GA Lowest Currently meets target Currently meets target NA data not available. SN data suppressed due to small numbers (15 cases or fewer for the 5-year data period). %Black/African-American, rural Medically underserved 27 P age

28 Map of Intervention Priority Areas Figure 2.1 shows a map of the intervention priorities for the counties in the service area. When both of the indicators used to establish a priority for a county are not available, the priority is shown as undetermined on the map. Figure 2.1. Intervention priorities Data Limitations The following data limitations need to be considered when utilizing the data of the Quantitative Data Report: The most recent data available were used but, for cancer incidence and deaths, these data are still several years behind. For some areas, data might not be available or might be of varying quality. Areas with small populations might not have enough breast cancer cases or breast cancer deaths each year to support the generation of reliable statistics. 28 P age
29 There are often several sources of cancer statistics for a given population and geographic area; therefore, other sources of cancer data may result in minor differences in the values even in the same time period. Data on cancer rates for specific racial and ethnic subgroups such as Somali, Hmong, or Ethiopian are not generally available. The various types of breast cancer data in this report are inter-dependent. There are many factors that impact breast cancer risk and survival for which quantitative data are not available. Some examples include family history, genetic markers like HER2 and BRCA, other medical conditions that can complicate treatment, and the level of family and community support available to the patient. The calculation of the years needed to meet the HP2020 objectives assume that the current trends will continue until However, the trends can change for a number of reasons. Not all breast cancer cases have a stage indication. Quantitative Data Report Conclusions Highest priority areas Four counties in the Komen Greater Atlanta service area are in the highest priority category. All of the four, Clayton County, DeKalb County, Fulton County and Henry County, are not likely to meet either the death rate or late-stage incidence rate HP2020 targets. The death rates in Fulton County (29.2 per 100,000) are significantly higher than the service area as a whole (24.4 per 100,000). The late-stage incidence rates in DeKalb County (51.8 per 100,000) are significantly higher than the service area as a whole (46.5 per 100,000). Clayton County has a relatively large Black/African-American population, low education levels, high poverty percentages and high unemployment. DeKalb County has a relatively large Black/African-American population. Fulton County has a relatively large Black/African-American population. High priority areas One county in the Komen Greater Atlanta service area is in the high priority category. Cherokee County is not likely to meet the late-stage incidence rate HP2020 target. Selection of Target Communities Susan G. Komen Greater Atlanta is comprised of a 13 county service area, encompassing more than 46 percent of the State of Georgia s population. Counties within the service area are Cherokee, Clayton, Cobb, Coweta, DeKalb, Douglas, Fayette, Forsyth, Fulton, Gwinnett, Henry, Newton, and Rockdale. Komen Greater Atlanta s service area as a whole has higher ageadjusted breast cancer incidence rates, death rates, and late-stage diagnosis rates than the state as a whole, and Georgia fares worse on these measures than does the general population in the United States (Table 2.1). Komen Greater Atlanta endeavors to serve individuals throughout all 13 counties because the need is high throughout the service area. However, in order to focus the organization s resources and goals over the next four years, Komen Greater Atlanta has chosen five target communities within the service area. Target communities are those that are at the greatest risk for experiencing gaps in breast health services, barriers in access to care, or those that are home to populations most vulnerable to experiencing poor breast health outcomes. 29 P age
30 The selection of Komen Greater Atlanta s target communities was based primarily on data from Healthy People 2020, a comprehensive United States federal government initiative that sets measurable objectives for improving community health outcomes. While Healthy People 2020 measures a variety of health outcomes, Komen Greater Atlanta reviewed goals relating to reducing late-stage breast cancer diagnosis (defined as Stage 3 or Stage 4) and breast cancer deaths. Target communities were chosen based on the amount of time communities are anticipated to need in order to meet Healthy People 2020 breast cancer targets. In addition to Healthy People 2020 data, Komen Greater Atlanta also reviewed data including but not limited to county level when selecting target communities: Incidence rates and trends Death rates and trends Late-stage rates and trends Breast cancer screening percentages Percentage of residents living below the federal poverty level Percentage of residents living without health insurance Unemployment levels Percentage of residents who are linguistically isolated and/or foreign born. Based on these criteria, Komen Greater Atlanta has chosen the following target communities: Cherokee County Clayton County DeKalb County Fulton County Henry County Cherokee County Cherokee County is primarily a rural county in the northern portion of the Komen Greater Atlanta service area. The county is a high priority county based on Healthy People 2020 measures and is anticipated to need 13 or more years to meet the late-stage incidence target and seven years to meet the death rate target (Table 2.7). Cherokee County has the highest annual percentage increase in both breast cancer incidence and late-stage diagnosis in the service area at 7.6 percent and 7.9 percent, respectively. The Komen Greater Atlanta service area as a whole has a 0.0 percent change in incidence rate and a -0.5 percent change in late-stage diagnosis, meaning that Cherokee County is an extreme outlier on these measures and is moving away from rather than towards Healthy People 2020 targets (Table 2.1). Breast cancer screening percentages are also a concern in Cherokee County. While 77.5 percent of women (CI 57.2 percent percent) age 50 to 74 reported receiving a screening mammogram within the last two years, this percentage is the lowest in the service area (Table 2.3). The health systems analysis will examine access to and barriers to breast health care in Cherokee County along with investigating what changes have been or are taking place in the County for breast cancer incidence and late-stage diagnosis to have risen so rapidly in recent years. Clayton County Clayton County is an urban county in the southern portion of the Komen Greater Atlanta service area, just south of the City of Atlanta. Clayton County is designated as a Healthy People P age
31 highest priority county, anticipated to need more than 13 years to meet both the death rate and late-stage incidence targets (Table 2.8). Clayton County s breast cancer incidence rate is slightly lower than rates throughout the service area, state, and country, but both the county s death rate and late-stage incidence rate are higher than all three comparison groups with the exception of the county s late-stage diagnosis rate being just below the service area rate. Table 2.8. Clayton County breast cancer statistics Komen Greater Clayton County Atlanta Service Area Georgia United States Incidence Rate Death Rate Late-stage Rate * All rates are age-adjusted rates per 100,000 women Socioeconomic factors indicate individuals living in Clayton County may have difficulty accessing affordable breast health care. Nearly half of Clayton County residents live below 250 percent of the federal poverty level, and more than a quarter do not have health insurance (Table 2.9). These rates are the highest in the Komen Greater Atlanta service area. The county also has a low high school completion rate along with a high unemployment level and slightly elevated linguistic isolation percentage. Table 2.9. Clayton County socioeconomic indicators Below Less than HS Education 250% Poverty Unemployed Linguistically Isolated No Health Insurance Clayton County 17.9% 48.1% 14.4% 5.9% 25.3% Komen Greater 11.5% 31.7% 10.0% 4.8% 20.6% Atlanta Georgia 16.0% 37.6% 9.9% 3.3% 20.7% United States 14.6% 33.3% 8.7% 4.7% 16.6% * Data in the percentage of people in the population Additionally, Clayton County has a significantly higher percentage of women who identify as Black/African-American at 69.3 percent than does the service area at 38.1 percent (Table 2.4). This is significant because of the comparatively high breast cancer morbidity rate among Black/African-American women as compared to White women and the general population. While Clayton County is located in close proximity to the metropolitan center of the service area, the county lacks any public transportation creating a barrier that keeps women from accessing breast health services in a nearby county. The health systems analysis will look deeper at this and other structural or cultural barriers that exist for the women of Clayton County in addition to surveying the breast health resources that are available for women in this area. DeKalb County DeKalb County is the second most populous county in metro Greater Atlanta and in the Komen Greater Atlanta service area. Based on Healthy People 2020 targets, it is a highest priority county that will likely need more than 13 years to meet both death rate and late-stage incidence targets (Table 2.7). The age-adjusted incidence rate, age-adjusted death rate, and late-stage diagnosis rate for DeKalb County all exceed the Komen Greater Atlanta, Georgia, and US 31 P age
32 population rates, and DeKalb s late-stage diagnosis rate is the highest in the service area (Table 2.10). Table DeKalb County breast cancer statistics Komen Greater DeKalb County Atlanta Service Area Georgia United States Incidence Rate Death Rate Late-stage Rate * All rates are age-adjusted rates per 100,000 women DeKalb County s high breast cancer incidence rate could be related to the fact that 85.4 percent (CI = 75.9 percent percent) of women in the county report receiving a mammogram in the last two years, meaning that fewer cancers go undetected in DeKalb County than is the case in counties with lower screening percentages (Table 2.3). If this is the case, however, it is particularly concerning given the elevated late-stage diagnosis. Either women are not getting mammograms early enough to detect cancer early, or the mammograms are not effectively detecting cancer. DeKalb County is one of the service area s most racially and ethnically diverse counties. White women comprise 36.6 percent of women in the county, Black/African-American women 57.5 percent, and Asian/Pacific Islanders 5.4 percent (Table 2.4). Additionally, 8.2 percent of women in the county are Hispanic/Latina, and 16.3 percent are foreign born (Table 2.4, Table 2.5). Because the county is so diverse, finding culturally competent care may be difficult for all women in the area. Low health insurance rates may also serve as a barrier to breast health care in DeKalb County; 23.1 percent of people age in the county do not have health insurance (Table 2.5). Given both high screening percentages and high late-stage diagnosis rates in DeKalb County, the health systems review will analyze the availability and accessibility of breast health services for all women. Cultural competence of breast health services will also be reviewed to ensure that available breast health service providers are equipped to serve the county s diverse population. Fulton County Fulton County is the largest county in the Komen Greater Atlanta service area based both on geography and population. One in five women in the Komen Greater Atlanta service area lives in Fulton County (Table 2.1). The county is a highest priority county based on Healthy People 2020 data and is anticipated to need more than thirteen years to meet target rates for both death rate and late-stage incidence (Table 2.7). The age-adjusted incidence rate, age-adjusted death rate, and late-stage diagnosis rate for Fulton County all exceed the Komen Greater Atlanta, Georgia, and US population rates, and the death rate is the highest in the service area (Table 2.11). 32 P age
33 Table Fulton County breast cancer statistics Komen Greater Atlanta Service Fulton County Area Georgia United States Incidence Rate Death Rate Late-stage Rate * All rates are age-adjusted rates per 100,000 women Minority race and ethnicity women comprise the majority of the female population in Fulton County with 46.2 percent of women identifying as White, 47.5 percent identifying as Black/African-American, 5.8 percent identifying as Asian/Pacific Islanders, and 7.3 percent of women of Hispanic/Latina decent (Table 2.4). Similar to DeKalb County, this means that cultural competency among breast health care providers is of the utmost importance in Fulton County. The racial and ethnic composition of the county is also important because, despite lower breast cancer incidence, non-white women may have poorer breast cancer outcomes than White women. Many women in Fulton County may also experience barriers to breast health care for socioeconomic reasons as 34.8 percent of adults age live on less than 250 percent of the federal poverty level (Table 2.5). One of the most important tasks of the health systems analysis will be to examine the distribution of breast health services in Fulton County to understand whether or not they are available to all individuals in the county given the geographic and demographic diversity of the county. The analysis may also help to explain why, despite higher rates of mammography than the service area average, state, and U.S. population, Fulton County has the highest death rate in the service area. Henry County Henry County is a mixed urban and rural county in the southern part of the Komen Greater Atlanta service area, just outside of the Atlanta metropolitan center. Henry County has the smallest population of the target communities with 4.5 percent of the service area s population (Table 2.1). The entire county is designated as a medically underserved area (Table 2.5). Henry County is a highest priority county with regard to the Healthy People 2020 targets and will likely need more than 13 years to meet the initiative s death rate and late-stage incidence goals (Table 2.7). Breast cancer incidence in Henry County is slightly lower than the service area, state, and country, but the death rate and late-stage diagnosis rates are elevated (Table 2.12). Table Henry County breast cancer statistics Komen Greater Atlanta Service Henry County Area Georgia United States Incidence Rate Death Rate Late-stage Rate * All rates are age-adjusted rates per 100,000 women 33 P age
34 The late-stage diagnosis rate particularly concerning in that Henry County is experiencing a 5.1 percent annual increase in late-stage diagnosis (Table 2.1). Given that Henry has a high rate of screening mammography with 87.7 percent (CI = 66.1 percent percent) of women age reporting a mammogram within the last two years, it is possible that some of the late-stage diagnoses are due to an increase in screening mammography in the county. Because Henry County is just outside of the metropolitan center where many low cost and nocost breast health services are located and the county itself is in a medically underserved area, it may be difficult for all women in Henry County who need mammograms to access affordable services. One of the tasks of the health systems analysis will be to investigate how women in the county can access breast health care as needed. 34 P age

35 Health Systems and Public Policy Analysis Health Systems Analysis Data Sources Data for the Health Systems Analysis was compiled from a wide variety of local, state, and federal resources listing breast health resources including: The Food and Drug Administration s list of certified mammography centers The National Association of County and City Health Official s list of health departments Lists of Health Centers and Free Clinics Lists of specially accredited or certified centers Komen Greater Atlanta staff also used existing relationships with grantees and the local breast cancer community to identify facilities in addition to conducting internet searches to locate any services and resources that may have previously been unknown to Komen Greater Atlanta. Once facilities and organizations were located, the services provided at each location in the target counties were verified either by the organization s website or a phone call to the organization. Komen Greater Atlanta staff and Community Profile Committee members reviewed the resources for each county by assembling the information collected into a spreadsheet with a separate worksheet for each target community. Organizations were listed in the county where they operate, regardless of the counties from which their constituents come. Collecting all of the services providers for a target area on one sheet allowed Komen Greater Atlanta staff to view the strengths and weaknesses of each area with regards to the availability of services in the area. In addition to assessing the structure and availability of services in the target communities, Komen Greater Atlanta also conducted an assessment of local, state, and federal policies that impact access to breast health care in the service area. The Public Policy Analysis follows the Health Systems Analysis and helps to provide a more thorough explanation of barriers to education, screening, and care in the target communities. Health Systems Overview The Breast Cancer Continuum of Care (CoC) is a model that shows how a person typically moves through the health care system for breast care (Figure 3.1). An individual would ideally move through the CoC quickly and seamlessly, receiving timely, quality care in order to have the best outcomes. Education can play an important role throughout the entire CoC. While a person may enter the continuum at any point, ideally, a person would enter the CoC by getting screened for breast cancer with a clinical breast exam or a screening mammogram. If the screening test results are normal, she would loop back into follow-up care, where she would get another screening exam at the recommended interval. Education plays a role in both providing education to encourage people to get screened and Figure 3.1. Breast Cancer Continuum of Care (CoC) 35 P age
36 reinforcing the need to continue to get screened routinely thereafter. If a screening exam resulted in abnormal results, diagnostic tests would be needed, possibly several, to determine if the abnormal finding is in fact breast cancer. These tests might include a diagnostic mammogram, breast ultrasound or biopsy. If the tests were negative (or benign) and breast cancer was not found, she would go into the follow-up loop, and return for screening at the recommended interval. The recommended intervals may range from three to six months for some people to 12 months for most. Education plays a role in communicating the importance of proactively getting test results, keeping follow-up appointments and understanding what it all means. Education can empower individuals and help manage anxiety and fear. If breast cancer is diagnosed, she would proceed to treatment. Education can cover such topics as treatment options, how a pathology reports determines the best options for treatment, understanding side effects and how to manage them, and helping to formulate questions a person may have for her providers. For some breast cancer patients, treatment may last a few months and for others, it may last years. While the CoC model shows that follow up and survivorship come after treatment ends, they actually may occur at the same time. Follow up and survivorship may include things like navigating insurance issues, locating financial assistance, symptom management, such as pain, fatigue, sexual issues, bone health, etc. Education may address topics such as making healthy lifestyle choices, long term effects of treatment, managing side effects, the importance of followup appointments and communication with their providers. Most people will return to screening at a recommended interval after treatment ends, or for some, during treatment (such as those taking long term hormone therapy). There are often delays in moving from one point of the continuum to another at the point of follow-up of abnormal screening exam results, starting treatment, and completing treatment that can all contribute to poorer outcomes. There are also many reasons why a person does not enter or continue in the breast cancer CoC. These barriers can include things such as lack of transportation, system issues including long waits for appointments and inconvenient clinic hours, language barriers, fear, and lack of information - or the wrong information (myths and misconceptions). Education can address some of these barriers and help a person progress through the CoC more quickly. Mission Related Partnerships and Opportunities Cherokee County Komen Greater Atlanta s primary partners in Cherokee County are Northside Hospital and WellStar hospitals along with their offices (Figure 3.2). Northside is a longtime Komen Greater Atlanta grantee and serving uninsured and underinsured people throughout the service area. Northside s recent expansion into Cherokee County provides more breast health resources in the area than were previously available, but Northside s free and low-cost screening resources are limited given the demand for their services. WellStar also receives Komen Greater Atlanta screening and diagnostic funding, though the majority of their funds are spent screening individuals in other counties. The county health department is also an important point of access in the county, but the health department primarily screens women age through clinical breast exams and refers out for mammograms when necessary. Women who do not fall within these guidelines or who are undocumented immigrants may not be able to be screened within the county if they cannot pay for services. Northside and WellStar hospitals are the primary providers of treatment and 36 P age
37 support services for breast cancer patients, but individuals may need to drive to neighboring counties for ancillary services. Survivorship resources and non-medical support including legal aid, financial assistance, and counseling are limited in the area. In order to better meet the needs of individuals in Cherokee County, Komen Greater Atlanta needs to seek out relationships with the county health department and community clinics in the area particularly those that can serve Spanish-speaking individuals. Throughout the service area, Komen Greater Atlanta will also begin to invest in survivorship programs given their scarcity in and for the target populations identified. Clayton County Clayton County has one health department office that provides clinical breast exams and mammography referrals and one hospital that provides for the full continuum of breast health care, and they are supplemented by a few community health centers and free clinics that can provide clinical breast exams and referrals (Figure 3.3). The county is geographically close to many providers in Fulton County and the City of Atlanta, but there is no public transportation in Clayton County, and transportation assistance is scarce. Komen Greater Atlanta partners with the Clayton County Health Department and the Women s Center at Spivey Station to pay for breast screenings, diagnostics, and lymphedema care. Komen Greater Atlanta grants increase the number of individuals who can be screened through the programs, but additional partnerships are needed to reduce transportation and other economic barriers to screening. Mobile mammography is one potential solution to this challenge, but there are no mobile mammography providers serving the area regularly at this time. DeKalb County DeKalb County is metro Atlanta s second most populous county. It is home to Emory University Hospital, a large private research institution and Georgia s only NCI designated cancer center, and DeKalb Medical Center, a public hospital (Figure 3.4). Grady Hospital, the metro area s largest indigent care facility, serves DeKalb County residents but is located in neighboring Fulton County. These hospitals provide services along the entire continuum of breast health care. Several free clinics and community health centers are also located in DeKalb County, but these clinics typically perform clinical breast exams only and provide referrals to the hospitals for additional services. Though there are a number of high quality breast health services in DeKalb County, the resources are not enough to meet the needs of the entire population, especially the uninsured and immigrant populations in the northern part of the county. This is particularly true since the closing of DeKalb Medical Foundation s Wellness on Wheels (WoW) in WoW formerly provided mobile mammography services for a large portion of the uninsured and underinsured population in the area. There is no other organization providing such a high volume of free or low-cost screenings in the county, so people must cross into a neighboring county for services. Because of a large recent immigrant population in the county, language is also a significant barrier to education, screening, diagnostics, and treatment for much of the population. Since the closing of WoW, Komen Greater Atlanta does not have a large volume breast screening partner in DeKalb County. Komen Greater Atlanta partners with and provides grants to a number of smaller organizations who provide clinical breast exams and refer out for mammography, but there are not sufficient hospitals and screening facilities conducting low cost mammograms in the county to serve all of the population in need. Komen Greater Atlanta 37 P age
38 should seek out partners to fill this need and continue to invest in culturally competent breast health education and services for the diverse population in the county. Fulton County Fulton County has the largest population in the metro Atlanta area and is home to branches of five hospital systems, including the region s largest public hospital (Figure 3.5). These hospitals provide the majority of free and low cost mammography, diagnostics, and treatment not only for individuals who enter the CoC via the hospitals but also the majority of free or low-cost mammography, diagnostics and treatment for individuals referred from more than thirty health departments, community health centers, and free clinics in the area. Many people also travel to Fulton County from neighboring counties with less medical resources, so the resources within the county are strained. Komen Greater Atlanta funds three of the hospital systems located in Fulton County (Northside, Grady, and Piedmont) along with nonprofit organizations who outreach to specific populations in need including Black/African-American women, Hispanic/Latinas, Asian Americans, new immigrant and/or transient populations, and LGBTQ individuals. Komen Greater Atlanta also has a long time partnership with the Fulton County health department. Opportunities for the future include developing greater infrastructure within Fulton County to serve both the county residents and those who travel to the area while also maintaining smaller and highly competent outreach and screening programs that are best at educating hard to reach or highly underserved populations. Henry County Henry County has few breast health providers (Figure 3.6). Piedmont Henry Hospital is the only organization providing at least one service in each part of the continuum of care. Some services, such as breast MRI, are not available in the county because Piedmont Henry refers to their main campus in Fulton County for those services. Henry County does have one health department location and a handful of community clinics providing free or low-cost clinical breast exams, but those organizations must refer patients to another facility for imaging or treatment. Piedmont Henry is Komen Greater Atlanta s only current partner in Henry County. Komen Greater Atlanta should work to develop additional partnerships in the area to increase access to screening and other resources. As a semi-rural county with few medical facilities, Henry County would also benefit from mobile mammography services. Komen Greater Atlanta will continue to work to make mobile mammography more accessible in target areas. 38 P age

39 Figure 3.2. Breast cancer services available in Cherokee County 39 P age

40 Figure 3.3. Breast cancer services available in Clayton County 40 P age

41 Figure 3.4. Breast cancer services available in DeKalb County 41 P age

42 Figure 3.5. Breast cancer services available in Fulton County 42 P age

43 Figure 3.6. Breast cancer services available in Henry County 43 P age
SUSAN G. KOMEN GREATER ATLANTA EXECUTIVE SUMMARY
 SUSAN G. KOMEN GREATER ATLANTA EXECUTIVE SUMMARY Acknowledgments The Community Profile Report could not have been accomplished without the exceptional work, effort, time and commitment from many people
Greater Atlanta Affiliate of Susan G. Komen Quantitative Data Report
 Greater Atlanta Affiliate of Susan G. Komen Quantitative Data Report 2015-2019 Contents 1. Purpose, Intended Use, and Summary of Findings... 4 2. Quantitative Data... 6 2.1 Data Types... 6 2.2 Breast Cancer
Table of Contents. 2 P age. Susan G. Komen
 RHODE ISLAND Table of Contents Table of Contents... 2 Introduction... 3 About... 3 Susan G. Komen Affiliate Network... 3 Purpose of the State Community Profile Report... 4 Quantitative Data: Measuring
Table of Contents. 2 P a g e. Susan G. Komen
 NEW HAMPSHIRE Table of Contents Table of Contents... 2 Introduction... 3 About... 3 Susan G. Komen Affiliate Network... 3 Purpose of the State Community Profile Report... 4 Quantitative Data: Measuring
Table of Contents. 2 P age. Susan G. Komen
 NEVADA Table of Contents Table of Contents... 2 Introduction... 3 About... 3 Susan G. Komen Affiliate Network... 3 Purpose of the State Community Profile Report... 4 Quantitative Data: Measuring Breast
Table of Contents. 2 P age. Susan G. Komen
 WYOMING Table of Contents Table of Contents... 2 Introduction... 3 About... 3 Susan G. Komen Affiliate Network... 3 Purpose of the State Community Profile Report... 4 Quantitative Data: Measuring Breast
Quantitative Data: Measuring Breast Cancer Impact in Local Communities
 Quantitative Data: Measuring Breast Cancer Impact in Local Communities Quantitative Data Report Introduction The purpose of the quantitative data report for the Southwest Florida Affiliate of Susan G.
Table of Contents. 2 P age. Susan G. Komen
 NEW MEXICO Table of Contents Table of Contents... 2 Introduction... 3 About... 3 Susan G. Komen Affiliate Network... 3 Purpose of the State Community Profile Report... 3 Quantitative Data: Measuring Breast
Table of Contents. 2 P age. Susan G. Komen
 OREGON Table of Contents Table of Contents... 2 Introduction... 3 About... 3 Susan G. Komen Affiliate Network... 3 Purpose of the State Community Profile Report... 4 Quantitative Data: Measuring Breast
Table of Contents. 2 P age. Susan G. Komen
 IDAHO Table of Contents Table of Contents... 2 Introduction... 3 About... 3 Susan G. Komen Affiliate Network... 3 Purpose of the State Community Profile Report... 4 Quantitative Data: Measuring Breast
Susan G. Komen Tri-Cities Quantitative Data Report
 Susan G. Komen Tri-Cities Quantitative Data Report 2014 Contents 1. Purpose, Intended Use, and Summary of Findings... 4 2. Quantitative Data... 6 2.1 Data Types... 6 2.2 Breast Cancer Incidence, Death,
North Carolina Triangle to the Coast Affiliate of Susan G. Komen Quantitative Data Report
 North Carolina Triangle to the Coast Affiliate of Susan G. Komen Quantitative Data Report 2015-2019 Contents 1. Purpose, Intended Use, and Summary of Findings... 4 2. Quantitative Data... 6 2.1 Data Types...
Columbus Affiliate of Susan G. Komen Quantitative Data Report
 Columbus Affiliate of Susan G. Komen Quantitative Data Report 2015-2019 Contents 1. Purpose, Intended Use, and Summary of Findings... 4 2. Quantitative Data... 6 2.1 Data Types... 6 2.2 Breast Cancer Incidence,
Table of Contents. 2 P age. Susan G. Komen
 NORTH DAKOTA Table of Contents Table of Contents... 2 Introduction... 3 About... 3 Susan G. Komen Affiliate Network... 3 Purpose of the State Community Profile Report... 3 Quantitative Data: Measuring
SUSAN G. KOMEN LOUISVILLE
 SUSAN G. KOMEN LOUISVILLE Table of Contents Table of Contents... 2 Acknowledgments... 3 Introduction... 4 Affiliate History... 4 Affiliate Organizational Structure... 4 Affiliate Service Area... 4 Purpose
Table of Contents. 2 P age. Susan G. Komen
 SOUTH CAROLINA Table of Contents Table of Contents... 2 Introduction... 3 About... 3 Susan G. Komen Affiliate Network... 3 Purpose of the State Community Profile Report... 4 Quantitative Data: Measuring
Table of Contents. 2 P age. Susan G. Komen
 MONTANA Table of Contents Table of Contents... 2 Introduction... 3 About... 3 Susan G. Komen Affiliate Network... 3 Purpose of the State Community Profile Report... 4 Quantitative Data: Measuring Breast
Table of Contents. 2 P age. Susan G. Komen
 WISCONSIN Table of Contents Table of Contents... 2 Introduction... 3 About... 3 Susan G. Komen Affiliate Network... 3 Purpose of the State Community Profile Report... 4 Quantitative Data: Measuring Breast
Table of Contents. 2 P age. Susan G. Komen
 ALABAMA Table of Contents Table of Contents... 2 Introduction... 3 About... 3 Susan G. Komen Affiliate Network... 3 Purpose of the State Community Profile Report... 4 Quantitative Data: Measuring Breast
SUSAN G. KOMEN BATON ROUGE
 SUSAN G. KOMEN BATON ROUGE Table of Contents Table of Contents... 2 Acknowledgments... 3 Executive Summary... 5 Introduction to the Community Profile Report... 5 Quantitative Data: Measuring Breast Cancer
Table of Contents. 2 P age. Susan G. Komen
 COLORADO Table of Contents Table of Contents... 2 Introduction... 3 About... 3 Susan G. Komen Affiliate Network... 3 Purpose of the State Community Profile Report... 4 Quantitative Data: Measuring Breast
COMMUNITY PROFILE REPORT Greater Atlanta Affiliate of Susan G. Komen for the Cure
 COMMUNITY PROFILE REPORT 2011 Greater Atlanta Affiliate of Susan G. Komen for the Cure 2011 i Acknowledgements The Greater Atlanta Affiliate of Susan G. Komen for the Cure would like to thank the following
Table of Contents. 2 P age. Susan G. Komen
 MINNESOTA Table of Contents Table of Contents... 2 Introduction... 3 About... 3 Susan G. Komen Affiliate Network... 3 Purpose of the State Community Profile Report... 4 Quantitative Data: Measuring Breast
SUSAN G. KOMEN FLORIDA SUNCOAST
 SUSAN G. KOMEN FLORIDA SUNCOAST Table of Contents Table of Contents... 2 Acknowledgments... 3 Executive Summary... 4 Introduction to the Community Profile Report... 4 Quantitative Data: Measuring Breast
Table of Contents. 2 P age. Susan G. Komen
 CALIFORNIA Table of Contents Table of Contents... 2 Introduction... 3 About... 3 Susan G. Komen Affiliate Network... 3 Purpose of the State Community Profile Report... 5 Quantitative Data: Measuring Breast
Table of Contents. 2 P age. Susan G. Komen
 INDIANA Table of Contents Table of Contents... 2 Introduction... 3 About... 3 Susan G. Komen Affiliate Network... 3 Purpose of the State Community Profile Report... 4 Quantitative Data: Measuring Breast
Table of Contents. 2 P age. Susan G. Komen
 KANSAS Table of Contents Table of Contents... 2 Introduction... 3 About... 3 Susan G. Komen Affiliate Network... 3 Purpose of the State Community Profile Report... 4 Quantitative Data: Measuring Breast
SUSAN G. KOMEN CENTRAL TEXAS
 SUSAN G. KOMEN CENTRAL TEXAS Table of Contents Table of Contents... 2 Acknowledgments... 3 Executive Summary... 4 Introduction to the Community Profile Report... 4 Quantitative Data: Measuring Breast Cancer
TABLE OF CONTENTS. Southwest Region Community Profile Report
 SOUTHWEST REGION TABLE OF CONTENTS TABLE OF CONTENTS... 2 ABOUT SUSAN G. KOMEN... 3 COMMUNITY PROFILE INTRODUCTION... 4 ANALYSIS OF THE 2015 COMMUNITY PROFILE DATA... 5 PURPOSE... 5 METHODS... 5 CHALLENGES
Executive Summary. Introduction to the Community Profile Report
 Executive Summary Introduction to the Community Profile Report Affiliate Overview The Affiliate began as the Komen New Jersey Race for the Cure in 1994. Recognizing the need for growth, key volunteers
Table of Contents. 2 P age. Susan G. Komen
 FLORIDA Table of Contents Table of Contents... 2 Introduction... 3 About... 3 Susan G. Komen Affiliate Network... 3 Purpose of the State Community Profile Report... 4 Quantitative Data: Measuring Breast
Table of Contents. 2 P age. Susan G. Komen
 OHIO Table of Contents Table of Contents... 2 Introduction... 3 About... 3 Susan G. Komen Affiliate Network... 3 Purpose of the State Community Profile Report... 4 Quantitative Data: Measuring Breast Cancer
SUSAN G. KOMEN NORTH TEXAS EXECUTIVE SUMMARY
 SUSAN G. KOMEN NORTH TEXAS EXECUTIVE SUMMARY Acknowledgments The Community Profile Report could not have been accomplished without the exceptional work, effort, time and commitment from many people involved
SUSAN G. KOMEN ST. LOUIS EXECUTIVE SUMMARY
 SUSAN G. KOMEN ST. LOUIS EXECUTIVE SUMMARY Acknowledgments The Community Profile Report could not have been accomplished without the exceptional work, effort, time and commitment from many people involved
Table of Contents. 2 P age. Susan G. Komen
 NEBRASKA Table of Contents Table of Contents... 2 Introduction... 3 About... 3 Susan G. Komen Affiliate Network... 3 Purpose of the State Community Profile Report... 4 Quantitative Data: Measuring Breast
Health Systems Analysis Data Sources
 Health Systems Analysis Data Sources Data for the Health Systems Analysis was compiled from a wide variety of local, state, and federal resources listing breast health resources including: The Food and
TABLE OF CONTENTS... 2 ABOUT SUSAN G. KOMEN... 3 COMMUNITY PROFILE INTRODUCTION... 4 ANALYSIS OF THE 2015 COMMUNITY PROFILE DATA...
 NORTHEAST REGION TABLE OF CONTENTS TABLE OF CONTENTS... 2 ABOUT SUSAN G. KOMEN... 3 COMMUNITY PROFILE INTRODUCTION... 4 ANALYSIS OF THE 2015 COMMUNITY PROFILE DATA... 5 PURPOSE... 5 METHODS... 5 CHALLENGES
SUSAN G. KOMEN CENTRAL VIRGINIA
 SUSAN G. KOMEN CENTRAL VIRGINIA Table of Contents Table of Contents... 2 Acknowledgments... 3 Executive Summary... 5 Introduction to the Community Profile Report... 5 Quantitative Data: Measuring Breast
SUSAN G. KOMEN GREATER KANSAS CITY
 SUSAN G. KOMEN GREATER KANSAS CITY Table of Contents Table of Contents... 2 Acknowledgments... 3 Executive Summary... 5 Introduction to the Community Profile Report... 5 Quantitative Data: Measuring Breast
NATIONAL CAPITAL REGION COMMUNITY HEALTH GRANTS
 KOMEN COMMUNITY HEALTH GRANTS Because breast cancer is everywhere, SO ARE WE. At Susan G. Komen, we are committed to ENDING breast cancer forever by EMPOWERING PEOPLE, ENERGIZING SCIENCE to find the cures
SUSAN G. KOMEN NORTHEAST LOUISIANA EXECUTIVE SUMMARY
 SUSAN G. KOMEN NORTHEAST LOUISIANA EXECUTIVE SUMMARY Acknowledgments The Community Profile Report could not have been accomplished without the exceptional work, effort, time and commitment from many people
COMMUNITY PROFILE REPORT 2011 Northeast Ohio Affiliate of Susan G. Komen for the Cure
 COMMUNITY PROFILE REPORT 2011 Northeast Ohio Affiliate of Susan G. Komen for the Cure 2011 Disclaimer: The information in this Community Profile Report is based on the work of the Northeast Ohio Affiliate
National Breast Cancer Awareness Month. Media Handbook
 National Breast Cancer Awareness Month Media Handbook At-a-Glance Facts About Komen and Our Mission: Research We ve funded more than $790 million in breast cancer research since 1982. We currently fund
SUSAN G. KOMEN DALLAS COUNTY. Susan G. Komen Dallas County Revised 1/2/ P age
 SUSAN G. KOMEN DALLAS COUNTY 1 P age Table of Contents Table of Contents... 2 Acknowledgments... 3 Executive Summary... 5 Introduction to the Community Profile Report... 5 Quantitative Data: Measuring
COMMUNITY PROFILE REPORT 2011 Coastal Georgia Affiliate of Susan G. Komen for the Cure
 COMMUNITY PROFILE REPORT 2011 Coastal Georgia Affiliate of Susan G. Komen for the Cure 2 0 11 Disclaimer: The information in this Community Profile Report is based on the work of Coastal Georgia Affiliate
COMMUNITY PROFILE REPORT. Susan G. Komen for the Cure Greater Cincinnati Affiliate
 COMMUNITY PROFILE REPORT Susan G. Komen for the Cure Greater Cincinnati Affiliate 2009 Acknowledgements We would like to extend a profound thank you to the organizations and community members who assisted
SUSAN G. KOMEN OREGON AND SW WASHINGTON
 SUSAN G. KOMEN OREGON AND SW WASHINGTON Table of Contents Table of Contents... 2 Acknowledgments... 3 Executive Summary... 5 Quantitative Data: Measuring Breast Cancer Impact in Local Communities... 6
TABLE OF CONTENTS. Northwest Region Community Profile Report
 NORTHWEST REGION TABLE OF CONTENTS TABLE OF CONTENTS... 2 ABOUT SUSAN G. KOMEN... 3 COMMUNITY PROFILE INTRODUCTION... 4 ANALYSIS OF THE 2015 COMMUNITY PROFILE DATA... 5 PURPOSE... 5 METHODS... 5 CHALLENGES
Table of Contents. 2 P age. Susan G. Komen
 KENTUCKY Table of Contents Table of Contents... 2 Introduction... 3 About... 3 Susan G. Komen Affiliate Network... 3 Purpose of the State Community Profile Report... 4 Quantitative Data: Measuring Breast
SUSAN G. KOMEN CENTRAL FLORIDA
 SUSAN G. KOMEN CENTRAL FLORIDA Table of Contents Table of Contents... 2 Acknowledgments... 3 Executive Summary... 4 Introduction to the Community Profile Report... 4 Quantitative Data: Measuring Breast
SUSAN G. KOMEN LOWCOUNTRY
 SUSAN G. KOMEN LOWCOUNTRY Table of Contents Table of Contents... 2 Acknowledgments... 3 Executive Summary... 5 Introduction to the Community Profile Report... 5 Quantitative Data: Measuring Breast Cancer
SUSAN G. KOMEN MIAMI/FT. LAUDERDALE
 SUSAN G. KOMEN MIAMI/FT. LAUDERDALE Table of Contents Table of Contents... 2 Acknowledgments... 3 Executive Summary... 5 Introduction to the Community Profile Report... 5 Quantitative Data: Measuring Breast
COMMUNITY PROFILE REPORT 2011 Greater Cincinnati Affiliate of Susan G. Komen for the Cure
 COMMUNITY PROFILE REPORT 2011 Greater Cincinnati Affiliate of Susan G. Komen for the Cure 2011 Disclaimer: The information in this Community Profile Report is based on the work of Susan G. Komen for the
SUSAN G. KOMEN NORTH CAROLINA TRIANGLE TO THE COAST
 SUSAN G. KOMEN NORTH CAROLINA TRIANGLE TO THE COAST Table of Contents Table of Contents... 2 Acknowledgments... 3 Executive Summary... 4 Introduction to the Community Profile Report... 4 Quantitative Data:
Community Benefit Strategic Implementation Plan. Better together.
 Community Benefit Strategic Implementation Plan 2016 2019 Better together. Table of Contents Introduction... 4 Priority 1: Community Health Infrastructure... 5 Objective 1.1: Focus resources strategically
NATIONAL CAPITAL REGION
 NATIONAL CAPITAL REGION TABLE OF CONTENTS TABLE OF CONTENTS... 2 ACKNOWLEDGEMENTS... 3 EXECUTIVE SUMMARY... 4 QUANTITATIVE DATA: MEASURING BREAST CANCER IMPACT IN LOCAL COMMUNITIES... 4 HEALTH SYSTEMS,
Using Cancer Registry Data to Prioritize Community Actions
 Using Cancer Registry Data to Prioritize Community Actions Dave Stinchcomb Westat October 9, 2015 Introduction Goals: Share information about types of cancer registry data that are used for cancer control
ACHIEVING HEALTH EQUITY IN LAKE COUNTY HOW DO WE GET THERE?
 ACHIEVING HEALTH EQUITY IN LAKE COUNTY HOW DO WE GET THERE? Achieving Health Equity in Lake County How Do we get there? Photo: Flickr user JanetandPhil / Creative Commons (BY-NC-ND 2.0) 2 Achieving Health
Arizona State Data Report
 ASTHO Breast Cancer Learning Community: Using Data to Address Disparities in Breast Cancer Mortality at the State Level Arizona Department of Health Services ADDRESS: 150 North 18 th Ave. Phoenix, AZ 85007
Qualitative Data: Ensuring Community Input
 Qualitative Data: Ensuring Community Input Qualitative Data Sources and Methodology Overview Since there is often a disconnect between provider suggestions and recommendations and what the community expresses
SUSAN G. KOMEN CENTRAL AND SOUTH JERSEY
 SUSAN G. KOMEN CENTRAL AND SOUTH JERSEY Table of Contents Table of Contents... 2 Acknowledgments... 3 Executive Summary... 5 Introduction to the Community Profile Report... 5 Quantitative Data: Measuring
SUSAN G. KOMEN CENTRAL NEW YORK EXECUTIVE SUMMARY
 SUSAN G. KOMEN CENTRAL NEW YORK EXECUTIVE SUMMARY The Community Profile Report could not have been completed without the exceptional work, effort, time and commitment of the many people and organizations
COMMUNITY PROFILE REPORT 2011 Northern Nevada Affiliate of Susan G. Komen for the Cure
 COMMUNITY PROFILE REPORT 2011 Northern Nevada Affiliate of Susan G. Komen for the Cure 20111 Disclaimer: The information in this Community Profile Report is based on the work of the Northern Nevada Affiliate
SUSAN G. KOMEN SOUTH FLORIDA
 SUSAN G. KOMEN SOUTH FLORIDA Table of Contents Table of Contents... 2 Acknowledgments... 3 Executive Summary... 7 Introduction to the Community Profile Report... 7 Quantitative Data: Measuring Breast Cancer
SUSAN G. KOMEN SACRAMENTO VALLEY
 SUSAN G. KOMEN SACRAMENTO VALLEY Table of Contents Table of Contents... 2 Acknowledgments... 3 Executive Summary... 5 Introduction to the Community Profile Report... 5 Quantitative Data: Measuring Breast
2017 REPORT ON PROGRAM MERIT AND PROGRESS PURSUANT TO TEXAS HEALTH & SAFETY CODE (C)
") MEMORANDUM To: OVERSIGHT COMMITTEE MEMBERS From: WAYNE ROBERTS, CHIEF EXECUTIVE OFFICER Subject: FY 2017 REPORT ON PROGRAM MERIT AND PROGRESS PURSUANT TO TEXAS HEALTH & SAFETY CODE 102.260(C) Date: FEBRUARY
MEMORANDUM To: OVERSIGHT COMMITTEE MEMBERS From: WAYNE ROBERTS, CHIEF EXECUTIVE OFFICER Subject: FY 2017 REPORT ON PROGRAM MERIT AND PROGRESS PURSUANT TO TEXAS HEALTH & SAFETY CODE 102.260(C) Date: FEBRUARY
Straub Clinic and Hospital Implementation Strategy Plan. May 2013
 Straub Clinic and Hospital Implementation Strategy Plan May 2013 Table of Contents 1 Introduction... 1 2 Community Served by Straub Clinic and Hospital... 2 3 Community Benefit Planning Process... 3 3.1
ELIMINATING HEALTH DISPARITIES IN AN URBAN AREA. VIRGINIA A. CAINE, M.D., DIRECTOR MARION COUNTY HEALTH DEPARTMENT INDIANAPOLIS, INDIANA May 1, 2002
 ELIMINATING HEALTH DISPARITIES IN AN URBAN AREA VIRGINIA A. CAINE, M.D., DIRECTOR MARION COUNTY HEALTH DEPARTMENT INDIANAPOLIS, INDIANA May 1, 2002 Racial and ethnic disparities in health care are unacceptable
SOUTH CENTRAL REGION
 SOUTH CENTRAL REGION TABLE OF CONTENTS TABLE OF CONTENTS... 2 ABOUT SUSAN G. KOMEN... 3 COMMUNITY PROFILE INTRODUCTION... 4 ANALYSIS OF THE 2015 COMMUNITY PROFILE DATA... 5 PURPOSE... 5 METHODS... 5 CHALLENGES
SUSAN G. KOMEN COLUMBUS
 SUSAN G. KOMEN COLUMBUS Table of Contents Table of Contents... 2 Acknowledgments... 3 Executive Summary... 5 Introduction to the Community Profile Report... 5 Quantitative Data: Measuring Breast Cancer
Cancer and Demographic COUNTY PROFILE Broward County, Florida
 Cancer and Demographic COUNTY PROFILE Broward County, Florida Sylvester Comprehensive Cancer Center Jay Weiss Institute for Health Equity University of Miami Revised Sept. 2016 TABLE OF CONTENTS Page Introduction
Center for Health Disparities Research
 Center for Health Disparities Research EXHIBIT I Legislative Committee on Health Care Document consists of 23 pages. Entire document provided. Due to size limitations, pages provided. A copy of the complete
COMMUNITY PROFILE REPORT 2011 Boise Affiliate of Susan G. Komen for the Cure
 COMMUNITY PROFILE REPORT 2011 Boise Affiliate of Susan G. Komen for the Cure Susan G. Komen for the Cure Boise, Idaho Affiliate 2011 Disclaimer: The information in this Community Profile Report is based
Vermont Department of Health Ladies First Program Program Outreach Plan
 Report to The Vermont Legislature In Accordance with Act 58, (2015), Section E.312.1 Submitted to: Submitted by: Prepared by: Joint Fiscal Committee Vermont Department of Health Nicole Lucas, Director
Table of Contents. 2 P age. Susan G. Komen
 VIRGINIA Table of Contents Table of Contents... 2 Introduction... 3 About... 3 Susan G. Komen Affiliate Network... 3 Purpose of the State Community Profile Report... 4 Quantitative Data: Measuring Breast
WORSHIP IN PINK WEEKEND TOOLKIT
 WORSHIP IN PINK WEEKEND TOOLKIT This toolkit is designed to provide faith-based organizations with ideas and resources to help plan, develop and implement Worship in Pink Weekend and Pink Sunday events.
SUSAN G. KOMEN NEBRASKA
 SUSAN G. KOMEN NEBRASKA Susan G. Komen Great Plains Prelude In January 2017, based in Omaha, Neb., and Susan G. Komen South Dakota, based in Sioux Falls, S.D., joined forces to make a bigger impact in
Missouri Statewide Integrated HIV Prevention and Care Plan, including the Statewide Coordinated Statement of Need, CY
 Missouri Statewide Integrated HIV Prevention and Care Plan, including the Statewide Coordinated Statement of Need, CY 2017-2021 September 20, 2016 Developed through the collaborative efforts of the following
SUSAN G. KOMEN MICHIGAN EXECUTIVE SUMMARY
 SUSAN G. KOMEN MICHIGAN EXECUTIVE SUMMARY Acknowledgments The Community Profile Report could not have been accomplished without the exceptional work, effort, time and commitment from many people involved
COMMUNITY PROFILE REPORT 2011 Greater Evansville Affiliate of Susan G. Komen for the Cure
 COMMUNITY PROFILE REPORT 2011 Greater Evansville Affiliate of Susan G. Komen for the Cure 2011 Disclaimer: The information in this Community Profile Report is based on the work of the Greater Evansville
Introduction Female Breast Cancer, U.S. 9/23/2015. Female Breast Cancer Survival, U.S. Female Breast Cancer Incidence, New Jersey
 Disparities in Female Breast Cancer Stage at Diagnosis in New Jersey a Spatial Temporal Analysis Lisa M. Roche, MPH, PhD 1, Xiaoling Niu, MS 1, Antoinette M. Stroup, PhD, 2 Kevin A. Henry, PhD 3 1 Cancer
Emory Johns Creek Hospital
 Emory Johns Creek Hospital Community Health Needs Assessment July 2016 TABLE OF CONTENTS Message from Emory Healthcare and Emory Johns Creek Hospital...1 Executive Summary...2 Overview of Emory Healthcare
ILI Syndromic Surveillance
 ILI Syndromic Surveillance Race/ethnicity of adult respondents with influenza-like illness (ILI) in the U.S., Behavioral Risk Factor Surveillance System (BRFSS), Sept 1- Sep 30, 2009 Race/ethnicity I
Combating Cancer in Kentucky Vivian Lasley-Bibbs, BS, MPH
 Combating Cancer in Kentucky Vivian Lasley-Bibbs, BS, MPH The National Picture: General Overview Cancer is the second leading cause of death in the United States today. In the year 2000, approximately
Annual Report to the Nation on the Status of Cancer, , Featuring Survival Questions and Answers
 EMBARGOED FOR RELEASE CONTACT: Friday, March 31, 2017 NCI Media Relations Branch: (301) 496-6641 or 10:00 am EDT ncipressofficers@mail.nih.gov NAACCR: (217) 698-0800 or bkohler@naaccr.org ACS Press Office:
La Follette School of Public Affairs
 Robert M. La Follette School of Public Affairs at the University of Wisconsin-Madison Working Paper Series La Follette School Working Paper No. 2009-027 http://www.lafollette.wisc.edu/publications/workingpapers
SUSAN G. KOMEN SIOUXLAND
 SUSAN G. KOMEN SIOUXLAND Table of Contents Table of Contents... 2 Acknowledgment... 3 Executive Summary... 6 Introduction to the Community Profile Report... 6 Health System and Public Policy Analysis...
Dear Community Partner,
 Dear Community Partner, I would like to invite your company to be a part of the Down Syndrome Association of Atlanta s (DSAA) 19 th Annual Buddy Walk, a celebration of the abilities and accomplishments
KAISER PERMANENTE OF GEORGIA COMMUNITY BENEFIT REPORT
 2016 KAISER PERMANENTE OF GEORGIA COMMUNITY BENEFIT REPORT Partnering to Build Healthy Communities At Kaiser Permanente Georgia, our commitment to improving health has been going strong for more than 30
Estimates of New HIV Infections in the United States
 Estimates of New HIV Infections in the United States CDC HIV/AIDS FactS A u g u s t 28 Accurately tracking the HIV epidemic is essential to the nation s HIV prevention efforts. Yet monitoring trends in
Community Profile Report Susan G. Komen for the Cure
 Community Profile Report Susan G. Komen for the Cure 2011 COMMUNITY San Diego Affiliate PROFILE 4699 Murphy Canyon Road, Suite #207 San Diego, CA 92123 858-573-2760 www.komensandiego.org table of contents
Needs Assessment of People Living with HIV in the Boston EMA. Needs Resources and Allocations Committee March 10 th, 2016
 Needs Assessment of People Living with HIV in the Boston EMA Needs Resources and Allocations Committee March 10 th, 2016 Presentation Overview 1. What is a Needs Assessment? 2. The Numbers o Epidemiological
Service Area: Herkimer, Fulton & Montgomery Counties. 140 Burwell St. 301 N. Washington St. Little Falls, NY Herkimer, NY 13350
 2016 Community Service Plan & Community Health Improvement Plan & Herkimer County Public Health Service Area: Herkimer, Fulton & Montgomery Counties Bassett Healthcare Network s Little Falls Hospital Herkimer
(773)
") OUR VISION A World Without Breast Cancer OUR PROMISE To save lives and end breast cancer forever by empowering people, ensuring quality care for all, and energizing science to find the cures. OUR PASSION
OUR VISION A World Without Breast Cancer OUR PROMISE To save lives and end breast cancer forever by empowering people, ensuring quality care for all, and energizing science to find the cures. OUR PASSION
Women s Connections to the Healthcare Delivery System: Key Findings from the 2017 Kaiser Women s Health Survey
 March 2018 Issue Brief Women s Connections to the Healthcare Delivery System: Key Findings from the 2017 Kaiser Women s Health Survey INTRODUCTION Women s ability to access the care they need depends greatly
Overview from the Division of Cancer Prevention and Control
 Overview from the Division of Cancer Prevention and Control Lisa C. Richardson, MD, MPH Director, Division of Cancer Prevention and Control, Centers for Disease Control and Prevention (CDC) Advisory Committee
AMERICA S HEALTH CARE SAFETY NET
 HEALTH RESOURCES AND SERVICES ADMINISTRATION AMERICA S HEALTH CARE SAFETY NET April 7, 2015 HRSA Overview Vision statement: Healthy Communities, Healthy People Mission statement: Improve health and achieve
SUSAN G. KOMEN COLUMBUS EXECUTIVE SUMMARY
 SUSAN G. KOMEN COLUMBUS EXECUTIVE SUMMARY Acknowledgments The Community Profile Report could not have been accomplished without the exceptional work, effort, time and commitment from many people involved
Emerging Issues in Cancer Prevention and Control
 Emerging Issues in Cancer Prevention and Control Marcus Plescia, MD, MPH Director, Division of Cancer Prevention and Control Centers for Disease Control & Prevention National Center for Chronic Disease
50 IN 10: Susan G. Komen's Bold Goal for Shaping History and Saving Lives. A Generation of Progress
 50 IN 10: Susan G. Komen's Bold Goal for Shaping History and Saving Lives 1 OUR BOLD GOAL Reduce the current number of breast cancer deaths by 50 in the U.S. by 2026. Updated March 2017 A NEW STAKE IN