The inteactions of differently expressed genes directly targeted by Wnt\[beta]-catenin signaling : implications for colorectal carcinogenesis
|
|
|
- Curtis Wilson
- 6 years ago
- Views:
Transcription
1 Oregon Health & Science University OHSU Digital Commons Scholar Archive December 2010 The inteactions of differently expressed genes directly targeted by Wnt\[beta]-catenin signaling : implications for colorectal carcinogenesis Charles F. Murchison Follow this and additional works at: Recommended Citation Murchison, Charles F., "The inteactions of differently expressed genes directly targeted by Wnt\[beta]-catenin signaling : implications for colorectal carcinogenesis" (2010). Scholar Archive This Thesis is brought to you for free and open access by OHSU Digital Commons. It has been accepted for inclusion in Scholar Archive by an authorized administrator of OHSU Digital Commons. For more information, please contact champieu@ohsu.edu.
2 THE INTERACTIONS OF DIFFERENTIALLY EXPRESSED GENES DIRECTLY TARGETED BY WNT\β-CATENIN SIGNALING: IMPLICATIONS FOR COLORECTAL CARCINOGENESIS By Charles F. Murchison A thesis presented to the Department of Medical Informatics and Clinical Epidemiology and the Oregon Health & Science University School of Medicine in partial fulfillment of the requirements for the degree of Masters of Science December 2010
3 School of Medicine Oregon Health & Science University Certificate of Approval This is to certify that the Master s Thesis of Charles F. Murchison The Interactions of Differentially Expressed Genes Directly Targeted by Wnt\β-catenin Signaling: Implications for Colorectal Carcinogenesis Has been approved Thesis Advisor Committee Member Committee Member
4 TABLE OF CONTENTS LIST OF TABLES... v LIST OF FIGURES... vi ACKNOWLEDGEMENTS... vii ABSTRACT... viii CHAPTER 1 INTRODUCTION 1.1 COLON CANCER ADENOMA DEVELOPMENT AND THE WNT SIGNALING PATHWAY MICROARRAYS AND POOLED ANALYSES OTHER HIGH-THROUGHPUT TECHNIQUES A MULTI-METHOD APPROACH CHAPTER 2 METHODS 2.1 LITERATURE SEARCH FOR EXPRESSION STUDIES NORMALIZATION OF CEL FILES TO ABSOLUTE INTENSITY DIFFERENTIAL EXPRESSION CO-EXPRESSION i
5 2.5 MODULE COMPARISON: PATIENT VS CELL-LINE WNT TRANSCRIPTION FACTOR BINDING DATA EXPRESSION PATTERNS AND β-catenin BINDING THE PROTEIN-PROTEIN INTERACTION NETWORKS CODINGS FOR THE NETWORK EVALUATION OF THE DISCOVERY NETWORK NULL NETWORK MODEL COMPARING OBSERVED AND PERMUTED PROPORTIONS OF METRICS CHAPTER 3 RESULTS 3.1 LITERATURE SEARCH OF mrna EXPRESSION STUDIES NORMALIZATION ASSESSMENT FOR POOLING AGGREGATE STUDY OF MRNA EXPRESSION FILTERING OF SACO DATA OF β-catenin BINDING THE PROTEIN PRODUCT INTERACTION NETWORK NETWORK NODES WITH SINGLE METRICS OF INTEREST NODES MATCHING MULTIPLE CRITERIA AND A FINAL NETWORK ASSESSMENT OF THE NULL MODEL ANNOTATION OF FUNCTION FOR IDENTIFIED GENES/NODES ii
6 CHAPTER 4 DISCUSSION 4.1 INITIAL ANALYSIS DIFFERENTIAL EXPRESSION PROFILES AND DIRECT β-catenin TARGETING BIOLOGICAL ANNOTATION THE 8 FUNCTIONAL ACTIVITY CATEGORIES FOR THE REFINED NETWORK CELL GROWTH, PROLIFERATION AND REGULATION OF THE CELL CYCLE PHOSPHORYLATION AND UBIQUITINATION CELL FATE AND DIFFERENTIATION, AND EPITHELIAL CELL POLARITY EPIGENETICS AND HISTONE MODIFICATION CELL-CELL INTERACTIONS, MOLECULAR TRANSPORT, INTER-CELLULAR SIGNALING PARTICIPANTS IN THE CANONICAL WNT PATHWAY COFACTORS AND RECEPTORS UBIQUITOUSLY EXPRESSED GENES GENERALIZED FUNCTIONALITY AND MULTIPLE BIOLOGICAL CIRCUMSTANCES EXPRESSION LOCALIZED OUTSIDE THE COLON OBSERVATIONS ON NODES IN THE CANONICAL WNT PATHWAY FINAL TRENDS CHAPTER 5 CONCLUSIONS 5.1 LIMITATIONS OF THE CURRENT STUDY FUTURE DIRECTIONS iii
7 5.3 CONTRIBUTIONS TO THE FIELD REFERENCE LIST TABLES FIGURES iv
8 LIST OF TABLES TABLE 1 STUDIES USED FOR mrna ANALYSIS TABLE 2 SIGNIFICANCE COUNTS OF PROBES FROM mrna ANALYSIS TABLE 3 CONCORDANT GENES BY DIRECTION OF DIFFERENTIAL EXPRESSION TABLE 4 TOP 5 CONCORDANTLY UPREGULATED AND DOWNREGULATED GENES TABLE 5 DIRECT TARGETS OF β-catenin SHOWING UPREGULATION AND DOWNREGULATION TABLE 6 METRICS OF THE INITIAL PROTEIN INTERACTION NETWORK TABLE 7 GENES WITH MRNA OVEREXPRESSION FOUND IN ADENOMAS AND CELL LINES TABLE 8 GENES WITH MRNA UNDEREXPRESSION FOUND IN ADENOMAS AND CELL LINES TABLE 9 METRICS OF NODES WITH ALTERED CO-EXPRESSION UNDER ADENOMATOUS CONDITIONS TABLE 10 METRICS FOR β-catenin DIRECT TARGETS AND NEIGHBORS TABLE 11 METRICS FOR INTERACTION NETWORK HUBS AND HUB NEIGHBORS TABLE 12 METRICS FOR KNOWN WNT PARTICIPANTS AND NEIGHBORS TABLE 13 FULL METRICS LISTING FOR THE FINAL 65 NETWORK NODES TABLE 14 STATISTICAL ASSESSMENT OF NULL NETWORK MODEL v
9 LIST OF FIGURES FIGURE 1 COLONIC CRYPT AND ADENOCARCINOMA DEVELOPMENT FIGURE 2 WNT ACTIVATION OF β-catenin DEPENDENT TRANSCRIPTION FIGURE 3 SERIAL ANALYSIS OF CHROMATIN OCCUPANCY FIGURE 4 DENSITY GRAPH OF SPOT INTENSITIES FROM mrna AGGREGATION ANALYSIS FIGURE 5 BOX PLOTS OF INDIVIDUAL ARRAYS COMPARING NORMALIZATIONS FIGURE 6 VENN DIAGRAM FOR DIFFERENTIALLY EXPRESSED GENES BY MODULE GROUPING FIGURE 7 OVERVIEW OF THE BASE PROTEIN INTERACTION NETWORK FIGURE 8 COLOR CODED LEGEND FOR TABLES FIGURE 9 REFINED INTERACTION NETWORK USED FOR VISUALIZATION vi
10 ACKNOWLEDGEMENTS This thesis would not have been possible without the guidance and support of my advisor Dr. Shannon McWeeney. Her tireless devotion and formidable intellect are matched only by her enthusiasm for the study of Bioinformatics and the entire discipline benefits from her involvement. Words do little justice to the generosity and insight she has given over the years but thank you, Shannon, for everything. Equally central in the development and implementation of this project were the members of my thesis advisory committee, Drs. Greg Yochum and Motomi Mori. Such a broad and inter-disciplinary study required a great deal of understanding of numerous disparate fields. Their advice in molecular biology and microarray analysis were indispensible in bringing this thesis to fruition. Finally, a thank you to the faculty, staff and students in the Department of Medical Informatics and Clinical Epidemiology at OHSU. I can think of no better place to have begun my career in Bioinformatics. vii
11 ABSTRACT Colorectal cancer is one of the most pervasive and deadly diseases in the world today. Although heavily studied with a wealth of available scientific data, little research has been directed at uniting the various biological metrics to test for novel genetic signals and markers that may be otherwise overlooked in singular studies. The current thesis addresses this by utilizing a combined, multi-method analysis to examine biological archetypes in colorectal adenomas by evaluating patterns of differential expression, co-expression disruption, protein product interaction, and transcription factor binding across an available selection of cancerous cell lines, patient colorectal adenomas and normal patient mucosa. First, an aggregate evaluation was used to identify disruptions in co-expression resulting from adenocarcinoma development in addition to differential gene regulation. The resulting gene expression patterns were compared against the chromatin occupancy of β-catenin, a key molecule in the canonical Wnt pathway. The results of this pooled analysis were overlain onto a proteinprotein interaction network derived from the Wnt pathway to identify genes of interest matching multiple categories of biological metrics. A number of genes identified in the empirical network were further categorized based on their functional ontologies and examined for their prospective role in either the treatment or detection of adenocarcinomas. In addition to isolating a number of potentially intriguing markers, this study also represents a novel method of disease assessment with applicability in conditions beyond colon cancer. viii
12 CHAPTER 1 INTRODUCTION 1.1 Colon cancer Few would argue that cancer is the primary medical epidemic facing the world today. According to the World Health Organization, cancer was the leading cause of death across the globe in 2007, accounting for 7.9 million deaths (13%) worldwide [1]. Typically, cancer is accepted as a blanket term, encompassing a spectrum of disease conditions, all united by a common progression of uncontrolled cell growth, possibly in conjunction with invasion to neighboring tissue and metastasis. Other similarities across cancers include a tendency for all uncontrolled growths to begin with abnormalities in the originating tissue s genetic material, whether these abnormalities are inherited, induced by a carcinogen or both [2]. Yet, despite these parallels, not all cancers are created, develop or progress equally. The time-course of the disease, the development of the uncontrolled growth, and potential treatment options are all highly dependent on the cancer s tissue of origin. Certain cancers by nature, such as mesothelioma of the lung lining, are harder to initially detect and have far fewer treatment options available. Other cancers, with stronger inheritance patterns for example, are more easily found and have much greater treatment efficacy [3]. One cancer in particular fits nicely into the later grouping: colorectal adenocarcinomas or colon cancer. The colon is a unique organ, being one of 1
13 the few that has a perpetual supply of undifferentiated stem cells available, specifically for the regeneration of the intestinal epithelium lining [4]. This is a necessity due to the caustic and toxic environment the colon is constantly subjected to. In order to properly facilitate nutrient absorption across the lining, an extensive surface area is used to maximize possible absorption into the blood stream. To properly fit in the limited space of an organism s torso, the intestinal epithelium folds on itself creating a series of small nubs, villi, as well as multiple divots called intestinal crypts. These crypts are the source of lining replenishment with each representing a cross-sectional snapshot of the developmental progression of epithelial cells [5]. Nascent cells begin at the base of the crypt as undifferentiated stem cells until mitosis is induced. These progenitor cells can undergo one of two types of division. The first, asymmetric division, results in a new partially differentiated cell ready for intestinal function in addition to another stem cell ready for subsequent division. Symmetric division on the other hand results in a matched pair of either partially differentiated cells or a pair of progenitor cell. The unchecked accumulation of the later often results in early adenomas. For those cells properly designated for intestinal activity, final differentiation to full functionality continues as the cell migrates along the crypt [6]. Thus, more efficacious cells are in closer proximity to potential nutrient sources and ready to replace epithelial cells which have reached the end of their effective lifespan. When this process is properly regulated, intestinal activity is smooth and efficient (see figure 1). 2
14 With the capacity to duplicate and differentiate as needed, the intestinal wall can be replenished continuously and promote proper digestion. However, this collection of cells, designed to propagate and replace, creates a volatile situation where unhindered proliferation can easily lead to tumorous growths and the development of adenocarcinomas. Commonly, these carcinomas begin as benign adenomatous polyps in the epithelial lining of the colon, which eventually develop into malignant tumors after a certain (and often unknown) latency [7]. Furthermore, many colon cancers show a strong hereditary component, although the exact component differs between disease types. For example, Familial Adenomatous Polyposis involves lesions in the APC or MUTYH tumor suppressor genes, conferring a selective advantage towards the creation of hundreds and thousands of colonic polyps [8]. Comparatively, Hereditary Non-Polyposis Colon Cancer is due to inherited abnormalities in any of five DNA mismatch repair genes, giving Lynch Syndrome far fewer polyps and an increased tendency for the cancer to also express in nearby organs such as the endometrium or other parts of the reproductive system [9]. Despite mild differences in specifics, colon cancer in all its forms is a deadly and pervasive disease. The CDC estimated nearly 140,000 cases of colon cancer were diagnosed in the U.S. alone in 2006, with over 53,000 deaths [10]. The World Health Organization reiterates this deadly prevalence, citing colon cancer as the number two leading cause of cancer related death in the western world, second only to lung cancer [1]. Yet despite these sobering statistics, colorectal adenocarcinomas are also one of 3
15 the most treatable types of cancer: polyps can be evaluated before they become malignant with many more viable (although still unpleasant) treatment options than many cancers originating from different organs. Nonetheless, the treatment of colon cancer is still predicated on successful detection, and like all cancers, the earlier the better. 1.2 Adenoma development and the Wnt signaling pathway The progression of colorectal adenocarcinomas is very well characterized, and despite variations in genetic abnormalities, a number of specific protein interactions and signaling pathways have been implicated in all of its developmental phases (see figure 1); from a normal colon epithelial cell, to a benign adenomatous polyp, to a malignant carcinoma and finally, to a tumor that has undergone metastasis [11]. One particular pathway has been identified whose genetic lesions are commonly found in the determination of normal colon cells into the initial adenomatous polyps: the Wnt signaling pathway (visualized in figure 2). The Wnt pathway is an enormous and complex collection of molecules, proteins and physiological responses all related to extra-cellular signaling due to a ligand involving a Wnt molecule. Although many branches and divergences exist in the pathway, one particular branch is highly involved with adenomatous cell development, referred to as the canonical Wnt pathway [12]. The canonical Wnt pathway primarily regulates the amount of nuclear β-catenin available within a cell. β-catenin is a transcription factor most commonly contained in 4
16 the cytoplasm, where it is most often degraded by a holoenzyme before it can migrate into the nucleus. That destruction complex, made up of a number of proteins such as APC and AXIN2, is in turn regulated by Wnt signaling. When Wnt binds to transmembrane proteins in the Frizzled family, key components in the destruction holoenzyme are prevented from associating and subsequent degradation of β-catenin is inhibited. As the transcription factor accumulates in the cytoplasm, it begins to migrate into the nucleus where it associates with a number of DNA associated compounds in the TCF/LEF family already bound to the chromatin. Once associated, these β-catenin/tcf- LEF compounds regulate expression of their affiliate genes. In Wnt, these genes are most commonly involved in embryogenesis, epithelium development and cancer. Wnt-like activity can be easily simulated through abnormalities to the genes coding for proteins involved in the destruction of β-catenin. By preventing the ability of the complex to poly-ubiquitinate β-catenin, the transcription factor accumulates and enters the nucleus where it alters mrna expression. A very common mutation, which is also highly hereditary, is to the gene coding for the APC protein [13]. A number of mutations lead to a truncated version of APC, which can still combine into the destruction complex, but cannot adequately bind β-catenin to mark it for degradation. In fact, mutations to the APC gene are one of the hallmark abnormalities involved in Familial Adenomatous Polyposis, as mentioned earlier. Beyond inheritance, the significance of APC is highlighted by the propensity of its mutations to be found in incident cancers as well. Especially critical is the relation between Wnt and colon cancer s developmental 5
17 time course. β-catenin signaling through Wnt activity is associated with the earliest possible step in tumorigenesis, from normal mucosa to initial adenoma before the growth is even malignant [14]. By focusing on pathways intrinsically involved with this initial transition step, the potential of genetic and molecular signals to assist in the detection and treatment of colorectal adenocarcinomas will be at its greatest. 1.3 Microarrays and pooled analyses One of the greatest discoveries to accompany the genomic revolution was the advent of high-throughput methods that allowed testing of upwards of tens of thousands of genetic sequences, all at the same time and in many cases on a single experimental medium. By far the most popular high-throughput technique is the mrna microarray. The concept of the array is fairly simple: to hybridize corresponding single strands of nucleic acids to look for the presence of sequences of interest. The true utility of the microarray is multiplying this process numerous times, allowing for a quantifiable level of expression for a specific gene and testing this expression for thousands of genes simultaneously [15]. By extracting mrna from a cell under the specific experimental conditions in question (e.g. from a colorectal adenoma), a genetic profile snapshot can be taken showing the levels of expression for a specified collection of genes. Comparing these results against the expression levels of a cell under control conditions can calculate fold changes in mrna levels, giving an effective measure of differential gene regulation [16]. As the technology has improved, microarrays have benefited from a 6
18 number of advances in extraction methods, quality control of both cell and array, imaging techniques and, most importantly, standardization. It should be noted that microarrays are not without their own weaknesses. Although many advances have been made, genomic analysis is still a burgeoning field with barely two decades worth of research behind it. One such limitation is cost. Microarrays, in spite of becoming smaller, more condensed and cheaper to fabricate, are not considered inexpensive; major difficulties (especially for smaller laboratories) with technical replicates, and in some cases even biological replicates, are far from uncommon [17]. Additionally, standardization is only a recent phenomenon and interstudy comparisons are still a major hurdle. Differences between arrays often seem innumerable, ranging from more benign situations, such as varying numbers of probe replicates for a given spot, to conditions that fully prevent array comparisons, like evaluating a two-channel array with competitive hybridization against a pair of singlechannel arrays showing absolute expression [18]. Even with mass-produced identical arrays, the human component introduces its own sources of study error [19]. Fortunately, judicious use of mutli-method techniques and pooling of data and results allows aggregation of disparate studies into viable datasets for joint analysis. Pooling of data, no matter the underlying design, attempts to address concerns over reduced statistical power, which commonly arises from issues due to small sample sizes. By looking at a common effect measure from studies with similar research hypotheses, 7
19 inferences can be drawn to better estimate a true population parameter [20]. Joint measurements allow for generalities to the population to be more easily drawn, effect size parameters from multiple studies to be combined into a single measure, and accountability for confounding variables due to inter-study variability within a larger model [21]. When used properly, a pooled analysis can yield effect parameters that might have otherwise been masked by a single experiment. These aggregation methods are well established analysis techniques. For example, meta-analysis was first used as a viable process in 1904 by Karl Pearson, the founding father of modern statistics, and has since undergone numerous adjustments and refinements, from the coining of the term meta-analysis by Gene Glass in 1976 to the development of the Cochrane handbook, a gold-standard in meta-analysis techniques. The use of meta-analysis has also been applied to numerous fields including psychotherapy, epidemiology and, as is becoming more and more common, genetic array analysis [22, 23]. Addressing issues such as collective normalization and background subtraction alleviates many of the concerns inherent to inter-study analysis of arrays. Pooling techniques are further facilitated through powerful software packages that have numerous normalization and aggregation methods available, such as the Affy module of the Bioconductor package of R [24]. However, like all multi-study methods, the utility of the pooled genetic analysis is dependent on the strength of the individual studies. Experiments must be as similar as possible with respect to the effect size which was measured and the research question asked. This is especially important 8
20 since, by nature, the bias sources for the individual studies are ignored. Ultimately, this highlights the importance of the initial selection of the experiments to be used. By being stringent in selection from the literature, studies that are initially evaluated using poor statistics can be avoided [25]. Despite these concerns, pooling analyses are powerful and robust techniques that can effectively bring to light inferences and conclusions that would have otherwise been lost to shallow statistical power. 1.4 Other high-throughput techniques Much insight has been gained through mrna profiling, allowing differentially expressed genes to be identified in a number of biological conditions across a breadth of organisms. Yet the presence of mrna is only a single facet of the central dogma. Correspondingly, research has also been directed towards developing other methods to analyze genetic and molecular signals such as variations and adaptations of the in situ method of chromatin-immunoprecipitation (ChIP)[26]. In its most basic form, immunoprecipitation elucidates and isolates proteins that have been histochemically bound to an antibody (selected specific for the protein) that is additionally tailored to allow for ease of collection and enrichment. When the targeted proteins are also chromatin-bound, the antibody complexes can additionally affix the protein-associated tracts of genomic DNA thus collecting actual binding sites for the protein of interest. After purification, these harvested stretches of nucleic acids can be 9
21 evaluated using any number of standard sequence-based high-throughput techniques; for example, hybridization against microarray probes as in the prototypical ChIP-on-Chip methodology [27]. In addition to the obvious utility with microarray screening, another method expands on the tag tabulation aspects of serial analysis to uniquely identify binding loci and quantify transcription factor association using a process called Serial Analysis of Chromatin Occupancy (SACO, see figure 3). SACO begins much like any standard ChIP experiment, by sonicating chromatin and using antibodies to separate out the desired transcription factor associated nucleotides. After isolation and purification (including the use of multiple endonucleases to remove contamination by PCR purification adapters as well as artifact effects due to undigested DNA) the previously bound DNA sites are ready for sequence-based analysis to evaluate loci affinity to the transcription factor being studied [28]. This analysis process utilizes the same principles as the serial analysis of gene expression by concatenating tags that uniquely identify genes, creating vectors readymade for amplification and sequencing. Tabulation against a sequence database not only identifies ostensible binding sites, but also provides a discrete measure of affinity using tag counts. As such, the collected SACO library gives a great deal of insight towards transcription factor associations, quantifying binding while allowing for the discovery of novel sites. By evaluating chromatin under various experimental conditions, a binding profile for a transcription factor of interest can be developed much like an expression profile is assembled from a standard mrna serial analysis. 10
22 Many in silico methods are also in place to help researchers understand the intricacies of various biological conditions, notably the protein-protein interaction (PPI) network [29]. Although a PPI network is developed, visualized and analyzed using software, the data itself comes from laboratory bench results as well as validated citations from the literature and widely accessible protein databases [30]. In this regard, a PPI network is simply another type of aggregate study using the condition of gene product interaction, whatever form it may take, as the joint effect. By evaluating codings upon the nodes and edges in the network, statistical inferences can be drawn ranging from strength of interactions, to levels of connectivity, to the classification of a specific gene/protein as a hub involved in multiple higher order physiological processes [31]. Adjusting the presence of nodes, by either parsing out less important nodes or adding nodes that create new interactions, in turn recreates the interacting topology so that multiple networks can be compared; disruptions in the network due to biological conditions are highlighted and genes/gene products not immediately implicated in the condition of interest through previous laboratory methods can be isolated [32]. A pure expression profile of mrna is certainly a valuable and viable technique for genetic signal analysis; although, much like the role of mrna in the central dogma, it is but one of many aspects relating to the genetic and proteomic changes resulting from a physiological effect. 11
23 1.5 A multi-method approach Despite the breadth of testable methods for genetic activity available, only a few studies have attempted to combine multiple, disparate measures together in order to develop more refined and direct models of the genetics of biological states. Some studies have combined differential expression metrics into PPI networks to assess changes in mrna expression and graph node connectivity. Most studies have focused on specific diseases such as gastric cancer [33] and diabetes [34] although some such as Xu et. al. [35] have attempted to identify multiple candidate disease genes by evaluating the topology of numerous networks with respect to differential expression of disease-associated genes. The study met with a degree of success but was mainly seen as validation studies rather than an attempt to elicit new information regarding genetic markers for their ailments of interest. Camargo et. al. [36] created a de novo PPI network based on a specific array study and coded the ensuing network with differential expression with regards to human heart failure. Although details about specific genes and gene products were not discussed in their study, a number of interesting observations were made. One such discovery noted differentially expressed nodes were not highly connected, but the neighbors of these nodes did show high connectivity. These results just begin to emphasize the potential a combined approach could bring to genetic marker analysis. Due to its extensive prevalence, high mortality rate, ease of treatment when properly detected, and an enormous literature collection of biological effects, colorectal adenocarcinomas are an ideal candidate for such a collective analysis. 12
24 This study brought the idea of a combined approach further by looking for genes that fit multiple categories of experimental classification from a range of measures including differential expression, direct chromatin binding, and levels of protein product connectivity. To emphasize the role of pathways previously implicated in early adenoma development, literature studies were limited to patient colorectal adenomas albeit in conjunction with cancerous simulating cell lines. These experimental modules were also compared against normal colonic mucosa. Additionally, co-expression was examined within each sample medium to look for disruptions due to changes in transcription during adenomatous development, and related to protein product interactions. The goal of this study was one of discovery, both with regards to identification of genes highly implicated in colon adenocarcinoma development and to assess the validity of a multi-method approach in implicating such genes. Although many individual questions were posited, the primary research question asked was can any novel information related to genes, their protein products, their biological interactions and their regulatory control in colorectal adenocarcinomas be determined using a multi-method approach? 13
25 CHAPTER 2 METHODS 2.1 Literature search for expression studies The available literature was searched for mrna expression experiments to be utilized in the pooled study of differential and co-expression. Two experimental groups were considered based on the sample medium of a given array; one module based on derived cancerous cell lines (HCT116 and LS174T specifically [37, 38]) with the other exclusive to human colon adenomatous tissue. Both of these groups were compared against a third collection of data, where normal human colon mucosa was considered as a control group. To appropriately run the meta-analysis, a number of restrictions were placed on the potential studies: i. The experiments must have been run using the Affymetrix GeneChip HG-U133 Plus 2.0 array [39]. As a consequence, only a single CDF file was required ii. RNA extraction of the samples was done with RNeasy and the probe sets were labeled using the standard reagents, quantities and procedures as described by Affymetrix iii. Fluorescent signals from the array were read using a GeneChip Scanner to create CEL files available in their entirety from a public repository e.g. GEO 14
26 CEL files of the biological replicates matching these criteria were downloaded and grouped based on the three tissue conditions (cancerous cell/patient adenoma/mucosa control) before being subjected to analysis. These restriction criteria conferred a number of advantages to the aggregation study, the most notable benefit being the standardization inherent to the Affymetrix array. By focusing on a single probe set (contained in one of the most comprehensive arrays available) there would be little confounding due to missing probes, differing numbers of repeated sequences within spots, or other concerns that could arise by comparing multiple array types against each other. Furthermore, using the CEL intensity files allowed for normalization to be done before aggregation so that the pooled analysis was based on the raw data rather than summary statistics. This limited any statistical inequities that may have arisen within the analysis of an individual study. Finally, any subsequent microarray experiments suggested based on these results can be easily validated since the HG-U133 Plus 2.0 array is so well characterized. 2.2 Normalization of CEL files to absolute intensity The downloaded CEL files were analyzed using the Affy package of the Bioconductor module of R [40, 41]. Analysis began with normalization and background subtraction. Since the collected studies were taken from a variety of experiments and laboratories, 15
27 there existed a potential to have a large amount of inter-study variability introduced, which would need to be removed with a strong normalization technique. Conversely, it could be argued the standardization inherent to the Affymetrix arrays would adequately limit the cross-study variance, requiring a less forceful normalization [42]. To address this question of baseline, three separate normalizations and background subtraction combinations (listed below in increasing strength) were run and compared: 1. Linear scaling using a pre-summarization normalization of MAS 5.0 (utilizing the 16 square MAS 5.0 background correction with and idealized mismatch pair subtraction) 2. The dchip method of invariant set scaling against a median expression reference from the data file (although again utilizing the MAS 5.0 background correction with idealized mismatch subtraction) [43] 3. Quantile normalization via Robust Multi-Array Average (using RMA background correction with no subtraction of mismatch hybridization) [44] The normalization process was evaluated by looking at the box plots for all arrays within each module. Centering of the IQRs was compared as were spots differentially identified as outliers. These criteria were used to select the least stringent normalization method that adequately centered the expression intensities while still retaining the natural variability of the data. 16
28 To assess inter-module variability, the normalization was applied in two fashions: to each array module separately (separate normalization) and to all arrays in all modules at one time (collected normalization). Although the self-contained nature of co-expression analysis necessitates a separate analysis, different requirements exist for appropriate testing of differential gene regulation. Ideally, any differential expression calculations would be done on arrays that have all been normalized together; however, a concern with the collected normalization is that smaller differences at the expression level could be lost among the modules when they are aggregated together. To address this, the scatter-plots for the collected normalization were evaluated to identify excessive scattering, as determined by correlation. Considerations for both methods exist with regards to calculating differential expression. A consequence of the separate normalization would be placing the baseline expression of the various modules at different levels. However, this method also highlights differences based on tissue type that may have been lost with a collected normalization. Ultimately, the goal of the normalization process was to bring all the tested studies to a common field at the expression index level albeit within reason. Since co-expression analysis is module specific, first thoughts suggested that a collected normalization may be of no real benefit. Although differential expression would ideally be measured with all biological replicates normalized together, excessive data point scattering at the origin 17
29 was concerned to have greatly affected any correlation so that the collected normalization could introduce even more variance into the model than already existed. The summarization metric used was also directed by the normalization method selected. Linear scaling uses MAS 5.0 s robust average (average difference could also have been used but is considered a poorer metric), invariant set normalization is summarized with the model based expression-indexes of Li and Wong, and the quantile normalization makes use of the median polish metric. Each measure was given (and was statistically tested) on the log 2 scale. After normalization and subtraction, an absolute intensity value was then available for each probe spot corresponding to the biological replicates within that module. These absolute expression intensities were subsequently used to test for differential expression between modules and co-expression within a module. 2.3 Differential Expression The summarized, absolute expression values were used to determine the relative foldchanges in mrna expression from one module to the next (for all three modules) in a pair-wise fashion. Significantly differentially expressed genes were identified by creating a generalized linear model implemented using the LIMMA package of Bioconductor [45]. As mentioned, all data was pre-processed using the Affy package; therefore, linear model creation was done via normalized summarizations on a log 2 18
30 scale for each gene of each array. Generation of the linear model utilized an empirical Bayesian approach to create a priors distribution from the data itself, with the design matrix organized to keep the individual experimental modules distinct. A pair-wise comparison between all three modules for each gene determined differential expression after selecting for genes using a false discovery rate of 5% [46]. 2.4 Co-expression Co-expression of all gene pairs was determined by correlating the absolute intensities of the biological replicates of a gene pair within a given module, for each module. This gave three Pearson s correlation coefficients for each gene pair, one corresponding to each of the three modules. Changes in co-expression between modules were evaluated for each gene pair to test for disruptions in gene co-expression under disease conditions. Multi-factorial statistical testing was done using one-way ANOVA to compare changes in Pearson s r for each gene pair across the three modules. Multiple tests were controlled for by using a false discovery rate of 5%. 2.5 Module comparison: patient vs cell-line At this early stage assessment, the expression patterns were compared between the cancerous simulating cell-line module and the adenomatous patient tissue module to test for differences in co-expression and differential expression between the sample 19
31 sources. The specific metrics looked for genes that were differentially expressed, or showed disruption in co-expression, in one module but not the other. A small fraction threshold (less than 1%) was put into place to demarcate genes as being shown to have different expression patterns between patient tissue and cell lines to represent progression of colorectal adenocarcinomas. A consequence of the sample modules having a similar pattern of gene regulation was a need for normalization, summarization and statistical analysis to be rerun using cell-line data and patient tissue data aggregated together so that all comparisons would then be considered as adenomatous/cancerous expression vs mucosa control. Conversely, differences in fold-changes of expression or co-expression patterns between cell lines and patient tissue would keep the modules separate. As was known in advance, the largest consequence from this would occur during evaluation of the PPI network since separate codings would be required for differential expression and co-expression based on the tissue condition of the module and relative progression of the disease. 2.6 Wnt transcription factor binding data In addition to the mrna expression data, transcription factor binding data in colorectal carcinomas was used as a measure of implication in colon tumorigenesis. Due to vast differences in techniques and a general limitation on available data, an aggregation of the transcription factor binding was not run. Instead, a study by Yochum et. al. [47] was utilized which used the previously described SACO technique to quantify the number of 20
32 gene sequence tags that were bound to β-catenin. Since the study involved transcription factors involved in the canonical Wnt pathway they provided extra insight into potential genetic markers for colon adenocarcinomas. A threshold was specifically established to determine if a particular gene can be classified as a strong, direct target of β-catenin. This was possible as the SACO approach gives a quantifiable measure for tagged gene loci. Tags that were found to be located close together were grouped into a single cluster giving a specific gene not only a number of tags, but a number of clusters as well. For a gene to be considered a strong, direct target of β-catenin, the gene was required to show at least one cluster with a minimum of three tags. Once a gene matches met this threshold any subsequent evaluation considered all tags for that gene, regardless of cluster associations. 2.7 Expression patterns and β-catenin binding At this stage, an evaluation determined which genes already fit multiple criteria related to colorectal adenocarcinomas, namely showing either differential expression and/or disrupted coexpression in addition to being a direct transcription factor target. This created a first-stage assessment for comparison against subsequent curations to see if additional information identified any new genes as being relevant to adenocarcinoma development. In its own right, this collection is useful as a list of direct targets of the Wnt pathway differentially expressed under disease conditions. 21
33 Before this association could be done, the fraction of unique high-confidence β-catenin target tags that could be mapped to the probe set tags of the HG-U133 array was calculated in order to verify an appropriate collection of affiliated probes could be used for meaningful interpretation. SACO tags that were unable to be mapped were marked for addition to the discovery PPI network. Furthermore, the coverage of the binding data was potentially less than the coverage of the HG-U133 chips used in the expression studies which may have had a further effect on data interpretation. Because of this coverage issue, analysis was limited to those genes that could be adequately mapped from the SACO library. 2.8 The protein-protein interaction networks To serve as a structural backbone for the expression and binding data, a protein product interaction network was developed using previously determined genes related to Wnt and colorectal adenocarcinoma development. This protein-protein interaction (PPI) network was comprised of gene products known for their involvement with the Wnt pathway as determined by the literature. The intent of this PPI network was as a validated model to highlight the current state of known interactions as they relate to Wnt and colorectal adenocarcinoma development in order to further refine their specific role and timeline. Confirmed genes were identified using Agilent s Literature 22
34 Search program along with verified interactions as determined by the cpath database of molecular associations [48]. Beyond its initial utility, this network had potential to be used as a baseline and seed network for a second discovery network designed to be much larger and much more comprehensive. By selecting and expanding on genes identified as notable participants in adenocarcinoma development, this discovery network could identify genes related to the source nodes yet not originally implicated in the canonical Wnt pathway. As would be expected from an array of this size, the topology of the network would be of less use since many nodes potentially have no classification. Unlike the validated network, the purpose of the discovery network would be to start with a large list of potential candidates (namely the added nodes expanded from around the seed proteins) that would be subsequently reduced based on the extensive codings of the nodes. All networks were visualized and analyzed using the program Cytoscape [49]. Cytoscape allows for easy coding and statistical assessment and also includes modules for the Agilent Literature Search program as well as an interface with the cpath database. The validated network was assembled directly through Cytoscape and its modules, while the discovery network required a Java script to interface with a downloadable version of cpath s dataset to establish the comprehensive collection of interactions. 23
35 2.9 Codings for the network To obtain the full utility of the network, many codings were applied to the various nodes. 1. mrna expression specific results were applied to the network with mutually exclusive codes for a gene being significantly upregulated in adenomas and/or cell lines, significantly downregulated in adenomas and/or cell lines, or showing no differential expression. Codings were fully refined to show changes in differential expression in either patient adenoma tissue or cancerous cell lines, based on the previous comparison of mrna expression patterns between the patient tissue and cell line modules. Those nodes found in the literature but not contained with the Affymetrix array were left uncoded. 2. Genes that were found to be β-catenin targets (as per the three tag minimum previously mentioned) as indicated by the chromatin binding study were specially coded as being direct targets of the Wnt transcription factor. Tag counts were included in the coding indicating the total number of tags found in all clusters for the gene in question. 24
36 3. The original node population was based solely on some involvement of their protein product with the general Wnt pathway. Using the annotations of the Wnt homepage, additional coding identified specific genes that have been previously determined to be direct targets of the Wnt pathway. 4. Degree of connectivity between protein products was considered at two levels with especially connected nodes as to be marked as being either hubs (5-13 interacting neighbors) or super-hubs (14 or more neighbors). The super-hub node levels were determined heuristically in order to identify the most heavily network associated nodes. Additionally, the interacting partners of the highly connected superhub nodes were specifically marked. 5. A final coding simply identified a node as being one of a pair of genes that showed disruption in co-expression when compared between the sample modules. For coding purposes of the network, only one co-expression relation was required to be disrupted for the gene in question to flag the node although co-expression disruption hubs were identified for nodes that showed significant changes in co-expression with three or more other genes. 25
37 Thresholds for hubs and super-hubs was determined heuristically to prevent any prior self-imposed restrictions that could occur by forcing a discrete number of protein interactions or disrupted co-expression gene partners (e.g. a minimum of 10 interactions to be considered a highly connected node). Since the discovery network is highly comprehensive by design, no issues with nodes being erroneously classified using the heuristic thresholds were anticipated. Since the probe set of the HG-U133 Plus 2.0 array is designed to be genome spanning, it is a reasonable assumption that the most highly connected protein product in the network is an adequate estimate for the most highly connected protein product in the human genome when taken in conjunction with the network context of the Wnt pathway. However, it is worth mentioning the disrupted co-expressing gene pairs metric may not be an especially practical measure since a great deal of biological distance exists between transcription of mrna (co-expression) and associations of translated products (protein interactions). Nonetheless, it may be a viable metric for analysis even within the topographical context of a protein-protein interaction network and was evaluated as such. Finally, the threshold of one disruption for the final coding may seem low, but the question of interest was to identify direct participants of the Wnt pathway that have altered mrna co-expression. This made a minimum of one a necessity Evaluation of the discovery network As previously stated, the primary research question asked was, can any novel 26
38 information related to genes, their protein products, their biological interactions and their regulatory control in colorectal adenocarcinomas be determined using a multimethod approach? To address this principle question, a number of smaller questions were considered with regards to the evaluation of the discovery network after the nodes were properly coded. These questions included: Are highly connected nodes or genes heavily co-expressed in patient adenoma tissue and/or cancerous cell lines also directly targeted by transcription factors in the Wnt pathway? Do these same nodes exhibit differential mrna expression under disease conditions? Are the interacting partners of highly connected nodes directly targeted by β- catenin? Are these same interacting partners differentially expressed in adenomatous conditions? Are there any direct targets of β-catenin also showing significant changes in expression patterns that have not been previously implicated in colon adenocarcinoma development? Do nodes showing disruption of co-expression display similar pattern changes in expression under disease conditions? Are these partners also likely to show chromatin binding by β-catenin in a pattern related to their expression profiles? 27
39 Are there any implicated nodes that match multiple coding criteria of the network and warrant further examination as markers for colon tumorigenesis or potential treatment targets? From a medical treatment/detection standpoint this last question is the most critical. A specific emphasis was placed on finding differentially expressed genes in adenocarcinoma tissue, or gene pairs that are disrupted in the same disease conditions, which are also directly targeted by Wnt signaled transcription factors. The utility of the discovery network was based as much on the comprehensiveness of its extensive coding as it was on its direct interaction topology. The first goal of the network was to identify patterns between differential expression, levels of protein interaction, disruption of gene co-expression in diseased tissue, and being directly targeted by β-catenin, all within the context of a Wnt protein product network. The second goal was to identify specific nodes/genes that fit multiple criteria; especially genes found to be differentially expressed or show co-expression disruption, and are also direct targets of β-catenin. As mentioned, these nodes could further serve as seeds to make a future de novo network for comparison to the current validated network Null network model comparing observed and permuted proportions of metrics The statistical significance of the full protein interaction framework was determined through multiple random collections of nodes from the network to examine the 28
40 uniqueness of the model. This was accomplished by sampling network nodes and comparing the observed and expected proportions of nodes matching the various permutations of criteria. Four label vectors were used, in turn giving each node a binary representation as to whether it was differentially expressed, a direct target of β-catenin, a network hub or super-hub, or displayed disrupted co-expression under disease conditions. Accordingly, this led to a collection of observed proportions, using the combinations of label vectors, and an experimental network against which control models could be subsequently compared via a null hypothesis positing no difference between the observed and expected proportions of the experimental and null networks. Numerous bootstrap samples were taken from the network to test model significance. Within the experimental network, a specific number of nodes matched at least one of the individual metrics listed above with 15 different combinations possible (4 individual critiera, 6 pairs, 4 triplets and the full set of four labels). For each permutation, an equal fraction of nodes was randomly selected, with replacement, from the experimental network giving a new random set of proportions for the same fifteen metrics combinations. This expected set of criteria was used to test if the proportion of metric matched nodes expected by chance was greater than the experimentally observed proportions. This permutation and tabulation was repeated 50,000 times. Ultimately, the statistical significance of the experimental network was evaluated by testing if the chance expected proportions were larger than the observed proportions for all the examined combinations. The 15 sets of criteria tested were as follows: 29
41 The four individual metrics Significant differential expression Target of β-catenin Network hub or super-hub Disrupted co-expression The six pairs of criteria Significant differential expression and target of β-catenin Significant differential expression and network hub/super-hub Significant differential expressed and disrupted coexpression Target of β-catenin and network hub/super-hub Target of β-catenin and disrupted co-expression Network hub/super-hub and disrupted co-expression The four metric triplets of Significant differential expression, target of β-catenin, and network hub/super-hub Significant differential expression, target of β-catenin, and disrupted coexpression Significant differential expression, network hub/super-hub, and disrupted co-expression Target of β-catenin, network hub/super-hub, and disrupted co-expression 30
42 Finally, all four criteria differential expression, β-catenin targeting, extensive protein interactions and disrupted coexpression under disease conditions Although some combinations have less biological applicability, this significance testing was designed solely to assess the uniqueness of the network; therefore, comprehensiveness of the tested proportions was deemed of greater value than focusing on specific combinations of metrics that are more contextually relevant to the study. 31
43 CHAPTER 3 RESULTS 3.1 Literature search of mrna expression studies Keeping with the previously outlined criteria, ten different source studies from the literature were found with microarray data available for aggregation. Citations with individual sample counts and descriptions can be found in table 1. When grouped according to module, the original 117 individual arrays gave final totals of 12 from cell lines (9 HCT116 and 3 LS174T), 52 from patient colon adenomas and 53 from normal patient mucosa. Of the patient tissue, 32 arrays from each group were same-patient matched. Although many of the studies involving cell lines subjected them to experimental conditions, only the unaltered controls were used. This led to far less replicates but a much more appropriate dataset for the mrna expression analysis. Fortunately, limited replicates of the cell lines were of less concern due to little overall variation in mrna expression from generation to generation for the diploid lines. Both cell lines carry mutations to their final β-catenin products that prevent them from being marked for phosphorylation. In turn, they are unable to be degraded in the cytoplasm and easily transfect into the nucleus effectively mirroring the cancerous conditions affiliated with 32
44 extensive Wnt activation. As a result of their similarity (diploid, mutations to β-catenin, wild-type alleles of p53 and APC), the two cell lines were grouped into a single module for analysis purposes to further enhance the underlying statistical power. 3.2 Normalization assessment for pooling Of the three normalization procedures tested (MAS 5.0, dchip, RMA), Robust Multiarray Average gave the best overall normalization when compared during exploratory data analysis. Overall, the quantile normalization method of RMA resulted in much closer median intensities when compared across disease conditions and sample sources. For initial analysis, each module was normalized individually and then normalized as a single group to compare intensities. Both density graphs of module intensities as well as box plots of each array showed RMA had the most effective normalization for the disparate sources. It did so while retaining differences in expression due to variation in sample rather than array analysis technique and keeping the same robustness found in the less stringent normalizations. Density curves for the various module comparisons can be found in figure 4 while the box plots of intensities are shown in figure Aggregate study of mrna expression Given the three distinct sample groups, the linear model used to test mrna expression significance contained three different comparisons: normal patient mucosa vs 33
45 adenomatous patient tissue (N-A), normal patient mucosa vs cancerous cell lines (N-C), and adenomatous patient tissue vs cancerous cell lines (A-C). In addition to the false discovery rate of 5%, an mrna differential expression threshold of a 1.5x fold change in either direction was applied to indicate those genes with the most extensive alterations in their expression profiles due to the disease conditions. Gene counts are out of the total probes on the Affymetrix HG-U133 Plus 2.0 array. For the N-A comparison, 5135 probes (2626 upregulated and 2509 downregulated) met the significance and expression thresholds while the N-C comparison identified probes (8515 upregulated and 7563 downregulated). The A-C comparison found probes (5782 upregulated and 5828 downregulated) with differential expression between the two disease modules. For further information see table 2. Breakdown counts of those probes showing differential expression in multiple comparisons can be found in the Venn diagram in figure 6. Despite the isolation of probes by comparison, it was important to further refine the probe set to identify genes showing concordant expression between the N-A and N-C comparisons. This would ensure that identified genes showed the same expression profile across both the adenomatous and cancerous conditions as would be expected for the typical progression of an adenocarcinoma in vivo. Probes with discordant expression on the other hand would be expected from genes involved with regulation or other functions outside the realm of adenocarcinoma development and would be of little interest in the current study. In total, 4356 distinct probes with significant changes 34
46 in mrna expression were found to meet the fold-change threshold of 50% in both the N-A as well as the N-C comparison. Of those, 271 (6.2%) showed discordance with differential expression in different directions between the two comparisons and were not considered for the analysis. For individual counts based on direction of concordant differential expression see table 3. The remaining 4085 probes were further organized into six sets based on direction of concordance (N-A and N-C upregulated or downregulated) in addition to the relative expression of the cell lines compared to the adenomatous tissue (A-C upregulated, downregulated or no change in expression between disease states). Listings of the top 5 probes and their fold changes for each of the six groupings can be found in tables 4a and 4b. Even before the application of the transcription factor binding and the protein interaction network backbone, the pooled analysis had already given an excellent comparison of changes in mrna expression profiles under the colorectal adenocarcinoma conditions across the entire spectrum of development from normal mucosa to benign adenoma to malignant carcinoma. Coexpression analysis was done by first filtering the total gene set based on the soon to be described protein interaction network. After limiting analyzed genes to those found in the network, 32 disruptions were found across a total of 29 unique genes. These disruptions were based off their alterations in expression when compared between normal mucosa and patient adenomas. 35
47 3.4 Filtering of SACO data of β-catenin binding By applying the criteria of at least 3 tags in a cluster on a gene, 1636 genes were identified as direct targets of β-catenin under the cancerous conditions of the HCT116 cell line. Of those 1636 direct targets, 213 also exhibited changes in differential expression concordantly in the N-A and N-C comparisons of the mrna analysis. Of the total set, 115 showed concordant upregulation under disease conditions while 98 were downregulated. The complete list of upregulated and downregulated genes, along with their fold changes for each comparison and the total number of SACO tags across all clusters for that gene, can be found in tables 5.a and 5.b respectively. Note that although an increased number of tags probe certainly implies a greater affinity for β-catenin to that specific gene, it is not necessarily a measure of strength of association or propensity for expression of said gene and should not be seen as such. Nonetheless, meeting the tag criteria previously established unquestionably identifies the gene as a target of β-catenin which was the primary factor in this study. 3.5 The protein product interaction network Initial assembly of the protein-protein interaction network was carried out via Pathway Commons as a point-of-access repository. Specifically, Cancer Cell Map s and NCI s Natural Protein Interactions databases were used to populate the Wnt pathway network. Once initial compilation was finished, the network was comprised of
48 nodes with 554 interactions. With the backbone of the analysis in place, results from the mrna expression and β-catenin targeting studies were overlain on the network along with appropriate network metrics to identify levels of connectivity. Of the 168 nodes, 111 also had matching probes on the Affymetrix HG-U Plus array while 16 nodes were identified as direct targets of β-catenin by the SACO filtering. With regards to connectivity, 36 nodes qualified as hubs (5-13 neighbor nodes) while 5 nodes were found as super-hubs (14+ neighbors) due to the uniqueness of their neighbor counts. For comparison, 6 hubs (a number greater than the total of super-hubs) had 13 neighbors. Further details on the network can be found in table 6 and an overview image of the populated network can be seen with figure Network nodes with single metrics of interest Although emphasis was on the identification of nodes meeting multiple criteria, it was deemed important to also determine which genes within the network were prominent participants in the role of the Wnt pathway in colorectal adenocarcinoma development simply based on single metric involvement. Towards that end, 20 genes were identified as having upregulation of mrna expression under the disease conditions (3 in patient adenomas only, 11 in cancerous cell lines only, and 6 upregulated in both conditions, see table 7). With respect to downregulation of expression, 17 additional nodes were found (none unique to adenomas but 12 in cancerous cell lines and 5 in both, see table 8). As stated in the expression study results, 29 nodes were involved in 32 different 37
49 coexpression disruptions under adenomatous conditions with 7 nodes showing disruptions with three or more other nodes (see table 9). The 16 SACO targets of β-catenin have already been mentioned, but there were also 30 first-degree neighbor nodes of those targets, identified as potentially informative downstream participants (see table 10). Therefore under similar reasoning, beyond the 35 hubs and 5 superhubs, 41 first-degree neighbors of the super-hubs were also isolated (see table 11). Finally, the previously validated targets found on the Wnt homepage accounted for 13 nodes with 23 first-degree neighbors of their own (see table 12). Tables 7-12 contain extensive color-coding to aid in tracking nodes across the various combinations of evaluated metrics that were assessed; a descriptive legend of the codings can be found in figure Nodes matching multiple criteria and a final network While the single metrics were of great value, of particular interest were those nodes which fit into numerous different categories. Among the most notable were the 16 direct β-catenin targets of the network. A total of 5 targets were found to be upregulated under disease conditions (N-A only FHL2, AXIN2; N-C only FBXW11; both conditions CCND1) while 2 were downregulated (LRP1, TAX1BP3 - both in the N-C comparison only). Furthermore, 2 targets were also super-hubs (CSNK1A1 and CTBP1) with 8 of the hub neighbors targets themselves (in addition to hubs CSNK1A1 and CTBP1 - FBXW11, FHL2, MACF1, NFATC2, TCF7L2, TLE1). Iterations continued by also observing 38
50 the 30 neighbors of β-catenin targets that were additionally upregulated (Total 4; N-A only 1; N-C only 2; both conditions 1), downregulated (4 total; all in the N-C comparison only), super-hubs (all 5 super-hubs were target neighbors) and hub neighbors (21 total). A similar set of secondary classifications was carried out on the super-hubs and their first-degree neighbors. Although none of the super-hubs were upregulated in patient adenomas or cancerous cell lines, 1 was downregulated (CTNNB1 in the N-C comparison only). As mentioned earlier, CSNK1A1 and CTBP1 were identified as targets of β-catenin and all five super-hubs were neighbors of direct targets. With respect to the 42 superhub neighbors, 7 nodes were found to be upregulated (N-A only 2; N-C only 4; both conditions 1) while another 7 were downregulated (N-A only 0; N-C only 6; both conditions 1). Direct targeting by β-catenin was found for 8 of the super-hub neighbors with 21 also being neighbors of directly targeted nodes. The identification of upregulated, downregulated, targeted or hub nodes was overlapped with two more criteria: disruption of coexpression under adenomatous constraints and previous identification as a target of the Wnt pathway as per the Wnt homepage. The collection of disrupted nodes included 5 upregulated genes (N-A only 1; N-C only 3; both conditions 1), 7 downregulated (N-A only 0; N-C only 4; both conditions 3), 4 β-catenin targets and 10 target neighbors, and a single super-hub (AXIN1) along with 8 super-hub neighbors. For the final metrics pairings, the previously 39
51 identified Wnt targets included 5 upregulated genes (N-A only 1; N-C only 3; both conditions 1), 3 downregulated genes (all found in the N-C comparison only), 2 β-catenin targets and 4 direct target neighbors. None of the super-hubs were implicated but 5 super-hub neighbors were. Having determined those genes strongly implicated in Wnt-related development of colorectal adenocarcinomas via multiple categorization, a final network was compiled showing the interactions between all identified nodes. This refinement (representation in figure 9 with node metrics in table 13) was the final network used for visualization of critical nodes. With a selection of pertinent genes, categorization and annotation was straightforward as well as enlightening. 3.8 Assessment of the null model With the production of the final network complete, the uniqueness of the model was tested by comparing the experimentally observed and randomly collected prediction proportions for nodes meeting the multiple network criteria in tandem. Of the 168 nodes in the final network, 107 displayed at least one of the overlain metrics. Thus, each permutation consisted of 107 nodes randomly collected from the experimental sample space to create a new set of proportions. Specifics on the observed and expected proportions for each of the 15 tested metrics combinations can be found in table 14. As shown, none of the calculated proportions of label combinations were 40
52 found to exceed the proportions seen within the experimental network (p< for all 15 proportions), showing a significant network representative of the actual patterns of differential expression, transcription factor binding, protein interactions and coexpression disruption found in colorectal adenocarcinomas. In truth, this is the best validation for the study s model since it corroborates the uniqueness of the network. No matter how well-described, enlightening or informative the network is, it can only be of real value if it is shown to be significantly valid and not simply an amalgamation of chance. 3.9 Annotation of function for identified genes/nodes The final selection of 65 nodes was organized based on annotation and ontologies, with the entire collection easily fitting into one of eight categories of biological activity; the various functional groups and their corresponding genes included: Cell growth, proliferation and life cycle moderation CCND1, CDC42, CTBP1, PIN1, PPP2R5D Phosphorylation and ubiquitination AXIN1, AXIN2, FBXW11, APC, BTRC, CUL1, SKP1, GSK3B, CSNK1A1, CSNK1D, MAP3K4, MAP3K7 Cell fate, differentiation and polarity 41
53 AES, SOX1, CDX1, MARK2 Epigenetics and histone modification HDAC1, SALL1, RUVBL1, CREBBP Cell-cell interactions, molecular transport and inter-cellular signaling MAGI3, DLG1, GNG2, CDH1, MACF1, RAN, RANBP3, PIAS4 Wnt pathway receptors and cofactors DVL1, DVL2, FZD1, FZD3, FZD5, LRP1, LRP6, DKK1, KREMEN2, TLE1 Ubiquitously expressed genes CTNNB1, TCF4, TCF7L2, MYC, FHL2, NFATC2, PRKCA, TAX1BP3, FRAT1, SMAD3, SMAD4, ARRB2 Expression localized outside the colon LRP5, NLK, RUNX2, SFRP2, FZD7, WNT3A, CAMK2D, DAB2, MAP1B, NR5A1 Ultimately, this collection of genes was the final dataset for the study. As a whole it constituted, within the context of a protein interaction network of the Wnt pathway, a collection of genes notable for their involvement in the development and progression of colon adenocarcinomas. By combing multiple metrics including changes to mrna expression profiles, targeting by the canonical Wnt transcript factor β-catenin, and specifics to the interaction network itself, a compilation of pertinent genes became 42
54 available to evaluate for possible roles in the detection and intervention of colorectal cancer. 43
55 CHAPTER 4 DISCUSSION 4.1 Initial analysis differential expression profiles and direct β-catenin targeting Even the earliest assessments of the study yielded insight towards potential genes of interest in colorectal adenocarcinoma development. Specifically this includes the overlap of probes showing significant differential expression in the HG-U Plus arrays as well as being identified as direct targets of β-catenin. Even before the application of the protein interaction framework, this initial analysis immediately identified key genes whose expression and binding profiles, alongside their functional activity, could prove them to be efficacious targets in discovery and treatment. Of the most differentially expressed genes shown in tables 4.a and 4.b, five probes in particular stood out among the annotated set. CDA 5 SACO tags; N-A FC: -3.09; N-C FC: The final protein product for this gene is Cytidine Deaminase, a standard pyrmidine scavenger. Of particular note, the CDA protein also catalyzes deamination of nucleoside analogs such as the therapeutic Ara-C. This becomes especially key since administration of Ara-C has become a common treatment for acute myeloid leukemia with associated drug resistance attributed to CDA activity [50]. Although its presence leads to a 44
56 dampening of therapeutic treatments in some cancers, it was interesting to see CDA showing reduced expression under the current disease conditions. CDH3 9 SACO tags; N-A FC: +6.43; N-C FC: Leads to the production of Cadherin3, one of the many membrane-bound glycoproteins involved in calciumdependent cell-cell adhesion. Of particular interest is evidence that cells expressing CDH3 tend to bind together preferentially over parental cell lines showing reduced expression of the gene [51]. Alongside the increased mrna transcription, this suggests a precedence for cells constitutively expressing CDH3 to affiliate together, creating a direct implication towards the promotion of adenocarcinoma development. Note that multiple cadherin genes exist albeit without the intriguing profile of CDH3. For example, note that CDH1 (PPI network member and known Wnt target) was found to be downregulated in cancerous cell lines (N-A-1.206, N-C ). KIAA SACO tags; N-A FC: ; N-C FC: One of the more novel probes implicated by this study, KIAA1199 has recently come under scrutiny for its possible involvement in adenoma development, specifically by one of the source studies used for the pooled analysis of mrna differential expression [52]. In normal tissue it is typically expressed in the cochlea of the ear although its specific function is largely uncharacterized [53]. Nonetheless, KIAA1199 has also been located in intestinal crypts, and in conjunction with its expression and binding 45
57 patterns, could be well worth further investigation towards its function in colon carcinogenesis. MAMDC2 7 SACO tags; N-A: -5.71; N-C: Final protein product is a member of a protein family characterized by their possession of a MAM (mephrin, A5 antigen, protein tyrosine phosphatase mu) domain. Much like KIAA1199, the specific function of this gene is unknown. Previous experimentation discovered the gene during walks on chromosome 9 while looking for altered genes due to the congenital disorder Kabuki Syndrome [54]. Although MAMDC2 was unaltered for that disease, the differences between a pediatric development disorder and a nascent adenocarcinoma are rather obvious. Given MAMDC2 s notable expression and binding profile, it may well be worth further research to determine a precise role in tumorigenesis. PYY 5 SACO tags; N-A FC: ; N-C FC: Expression leads to the final protein product Peptide Tyrosine Tyrosine. The protein is secreted from the pancreas and regulates both the intestine and duodenum through a combination of inhibition of gastric acid as well as digestive enzymes [55]. While much characterization has been related to appetite regulation (e.g. PYY application and food intake), interestingly, peripheral application has been found to upregulate expression of the proto-oncogene c-fos [56]. A strong inhibition under the presence of β-catenin suggests a critical role for gastric acid and digestive enzymes 46
58 in the promotion of a normal mucosa state. Activation of PYY and other related genes may in turn have a role as potential treatment options for adenomas and possibly even cancerous tumors. Even without the backdrop of the in silico Wnt pathway network, a great deal of insight in to noteworthy participants in carcinogenesis was readily available from just the pure experimental data. 4.2 Biological annotation the 8 functional activity categories for the refined network The final refinement to the network was the inclusion of functional headings to organize the biological activity of the previously identified nodes; instead of being reductive, this created another layer of information for the network. Nonetheless, it was important to design appropriate categories that reflected the typical activities inherent to colorectal disease development but also not restrictively exclusive or limiting. With all the nodes originally united by a common theme of Wnt involvement, a focus towards specific functions which promote tumor formation and progression was considered of greatest importance and can be seen in the first five categories. The final three categories (Wnt participation, ubiquitous expression, and non-intestinal localization) were created to account for genes which, although no less potentially critical, did not readily fall under one of the banners related to adenocarcinoma development. 47
59 4.3 Cell growth, proliferation and regulation of the cell cycle Unquestionably, uncontrolled cell growth and reproduction are hallmarks of carcinoma development in the whole body, including the intestine, making this a rather clear-cut category. Genes involved with cell cycle regulation in particular are especially key points of interest and worthy of further study. This is especially true when they are found to be differentially expressed or translated under adenomatous or cancerous conditions. Of the five genes placed in the group, the most notable is the cyclin CCND1, one of the few nodes identified for both direct β-catenin binding as well as differential expression. Its upregulation (common in both carcinoma and adenoma expression profiles) eminently suggests disruption at the G phase wherein individual cell growth is limited and rapid cell division is encouraged [57]. Although not bound by β-catenin directly, CDC42 is a neighbor of a transcription factor target as well as being downregulated, a combination suggestive of downstream activation. Although the reduced expression seems misleading since CDC42 is a known activator of the cell cycle, it is also involved in assymetrical cell division in epithelium [58]. Considering adenocarcinoma propagation requires symmetrical division to maintain the undifferentiated status of the daughter cells, the reduction in mrna expression fits nicely given the context. The major phosphotase PPP2R5D also follows an initially deceptive expression profile since, as a negative cell cycle regulator, it would be expected to limit a propensity towards uncontrolled cell reproduction. However, it is 48
60 commonly found in the nucleus of mitotic and recently divided cells [59], giving its presence in the disease conditions just as much credence with the rapid division characteristic of adenocarcinomas. Supplementary downstream activity is even suggested by the classification of CTBP1 as both a super-hub and direct target of β-catenin. Although no changes occur in its specific expression, it is a known regulator of transcription especially during development, one of the times when Wnt activation is highly common. It would not be a stretch to envision a similar regulatory role being played by CTBP1 in adenocarcinomas, with similar indirect changes taking place due to a secondary control. 4.4 Phosphorylation and ubiquitination This category was designed to emphasize the role of β-catenin since its destruction is preceded by the phosphorylation and ubiquitination required to mark it for degradation. As mentioned, HCT116 cells themselves are characterized by a mutation to one of β- catenin s phosphorylation sites which allows them to mirror the abundance of the transcription factor in adenocarcinomas. Not surprisingly, many of the key participants in the β-catenin marking and destruction complexes were identified in this study. Indicated members of the destruction complex included APC, SKP1 and AXIN2 although only the last one displayed any notable metrics [60]. Still, those metrics included being a super-hub, a direct target of β-catenin and even upregulation of mrna expression in 49
61 both adenomas and carcinomas. In a way, this suggests a reaction by cells as an attempt to stave off a plethora of β-catenin by utilizing its own excess to promote production of an extensive amount of AXIN2, even if the destruction complex is ineffective. Members of the SCF ubiquitination complex were also found in force, including CUL1, SKP1, FBXW11 and BTRC [61, 62]. The last two in particular showed an increase in expression (perhaps for the same proposed reasons leading to upregulation of AXIN2) with FBXW11 also being a direct target of β-catenin. Finally, it is worth mentioning the super-hub CSNK1A1 which was also a direct target. Much like CTBP1, direct targeting on a super-hub implies a certain amount of downstream activity and secondary regulation. Instead of transcriptional control, CSNK1A1 is an ubiquitously expressed phosphorylating compound that is known to target β-catenin [63]. While the activity CSNK1A1 in adenocarcinomas is not as readily explainable as other nodes, its pervasiveness and clear role in the Wnt pathway make it a prime candidate for further research. 4.5 Cell fate and differentiation, and epithelial cell polarity With so much of proper tumor development reliant on uncontrolled cell duplication, maintenance of an undifferentiated state becomes important for the malignancy to continually divide as well as metastasize into other tissues. In smooth tissues like the 50
62 intestine, tumor promotion is further confounded by the tendency of cells to adopt a certain type of polarity in response to their desired growth patterns to accommodate tissue migration and account for creation of an epithelial sheet. All comments about encouraging tumor growth aside, the regulation of cell differentiation and polarity are clearly vital aspects in adenocarcinoma development in the colon. The downregulation of CDX1 and AES both seem clear considering their involvement in determining cell fate. CDX1 in particular is noted for its role during development, especially in encouraging the differentiation of intestinal tissue [64]. AES has functionality similar to CDX1 in cell fate determination but has been previously identified in developing neurons [65]. Conversely, SOX1 is well known for its role in inhibiting differentiation, although again most commonly localized within neurons during embryogenesis [66]. Specifically, SOX1 is found in self-regenerating neurons that promote cell reproduction while limiting cell determination. Under different environmental conditions this would be fitting with the description of a developing tumor. Although changes in the mrna profile were only found in patient adenomas, it was still intriguing to identify the increased expression of a negative regulator of cell fate. 4.6 Epigenetics and histone modification Even though epigenetics is not a commonly cited facet of the Wnt pathway, its 51
63 involvement in tumor suppression and regulation in general is heavily characterized and its association with colorectal adenoma development is no exception. Notably, all epigenetic effects appear focused on acetylation based activities rather than alternate modifications such as transcription inhibition through histone methylation or direct, atypical alterations done to specific gene nucleotides. Acetylation of histones has long been known to encourage gene transcription since the bulky electrostatic additions allow access to the DNA contained within chromatin. Within the context of the cancerous cell lines, it was discovered the histone deacetylase (and known expression inhibitor [67]) SALL1 was downregulated while the acetyl transferase RUVBL1 was upregulated. As a promoter of gene expression, RUVBL1 is specifically cited for its promotion of numerous cascade pathways, including Wnt [68]. Despite none of the nodes involved with epigenetics being direct targets of β-catenin, their role in aiding adenocarcinoma development through the Wnt pathway is striking. 4.7 Cell-cell interactions, molecular transport, inter-cellular signaling Much like polarization and differentiation, cell-cell interactions, signaling and adhesion are distinct hallmarks of epithelium. Despite the loss of typical function during tumor development, tissues can still behave as they would under normal circumstances. When certain functions of a tissue directly impact adenoma or carcinoma growth and propagation there is often a selective advantage towards increasing such activity while limiting inhibition of functions counter to adenocarcinoma development. In the case of 52
64 epithelial tissue in the colon, expression related to cell-cell adhesion, mobility along the intestinal wall, and signaling between cells in the epithelium sheets should in turn be selected for so as to encourage the proliferation of tumorous cells in a disease environment. This appears to be the case with MAGI3, DLG1 and CDH1. All three genes were underexpressed in disease conditions, and from the perspective of an adenocarcinoma with good reason. MAGI3 is often expressed at cell-cell junctions and has been identified as an associative protein of PTEN, a known growth suppressor [69]. DLG1 is found at cell-cell junctions also although largely in the scaffolding required for proper neuron development. Instead of associating with a tumor suppressor, DLG1 is a suppressor itself [70]. CDH1 is a member of the same cadherin family as the previously discussed CDH3. Like other cadherins, CDH1 has key role in the motility and adhesion of epithelial sheets. Although downregulated (unlike CDH3) the loss of function of CDH1 has been heavily associated with tumor malignancy and seeing reduced expression in cancerous cell lines is to be expected [71]. Note only one direct target of β-catenin was found in this grouping: MACF1, a microtubule affixing protein at cell junctions [72]. Beyond the importance of the stable coherence of the epithelial sheet, molecular signaling and effector transport have their own role in both the Wnt pathway as well as tumorigenesis. For example, PIAS4 was found to have increased expression appropriate for its role as a sumoylation tether which inhibits LEF1 (a member of the β-catenin destruction complex) while enchancing TCF4 (the co-factor of β-catenin) and subsequently promoting Wnt activity [73]. Changing focus to inside the cell, nuclear 53
65 transport of β-catenin is a sometimes understated aspect of Wnt activation yet is no less critical than other steps. RAN and RANBP3 (both members of the family of ras-related nuclear proteins) are both critical in the transport of material into the nucleus, such as transcription factors like β-catenin [74]. Seeing their increased expression in patient adenomas and cancerous cell lines gave even further weight to the role of increased Wnt activation in the development of colorectal cancer. 4.8 Participants in the canonical Wnt pathway cofactors and receptors Given the network s backdrop of Wnt pathway involvement, it was fully expected that many genes would be key members in the regulation of β-catenin. Correspondingly, many receptors and associative compounds were identified within the network. Nonetheless, the true benefit of the overlay of multiple metrics was the refinement of the protein interaction network to identify those Wnt participants seemingly related to the fundamentals of adenocarcinoma development. Both families of cell surface receptors of Wnt were represented including FZD1, FZD3, FZD5, LRP1 and LRP6 [75]. Of key note was the downregulation of the sole direct β-catenin target LRP1. This is one of the few cases were a direct target of β-catenin under cancerous conditions was found to be down regulated. In many ways this is suggestive of a negative regulation by a transcription factor noted for activation of mrna transcription. This is even more interesting since the same inhibition is being placed on a protein whose purpose is to receive (thus galvanizing) Wnt signaling. FZD3 and FZD5 added further layers of intrigue 54
66 by being upregulated and downregulated respectively. Although a simpler explanation may exist, such as auto-regulation of FZD5 and LRP1 by β-catenin coupled with a preference towards FZD3 in adenocarcinomas, such a convoluted pattern of expression could easily warrant further investigation. Additional questions were raised during consideration of the activities of associative proteins like TLE1 and DKK1 [76]. DKK1 associates with KREMEN to form a complex that usurps LRP surface receptors thus limiting Wnt activation [77]. However, DKK1 was found to be overexpressed in disease conditions although this may be due to the often discussed self-regulation. Although there were no changes in the transcription of TLE1, it is a direct target of β-catenin and has been determined prior as a corepressor of β-catenin along with the general TCF family of transcription factors [78]. Although there is no evidence for a direct negative regulation of TLE1 by β-catenin, observing a transcription factor bind to its own corepressor has fascinating implications. Luckily, other Wnt participants have much more understandable behavior within the pathway s context. Among these are the Dsh homologs DVL1 and DVL2. Both are critical in promoting β-catenin by commandeering AXINs and binding to the cell surface in the presence of Wnt [79]. As a result, the destruction complex is unable to form and degradation of β-catenin is halted. As such, it was no great surprise to see both DVL1 and DVL2 upregulated in the cancerous cell lines. In fact given the rather counterintuitive behavior of other Wnt participants, seeing such an easily explainable 55
67 and discrete example of Wnt activation in adenocarcinomas was in many ways encouraging. 4.9 Ubiquitously expressed genes generalized functionality and multiple biological circumstances Another example of using the different metrics as a refinement of the protein interaction network was the isolation of specific nodes known for their ubiquitous expression in multiple tissues and numerous biological conditions, yet now are observed for their involvement with adenocarcinoma progression specifically. The most obvious examples were CTNNB1 (the most heavily connected node in the network) and TCF4, the members of the actual transcription activation complex in the canonical Wnt path [80]. While initial expectations would purport an increase in transcription, both genes displayed downregulation under cancerous conditions. Due to the inability of β-catenin to be degraded in the cell lines, it stands to reason there could be an effective saturation of functionality wherein less β-catenin or TCF4 is created simply because continued production no longer serves as beneficial. A similar motivation may describe the downregulation of FRAT1 which traditionally inhibits phosphorylation of β-catenin by binding to GSK3B therefore increasing Wnt activity [81]. If conditions within the cancerous cell lines were such that there were an effective limit on the amount FRAT1 that could disrupt the destruction complex, a reduction in its expression may be expected much like the suggested downregulation of CTNNB1 and TCF4. 56
68 The most notable gene within this category shared a similar pattern to LRP1; both being direct targets of β-catenin yet showing decreased mrna expression under adenocarcinomous conditions. Unlike LRP1, this gene (TAX1BP3) has its explicit function largely uncharacterized aside from its PDZ binding/signaling domain. Evidence has previously linked it to the Rho protein family of repressors yet its role remains ambiguous [82]. On a circumstantial note, the related protein TAX1BP1 has been determined to be involved with inducing apoptosis [83]. With an odd profile as a downregulated target and largely uncharacterized activity, the interactions and functionality of TAX1BP3 stand as a bastion of potential in further understanding the progression of adenocarcinomas Expression localized outside the colon When first being populated, the initial protein interaction network looked at the numerous compounds involved in the Wnt pathway with little consideration towards biological function, level of expression or localization in the body. With this in mind, it would not be unexpected to observe nodes that are largely expressed outside the colon. This has already been seen with previously identified nodes such as DLG1 and AES, both of which are typically found in neurons. Although this collection of extra-colonic genes may at first appear to be nothing more than false positives and artifacts merely matching multiple metrics due simply to the pro-wnt environment, they could very 57
69 easily represent new conditions and functions found beyond their typical utility and have additional roles in promoting adenocarcinoma development. One example uses another key participant in neuronal development, MAP1B, which showed an underexpression of mrna in disease conditions. Traditionally, MAP1B is used for joining microtubules across neurons during embryogenesis and aiding in plasticity. However, overexpression of the gene has been linked with inducing cortical neuron death [84]. Perhaps a similar trend could be applied in intestinal epithelium accounting for the reduced expression that would otherwise be detrimental to the growing adenocarcinoma. Continuing with ostensibly neuronal genes, the calcium-dependent kinase CAM2KD is frequently located within neurons to aid in long-term potentiation and has a critical role in regulating differentiation in cardiac tissue. Although a battery of Ca 2+ kinases exist, CAM2KD is singled out since it is also a direct target of β-catenin in colorectal cancer. Further pointing to a possible role in carcinoma development, CAM2KD is also the kinase variant most critical in determining the final phenotype of a number of cardiac diseases as well as being the dominantly expressed variant in multiple cancer cell lines [85]. Although no changes in expression were found under disease conditions, a potential downstream or secondary effect could be a driving force for this highly determinant gene s role in adenocarcinoma progression. 58
70 The final notable node outside the colon, DAB2, met many of the descriptive hallmarks of colorectal cancer. The gene is a known messaging component for the SCF ubiquitination complex which normally degrades β-catenin. Furthermore, its reduced expression in cancer is not uncommon. As such, seeing its downregulation in the cancerous cell lines appeared as standard validation. What was surprising was noting that DAB2 is largely found in ovarian epithelium and not in the intestine [86]. Given the activity of DAB2 in both cancer and normal tissue and considering the similarity between ovarian and intestinal epithelial sheets, DAB2 may work just as effectively as a marker for colorectal adenocarcinomas as it does for the ovarian variant Observations on nodes in the canonical Wnt pathway Of the many trends taken from the organization and annotation, some of the most interesting were the explicit roles and changes wrought on some of the key participants of the canonical Wnt pathway. As mentioned, both CTNNB1 and TCF4 showed downregulation, showing reduced expression as adenocarcinomas develop although this could be explained by functional saturation within the cell lines. Of the three FZD nodes identified, FZD3 s increase in transcription could suggest a preference for that specific cell surface receptor over members FZD1 and FZD5. Arguably the most common LRP surface receptors are LRP5 and LRP6 although neither was strongly impacted in the disease conditions; the downregulated target LRP1 is most noted for displaying such an odd coding profile and is a rare node implying negative regulation by 59
71 β-catenin. Finally, of all the members of the destruction complex for β-catenin, none were more heavily indicated by the model than AXIN2. When compared to the more constitutively expressed AXIN1, AXIN2 was found to be a direct target of β-catenin, overexpressed in disease conditions, and as a super-hub was one of the most heavily connect nodes in the protein interaction network. Although its increase transcription seems largely auto-regulatory, there is no question regarding the pivotal role AXIN2 plays in moderating adenocarcinomas Final trends The annotations of functions were the final critical portion in a study uniting mrna expression profiles, transcription factor binding data, protein interactions and functional ontologies into a descriptive framework detailing the development and progression of colorectal adenocarcinomas. The combination of genes behaving as anticipated alongside genes acting counter to expectations highlighted a number of specific nodes and general trends pertaining to the relation between Wnt and colon cancer and the use of potential genes as targets for treatment or detection. As consistently mentioned, reproduction of an undifferentiated cell is a hallmark of cancer development. Disruptions in cell cycle regulation due to malfunctions in CCND1 have long been associated with cancer growth but now arise in conjunction with binding by β-catenin. Of practical interest, the maintenance of the undifferentiated state by 60
72 expression of SOX1 in neurons may have new applications as a possible marker for early tumorigenesis resulting from an upregulation exclusive to adenomatous tissue. The possibility of negative regulation by β-catenin, whether direct or otherwise, has been mentioned while discussing genes such as TAX1BP3 and LRP1. Of a similar theme is the targeting of the super-hubs CTBP1 and CSNK1A1. Although the hubs show not direct changes in expression themselves it is often the first-order neighbors of hubs that show the distinct regulatory activities. Even considerations of negative regulation aside, having super-hubs also be direct targets of β-catenin opens much potential towards investigation into the functionality of their interacting protein neighbors. Still, both super-hubs mentioned have typical functions that appear counter towards promoting an adenocarcinomous state: CTBP1 as a known transcription repressor and CSNK1A1 is a common phosphorylating agent. Perhaps some sort of inhibitory regulation would not be so ill-suited for the transcription factor. Even with the loss of proper function, many genes still take an expected role in combating against the cancerous state. Members of the SCF ubiquitination complex such as BTRC and FBXW11, as well as the oft cited destruction complex participant AXIN2, all showed increased expression ostensibly in an attempt to reduce the excess of β-catenin typical of adenocarcinomas. Whether this was due to specific activation of these components or reduced expression of the other complex members followed by 61
73 blanket activation of all participants in β-catenin degradation is just one of many prospective questions arising from this study. An undeniable benefit in using both patient adenomas as well as cancerous cell lines is the ability to evaluate adenocarcinoma progression across its full spectrum of development. Although genes showing altered mrna transcription in either patient tissue or the cell lines were valuable in their own right, specific attention was reserved for genes showing differential expression in both disease conditions. Some are more easily described; MAGI3 s role in association with the growth suppressor PTEN could easily account for its pervasive reduction in transcription, a pattern mirrored by the epigenetic repressor SALL1. Persistent changes in expression were not limited to downregulation however. From the earliest stages of adenocarcinoma development, RUVBL1 (an epigenetic activator) and RAN (a critical nuclear translocator) are upregulated, a finding well in line with their promotion of Wnt related activity. With the breadth of insight taken from the full network analysis notwithstanding, arguably the most interesting nodes were those who lacked deep functional ontologies or were localized in non-intestinal tissues yet had now become notable genes of interest in colorectal adenocarcinoma development. CAM2KD, MAP1B and DAB2 are all expressed outside the colon (in cardiac tissue, neurons and ovarian epithelium respectively) yet have functionality and network profiles suggestive of colorectal involvement beyond their native tissues. More intriguing still were those genes not 62
74 readily described, not due to conflicting network metrics, but because their functions are still so uncharacterized. TAX1BP3, FHL2 and the non-network probe KIAA1199 are all directly bound by β-catenin and each show significant differential expression yet none are especially described in the literature. Even still, there are some functions that hint at potential roles in adenocarcinomas. As previously described, the downregulated TAX1BP3 contains a PDZ domain with the potential to inhibit Wnt signaling and increased expression of TAX1BP variants is known for inducing cell death. Additionally, FHL2 is a known coactivator in RhoA signaling as well as a negative regulator of the transcriptional repressor E4F1; its overexpression implicates similar roles in colorectal carcinogenesis. Further classification of these genes and their functions in adenocarcinoma development may herald new insights in tumorigenesis that may have been otherwise overlooked, and such a capacity for novel discovery and identification alone substantiate the merits of this study. 63
75 CHAPTER 5 CONCLUSIONS 5.1 Limitations of the current study Although many captivating results highlighting the many facets and identifying many novel points of regulation in adenocarcinomas, this study was not without its limitations. Efforts to encompass a breadth of development points in the progression from normal intestinal mucosa to adenoma and finally carcinomas were the motivation behind using patient adenomas as well as cancerous cell lines. In spite of the replicability of cell lines, the inclusion of expression data from patient carcinomas would be an easy and very valid addition to the descriptive network metrics. Such an inclusion would also allow for a much more in-depth assessment of changes in expression with respect to progression of adenocarcinomas. Even with such added information, there is always the underlying concern with the veracity of the studies used for the pooled analysis. Attempts to maintain integrity of the aggregation included the limitation of studies to the use of only a single (although very comprehensive) type of array although this in turn hindered the availability of sample arrays, especially replicates of the cell lines. Even with such safeguards there is still little end-user control of methods used for microarray procedures or tabulation of 64
76 the raw expression intensities. Ultimately, there will always be a reliance on the authenticity of the source experiments. While the use of the protein interaction network was helpful for establishing an underlying framework, it was also restrictive by limiting nodes to genes whose protein products were chosen for their participation in the Wnt pathway, preventing analysis of any prospective involvement of β-catenin in other systems and pathways. Although expansion of the network would certainly add greater depth, there would still be the contextual concern due to the restriction of using protein interactions only and excluding any interactions or relationships between genes at earlier stages of biosequence synthesis. Still, these issues are as much the foundation for future directions as they are acknowledged concerns. 5.2 Future directions Many of the limitations in fact serve as potential seeds for expanding this study to create an even more comprehensive profile of colorectal adenocarcinomas. As was previously highlighted, applying data on differential expression from patient carcinomas would add a final transcriptional facet, completing an overview of mrna regulation for colon cancer across all parts of the developmental process. In a similar vein, proteomics data from adenomas and carcinomas could also be overlain to create a broader picture 65
77 of gene activation beyond mrna transcription and even better tie in with the protein product framework of the interaction network. Instead of simply adding additional metrics, the network itself could also be extended. Certain genes, such as differentially expressed targets of β-catenin, stood out more so than other nodes and would serve as prime candidates as expansion seeds. By including the non-wnt related neighbors of these seeds and reapplying the evaluated metrics, even more novel and intriguing genes could be identified and further investigated to see what downstream and secondary roles β-catenin plays in colorectal adenocarcinoma development. 5.3 Contributions to the field No matter the limitations and potential directions, this current study still stands as a valid assessment in the role of many Wnt related genes in adenocarcinomas through a combination of multiple biological metrics. In the basest and most concrete terms, multiple genes were implicated during analysis for their markedly altered behavior under the disease conditions, ranging from differences in mrna expression profiles to transcription factor binding to dynamics of protein-protein interactions. Clinically, isolation of these noted genes has potential benefit both diagnostically (e.g possible markers to identify the adenomatous condition like the overexpressed direct target CCND1) as well as prospective treatment sites worth investigation for their direct role in 66
78 colorectal disease, such as promoting increased expression of CDH1 for possible therapeutic purposes. As detailed in the potential future directions, the current network and metrics can easily be viewed as simply an early step in the continued assessment of adenocarcinomous genes. The combination of chromatin occupancy, differential expression and protein interaction provides a design ready-made for elaboration and subsequent analysis of genetic marks in colorectal adenomas and carcinomas. Subsequent metrics can easily be added (e.g. expression profiles of carcinomas) for a more refined analysis or the network can be expanded based on seeding by nodes previously implicated during the current study. In either case, this current network represents a starting point for new research as much as it is a stand-alone project. Beyond identification of potentially interesting adenocarcinomic genes and continued enhancement of the network, this entire process as a whole exists as a robust model for disease analysis with unification from gene activation all the way to final protein product interactions across an entire timeframe of disease development. Although currently specific to the colorectal context, this method of combining multiple results across the entire spectrum of biosequence synthesis has applicability to numerous disease conditions and cellular pathways. The use of metrics beyond the basic standards and removing them from isolation can greatly aid the understanding of disease dynamics and highlight important participants and associations that may 67
79 otherwise be missed using only a single profiling method. Ultimately, this is perhaps the greatest contribution by this study: a widely applicable and comprehensive method of disease assessment and evaluation. Beyond any significant utility resulting from this study s gene identification, its relevance with other disease may be its greatest benefit of all. 68
80 REFERENCE LIST 1. WHO Media Centre: World Health Organization - Cancer Croce CM: Oncogenes and cancer. N Engl J Med 2008, 358(5): O'Connell JB, Maggard MA, Ko CY: Colon cancer survival rates with the new American Joint Committee on Cancer sixth edition staging. J Natl Cancer Inst 2004, 96(19): Shaker A, Rubin DC: Intestinal stem cells and epithelial-mesenchymal interactions in the crypt and stem cell niche. Transl Res 2010, 156(3): Yen TH, Wright NA: The gastrointestinal tract stem cell niche. Stem Cell Rev 2006, 2(3): Meinzer HP, Sandblad B, Baur HJ: Generation-dependent control mechanisms in cell proliferation and differentiation--the power of two. Cell Prolif 1992, 25(2): Tahara E: Molecular biology of gastric cancer. World J Surg 1995, 19(4): ; discussion Half E, Bercovich D, Rozen P: Familial adenomatous polyposis. Orphanet J Rare Dis 2009, 4:22. 69
81 9. Lindor NM: Familial colorectal cancer type X: the other half of hereditary nonpolyposis colon cancer syndrome. Surg Oncol Clin N Am 2009, 18(4): United States Cancer Statistics: Centers for Disease Control and Prevention - Colorectal Cancer Kinzler KW, Vogelstein B: Lessons from hereditary colorectal cancer. Cell 1996, 87(2): Grigoryan T, Wend P, Klaus A, Birchmeier W: Deciphering the function of canonical Wnt signals in development and disease: conditional loss- and gainof-function mutations of beta-catenin in mice. Genes Dev 2008, 22(17): Smith KJ, Johnson KA, Bryan TM, Hill DE, Markowitz S, Willson JK, Paraskeva C, Petersen GM, Hamilton SR, Vogelstein B et al: The APC gene product in normal and tumor cells. Proc Natl Acad Sci U S A 1993, 90(7): Fearon ER, Vogelstein B: A genetic model for colorectal tumorigenesis. Cell 1990, 61(5): Butte A: The use and analysis of microarray data. Nat Rev Drug Discov 2002, 1(12):
82 16. Smyth GK: Linear models and empirical bayes methods for assessing differential expression in microarray experiments. Stat Appl Genet Mol Biol 2004, 3:Article Sebastiani P, Gussoni E, Kohane IS, Ramoni MF: Statistical challenges in functional genomics. Stat Sci 2003, 18(1): Carter SL, Eklund AC, Mecham BH, Kohane IS, Szallasi Z: Redefinition of affymetrix probe sets by sequence overlap with cdna microarray probes reduces cross-platform inconsistencies in cancer-associated gene expression measurements. BMC Bioinformatics 2005, 6: Nimgaonkar A, Sanoudou D, Butte AJ, Haslett JN, Kunkel LM, Beggs AH, Kohane IS: Reproducibility of gene expression across generations of Affymetrix microarrays. BMC Bioinformatics 2003, 4: Mecham BH, Klus GT, Strovel J, Augustus M, Byrne D, Bozso P, Wetmore DZ, Mariani TJ, Kohane IS, Szallasi Z: Sequence-matched probes produce increased cross-platform consistency and more reproducible biological results in microarray-based gene expression measurements. Nucleic Acids Res 2004, 32(9): Severgnini M, Bicciato S, Mangano E, Scarlatti F, Mezzelani A, Mattioli M, Ghidoni R, Peano C, Bonnal R, Viti F et al: Strategies for comparing gene 71
83 expression profiles from different microarray platforms: Application to a casecontrol experiment. Anal Biochem 2006, 353(1): English SB, Butte AJ: Evaluation and integration of 49 genome-wide experiments and the prediction of previously unknown obesity-related genes. Bioinformatics 2007, 23(21): Wolfe CJ, Kohane IS, Butte AJ: Systematic survey reveals general applicability of "guilt-by-association" within gene coexpression networks. BMC Bioinformatics 2005, 6: Irizarry R, Gautier L, Cope L: An r package for analyses of Affymetrix oligonucleotide arrays. In: The Analysis of Gene Expression Data: Methods and Software. Edited by Parmigiani G, Garrett E, Irizarry R, Zeger S. New York, NY: Springer; Cahan P, Rovegno F, Mooney D, Newman JC, St Laurent G, McCaffrey TA: Metaanalysis of microarray results: challenges, opportunities, and recommendations for standardization. Gene 2007, 401(1-2): Farnham PJ: Insights from genomic profiling of transcription factors. Nat Rev Genet 2009, 10(9): Komashko VM, Acevedo LG, Squazzo SL, Iyengar SS, Rabinovich A, O'Geen H, Green R, Farnham PJ: Using ChIP-chip technology to reveal common principles 72
84 of transcriptional repression in normal and cancer cells. Genome Res 2008, 18(4): Impey S, McCorkle SR, Cha-Molstad H, Dwyer JM, Yochum GS, Boss JM, McWeeney S, Dunn JJ, Mandel G, Goodman RH: Defining the CREB regulon: a genome-wide analysis of transcription factor regulatory regions. Cell 2004, 119(7): Butte AJ, Kohane IS: Creation and implications of a phenome-genome network. Nat Biotechnol 2006, 24(1): Makino T, Gojobori T: Evolution of protein-protein interaction network. Genome Dyn 2007, 3: Friedman N: Inferring cellular networks using probabilistic graphical models. Science 2004, 303(5659): Wu Z, Zhao X, Chen L: Identifying responsive functional modules from proteinprotein interaction network. Mol Cells 2009, 27(3): Aggarwal A, Guo DL, Hoshida Y, Yuen ST, Chu KM, So S, Boussioutas A, Chen X, Bowtell D, Aburatani H et al: Topological and functional discovery in a gene coexpression meta-network of gastric cancer. Cancer Res 2006, 66(1): Liu M, Liberzon A, Kong SW, Lai WR, Park PJ, Kohane IS, Kasif S: Network-based analysis of affected biological processes in type 2 diabetes models. PLoS Genet 2007, 3(6):
85 35. Xu JZ, Li YJ: Discovering disease-genes by topological features in human protein-protein interaction network. Bioinformatics 2006, 22(22): Camargo A, Azuaje F: Linking gene expression and functional network data in human heart failure. PLoS ONE 2007, 2(12):e Sekine S, Shibata T, Sakamoto M, Hirohashi S: Target disruption of the mutant beta-catenin gene in colon cancer cell line HCT116: preservation of its malignant phenotype. Oncogene 2002, 21(38): van de Wetering M, Sancho E, Verweij C, de Lau W, Oving I, Hurlstone A, van der Horn K, Batlle E, Coudreuse D, Haramis AP et al: The beta-catenin/tcf-4 complex imposes a crypt progenitor phenotype on colorectal cancer cells. Cell 2002, 111(2): Affymetrix: Affymetrix Microarray Suite User Guide, version 4 edn. Santa Clara, CA: Affymetrix; Gentleman RC, Carey VJ, Bates DM, Bolstad B, Dettling M, Dudoit S, Ellis B, Gautier L, Ge Y, Gentry J et al: Bioconductor: open software development for computational biology and bioinformatics. Genome Biol 2004, 5(10):R R DCT R: A language and enviroment for statistical computing
86 42. Bolstad BM, Irizarry RA, Astrand M, Speed TP: A comparison of normalization methods for high density oligonucleotide array data based on variance and bias. Bioinformatics 2003, 19(2): Li C, Wong WH: Model-based analysis of oligonucleotide arrays: expression index computation and outlier detection. Proc Natl Acad Sci U S A 2001, 98(1): Irizarry RA, Bolstad BM, Collin F, Cope LM, Hobbs B, Speed TP: Summaries of Affymetrix GeneChip probe level data. Nucleic Acids Res 2003, 31(4):e Smyth GK: Limma: linear models for microarray data. In: Bioinformatics and Computational Biology Solutions using R and Bioconductor. Edited by Gentleman R, Carey V, Dudoit S, Irizarry R. New York, NY: Springer; 2005: Farcomeni A: A review of modern multiple hypothesis testing, with particular attention to the false discovery proportion. Stat Methods Med Res 2008, 17(4): Yochum GS, McWeeney S, Rajaraman V, Cleland R, Peters S, Goodman RH: Serial analysis of chromatin occupancy identifies beta-catenin target genes in colorectal carcinoma cells. Proc Natl Acad Sci U S A 2007, 104(9): Cerami EG, Bader GD, Gross BE, Sander C: cpath: open source software for collecting, storing, and querying biological pathways. BMC Bioinformatics 2006, 7:
87 49. Shannon P, Markiel A, Ozier O, Baliga NS, Wang JT, Ramage D, Amin N, Schwikowski B, Ideker T: Cytoscape: a software environment for integrated models of biomolecular interaction networks. Genome Res 2003, 13(11): Jahns-Streubel G, Reuter C, Auf der Landwehr U, Unterhalt M, Schleyer E, Wormann B, Buchner T, Hiddemann W: Activity of thymidine kinase and of polymerase alpha as well as activity and gene expression of deoxycytidine deaminase in leukemic blasts are correlated with clinical response in the setting of granulocyte-macrophage colony-stimulating factor-based priming before and during TAD-9 induction therapy in acute myeloid leukemia. Blood 1997, 90(5): Shimoyama Y, Hirohashi S, Hirano S, Noguchi M, Shimosato Y, Takeichi M, Abe O: Cadherin cell-adhesion molecules in human epithelial tissues and carcinomas. Cancer Res 1989, 49(8): Sabates-Bellver J, Van der Flier LG, de Palo M, Cattaneo E, Maake C, Rehrauer H, Laczko E, Kurowski MA, Bujnicki JM, Menigatti M et al: Transcriptome profile of human colorectal adenomas. Mol Cancer Res 2007, 5(12): Abe S, Usami S, Nakamura Y: Mutations in the gene encoding KIAA1199 protein, an inner-ear protein expressed in Deiters' cells and the fibrocytes, as the cause of nonsyndromic hearing loss. J Hum Genet 2003, 48(11):
88 54. Kuniba H, Yoshiura K, Kondoh T, Ohashi H, Kurosawa K, Tonoki H, Nagai T, Okamoto N, Kato M, Fukushima Y et al: Molecular karyotyping in 17 patients and mutation screening in 41 patients with Kabuki syndrome. J Hum Genet 2009, 54(5): Leiter AB, Toder A, Wolfe HJ, Taylor IL, Cooperman S, Mandel G, Goodman RH: Peptide YY. Structure of the precursor and expression in exocrine pancreas. J Biol Chem 1987, 262(27): Batterham RL, Cowley MA, Small CJ, Herzog H, Cohen MA, Dakin CL, Wren AM, Brynes AE, Low MJ, Ghatei MA et al: Gut hormone PYY(3-36) physiologically inhibits food intake. Nature 2002, 418(6898): Fu M, Wang C, Li Z, Sakamaki T, Pestell RG: Minireview: Cyclin D1: normal and abnormal functions. Endocrinology 2004, 145(12): Etienne-Manneville S, Hall A: Cdc42 regulates GSK-3beta and adenomatous polyposis coli to control cell polarity. Nature 2003, 421(6924): McCright B, Rivers AM, Audlin S, Virshup DM: The B56 family of protein phosphatase 2A (PP2A) regulatory subunits encodes differentiation-induced phosphoproteins that target PP2A to both nucleus and cytoplasm. J Biol Chem 1996, 271(36): Liu W, Dong X, Mai M, Seelan RS, Taniguchi K, Krishnadath KK, Halling KC, Cunningham JM, Boardman LA, Qian C et al: Mutations in AXIN2 cause 77
89 colorectal cancer with defective mismatch repair by activating betacatenin/tcf signalling. Nat Genet 2000, 26(2): Cenciarelli C, Chiaur DS, Guardavaccaro D, Parks W, Vidal M, Pagano M: Identification of a family of human F-box proteins. Curr Biol 1999, 9(20): Winston JT, Strack P, Beer-Romero P, Chu CY, Elledge SJ, Harper JW: The SCFbeta-TRCP-ubiquitin ligase complex associates specifically with phosphorylated destruction motifs in IkappaBalpha and beta-catenin and stimulates IkappaBalpha ubiquitination in vitro. Genes Dev 1999, 13(3): Liu C, Li Y, Semenov M, Han C, Baeg GH, Tan Y, Zhang Z, Lin X, He X: Control of beta-catenin phosphorylation/degradation by a dual-kinase mechanism. Cell 2002, 108(6): Mallo GV, Rechreche H, Frigerio JM, Rocha D, Zweibaum A, Lacasa M, Jordan BR, Dusetti NJ, Dagorn JC, Iovanna JL: Molecular cloning, sequencing and expression of the mrna encoding human Cdx1 and Cdx2 homeobox. Down-regulation of Cdx1 and Cdx2 mrna expression during colorectal carcinogenesis. Int J Cancer 1997, 74(1): Tetsuka T, Uranishi H, Imai H, Ono T, Sonta S, Takahashi N, Asamitsu K, Okamoto T: Inhibition of nuclear factor-kappab-mediated transcription by association 78
90 with the amino-terminal enhancer of split, a Groucho-related protein lacking WD40 repeats. J Biol Chem 2000, 275(6): Bylund M, Andersson E, Novitch BG, Muhr J: Vertebrate neurogenesis is counteracted by Sox1-3 activity. Nat Neurosci 2003, 6(11): Netzer C, Rieger L, Brero A, Zhang CD, Hinzke M, Kohlhase J, Bohlander SK: SALL1, the gene mutated in Townes-Brocks syndrome, encodes a transcriptional repressor which interacts with TRF1/PIN2 and localizes to pericentromeric heterochromatin. Hum Mol Genet 2001, 10(26): Feng Y, Lee N, Fearon ER: TIP49 regulates beta-catenin-mediated neoplastic transformation and T-cell factor target gene induction via effects on chromatin remodeling. Cancer Res 2003, 63(24): Wu Y, Dowbenko D, Spencer S, Laura R, Lee J, Gu Q, Lasky LA: Interaction of the tumor suppressor PTEN/MMAC with a PDZ domain of MAGI3, a novel membrane-associated guanylate kinase. J Biol Chem 2000, 275(28): Azim AC, Knoll JH, Marfatia SM, Peel DJ, Bryant PJ, Chishti AH: DLG1: chromosome location of the closest human homologue of the Drosophila discs large tumor suppressor gene. Genomics 1995, 30(3):
91 71. Oda T, Kanai Y, Oyama T, Yoshiura K, Shimoyama Y, Birchmeier W, Sugimura T, Hirohashi S: E-cadherin gene mutations in human gastric carcinoma cell lines. Proc Natl Acad Sci U S A 1994, 91(5): Gong TW, Besirli CG, Lomax MI: MACF1 gene structure: a hybrid of plectin and dystrophin. Mamm Genome 2001, 12(11): Yamamoto H, Ihara M, Matsuura Y, Kikuchi A: Sumoylation is involved in betacatenin-dependent activation of Tcf-4. EMBO J 2003, 22(9): Ren M, Drivas G, D'Eustachio P, Rush MG: Ran/TC4: a small nuclear GTP-binding protein that regulates DNA synthesis. J Cell Biol 1993, 120(2): Kirikoshi H, Koike J, Sagara N, Saitoh T, Tokuhara M, Tanaka K, Sekihara H, Hirai M, Katoh M: Molecular cloning and genomic structure of human frizzled-3 at chromosome 8p21. Biochem Biophys Res Commun 2000, 271(1): Liu Y, Dehni G, Purcell KJ, Sokolow J, Carcangiu ML, Artavanis-Tsakonas S, Stifani S: Epithelial expression and chromosomal location of human TLE genes: implications for notch signaling and neoplasia. Genomics 1996, 31(1): Fedi P, Bafico A, Nieto Soria A, Burgess WH, Miki T, Bottaro DP, Kraus MH, Aaronson SA: Isolation and biochemical characterization of the human Dkk-1 homologue, a novel inhibitor of mammalian Wnt signaling. J Biol Chem 1999, 274(27):
92 78. Levanon D, Goldstein RE, Bernstein Y, Tang H, Goldenberg D, Stifani S, Paroush Z, Groner Y: Transcriptional repression by AML1 and LEF-1 is mediated by the TLE/Groucho corepressors. Proc Natl Acad Sci U S A 1998, 95(20): Pizzuti A, Amati F, Calabrese G, Mari A, Colosimo A, Silani V, Giardino L, Ratti A, Penso D, Calza L et al: cdna characterization and chromosomal mapping of two human homologues of the Drosophila dishevelled polarity gene. Hum Mol Genet 1996, 5(7): Beildeck ME, Islam M, Shah S, Welsh J, Byers SW: Control of TCF-4 expression by VDR and vitamin D in the mouse mammary gland and colorectal cancer cell lines. PLoS One 2009, 4(11):e Saitoh T, Mine T, Katoh M: Molecular cloning and expression of proto-oncogene FRAT1 in human cancer. Int J Oncol 2002, 20(4): Reynaud C, Fabre S, Jalinot P: The PDZ protein TIP-1 interacts with the Rho effector rhotekin and is involved in Rho signaling to the serum response element. J Biol Chem 2000, 275(43): De Valck D, Jin DY, Heyninck K, Van de Craen M, Contreras R, Fiers W, Jeang KT, Beyaert R: The zinc finger protein A20 interacts with a novel anti-apoptotic protein which is cleaved by specific caspases. Oncogene 1999, 18(29):
93 84. Allen E, Ding J, Wang W, Pramanik S, Chou J, Yau V, Yang Y: Gigaxonin-controlled degradation of MAP1B light chain is critical to neuronal survival. Nature 2005, 438(7065): Tombes RM, Krystal GW: Identification of novel human tumor cell-specific CaMK-II variants. Biochim Biophys Acta 1997, 1355(3): Mok SC, Chan WY, Wong KK, Cheung KK, Lau CC, Ng SW, Baldini A, Colitti CV, Rock CO, Berkowitz RS: DOC-2, a candidate tumor suppressor gene in human epithelial ovarian cancer. Oncogene 1998, 16(18):
94 Table 1 Studies used for mrna expression analysis - citations, sample counts and descriptions Patient tissue adenomas and normal mucosa Galamb O et al. Dis Markers (1): GEO: GSE4183 PMID: adenoma patients and 8 non-matched controls A gene expression profile of various colonic diseases including adenomas, carcinomas and irritable bowel syndrome Sabates-Bellver J et al. Mol Cancer Res. Dec (12): GEO: GSE8671 PMID: adenoma samples with 32 same-patient matched controls A wide ranging study examining changes in mrna expression in adenomatous tissue accompanying carcinoma development Galamb O et al. Cancer Epidemiol Biomarkers Prev. Oct (10): GEO: GSE10714 PMID: adenoma patient samples and 3 non-matched controls Companion study following up their paper in Disease Markers attempting to use mrna profiling for diagnostics Hong Y et al. Clin Cancer Res. Feb (4): GEO: GSE4107 PMID: non-matched patient controls Systematic search for novel genetic causes in colon cancer aside beyond FAP and heriditary non-polyposis origins Cell lines HCT116 Goetz S et al. June (12): GEO: GSE8690 PMID: replicate Transcriptome profile of six different human cell lines Wagner KW et al. Nat Med. Sep (9): GEO: GSE8332 PMID: replicates Effect of the Apo2L/TRAIL ligand in stimulating cell death in multiple lines Ruike Y et al. J Hum Genet (6): GEO: GSE10021 PMID: replicate mrna and mirna profiling of various cell lines Connolly K et al. Cancer Chemother Pharmacol. July (2): GEO: GSE11618 PMID: replicates Assessment of X-linked inhibition of apoptosis in cancerous cell lines Dornan D. Gentech Oncology Diagnostics. Submitted Mar GEO: GSE replicates Independent submission to GEO database Cell lines LS174T GlaxoSmithKline caarray submission caarray ID: woost replicates Affymetrix HGU-133 Plus 2.0 array submission to the caarray compendium 83
95 Table 2 Significance counts of probes from mrna analysis by linear model comparison BH sig (FDR<0.05) BH Sig & FC Δ0.5 Upregulated (FC > 1.5) Downregulated (FC < -1.5) Normal Mucosa vs Adenomatous Tissue Normal Mucosa vs Derived Cell Line Adenomatous Tissue vs Derived Cell Line
96 Table 3 concordant genes in the N-A and N-C comparisons by direction of differential expression Total number of concordantly expressed genes Significant differential expression in cell lines over adenomas No significant difference in mrna expression between patient adenomas and cell lines Significant differential expression in adenomas over cell lines N-A & N-C concordant Downregulated probes N-A & N-C concordant Upregulated probes Although columns are divided by the direction of the A-C comparisons, all probes showed significant concordant differential expression in the N-A and N-C portions of the linear model. 85
97 Table 4.a top five N-A and N-C concordantly upregulated genes grouped by A-C comparison TOP FIVE UPREGULATED PROBES Top sorted probes with largest diff expr in patient adenomas Top sorted probes with largest diff expr in cancerous cell lines Probes with largest differences between cell lines and patient tissue Fold change in cancerous cell lines significantly greater (N- A < N-C) PSAT1 ( ) PHLDA1 (+6.779/+5.678) CDH3 ( ) GDF15 ( ) SLC7A5 ( ) PSAT1 ( ) PHLDA1 ( / ) SLC7A5 ( ) AP1S3 ( ) MSX1 ( ) SFRS6 ( ) DHRS2 ( ) GAL ( ) AREG ( ) HS6ST2 ( ) No significant difference in expression between patient tissue and cell lines (N-A == N-C) Fold change in patient adenomas significantly greater (N-A > N-C) hcg_ ( ) KLK10 ( ) LST+3TM12 ( ) MSX2 ( ) WDR72 ( ) TCN1 ( ) KIAA1199 ( ) FOXQ1 ( ) FAM148A ( ) SERPINB5 ( ) hcg_ ( ) KLK10 ( ) WDR72 ( ) LST+3TM12 ( ) CEP55 ( ) KIAA1199 ( ) SERPINB5 ( ) IFGBP2 ( ) PPM1H ( ) FOXQ1 ( ) Non-significant A-C FC range: SULT1C2 ( ) to HAS3 ( ) TCN1 ( ) FOXQ1 ( ) FAM148A ( ) AXIN2 ( ) IL8 ( ) Each row contains a unique set of concordantly upregulated genes grouped according to their A-C comparison. The first column corresponds to the top genes when sorted on fold changes of expression in the N-A comparison while the second column is a sort of the same set but for the top genes in the N-C comparison. The final column is a sort showing the greatest changes in differential expression between the two disease conditions based on the A-C comparison. Probes that are bolded were found in both the top five N-A and N-C sorts for that A-C group. 86
98 Table 4.b top five N-A and N-C concordantly downregulated genes grouped by A-C comparison TOP FIVE UPREGULATED PROBES Top sorted probes with largest diff expr in patient adenomas Top sorted probes with largest diff expr in cancerous cell lines Probes with largest differences between cell lines and patient tissue Fold change in cancerous cell lines significantly greater (N- A < N-C) AQP8 ( ) CA1 ( ) MS4A12 ( ) CLDN8 ( ) CLCA4 ( ) SLC26A3 ( ) IGJ ( ) CEACAM7 ( ) IGL2 ( ) FABP1 ( ) IGJ ( ) IGL2 ( ) Cl5orf48 ( ) FABP1 ( ) KRT20 ( ) No significant difference in expression between patient tissue and cell lines (N-A == N-C) GCG ( ) PYY ( ) ABCG2 ( ) GUCA2B ( ) CDKN2B ( ) GCG ( ) PYY ( ) GUCA2B ( ) ABCG2 ( ) SST ( ) Non-significant A-C FC range: GCG ( ) to TMEM200A ( ) Fold change in patient adenomas significantly greater (N-A > N-C) CPNE8 ( ) MAMDC2 (-5.709) TBC1D9 ( ) RUNDC3B ( ) CNNM2 ( ) MAMDC2 ( ) TBC1D9 ( ) CPNE8 ( ) CNNM2 ( ) CDA ( ) CPNE8 ( ) RUNDC3B ( ) LIFR ( ) TBC1D9 ( ) KIAA1211 ( ) Format is the same as in table 4.a 87
99 Table 5.a Direct targets of β-catenin also showing concordant upregulation Entrez ID Affymetrix ID Hugo Symbol N-A FC N-C FC A-C FC Total tags for all clusters _at ABCC _s_at ACSL _at ANXA _a_at AP1S _s_at APEX _at ARNTL _a_at ASCC _s_at ATP11A _at AXIN _s_at B3GNTL _s_at BCAN _at BUB _s_at C11orf _at C15orf _at C19orf _at CAD _at CAMTA _at CCND _at CD3EAP _at CDH _at CDK _s_at CHCHD _s_at CHTF _at CLDN _at CMTM _at CPSF _at CTHRC _s_at CXXC _at DDX _at DHX _s_at EIF5A _at EXOSC _at FABP _s_at FAIM _at FAM54A
100 Table 5.a continued Entrez ID Affymetrix ID Hugo Symbol N-A FC N-C FC A-C FC Total tags for all clusters _s_at FANCA _s_at FEN _at FHIT _at FIGNL _at FLJ _s_at GPR172A _at GRB _at GRHL _s_at GTF2IRD _s_at HMGA _s_at HOMER _at IFI _at IL27RA _at ILF _s_at IMPDH _at IPO _at IRAK _s_at ITGB1BP _at KDELR _s_at KIAA _x_at KIAA _x_at KIF _s_at LAGE _s_at LMNB _at LRP _s_at LYRM _at Magmas _at MCFD _at ME _s_at METTL _s_at MRPL _at MSI _s_at MSLN _s_at MTA _at MTHFD _at MTHFD1L
101 Table 5.a continued Entrez ID Affymetrix ID Hugo Symbol N-A FC N-C FC A-C FC Total tags for all clusters _at NANP _s_at NEBL _s_at NME _at NPM _s_at NUFIP _at ODF _s_at OSBPL _s_at OTUB _s_at PAICS _at PCID _s_at PGM _at PHGDH _at PIGL _s_at PLEKHB _at PLK _at PLSCR _s_at PPAT _at PPIH _at PPL _s_at PPP1R13L _s_at RRM _s_at SHB _s_at SPATS _at TBC1D _s_at TBCD _at TEAD _at TFDP _at TMEM161A _s_at TMEM _at TNFRSF10A _at TOP1MT _at TRAP _at TRIM _at TRIP _at TRIP _at TSEN _s_at TTL
102 Table 5.a continued Entrez ID Affymetrix ID Hugo Symbol N-A FC N-C FC A-C FC Total tags for all clusters _s_at UBE2H _s_at UGT1A _at UHRF _at WDR _at WDR51A _at ZNF _at ZNF
103 Table 5.b Direct targets of β-catenin also showing concordant downregulation Entrez ID Affymetrix ID Hugo Symbol N-A FC N-C FC A-C FC Total tags for all clusters _s_at AAK _at ABCA _at ADCY _at AFF _at ARRB _at ASB _at C10orf _s_at C1orf _at C _at CAB _at CAMK2D _at CAPN _at CAPN _s_at CD _at CDA _at CFDP _s_at CHGA _at CLIC _s_at CLMN _at CLU _at CMBL _at CNNM _at COBL _at DENND2A _s_at DMD _s_at DST _at EFNA _at EPAS _s_at FAM107B _s_at FBLN _at FBXO _s_at FYN _at GLTP
104 Table 5.b continued Entrez ID Affymetrix ID Hugo Symbol N-A FC N-C FC A-C FC Total tags for all clusters _s_at IL _at IL1R _at IL6R _s_at ITM2C _at JAZF _s_at KCNMA _at KIAA _s_at KLF _at LIPC _at LIPH _at LPP _at MALL _at MAMDC _at MAN1C _at METTL7B _s_at MGC _at MOGAT _at MSRB _s_at MYL _at NCAM _at NCOA _s_at NDRG _at NEDD4L _at NFASC _at NHEJ _s_at NLRC _at OLFML _s_at PACSIN _at PADI _at PAQR _at PKIB _s_at PLP _at PPARD _at PRKG _at PRSS _at PTTG1IP _s_at PYY
105 Table 5.b continued Entrez ID Affymetrix ID Hugo Symbol N-A FC N-C FC A-C FC Total tags for all clusters _at RARRES _at RASSF _at RASSF _at RBMS _at RCSD _s_at RXRA _s_at SECTM _at SH3RF _at SLC22A18AS _at SLC22A _at SLC2A _at SLC37A _at SLC6A _at SLC9A _at SLC9A _at SMPD _at SRGAP _at ST6GAL _at SULF _at SYNPO _s_at TIMP _at TMCC _at TNS _s_at TSC22D _at TSHZ _at UNC5B _s_at VILL _s_at VIPR
106 Table 6 metrics of the initial protein interaction network Number of connected components 11 Number of individual protein product nodes 168 Total number of edges in the network 554 Number of node pairs with multiple edges 120 Isolated nodes with no edges 11 Average number of neighbors per node Network density Network centralization Network hubs (5-13 neighbor nodes) 36 Superhubs (14 or more neighbor nodes) 5 Number of nodes that are direct targets of β-catenin Number of nodes with HGU133 Plus 2.0 array mrna spots
107 Table 7 genes with mrna overexpression found in adenomas and cell lines 7.a: upregulated in both adenomas and cell lines Joint A/C gene nodes N-A FC N-C FC β-catenin tags PPI neighbor count Co-expression disruptions CCND X CDC CDC25C FZD RAN RUVBL Wnt target 7.b upregulated in patient adenomas only N-A only β-catenin PPI neighbor Co-expression Wnt N-A FC N-C FC gene nodes tags count disruptions target AXIN X FHL SOX c: upregulated in cancerous cell lines only N-C only β-catenin PPI neighbor Co-expression Wnt N-A FC N-C FC gene nodes tags count disruptions target BRD BTRC X DKK X DVL DVL FBXW PIAS PPP2R5D RANBP TBP WNT
108 Table 8 genes with mrna underexpression found in adenomas and cell lines 8.a: downregulated in both adenomas and cell lines Joint A/C gene nodes N-A FC N-C FC β-catenin tags PPI neighbor count Co-expression disruptions FZD JUP MAGI MAP1B SALL Wnt target 8.b: downregulated in cancerous cell lines only N-C only β-catenin PPI neighbor Co-expression Wnt N-A FC N-C FC gene nodes tags count disruptions target AES CDC CDH X CDX X CTNNB DAB DLG DLG FRAT LRP TAX1BP TCF X 97
109 Table 9 information on network nodes with altered co-expression under adenomatous conditions Disrupted gene nodes N-A FC N-C FC β-catenin tags PPI neighbor count Co-expression disruptions Wnt target BTRC X CAMK2A CDH X CSNK1D DAAM DAB FZD GSK3B GSK3B MAGI PIAS SENP TAX1BP WNT AES AXIN AXIN X CAMK2D HDAC PRKCB PRKCG SFRP X SUMO MAP1B MAP3K ARRB CCND X SKP PIN GNG
110 Table 10.a metrics tables for direct targets of β-catenin β-catenin gene nodes N-A FC N-C FC β-catenin tags PPI neighbor count Co-expression disruptions Wnt target TAX1BP CCND X CSNK1A AXIN X FBXW FHL TLE CTBP MARK NFATC CAMK2D MACF LRP SMAD PRKCA TCF7L
111 Table 10.b informative listings for first-order protein interaction neighbors of β-catenin targets β-cat neighb β-catenin PPI neighbor Co-expression Wnt N-A FC N-C FC gene nodes tags count disruptions target AES APC AXIN CAMK2A CAMK2B CAMK2G CDC CREBBP CSNK2A CTNNB DVL DVL EP FZD GSK3B HDAC MYC X NLK PIAS SENP SMAD SUMO TCF X β-catenin targets as target neighbors AXIN X CCND X CSNK1A CTBP NFATC TCF7L TLE
112 Table 11.a metrics for heavily connected protein interaction hubs (5-13 neighbor nodes) Hub gene nodes N-A FC N-C FC β-catenin tags PPI neighbor count Co-expression disruptions Wnt target AXIN X CAMK2B CAMK2D CAMK2G CCND X CDC CUL GNAS KREMEN MYC X NLK PPP2R5D SKP BTRC X CAMK2A CSNK2A DVL MACF MAP3K NLK PPP2CA HDAC DVL DVL CSNK2A GSK3B SMAD TCF7L WNT FZD AES CREBBP GSK3B LRP TCF X TLE
113 Table 11.b metrics for the most connected network super- hubs (14 or more neighbor nodes) Super-hub β-catenin PPI neighbor Co-expression N-A FC N-C FC gene nodes tags count disruptions CTBP CSNK1A APC AXIN CTNNB Wnt target 102
114 Table 11.c gene listings for the first-order neighbors of the protein interaction network super-hubs S.H. neighb β-catenin PPI neighbor Co-expression Wnt N-A FC N-C FC gene nodes tags count disruptions target AES APC AXIN BCL BTRC X CDC CDH X CREBBP CSNK1A CSNK1D CSNK2A CTBP CTNNB DVL DVL EP FBXW FHL FRAT FZD GSK3B GSK3B HDAC LEF X LRP MACF MAP3K NFATC NLK NR5A
115 Table 11.c continued S.H. neighb β-catenin PPI neighbor Co-expression Wnt N-A FC N-C FC gene nodes tags count disruptions target PIN PPP2CA PPP2R5B PPP2R5D RANBP RUNX X RUVBL SALL SMAD SOX TCF X TCF7L TFAP2A TLE WNT
116 Table 12.a network metrics for genes previously identified direct targets of the Wnt pathway Wnt target gene nodes N-A FC N-C FC β-catenin tags PPI neighbor count Co-expression disruptions Wnt target AXIN X BTRC X CCND X CDH X CDX X DKK X FZD X LEF X MYC X RUNX X SFRP X TCF X WNT3A X 105
117 Table 12.b gene listings for the first-order neighbors of validated Wnt targets Wnt neighb β-catenin PPI neighbor Co-expression Wnt N-A FC N-C FC gene nodes tags count disruptions target AES AXIN AXIN X CCND X CDX X CREBBP CTBP CTNNB CUL DVL FZD HDAC KREMEN LEF X LRP LRP MAGI MAP3K MYC X NLK SKP SMAD TLE
118 Table 13 full metrics listing for the final set of 65 network nodes Gene of interest N-A upreg N-C upreg N-A downreg N-C downreg β-catenin binding β-catenin neighbor Wnt target Wnt target neighbor PPI Superhub Superhub neighbor Disrupted coexpression AES X X 2 APC X 19 ARRB2 4 AXIN1 X X 25 2 AXIN X X X 2 X BTRC X 1 CAMK2D 30 2 CCND X X 4 X CDC X CDH X X 1 CDX X X CREBBP X X CSNK1A X CSNK1D X 1 CTBP1 10 X 14 X CTNNB X 59 X CUL1 DAB X DKK X DLG DVL X DVL X X X X Disruption neighbor
119 Table 13 continued Gene of interest N-A upreg N-C upreg N-A downreg N-C downreg β-catenin binding β-catenin neighbor Wnt target Wnt target neighbor PPI Superhub Superhub neighbor Disrupted coexpression Disruption neighbor FBXW FHL FRAT X FZD1 X X FZD X FZD FZD7 X GNG2 8 GSK3B X 1 HDAC1 X X 2 KREMEN2 X LRP LRP5 X LRP6 X MACF1 52 X MAGI X 1 MAP1B MAP3K4 X X MAP3K7 3 MARK2 10 MYC X X
120 Table 13 continued Gene of interest N-A upreg N-C upreg N-A downreg N-C downreg β-catenin binding β-catenin neighbor Wnt target Wnt target neighbor PPI Superhub Superhub neighbor Disrupted coexpression Disruption neighbor NFATC2 13 X NLK X X NR5A1 X PIAS X 1 PIN1 6 PP2R5D X PRKCA 78 RAN RANBP X RUNX2 X RUVBL SALL SFRP2 X 2 SKP1 X 4 SMAD3 63 SMAD4 X X SOX X TAX1BP TCF X X X TCF7L2 238 X X TLE1 9 X X X WNT3A X
121 Table 14 statistical assessment of network uniqueness using a null model 110 Type of comparison based on combined metrics of interest Obs prop Mean exp prop StErr exp prop Exp 95 CI L Exp 95 CI U Odds ratio Differential expression (DE) E Targeting by β-catenin (β-cat) E Network hub or super-hub (Hub) E Disrupted coexpression (Coex) DE + β-cat E DE + Hub E DE + Coex E β-cat + Hub E β-cat + Coex E Hub + Coex E DE + β-cat + Hub E DE + β-cat + Coex E DE + Hub + Coex E β-cat + Hub + Coex E DE + β-cat + Hub + Coex E
122 Figure 1 111
123 Figure 1 The colonic crypt and adenocarcinoma development. As shown, motility along the intestinal villi mirrors the development of lining cells from undifferentiated stem cells to fully functional epithelial sheets. Proper functioning is reliant on asymmetrical division of the stem cells otherwise a plethora of stem cells can lead to the formation of an early adenoma. Without suitable regulation in place, the crypt is quickly overwhelmed by the aberrant growth leading to the beginnings of an adenocarcinoma. Colorectal cancer in particular is defined by its early loss of function in the Wnt pathway as the adenoma is first forming making it an obvious point of interest for study. Adapted from: Humpries et. al. Nat Reviews Cancer. 2008; 8, and Jones S et. al. Proc Nat Acad Sci. 2008; 105(11):


124 Figure 2 Absence of Wnt: Presence of Wnt: 113
125 Figure 2 Wnt activation of β-catenin dependent transcription. In the absence of Wnt, cellular levels of β-catenin are limited by the destruction complex which degrades the compound while still in the cytoplasm. Conversely, Wnt signalling prevents the formation of the destruction complex through cell surface receptor binding to Axin. As β-catenin accumulates in the cytoplasm it begins to translocate into the nucleus, consequently activating numerous genes associated with biological functions such as embryogenesis and epithelial cell replenishment as well as cancer development. Adapted from: Eisenmann. WormBook

126 Figure 3 115
127 Figure 3 Serial analysis of chromatin occupancy combines chromatin-immunoprecipitation with SAGE based sequencing techniques to create a library of transcription factor binding sites and sequences alongside tag counts for the chromatin-bound protein under investigation. Detailed above are the enrichment and purification techniques used on the collected protein-associated genomic DNA to prepare the binding sites for vector cloning, amplification and sequencing. Adapted from: Impey S et. al. Cell 2004, 119(7):
128 Figure 4 117
129 Figure 4 Density graph of spot intensities from the mrna aggregation analysis. Taken from the exploratory data analysis, multiple density curves are overlain. Each of the four modules densities are shown individually in addition to the density curve for the normalization for the full set of utilized arrays. Partial combinations such as OneCellGroup (the pairing of the HCT116 and LS174T profiles) and AllAdenomatous (both cell lines combined with the patient adenoma data) are also included for comparison purposes. 118

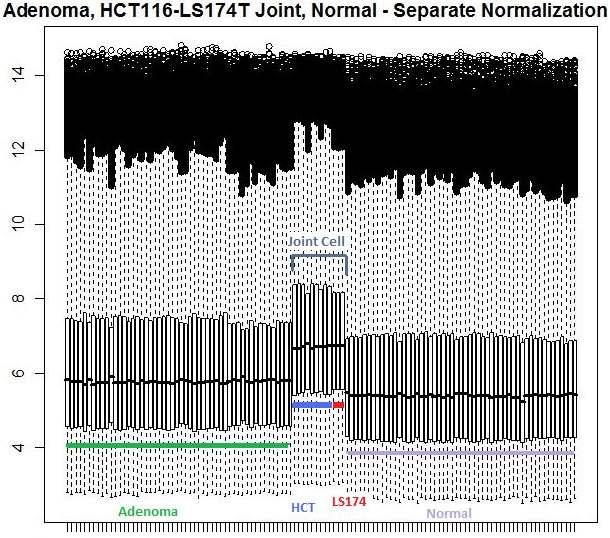
130 Figure 5a 119
131 Figure 5a Box graphs for the exploratory data analysis of the mrna pooled study. Shown are the separate module normalizations with the expection of the lower image displaying the effects of normalization when both cell lines are grouped together. This is not a standard method of normalization and was used predominately for illustration purposes. 120

132 Figure 5b 121
133 Figure 5b The box graphs for the intensities of each array after RMA normalization combining all four functional modules. As is traditional for mrna expression studies, this was the normalization used for the aggregate analysis. 122
134 Figure 6 123
135 Figure 6 Venn diagram listing the number of probes identified by the linear model during the mrna analysis as having significant differential expression (FDR 5%) meeting the 1.5x fold-change threshold. 124
136 Figure 7 125
137 Figure 7 Overview of the base protein product interaction network. Indicated are the 39 genes showing significant mrna expression changes in patient adenomas or cell lines, the 16 targets of β-catenin and the 5 super-hubs. 126
138 Figure 8 - Upregulated transcription in disease conditions - Downregulated transcription in disease conditions - Chromatin binding of β-catenin by SACO tags - Three or more co-expression disruptions in disease conditions - Previously validated Wnt pathway target from the Wnt homepage 127
139 Figure 8 Legend of the color-coding of the five metrics found in tables Highlighting was done to assist in tracking various nodes through the multiple metrics combinations that were evaluated. 128

140 Figure 9 129
Abstract. Optimization strategy of Copy Number Variant calling using Multiplicom solutions APPLICATION NOTE. Introduction
 Optimization strategy of Copy Number Variant calling using Multiplicom solutions Michael Vyverman, PhD; Laura Standaert, PhD and Wouter Bossuyt, PhD Abstract Copy number variations (CNVs) represent a significant
Development of Carcinoma Pathways
 The Construction of Genetic Pathway to Colorectal Cancer Moriah Wright, MD Clinical Fellow in Colorectal Surgery Creighton University School of Medicine Management of Colon and Diseases February 23, 2019
Neoplasia 18 lecture 6. Dr Heyam Awad MD, FRCPath
 Neoplasia 18 lecture 6 Dr Heyam Awad MD, FRCPath ILOS 1. understand the role of TGF beta, contact inhibition and APC in tumorigenesis. 2. implement the above knowledge in understanding histopathology reports.
Regulation of Gene Expression in Eukaryotes
 Ch. 19 Regulation of Gene Expression in Eukaryotes BIOL 222 Differential Gene Expression in Eukaryotes Signal Cells in a multicellular eukaryotic organism genetically identical differential gene expression
Statistical Assessment of the Global Regulatory Role of Histone. Acetylation in Saccharomyces cerevisiae. (Support Information)
") Statistical Assessment of the Global Regulatory Role of Histone Acetylation in Saccharomyces cerevisiae (Support Information) Authors: Guo-Cheng Yuan, Ping Ma, Wenxuan Zhong and Jun S. Liu Linear Relationship
Statistical Assessment of the Global Regulatory Role of Histone Acetylation in Saccharomyces cerevisiae (Support Information) Authors: Guo-Cheng Yuan, Ping Ma, Wenxuan Zhong and Jun S. Liu Linear Relationship
OncoPPi Portal A Cancer Protein Interaction Network to Inform Therapeutic Strategies
 OncoPPi Portal A Cancer Protein Interaction Network to Inform Therapeutic Strategies 2017 Contents Datasets... 2 Protein-protein interaction dataset... 2 Set of known PPIs... 3 Domain-domain interactions...
Chapter 1. Introduction
 Chapter 1 Introduction 1.1 Motivation and Goals The increasing availability and decreasing cost of high-throughput (HT) technologies coupled with the availability of computational tools and data form a
Discovery of Novel Human Gene Regulatory Modules from Gene Co-expression and
 Discovery of Novel Human Gene Regulatory Modules from Gene Co-expression and Promoter Motif Analysis Shisong Ma 1,2*, Michael Snyder 3, and Savithramma P Dinesh-Kumar 2* 1 School of Life Sciences, University
LAB ASSIGNMENT 4 INFERENCES FOR NUMERICAL DATA. Comparison of Cancer Survival*
 LAB ASSIGNMENT 4 1 INFERENCES FOR NUMERICAL DATA In this lab assignment, you will analyze the data from a study to compare survival times of patients of both genders with different primary cancers. First,
CELL CYCLE REGULATION AND CANCER. Cellular Reproduction II
 CELL CYCLE REGULATION AND CANCER Cellular Reproduction II THE CELL CYCLE Interphase G1- gap phase 1- cell grows and develops S- DNA synthesis phase- cell replicates each chromosome G2- gap phase 2- cell
DOES THE BRCAX GENE EXIST? FUTURE OUTLOOK
 CHAPTER 6 DOES THE BRCAX GENE EXIST? FUTURE OUTLOOK Genetic research aimed at the identification of new breast cancer susceptibility genes is at an interesting crossroad. On the one hand, the existence
Biochemistry of Carcinogenesis. Lecture # 35 Alexander N. Koval
 Biochemistry of Carcinogenesis Lecture # 35 Alexander N. Koval What is Cancer? The term "cancer" refers to a group of diseases in which cells grow and spread unrestrained throughout the body. It is difficult
Gene expression analysis. Roadmap. Microarray technology: how it work Applications: what can we do with it Preprocessing: Classification Clustering
 Gene expression analysis Roadmap Microarray technology: how it work Applications: what can we do with it Preprocessing: Image processing Data normalization Classification Clustering Biclustering 1 Gene
Computer Science, Biology, and Biomedical Informatics (CoSBBI) Outline. Molecular Biology of Cancer AND. Goals/Expectations. David Boone 7/1/2015
 Outline. Molecular Biology of Cancer AND. Goals/Expectations. David Boone 7/1/2015") Goals/Expectations Computer Science, Biology, and Biomedical (CoSBBI) We want to excite you about the world of computer science, biology, and biomedical informatics. Experience what it is like to be a
Goals/Expectations Computer Science, Biology, and Biomedical (CoSBBI) We want to excite you about the world of computer science, biology, and biomedical informatics. Experience what it is like to be a
38 Int'l Conf. Bioinformatics and Computational Biology BIOCOMP'16
 38 Int'l Conf. Bioinformatics and Computational Biology BIOCOMP'16 PGAR: ASD Candidate Gene Prioritization System Using Expression Patterns Steven Cogill and Liangjiang Wang Department of Genetics and
Cancer and Oncogenes Bioscience in the 21 st Century. Linda Lowe-Krentz
 Cancer and Oncogenes Bioscience in the 21 st Century Linda Lowe-Krentz December 1, 2010 Just a Few Numbers Becoming Cancer Genetic Defects Drugs Our friends and family 25 More mutations as 20 you get older
Cover Page. The handle holds various files of this Leiden University dissertation.
 Cover Page The handle http://hdl.handle.net/1887/22278 holds various files of this Leiden University dissertation. Author: Cunha Carvalho de Miranda, Noel Filipe da Title: Mismatch repair and MUTYH deficient
Gene Selection for Tumor Classification Using Microarray Gene Expression Data
 Gene Selection for Tumor Classification Using Microarray Gene Expression Data K. Yendrapalli, R. Basnet, S. Mukkamala, A. H. Sung Department of Computer Science New Mexico Institute of Mining and Technology
2.75: 84% 2.5: 80% 2.25: 78% 2: 74% 1.75: 70% 1.5: 66% 1.25: 64% 1.0: 60% 0.5: 50% 0.25: 25% 0: 0%
 Capstone Test (will consist of FOUR quizzes and the FINAL test grade will be an average of the four quizzes). Capstone #1: Review of Chapters 1-3 Capstone #2: Review of Chapter 4 Capstone #3: Review of
IPA Advanced Training Course
 IPA Advanced Training Course October 2013 Academia sinica Gene (Kuan Wen Chen) IPA Certified Analyst Agenda I. Data Upload and How to Run a Core Analysis II. Functional Interpretation in IPA Hands-on Exercises
Early Embryonic Development
 Early Embryonic Development Maternal effect gene products set the stage by controlling the expression of the first embryonic genes. 1. Transcription factors 2. Receptors 3. Regulatory proteins Maternal
The Biology and Genetics of Cells and Organisms The Biology of Cancer
 The Biology and Genetics of Cells and Organisms The Biology of Cancer Mendel and Genetics How many distinct genes are present in the genomes of mammals? - 21,000 for human. - Genetic information is carried
ChIP-seq data analysis
 ChIP-seq data analysis Harri Lähdesmäki Department of Computer Science Aalto University November 24, 2017 Contents Background ChIP-seq protocol ChIP-seq data analysis Transcriptional regulation Transcriptional
Profiles of gene expression & diagnosis/prognosis of cancer. MCs in Advanced Genetics Ainoa Planas Riverola
 Profiles of gene expression & diagnosis/prognosis of cancer MCs in Advanced Genetics Ainoa Planas Riverola Gene expression profiles Gene expression profiling Used in molecular biology, it measures the
Inferring Biological Meaning from Cap Analysis Gene Expression Data
 Inferring Biological Meaning from Cap Analysis Gene Expression Data HRYSOULA PAPADAKIS 1. Introduction This project is inspired by the recent development of the Cap analysis gene expression (CAGE) method,
Overview: Conducting the Genetic Orchestra Prokaryotes and eukaryotes alter gene expression in response to their changing environment
 Overview: Conducting the Genetic Orchestra Prokaryotes and eukaryotes alter gene expression in response to their changing environment In multicellular eukaryotes, gene expression regulates development
Cancer outlier differential gene expression detection
 Biostatistics (2007), 8, 3, pp. 566 575 doi:10.1093/biostatistics/kxl029 Advance Access publication on October 4, 2006 Cancer outlier differential gene expression detection BAOLIN WU Division of Biostatistics,
Raymond Auerbach PhD Candidate, Yale University Gerstein and Snyder Labs August 30, 2012
 Elucidating Transcriptional Regulation at Multiple Scales Using High-Throughput Sequencing, Data Integration, and Computational Methods Raymond Auerbach PhD Candidate, Yale University Gerstein and Snyder
Breaking Up is Hard to Do (At Least in Eukaryotes) Mitosis
 Mitosis") Breaking Up is Hard to Do (At Least in Eukaryotes) Mitosis Prokaryotes Have a Simpler Cell Cycle Cell division in prokaryotes takes place in two stages, which together make up a simple cell cycle 1. Copy
Breaking Up is Hard to Do (At Least in Eukaryotes) Mitosis Prokaryotes Have a Simpler Cell Cycle Cell division in prokaryotes takes place in two stages, which together make up a simple cell cycle 1. Copy
T. R. Golub, D. K. Slonim & Others 1999
 T. R. Golub, D. K. Slonim & Others 1999 Big Picture in 1999 The Need for Cancer Classification Cancer classification very important for advances in cancer treatment. Cancers of Identical grade can have
Transcriptional control in Eukaryotes: (chapter 13 pp276) Chromatin structure affects gene expression. Chromatin Array of nuc
 Chromatin structure affects gene expression. Chromatin Array of nuc") Transcriptional control in Eukaryotes: (chapter 13 pp276) Chromatin structure affects gene expression Chromatin Array of nuc 1 Transcriptional control in Eukaryotes: Chromatin undergoes structural changes
Transcriptional control in Eukaryotes: (chapter 13 pp276) Chromatin structure affects gene expression Chromatin Array of nuc 1 Transcriptional control in Eukaryotes: Chromatin undergoes structural changes
Understandable Statistics
 Understandable Statistics correlated to the Advanced Placement Program Course Description for Statistics Prepared for Alabama CC2 6/2003 2003 Understandable Statistics 2003 correlated to the Advanced Placement
Asingle inherited mutant gene may be enough to
 396 Cancer Inheritance STEVEN A. FRANK Asingle inherited mutant gene may be enough to cause a very high cancer risk. Single-mutation cases have provided much insight into the genetic basis of carcinogenesis,
A Genetic Program for Embryonic Development
 Concept 18.4: A program of differential gene expression leads to the different cell types in a multicellular organism During embryonic development, a fertilized egg gives rise to many different cell types
CoINcIDE: A framework for discovery of patient subtypes across multiple datasets
 Planey and Gevaert Genome Medicine (2016) 8:27 DOI 10.1186/s13073-016-0281-4 METHOD CoINcIDE: A framework for discovery of patient subtypes across multiple datasets Catherine R. Planey and Olivier Gevaert
Accessing and Using ENCODE Data Dr. Peggy J. Farnham
 1 William M Keck Professor of Biochemistry Keck School of Medicine University of Southern California How many human genes are encoded in our 3x10 9 bp? C. elegans (worm) 959 cells and 1x10 8 bp 20,000
CHAPTER 6 SUMMARIZING DISCUSSION
 CHAPTER 6 SUMMARIZING DISCUSSION More than 20 years ago the founding member of the Wnt gene family, Wnt-1/Int1, was discovered as a proto-oncogene activated in mammary gland tumors by the mouse mammary
SSM signature genes are highly expressed in residual scar tissues after preoperative radiotherapy of rectal cancer.
 Supplementary Figure 1 SSM signature genes are highly expressed in residual scar tissues after preoperative radiotherapy of rectal cancer. Scatter plots comparing expression profiles of matched pretreatment
Breaking Up is Hard to Do (At Least in Eukaryotes) Mitosis
 Mitosis") Breaking Up is Hard to Do (At Least in Eukaryotes) Mitosis Chromosomes Chromosomes were first observed by the German embryologist Walther Fleming in 1882. Chromosome number varies among organisms most
Breaking Up is Hard to Do (At Least in Eukaryotes) Mitosis Chromosomes Chromosomes were first observed by the German embryologist Walther Fleming in 1882. Chromosome number varies among organisms most
Multistep nature of cancer development. Cancer genes
 Multistep nature of cancer development Phenotypic progression loss of control over cell growth/death (neoplasm) invasiveness (carcinoma) distal spread (metastatic tumor) Genetic progression multiple genetic
Computational Identification and Prediction of Tissue-Specific Alternative Splicing in H. Sapiens. Eric Van Nostrand CS229 Final Project
 Computational Identification and Prediction of Tissue-Specific Alternative Splicing in H. Sapiens. Eric Van Nostrand CS229 Final Project Introduction RNA splicing is a critical step in eukaryotic gene
Experimental Design For Microarray Experiments. Robert Gentleman, Denise Scholtens Arden Miller, Sandrine Dudoit
 Experimental Design For Microarray Experiments Robert Gentleman, Denise Scholtens Arden Miller, Sandrine Dudoit Copyright 2002 Complexity of Genomic data the functioning of cells is a complex and highly
HALLA KABAT * Outreach Program, mircore, 2929 Plymouth Rd. Ann Arbor, MI 48105, USA LEO TUNKLE *
 CERNA SEARCH METHOD IDENTIFIED A MET-ACTIVATED SUBGROUP AMONG EGFR DNA AMPLIFIED LUNG ADENOCARCINOMA PATIENTS HALLA KABAT * Outreach Program, mircore, 2929 Plymouth Rd. Ann Arbor, MI 48105, USA Email:
AZA Research Priorities
 AZA Research Priorities Association of Zoos & Aquariums Research & Technology Committee Position Summary: The application of research findings to meet critical needs is a key to the successful accomplishment
CANCER. Inherited Cancer Syndromes. Affects 25% of US population. Kills 19% of US population (2nd largest killer after heart disease)
") CANCER Affects 25% of US population Kills 19% of US population (2nd largest killer after heart disease) NOT one disease but 200-300 different defects Etiologic Factors In Cancer: Relative contributions
CANCER Affects 25% of US population Kills 19% of US population (2nd largest killer after heart disease) NOT one disease but 200-300 different defects Etiologic Factors In Cancer: Relative contributions
Below, we included the point-to-point response to the comments of both reviewers.
 To the Editor and Reviewers: We would like to thank the editor and reviewers for careful reading, and constructive suggestions for our manuscript. According to comments from both reviewers, we have comprehensively
Breast cancer. Risk factors you cannot change include: Treatment Plan Selection. Inferring Transcriptional Module from Breast Cancer Profile Data
 Breast cancer Inferring Transcriptional Module from Breast Cancer Profile Data Breast Cancer and Targeted Therapy Microarray Profile Data Inferring Transcriptional Module Methods CSC 177 Data Warehousing
Mitosis and the Cell Cycle
 Mitosis and the Cell Cycle Chapter 12 The Cell Cycle: Cell Growth & Cell Division Where it all began You started as a cell smaller than a period at the end of a sentence Getting from there to here Cell
Introduction. Cancer Biology. Tumor-suppressor genes. Proto-oncogenes. DNA stability genes. Mechanisms of carcinogenesis.
 Cancer Biology Chapter 18 Eric J. Hall., Amato Giaccia, Radiobiology for the Radiologist Introduction Tissue homeostasis depends on the regulated cell division and self-elimination (programmed cell death)
Liposarcoma*Genome*Project*
 LiposarcomaGenomeProject July2015! Submittedby: JohnMullen,MD EdwinChoy,MD,PhD GregoryCote,MD,PhD G.PeturNielsen,MD BradBernstein,MD,PhD Liposarcoma Background Liposarcoma is the most common soft tissue
Identification of Tissue Independent Cancer Driver Genes
 Identification of Tissue Independent Cancer Driver Genes Alexandros Manolakos, Idoia Ochoa, Kartik Venkat Supervisor: Olivier Gevaert Abstract Identification of genomic patterns in tumors is an important
Detection of aneuploidy in a single cell using the Ion ReproSeq PGS View Kit
 APPLICATION NOTE Ion PGM System Detection of aneuploidy in a single cell using the Ion ReproSeq PGS View Kit Key findings The Ion PGM System, in concert with the Ion ReproSeq PGS View Kit and Ion Reporter
Iso-Seq Method Updates and Target Enrichment Without Amplification for SMRT Sequencing
 Iso-Seq Method Updates and Target Enrichment Without Amplification for SMRT Sequencing PacBio Americas User Group Meeting Sample Prep Workshop June.27.2017 Tyson Clark, Ph.D. For Research Use Only. Not
RASA: Robust Alternative Splicing Analysis for Human Transcriptome Arrays
 Supplementary Materials RASA: Robust Alternative Splicing Analysis for Human Transcriptome Arrays Junhee Seok 1*, Weihong Xu 2, Ronald W. Davis 2, Wenzhong Xiao 2,3* 1 School of Electrical Engineering,
Analysis of Massively Parallel Sequencing Data Application of Illumina Sequencing to the Genetics of Human Cancers
 Analysis of Massively Parallel Sequencing Data Application of Illumina Sequencing to the Genetics of Human Cancers Gordon Blackshields Senior Bioinformatician Source BioScience 1 To Cancer Genetics Studies
Machine Learning! Robert Stengel! Robotics and Intelligent Systems MAE 345,! Princeton University, 2017
 Machine Learning! Robert Stengel! Robotics and Intelligent Systems MAE 345,! Princeton University, 2017 A.K.A. Artificial Intelligence Unsupervised learning! Cluster analysis Patterns, Clumps, and Joining
C H A R A C T E R I Z A T I O N O F T H E N O V E L D O M A I N W I T H N O N A M E G E N E I N C O L O N C A N C E R
 C H A R A C T E R I Z A T I O N O F T H E N O V E L D O M A I N W I T H N O N A M E G E N E I N C O L O N C A N C E R Charleen Rupnarain A dissertation submitted to the Faculty of Science, University of
Section D: The Molecular Biology of Cancer
 CHAPTER 19 THE ORGANIZATION AND CONTROL OF EUKARYOTIC GENOMES Section D: The Molecular Biology of Cancer 1. Cancer results from genetic changes that affect the cell cycle 2. Oncogene proteins and faulty
Digitizing the Proteomes From Big Tissue Biobanks
 Digitizing the Proteomes From Big Tissue Biobanks Analyzing 24 Proteomes Per Day by Microflow SWATH Acquisition and Spectronaut Pulsar Analysis Jan Muntel 1, Nick Morrice 2, Roland M. Bruderer 1, Lukas
Broad H3K4me3 is associated with increased transcription elongation and enhancer activity at tumor suppressor genes
 Broad H3K4me3 is associated with increased transcription elongation and enhancer activity at tumor suppressor genes Kaifu Chen 1,2,3,4,5,10, Zhong Chen 6,10, Dayong Wu 6, Lili Zhang 7, Xueqiu Lin 1,2,8,
Network-assisted data analysis
 Network-assisted data analysis Bing Zhang Department of Biomedical Informatics Vanderbilt University bing.zhang@vanderbilt.edu Protein identification in shotgun proteomics Protein digestion LC-MS/MS Protein
R2 Training Courses. Release The R2 support team
 R2 Training Courses Release 2.0.2 The R2 support team Nov 08, 2018 Students Course 1 Student Course: Investigating Intra-tumor Heterogeneity 3 1.1 Introduction.............................................
Regarding techniques of proteomics, there is:
 Molecular الحلقة biology 14 واألخيرة To put you back in the context; the discussion was about Trancriptomics (the study of transcription). The following topic will be PROTEOMICS, which is the study of
Nature Getetics: doi: /ng.3471
 Supplementary Figure 1 Summary of exome sequencing data. ( a ) Exome tumor normal sample sizes for bladder cancer (BLCA), breast cancer (BRCA), carcinoid (CARC), chronic lymphocytic leukemia (CLLX), colorectal
CELL BIOLOGY - CLUTCH CH CANCER.
 !! www.clutchprep.com CONCEPT: OVERVIEW OF CANCER Cancer is a disease which is primarily caused from misregulated cell division, which form There are two types of tumors - Benign tumors remain confined
Dominic J Smiraglia, PhD Department of Cancer Genetics. DNA methylation in prostate cancer
 Dominic J Smiraglia, PhD Department of Cancer Genetics DNA methylation in prostate cancer Overarching theme Epigenetic regulation allows the genome to be responsive to the environment Sets the tone for
Targeting the cgmp Pathway to Treat Colorectal Cancer
 Thomas Jefferson University Jefferson Digital Commons Department of Pharmacology and Experimental Therapeutics Faculty Papers Department of Pharmacology and Experimental Therapeutics 29 Targeting the cgmp
Ecological Statistics
 A Primer of Ecological Statistics Second Edition Nicholas J. Gotelli University of Vermont Aaron M. Ellison Harvard Forest Sinauer Associates, Inc. Publishers Sunderland, Massachusetts U.S.A. Brief Contents
Nature Methods: doi: /nmeth.3115
 Supplementary Figure 1 Analysis of DNA methylation in a cancer cohort based on Infinium 450K data. RnBeads was used to rediscover a clinically distinct subgroup of glioblastoma patients characterized by
Nature Neuroscience: doi: /nn Supplementary Figure 1
 Supplementary Figure 1 Illustration of the working of network-based SVM to confidently predict a new (and now confirmed) ASD gene. Gene CTNND2 s brain network neighborhood that enabled its prediction by
VIII Curso Internacional del PIRRECV. Some molecular mechanisms of cancer
 VIII Curso Internacional del PIRRECV Some molecular mechanisms of cancer Laboratorio de Comunicaciones Celulares, Centro FONDAP Estudios Moleculares de la Celula (CEMC), ICBM, Facultad de Medicina, Universidad
Reliability of Ordination Analyses
 Reliability of Ordination Analyses Objectives: Discuss Reliability Define Consistency and Accuracy Discuss Validation Methods Opening Thoughts Inference Space: What is it? Inference space can be defined
On the Reproducibility of TCGA Ovarian Cancer MicroRNA Profiles
 On the Reproducibility of TCGA Ovarian Cancer MicroRNA Profiles Ying-Wooi Wan 1,2,4, Claire M. Mach 2,3, Genevera I. Allen 1,7,8, Matthew L. Anderson 2,4,5 *, Zhandong Liu 1,5,6,7 * 1 Departments of Pediatrics
Chapter 9. Cells Grow and Reproduce
 Chapter 9 Cells Grow and Reproduce DNA Replication DNA polymerase Addition of a nucleotide to the 3 end of a growing strand Use dntps as substrate Release of pyrophosphate Initiation of Replication Replication
Supplementary Figures
 Supplementary Figures Supplementary Figure 1. Pan-cancer analysis of global and local DNA methylation variation a) Variations in global DNA methylation are shown as measured by averaging the genome-wide
Student Performance Q&A:
 Student Performance Q&A: 2009 AP Statistics Free-Response Questions The following comments on the 2009 free-response questions for AP Statistics were written by the Chief Reader, Christine Franklin of
Non-Profit Startup Paradigm Launches Cancer Panel Based on DNA, RNA Sequencing
 Non-Profit Startup Paradigm Launches Cancer Panel Based on DNA, RNA Sequencing April 11, 2014 By Tony Fong Non-profit diagnostics outfit Paradigm last month joined a growing list of entrants in the clinical
High AU content: a signature of upregulated mirna in cardiac diseases
 https://helda.helsinki.fi High AU content: a signature of upregulated mirna in cardiac diseases Gupta, Richa 2010-09-20 Gupta, R, Soni, N, Patnaik, P, Sood, I, Singh, R, Rawal, K & Rani, V 2010, ' High
Introduction to Cancer Biology
 Introduction to Cancer Biology Robin Hesketh Multiple choice questions (choose the one correct answer from the five choices) Which ONE of the following is a tumour suppressor? a. AKT b. APC c. BCL2 d.
Summary and Concluding Remarks
 Summary and Concluding Remarks Chapter 6 The intestinal epithelium provides an excellent model system for investigating molecular mechanisms regulating cell lineage establishment, stem cell proliferation,
AllinaHealthSystems 1
 Overview Biology and Introduction to the Genetics of Cancer Denise Jones, MS, CGC Certified Genetic Counselor Virginia Piper Cancer Service Line I. Our understanding of cancer the historical perspective
Supplementary Information
 Supplementary Information Modelling the Yeast Interactome Vuk Janjić, Roded Sharan 2 and Nataša Pržulj, Department of Computing, Imperial College London, London, United Kingdom 2 Blavatnik School of Computer
A REVIEW OF BIOINFORMATICS APPLICATION IN BREAST CANCER RESEARCH
 Journal of Advanced Bioinformatics Applications and Research. Vol 1, Issue 1, June 2010, pp 59-68 A REVIEW OF BIOINFORMATICS APPLICATION IN BREAST CANCER RESEARCH Vidya Vaidya, Shriram Dawkhar Department
Lec 02: Estimation & Hypothesis Testing in Animal Ecology
 Lec 02: Estimation & Hypothesis Testing in Animal Ecology Parameter Estimation from Samples Samples We typically observe systems incompletely, i.e., we sample according to a designed protocol. We then
Computational Analysis of UHT Sequences Histone modifications, CAGE, RNA-Seq
 Computational Analysis of UHT Sequences Histone modifications, CAGE, RNA-Seq Philipp Bucher Wednesday January 21, 2009 SIB graduate school course EPFL, Lausanne ChIP-seq against histone variants: Biological
WDHS Curriculum Map Probability and Statistics. What is Statistics and how does it relate to you?
 WDHS Curriculum Map Probability and Statistics Time Interval/ Unit 1: Introduction to Statistics 1.1-1.3 2 weeks S-IC-1: Understand statistics as a process for making inferences about population parameters
SPRING GROVE AREA SCHOOL DISTRICT. Course Description. Instructional Strategies, Learning Practices, Activities, and Experiences.
 SPRING GROVE AREA SCHOOL DISTRICT PLANNED COURSE OVERVIEW Course Title: Basic Introductory Statistics Grade Level(s): 11-12 Units of Credit: 1 Classification: Elective Length of Course: 30 cycles Periods
Functional Limitations
 Regulation of the Cell Cycle Chapter 12 Pg. 228 245 Functional Limitations Various factors determine whether and when a cell divides. Two functional limitations for cell size limit growth or influence
Supplementary Figures
 Supplementary Figures Supplementary Figure 1. Heatmap of GO terms for differentially expressed genes. The terms were hierarchically clustered using the GO term enrichment beta. Darker red, higher positive
Colorectal adenocarcinoma leading cancer in developed countries In US, annual deaths due to colorectal adenocarcinoma 57,000.
 Colonic Neoplasia Remotti Colorectal adenocarcinoma leading cancer in developed countries In US, annual incidence of colorectal adenocarcinoma 150,000. In US, annual deaths due to colorectal adenocarcinoma
Meta-Analysis David Wilson, Ph.D. Upcoming Seminar: October 20-21, 2017, Philadelphia, Pennsylvania
 Meta-Analysis David Wilson, Ph.D. Upcoming Seminar: October 20-21, 2017, Philadelphia, Pennsylvania Meta-Analysis Workshop David B. Wilson, PhD September 16, 2016 George Mason University Department of
Introduction to Meta-Analysis
 Introduction to Meta-Analysis Nazım Ço galtay and Engin Karada g Abstract As a means to synthesize the results of multiple studies, the chronological development of the meta-analysis method was in parallel
AVENIO family of NGS oncology assays ctdna and Tumor Tissue Analysis Kits
 AVENIO family of NGS oncology assays ctdna and Tumor Tissue Analysis Kits Accelerating clinical research Next-generation sequencing (NGS) has the ability to interrogate many different genes and detect
SUPPLEMENTARY FIGURES
 SUPPLEMENTARY FIGURES Figure S1. Clinical significance of ZNF322A overexpression in Caucasian lung cancer patients. (A) Representative immunohistochemistry images of ZNF322A protein expression in tissue
Test Bank for Robbins and Cotran Pathologic Basis of Disease 9th Edition by Kumar
 Link full download: http://testbankair.com/download/test-bank-for-robbins-cotran-pathologic-basis-of-disease-9th-edition-bykumar-abbas-and-aster Test Bank for Robbins and Cotran Pathologic Basis of Disease
Lentiviral Delivery of Combinatorial mirna Expression Constructs Provides Efficient Target Gene Repression.
 Supplementary Figure 1 Lentiviral Delivery of Combinatorial mirna Expression Constructs Provides Efficient Target Gene Repression. a, Design for lentiviral combinatorial mirna expression and sensor constructs.
Case Studies on High Throughput Gene Expression Data Kun Huang, PhD Raghu Machiraju, PhD
 Case Studies on High Throughput Gene Expression Data Kun Huang, PhD Raghu Machiraju, PhD Department of Biomedical Informatics Department of Computer Science and Engineering The Ohio State University Review
HST.161 Molecular Biology and Genetics in Modern Medicine Fall 2007
 MIT OpenCourseWare http://ocw.mit.edu HST.161 Molecular Biology and Genetics in Modern Medicine Fall 2007 For information about citing these materials or our Terms of Use, visit: http://ocw.mit.edu/terms.
mirna Dr. S Hosseini-Asl
 mirna Dr. S Hosseini-Asl 1 2 MicroRNAs (mirnas) are small noncoding RNAs which enhance the cleavage or translational repression of specific mrna with recognition site(s) in the 3 - untranslated region
Reporting Checklist for Nature Neuroscience
 Corresponding Author: Manuscript Number: Manuscript Type: Alex Pouget NN-A46249B Article Reporting Checklist for Nature Neuroscience # Main Figures: 7 # Supplementary Figures: 3 # Supplementary Tables: