mir-509-5p and mir-1243 increase the sensitivity to gemcitabine by inhibiting
|
|
|
- Alvin O’Connor’
- 6 years ago
- Views:
Transcription
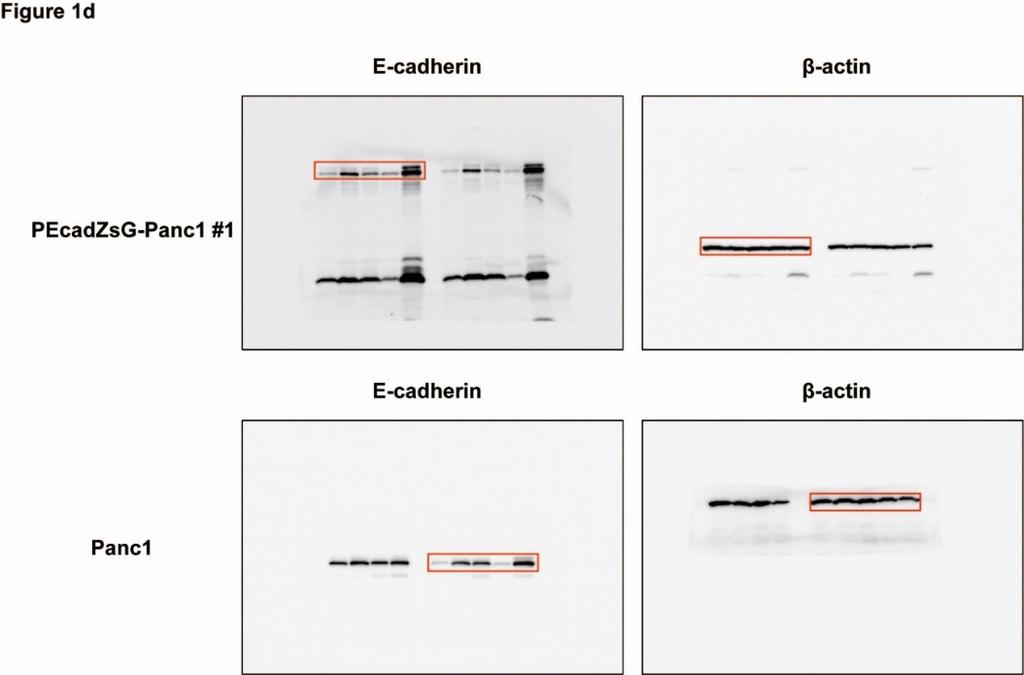
1 mir-509-5p and mir-1243 increase the sensitivity to gemcitabine by inhibiting epithelial-mesenchymal transition in pancreatic cancer Hidekazu Hiramoto, M.D. 1,3, Tomoki Muramatsu, Ph.D. 1, Daisuke Ichikawa, M.D., Ph.D. 3,6, Kousuke Tanimoto, Ph.D. 4, Satoru Yasukawa, M.D., Ph.D. 5, Eigo Otsuji, M.D., Ph.D. 3 and Johji Inazawa, M.D., Ph.D. 1,2 1 Department of Molecular Cytogenetics, Medical Research Institute, Tokyo Medical and Dental University, Tokyo, Japan. 2 Bioresource Research Center, Tokyo Medical and Dental University, Tokyo, Japan. 3 Department of Digestive Surgery, Graduate School of Medical Science, Kyoto Prefectural University of Medicine, Kyoto, Japan. 4 Genome Laboratory, Medical Research Institute, Tokyo Medical and Dental University, Tokyo, Japan. 5 Department of Pathology, Kyoto Prefectural University of Medicine, Kyoto, Japan. 6 First Department of Surgery, Faculty of Medicine, University of Yamanashi, Yamanashi, Japan. Supplementary Information Supplementary Figure S1. Map of the promoter region of the CDH1/E-cadherin gene and reporter construct for the establishment of a cell-based reporter system. Supplementary Figure S2. Expression of mir-509-5p and in 24 pancreatic cancer cell lines and normal pancreatic tissue. Supplementary Figure S3. mir-509-5p and mir-1243 did not induce an MET phenotype in a couple of pancreatic cancer cell lines. Supplementary Figure S4. The design of each reporter construct for identification of direct target genes in each mirna.
2 Supplementary Figure S5. Knockdown of each mirna did not affect EMT phenotype, cell proliferation, motility and invasion. Supplementary Figure S6. Suppression of SMADs reduces the effect of TGF-β. Supplementary Figure S7. The expression of mir-1243 is not associated with overall survival. Supplementary Figure S8. The expression of mir-509-5p and mir-1243 is not correlated with overall survival in a corresponding cohort of 141 patients with pancreatic ductal adenocarcinoma (PDCA) in TCGA database.
3 CDH1 (E-cadherin, 16q22.1) Putative TSS bp E-box E-box Exon1 Z-box Promoter region used for reporter construct (1,058bp) CDH1 promoter GFP pzsgreen1-1 Supplementary Figure S1. Map of the promoter region of the CDH1/E-cadherin gene and reporter construct for the establishment of a cell-based reporter system.
4 Supplementary Figure S2. Expression of mir-509-5p and in 24 pancreatic cancer cell lines and normal pancreatic tissue. The expression of mir-509-5p (left) and mir-1243 (right) in a panel of 24 pancreatic cancer cell lines using qrt-pcr. Relative expression levels of mir-509-5p and mir transcripts were quantified in comparison to RNU6B. Bar graphs show the ratio of the expression level in these cell lines to that in normal pancreatic tissue (bars, SD).

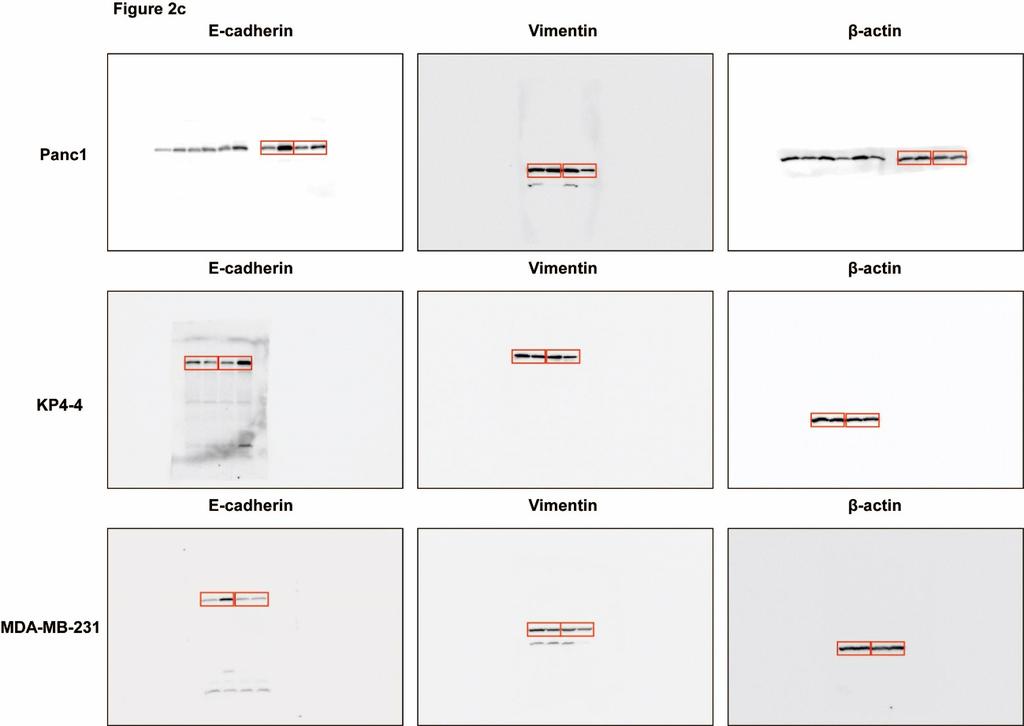
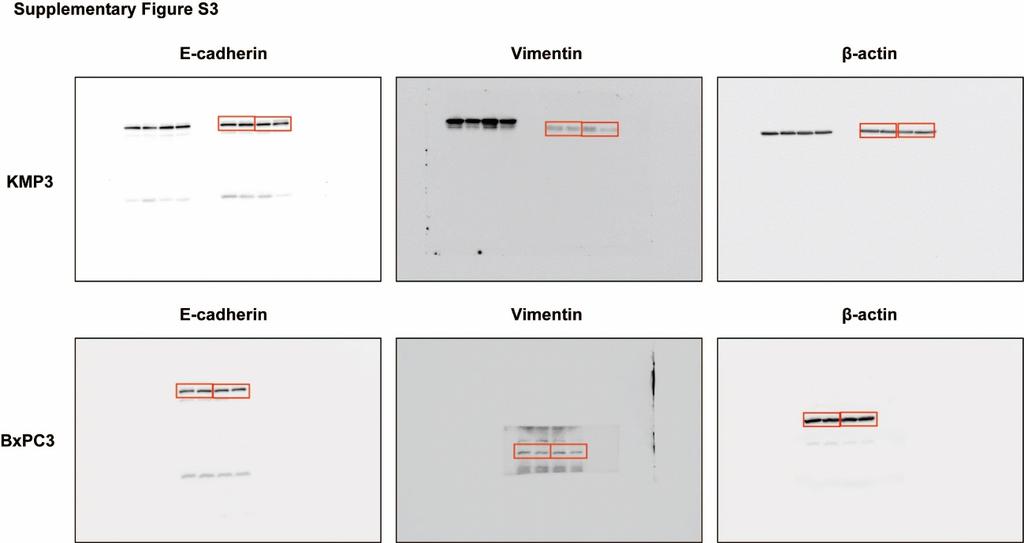
5 Supplementary Figure S3. mir-509-5p and mir-1243 did not induce an MET phenotype in a couple of pancreatic cancer cell lines. Western blot analysis of E-cadherin and Vimentin protein levels in SU and BxPC3 cells 72 hours after transfection of 10 nmol/l of mir-nc, mir-509-5p or mir-1243.
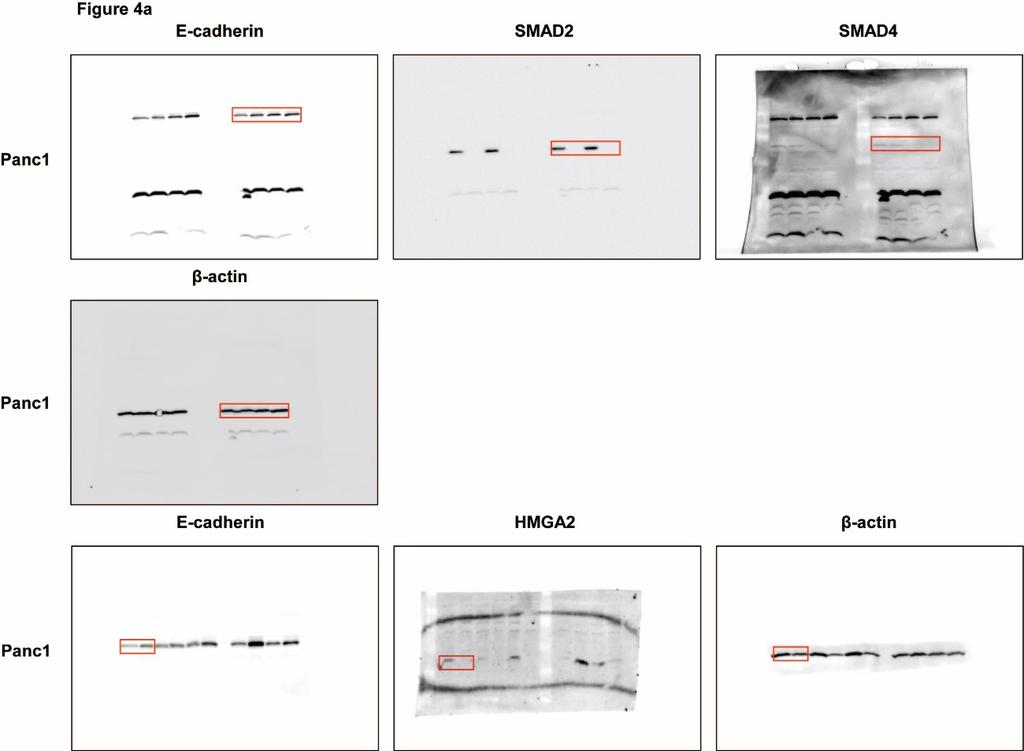
6 Supplementary Figure S4. The design of each reporter construct for identification of direct target genes in each mirna. (a and b) The putative binding sites of mir-509-5p in the 3 -UTR region of VIM, HMGA2 and ZEB1. These sites were analyzed using TargetScan Human 7.1. (b) Results of luciferase reporter assay of HMGA2 and ZEB1. (c) The putative binding sites of mir in the 3 -UTR region of SMAD2 and SMAD4.
 The results of western blotting of E-cadherin and Vimentin in KMP3 and CFPAC1 cells 72 hours after transfection with anti-mir-nc, anti-mir-1243 or anti-mir-nc and anti-mir-509-5p.")
7 Supplementary Figure S5. Knockdown of each mirna did not affect EMT phenotype, cell proliferation, motility and invasion. (a) The results of western blotting of E-cadherin and Vimentin in KMP3 and CFPAC1 cells 72 hours after transfection with anti-mir-nc, anti-mir-1243 or anti-mir-nc and anti-mir-509-5p. (b) The number of viable cells hours after transfection of each 40 nmol/l of anti-mirna was assessed by the WST-8 assay. Each data point represents the mean of triplicate experiments (bars, SD). (c and d) Transwell migration and invasion assays were performed in 24-well modified Boyden chambers without and with Matrigel, respectively. Experiments were performed in triplicate, and each data point represents the mean (bars, SD).
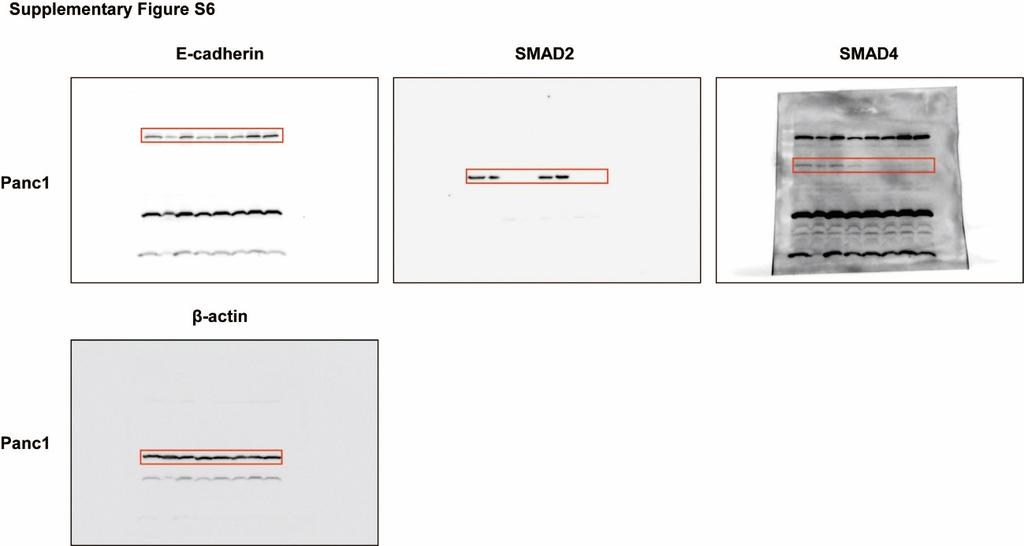
 The results of western blotting of E-cadherin, SMAD2 and SMAD4 in Panc1 cells 48 hours after treatment with or without TGF-β (5 ng/ml) and transfection with si-nc, si- SMAD2, si-smad4 and")
8 Supplementary Figure S6. Suppression of SMADs reduces the effect of TGF-β. (a) The results of western blotting of E-cadherin, SMAD2 and SMAD4 in Panc1 cells 48 hours after treatment with or without TGF-β (5 ng/ml) and transfection with si-nc, si- SMAD2, si-smad4 and si-smad2 plus si-smad4. (b) The number of viable cells hours after transfection of each 20 nmol/l of sirna was assessed by the WST-8 assay. These transfectants were treated with TGF-β (5 ng/ml) 24hours after each sirna transfection. Each data point represents the mean of triplicate experiments (bars, SD). (c and d) Transwell migration and invasion assays were performed in 24-well modified Boyden chambers without and with Matrigel, respectively. sirna-transfected Panc1 cells ( cells per well [migration and invasion assay]) were transferred into the upper chamber, and the migrated or invaded cells on the lower surface of the filters were fixed, stained and counted after 24 hours of incubation. Experiments were performed in triplicate, and each data point represents the mean (bars, SD).
 FFPE of Panc1 cells, 24 hours after transfection of mir-nc (upper) and mir-1243 (bottom). (b) Primary PDAC with negative staining (upper) and positive staining (bottom).")
9 Supplementary Figure S7. The expression of mir-1243 is not associated with overall survival. (a and b) Representative results of in situ hybridization assay of mir (A) FFPE of Panc1 cells, 24 hours after transfection of mir-nc (upper) and mir-1243 (bottom). (b) Primary PDAC with negative staining (upper) and positive staining (bottom). (c) Kaplan-Meier curves for overall survival rates of patients with primary PDAC. The expression of mir-1243 in tumor cells was not associated with overall survival (P = , log-rank test).
10 Supplementary Figure S8. The expression of mir-509-5p and mir-1243 is not correlated with overall survival in a corresponding cohort of 141 patients with pancreatic ductal adenocarcinoma (PDCA) in TCGA database. (a and b) Kaplan-Meier curves for overall survival rates of patients with primary PDAC in TCGA data. The expression of mir-509-5p (left) and mir-1243 (right) in tumor cells was not correlated with overall survival (P = , P = , log-rank test, respectively).
11
12
13

14
15
16
17
18
Supplementary Figure S1 Expression of mir-181b in EOC (A) Kaplan-Meier
 Kaplan-Meier") Supplementary Figure S1 Expression of mir-181b in EOC (A) Kaplan-Meier curves for progression-free survival (PFS) and overall survival (OS) in a cohort of patients (N=52) with stage III primary ovarian
Supplementary Figure S1 Expression of mir-181b in EOC (A) Kaplan-Meier curves for progression-free survival (PFS) and overall survival (OS) in a cohort of patients (N=52) with stage III primary ovarian
Type of file: PDF Size of file: 0 KB Title of file for HTML: Supplementary Information Description: Supplementary Figures
 Type of file: PDF Size of file: 0 KB Title of file for HTML: Supplementary Information Description: Supplementary Figures Supplementary Figure 1 mir-128-3p is highly expressed in chemoresistant, metastatic
Interleukin-6 promotes pancreatic cancer cell migration by rapidly activating the small GTPase CDC42
 Interleukin-6 promotes pancreatic cancer cell migration by rapidly activating the small GTPase CDC42 Gina L. Razidlo, Kevin M. Burton, and Mark A. McNiven SUPPORTING INFORMATION Figure S1. IL-6 promotes
TMA-VARESE COHORT-1 TMA-BERN COHORT-2
 Supplementary Figure 1 TMA-VARESE COHORT-1 TOTAL SAMPLES #5 GLEASON SCORE Number Percentage 6 16 32% = 7 17 34% >7 17 34% TUMOR STAGE T2C 28 56% T3A- 21 42% T3C-T4 1 2% NODE STATUS N 42 84% N1 8 16% PSA
SUPPLEMENTARY INFORMATION
 DOI: 10.1038/ncb2607 Figure S1 Elf5 loss promotes EMT in mammary epithelium while Elf5 overexpression inhibits TGFβ induced EMT. (a, c) Different confocal slices through the Z stack image. (b, d) 3D rendering
Supplementary Figures
 Supplementary Figures Supplementary Figure 1 DOT1L regulates the expression of epithelial and mesenchymal markers. (a) The expression levels and cellular localizations of EMT markers were confirmed by
Supplementary Figure 1. The mir-182 binding site of SMAD7 3 UTR and the. mutated sequence.
 Supplementary Figure 1. The mir-182 binding site of SMAD7 3 UTR and the mutated sequence. 1 Supplementary Figure 2. Expression of mir-182 and SMAD7 in various cell lines. (A) Basal levels of mir-182 expression
Supplemental Table S1
 Supplemental Table S. Tumorigenicity and metastatic potential of 44SQ cell subpopulations a Tumorigenicity b Average tumor volume (mm ) c Lung metastasis d CD high /4 8. 8/ CD low /4 6./ a Mice were injected
Supplementary Figure 1. HOPX is hypermethylated in NPC. (a) Methylation levels of HOPX in Normal (n = 24) and NPC (n = 24) tissues from the
 Methylation levels of HOPX in Normal (n = 24) and NPC (n = 24) tissues from the") Supplementary Figure 1. HOPX is hypermethylated in NPC. (a) Methylation levels of HOPX in Normal (n = 24) and NPC (n = 24) tissues from the genome-wide methylation microarray data. Mean ± s.d.; Student
Supplementary Figure 1. HOPX is hypermethylated in NPC. (a) Methylation levels of HOPX in Normal (n = 24) and NPC (n = 24) tissues from the genome-wide methylation microarray data. Mean ± s.d.; Student
Supplementary Figure (OH) 22 nanoparticles did not affect cell viability and apoposis. MDA-MB-231, MCF-7, MCF-10A and BT549 cells were
 22 nanoparticles did not affect cell viability and apoposis. MDA-MB-231, MCF-7, MCF-10A and BT549 cells were") Supplementary Figure 1. Gd@C 82 (OH) 22 nanoparticles did not affect cell viability and apoposis. MDA-MB-231, MCF-7, MCF-10A and BT549 cells were treated with PBS, Gd@C 82 (OH) 22, C 60 (OH) 22 or GdCl
Supplementary Figure 1. Gd@C 82 (OH) 22 nanoparticles did not affect cell viability and apoposis. MDA-MB-231, MCF-7, MCF-10A and BT549 cells were treated with PBS, Gd@C 82 (OH) 22, C 60 (OH) 22 or GdCl
Supplementary Table S1. Tumor samples used for analysis Tumor size (cm) BNG (grade) ERα PR. pn-
 BNG (grade) ERα PR. pn-") Supplementary Table S1. Tumor samples used for analysis Sample# Age Tumor size (cm) pn- Stage Stage BNG (grade) ERα PR HER2 (FISH) Triple negative T1 46 3 N1a III 2 Pos Neg N T2 58 1 N(i-) I 3 Pos Neg
Supplementary Table S1. Tumor samples used for analysis Sample# Age Tumor size (cm) pn- Stage Stage BNG (grade) ERα PR HER2 (FISH) Triple negative T1 46 3 N1a III 2 Pos Neg N T2 58 1 N(i-) I 3 Pos Neg
Title page. Title: MicroRNA-155 Controls Exosome Synthesis and Promotes Gemcitabine Resistance in
 Title page Title: MicroRNA- Controls Synthesis and Promotes Gemcitabine Resistance in Pancreatic Ductal Adenocarcinoma Authors Manabu Mikamori, Daisaku Yamada, Hidetoshi Eguchi, Shinichiro Hasegawa, Tomoya
SUPPLEMENTARY FIGURE LEGENDS
 SUPPLEMENTARY FIGURE LEGENDS Supplementary Figure 1 Negative correlation between mir-375 and its predicted target genes, as demonstrated by gene set enrichment analysis (GSEA). 1 The correlation between
An epithelial-to-mesenchymal transition-inducing potential of. granulocyte macrophage colony-stimulating factor in colon. cancer
 An epithelial-to-mesenchymal transition-inducing potential of granulocyte macrophage colony-stimulating factor in colon cancer Yaqiong Chen, Zhi Zhao, Yu Chen, Zhonglin Lv, Xin Ding, Renxi Wang, He Xiao,
Supplementary Figure 1:
 Supplementary Figure 1: (A) Whole aortic cross-sections stained with Hematoxylin and Eosin (H&E), 7 days after porcine-pancreatic-elastase (PPE)-induced AAA compared to untreated, healthy control aortas
SUPPLEMENTARY INFORMATION
 DOI:.38/ncb3399 a b c d FSP DAPI 5mm mm 5mm 5mm e Correspond to melanoma in-situ Figure a DCT FSP- f MITF mm mm MlanaA melanoma in-situ DCT 5mm FSP- mm mm mm mm mm g melanoma in-situ MITF MlanaA mm mm
HIF-inducible mir-191 promotes migration in breast cancer through complex regulation of TGFβ-signaling in hypoxic microenvironment.
 HIF-inducible mir-9 promotes migration in breast cancer through complex regulation of TGFβ-signaling in hypoxic microenvironment. Neha Nagpal, Hafiz M Ahmad, Shibu Chameettachal3, Durai Sundar, Sourabh
SUPPLEMENTAL TEXT AND FIGURES
 SUPPLEMENTAL TEXT AND FIGURES Prrx1 isoform switching regulates pancreatic cancer invasion and metastatic colonization Shigetsugu Takano, Maximilian Reichert, Basil Bakir, Koushik K. Das, Takahiro Nishida,
Supplementary Fig. 1. GPRC5A post-transcriptionally down-regulates EGFR expression. (a) Plot of the changes in steady state mrna levels versus
 Plot of the changes in steady state mrna levels versus") Supplementary Fig. 1. GPRC5A post-transcriptionally down-regulates EGFR expression. (a) Plot of the changes in steady state mrna levels versus changes in corresponding proteins between wild type and Gprc5a-/-
Supplementary Fig. 1. GPRC5A post-transcriptionally down-regulates EGFR expression. (a) Plot of the changes in steady state mrna levels versus changes in corresponding proteins between wild type and Gprc5a-/-
Supplementary Figure 1. A. Bar graph representing the expression levels of the 19 indicated genes in the microarrays analyses comparing human lung
 Supplementary Figure 1. A. Bar graph representing the expression levels of the 19 indicated genes in the microarrays analyses comparing human lung immortalized broncho-epithelial cells (AALE cells) expressing
Supplementary Information and Figure legends
 Supplementary Information and Figure legends Table S1. Primers for quantitative RT-PCR Target Sequence (5 -> 3 ) Target Sequence (5 -> 3 ) DAB2IP F:TGGACGATGTGCTCTATGCC R:GGATGGTGATGGTTTGGTAG Snail F:CCTCCCTGTCAGATGAGGAC
(A) Cells grown in monolayer were fixed and stained for surfactant protein-c (SPC,
 Cells grown in monolayer were fixed and stained for surfactant protein-c (SPC,") Supplemental Figure Legends Figure S1. Cell line characterization (A) Cells grown in monolayer were fixed and stained for surfactant protein-c (SPC, green) and co-stained with DAPI to visualize the nuclei.
Supplemental Figure Legends Figure S1. Cell line characterization (A) Cells grown in monolayer were fixed and stained for surfactant protein-c (SPC, green) and co-stained with DAPI to visualize the nuclei.
Supplementary Figure 1. SA-β-Gal positive senescent cells in various cancer tissues. Representative frozen sections of breast, thyroid, colon and
 Supplementary Figure 1. SA-β-Gal positive senescent cells in various cancer tissues. Representative frozen sections of breast, thyroid, colon and stomach cancer were stained with SA-β-Gal and nuclear fast
Supplementary Figure 1. Deletion of Smad3 prevents B16F10 melanoma invasion and metastasis in a mouse s.c. tumor model.
 A B16F1 s.c. Lung LN Distant lymph nodes Colon B B16F1 s.c. Supplementary Figure 1. Deletion of Smad3 prevents B16F1 melanoma invasion and metastasis in a mouse s.c. tumor model. Highly invasive growth
Figure S1. Reduction in glomerular mir-146a levels correlate with progression to higher albuminuria in diabetic patients.
 Supplementary Materials Supplementary Figures Figure S1. Reduction in glomerular mir-146a levels correlate with progression to higher albuminuria in diabetic patients. Figure S2. Expression level of podocyte
In vitro scratch assay: method for analysis of cell migration in vitro labeled fluorodeoxyglucose (FDG)
") In vitro scratch assay: method for analysis of cell migration in vitro labeled fluorodeoxyglucose (FDG) 1 Dr Saeb Aliwaini 13/11/2015 Migration in vivo Primary tumors are responsible for only about 10%
In vitro scratch assay: method for analysis of cell migration in vitro labeled fluorodeoxyglucose (FDG) 1 Dr Saeb Aliwaini 13/11/2015 Migration in vivo Primary tumors are responsible for only about 10%
MicroRNA-181a promotes tumor growth and liver metastasis in colorectal cancer by targeting the tumor suppressor WIF-1
 Ji et al. Molecular Cancer 2014, 13:86 RESEARCH Open Access MicroRNA-181a promotes tumor growth and liver metastasis in colorectal cancer by targeting the tumor suppressor WIF-1 Dengbo Ji 1, Zhiguo Chen
Award Number: W81XWH TITLE: Characterizing an EMT Signature in Breast Cancer. PRINCIPAL INVESTIGATOR: Melanie C.
 AD Award Number: W81XWH-08-1-0306 TITLE: Characterizing an EMT Signature in Breast Cancer PRINCIPAL INVESTIGATOR: Melanie C. Bocanegra CONTRACTING ORGANIZATION: Leland Stanford Junior University Stanford,
Supplementary Information
 Supplementary Information Supplementary Figure 1. Effect of mir mimics and anti-mirs on DTPs a, Representative fluorescence microscopy images of GFP vector control or mir mimicexpressing parental and DTP
Supplementary Figures for
 Supplementary Figures for SOX2 suppresses CDKN1A to sustain growth of lung squamous cell carcinoma Takuya Fukazawa 1, Minzhe Guo 4, 5, Naomasa Ishida 1, Tomoki Yamatsuji 1, Munenori Takaoka 1, Etsuko Yokota
supplementary information
 DOI: 10.1038/ncb2133 Figure S1 Actomyosin organisation in human squamous cell carcinoma. (a) Three examples of actomyosin organisation around the edges of squamous cell carcinoma biopsies are shown. Myosin
Lentiviral Delivery of Combinatorial mirna Expression Constructs Provides Efficient Target Gene Repression.
 Supplementary Figure 1 Lentiviral Delivery of Combinatorial mirna Expression Constructs Provides Efficient Target Gene Repression. a, Design for lentiviral combinatorial mirna expression and sensor constructs.
Nature Methods: doi: /nmeth Supplementary Figure 1
 Supplementary Figure 1 Finite-element analysis of cell cluster dynamics in different cluster trap architectures. (a) Cluster-Chip (b) Filter (c) A structure identical to the Cluster-Chip except that one
Figure S1: Effects on haptotaxis are independent of effects on cell velocity A)
") Supplemental Figures Figure S1: Effects on haptotaxis are independent of effects on cell velocity A) Velocity of MV D7 fibroblasts expressing different GFP-tagged Ena/VASP family proteins in the haptotaxis
Supplemental Figures Figure S1: Effects on haptotaxis are independent of effects on cell velocity A) Velocity of MV D7 fibroblasts expressing different GFP-tagged Ena/VASP family proteins in the haptotaxis
T H E J O U R N A L O F C E L L B I O L O G Y
 Supplemental material Díaz et al., http://www.jcb.org/cgi/content/full/jcb.201209151/dc1 T H E J O U R N A L O F C E L L B I O L O G Y Figure S1. Hypoxia induces invadopodia formation in different epithelial
LncRNA TUG1 promoted KIAA1199 expression via mir-600 to accelerate cell metastasis and epithelial-mesenchymal transition in colorectal cancer
 Sun et al. Journal of Experimental & Clinical Cancer Research (2018) 37:106 https://doi.org/10.1186/s13046-018-0771-x RESEARCH Open Access LncRNA TUG1 promoted KIAA1199 expression via mir-600 to accelerate
Supplementary Materials for
 www.sciencesignaling.org/cgi/content/full/7/310/ra11/dc1 Supplementary Materials for STAT3 Induction of mir-146b Forms a Feedback Loop to Inhibit the NF-κB to IL-6 Signaling Axis and STAT3-Driven Cancer
Table S1. Primer sequences used for qrt-pcr. CACCATTGGCAATGAGCGGTTC AGGTCTTTGCGGATGTCCACGT ACTB AAGTCCATGTGCTGGCAGCACT ATCACCACTCCGAAGTCCGTCT LCOR
 Table S1. Primer sequences used for qrt-pcr. ACTB LCOR KLF6 CTBP1 CDKN1A CDH1 ATF3 PLAU MMP9 TFPI2 CACCATTGGCAATGAGCGGTTC AGGTCTTTGCGGATGTCCACGT AAGTCCATGTGCTGGCAGCACT ATCACCACTCCGAAGTCCGTCT CGGCTGCAGGAAAGTTTACA
Supplementary Figure 1. Quantile-quantile (Q-Q) plots. (Panel A) Q-Q plot graphical
 plots. (Panel A) Q-Q plot graphical") Supplementary Figure 1. Quantile-quantile (Q-Q) plots. (Panel A) Q-Q plot graphical representation using all SNPs (n= 13,515,798) including the region on chromosome 1 including SORT1 which was previously
Supplementary Figure 1. Quantile-quantile (Q-Q) plots. (Panel A) Q-Q plot graphical representation using all SNPs (n= 13,515,798) including the region on chromosome 1 including SORT1 which was previously
Supplemental Figure 1. Western blot analysis indicated that MIF was detected in the fractions of
 Supplemental Figure Legends Supplemental Figure 1. Western blot analysis indicated that was detected in the fractions of plasma membrane and cytosol but not in nuclear fraction isolated from Pkd1 null
Supplementary Figure 1. Confocal immunofluorescence showing mitochondrial translocation of Drp1. Cardiomyocytes treated with H 2 O 2 were prestained
 Supplementary Figure 1. Confocal immunofluorescence showing mitochondrial translocation of Drp1. Cardiomyocytes treated with H 2 O 2 were prestained with MitoTracker (red), then were immunostained with
The mir-199a/brm/egr1 axis is a determinant of anchorage-independent growth in epithelial tumor cell lines
 Supplementary information Supplementary Figure -9 Supplementary Table -4 The mir-99a/brm/egr axis is a determinant of anchorage-independent growth in epithelial tumor cell lines Kazuyoshi Kobayashi, Kouhei
(a) Significant biological processes (upper panel) and disease biomarkers (lower panel)
 Significant biological processes (upper panel) and disease biomarkers (lower panel)") Supplementary Figure 1. Functional enrichment analyses of secretomic proteins. (a) Significant biological processes (upper panel) and disease biomarkers (lower panel) 2 involved by hrab37-mediated secretory
Supplementary Figure 1. Functional enrichment analyses of secretomic proteins. (a) Significant biological processes (upper panel) and disease biomarkers (lower panel) 2 involved by hrab37-mediated secretory
PBX3/MEK/ERK1/2/LIN28/let-7b positive feedback loop enhances mesenchymal phenotype to promote glioblastoma migration and invasion
 Xu et al. Journal of Experimental & Clinical Cancer Research (2018) 37:158 https://doi.org/10.1186/s13046-018-0841-0 RESEARCH PBX3/MEK/ERK1/2/LIN28/let-7b positive feedback loop enhances mesenchymal phenotype
Supplementary Information
 Supplementary Information mediates STAT3 activation at retromer-positive structures to promote colitis and colitis-associated carcinogenesis Zhang et al. a b d e g h Rel. Luc. Act. Rel. mrna Rel. mrna
Supplementary Figure 1.TRIM33 binds β-catenin in the nucleus. a & b, Co-IP of endogenous TRIM33 with β-catenin in HT-29 cells (a) and HEK 293T cells
 and HEK 293T cells") Supplementary Figure 1.TRIM33 binds β-catenin in the nucleus. a & b, Co-IP of endogenous TRIM33 with β-catenin in HT-29 cells (a) and HEK 293T cells (b). TRIM33 was immunoprecipitated, and the amount of
Supplementary Figure 1.TRIM33 binds β-catenin in the nucleus. a & b, Co-IP of endogenous TRIM33 with β-catenin in HT-29 cells (a) and HEK 293T cells (b). TRIM33 was immunoprecipitated, and the amount of
SUPPLEMENTARY INFORMATION
 doi:10.1038/nature10866 a b 1 2 3 4 5 6 7 Match No Match 1 2 3 4 5 6 7 Turcan et al. Supplementary Fig.1 Concepts mapping H3K27 targets in EF CBX8 targets in EF H3K27 targets in ES SUZ12 targets in ES
ANGPTL2 increases bone metastasis of breast cancer cells through. Tetsuro Masuda, Motoyoshi Endo, Yutaka Yamamoto, Haruki Odagiri, Tsuyoshi
 Masuda et al. Supplementary information for ANGPTL2 increases bone metastasis of breast cancer cells through enhancing CXCR4 signaling Tetsuro Masuda, Motoyoshi Endo, Yutaka Yamamoto, Haruki Odagiri, Tsuyoshi
Nature Structural & Molecular Biology: doi: /nsmb Supplementary Figure 1. Differential expression of mirnas from the pri-mir-17-92a locus.
 Supplementary Figure 1 Differential expression of mirnas from the pri-mir-17-92a locus. (a) The mir-17-92a expression unit in the third intron of the host mir-17hg transcript. (b,c) Impact of knockdown
MicroRNA-132 inhibits migration, invasion and epithelial-mesenchymal transition by regulating TGFβ1/Smad2 in human non-small cell lung cancer
 European Review for Medical and Pharmacological Sciences MicroRNA-132 inhibits migration, invasion and epithelial-mesenchymal transition by regulating TGFβ1/Smad2 in human non-small cell lung cancer J.-X.
Dynamic cohesin-mediated chromatin architecture controls epithelial mesenchymal plasticity in cancer
 Article Dynamic cohesin-mediated chromatin architecture controls epithelial mesenchymal plasticity in cancer Jiyeon Yun,, Sang-Hyun Song, Hwang-Phill Kim, Sae-Won Han,, Eugene C Yi & Tae-You Kim,,, Abstract
Foxm1 Transcription Factor is Required for Lung Fibrosis and Epithelial to Mesenchymal Transition.
 Manuscript EMBO-2012-82682 Foxm1 Transcription Factor is Required for Lung Fibrosis and Epithelial to Mesenchymal Transition. David Balli, Vladimir Ustiyan, Yufang Zhang, I-Ching Wang, Alex J. Masino,
Kelly J.Gordon 1, Mei Dong 2, Elizabeth M.Chislock 1, Timothy A.Fields 3 and Gerard C.Blobe 1,2,
 Carcinogenesis vol.29 no.2 pp.252 262, 2008 doi:10.1093/carcin/bgm249 Advance Access publication November 13, 2007 Loss of type III transforming growth factor b receptor expression increases motility and
Impact of hyper-o-glcnacylation on apoptosis and NF-κB activity SUPPLEMENTARY METHODS
 SUPPLEMENTARY METHODS 3D culture and cell proliferation- MiaPaCa-2 cell culture in 3D was performed as described previously (1). Briefly, 8-well glass chamber slides were evenly coated with 50 µl/well
(A) Dose response curves of HMLE_shGFP (blue circle), HMLE_shEcad (red square),
 Dose response curves of HMLE_shGFP (blue circle), HMLE_shEcad (red square),") Supplementary Figures and Tables Figure S1. Validation of EMT-selective small molecules (A) Dose response curves of HMLE_shGFP (blue circle), HMLE_shEcad (red square), and HMLE_Twist (black diamond) cells
Supplementary Figures and Tables Figure S1. Validation of EMT-selective small molecules (A) Dose response curves of HMLE_shGFP (blue circle), HMLE_shEcad (red square), and HMLE_Twist (black diamond) cells
Supplementary Figure 1. The CagA-dependent wound healing or transwell migration of gastric cancer cell. AGS cells transfected with vector control or
 Supplementary Figure 1. The CagA-dependent wound healing or transwell migration of gastric cancer cell. AGS cells transfected with vector control or 3xflag-CagA expression vector were wounded using a pipette
Carcinogenesis, 2015, Vol. 36, No. 6,
 Carcinogenesis, 2015, Vol. 36, No. 6, 676 684 doi:10.1093/carcin/bgv027 Advance Access publication April 11, 2015 Original Manuscript original manuscript mir-29c suppresses pancreatic cancer liver metastasis
CCN1: A NOVEL TARGET FOR PANCREATIC CANCER. Andrew Leask.
 CCN1: A NOVEL TARGET FOR PANCREATIC CANCER Andrew Leask CIHR Group in Skeletal Development and Remodeling, Division of Oral Biology and Department of Physiology and Pharmacology, Schulich School of Medicine
Protocol for A-549 VIM RFP (ATCC CCL-185EMT) TGFβ1 EMT Induction and Drug Screening
 TGFβ1 EMT Induction and Drug Screening") Protocol for A-549 VIM RFP (ATCC CCL-185EMT) TGFβ1 EMT Induction and Drug Screening Introduction: Vimentin (VIM) intermediate filament (IF) proteins are associated with EMT in lung cancer and its metastatic
Protocol for A-549 VIM RFP (ATCC CCL-185EMT) TGFβ1 EMT Induction and Drug Screening Introduction: Vimentin (VIM) intermediate filament (IF) proteins are associated with EMT in lung cancer and its metastatic
Does EMT Contribute to Radiation Resistance in Human Breast Cancer?
 AD Award Number: W81XWH-10-1-0592 TITLE: Does EMT Contribute to Radiation Resistance in Human Breast Cancer? PRINCIPAL INVESTIGATOR: Anupama Munshi, Ph.D CONTRACTING ORGANIZATION: University of Oklahoma
SREBP-2 promotes stem cell-like properties and metastasis by transcriptional activation of c-myc in prostate cancer
 SREBP-2 promotes stem cell-like properties and metastasis by transcriptional activation of c-myc in prostate cancer Supplementary Material Supplementary Methods Supplementary References Supplementary Figure
Supplementary Figure 1. Basal level EGFR across a panel of ESCC lines. Immunoblots demonstrate the expression of phosphorylated and total EGFR as
 Supplementary Figure 1. Basal level EGFR across a panel of ESCC lines. Immunoblots demonstrate the expression of phosphorylated and total EGFR as well as their downstream effectors across a panel of ESCC
SUPPLEMENTARY FIGURES
 SUPPLEMENTARY FIGURES Supplementary Figure S1: Fibroblast-induced elongation of cancer cells requires direct contact with living fibroblasts. A. Representative images of HT29-GFP cultured in the presence
MiR-181a promotes epithelial to mesenchymal transition of prostate cancer cells by targeting TGIF2
 European Review for Medical and Pharmacological Sciences 2017; 21: 4835-4843 MiR-181a promotes epithelial to mesenchymal transition of prostate cancer cells by targeting TGIF2 C. ZHIPING 1,2, T. SHIJUN
Supplementary Table 1. List of primers used in this study
 Supplementary Table 1. List of primers used in this study Gene Forward primer Reverse primer Rat Met 5 -aggtcgcttcatgcaggt-3 5 -tccggagacacaggatgg-3 Rat Runx1 5 -cctccttgaaccactccact-3 5 -ctggatctgcctggcatc-3
m 6 A mrna methylation regulates AKT activity to promote the proliferation and tumorigenicity of endometrial cancer
 SUPPLEMENTARY INFORMATION Articles https://doi.org/10.1038/s41556-018-0174-4 In the format provided by the authors and unedited. m 6 A mrna methylation regulates AKT activity to promote the proliferation
High expression of cellular retinol binding protein-1 in lung adenocarcinoma is associated with poor prognosis
 High expression of cellular retinol binding protein-1 in lung adenocarcinoma is associated with poor prognosis Supplementary Material Supplementary Figure S1. Representative CRBP-1 immunostaining of non-neoplastic
Supplementary Figures
 Supplementary Figures Supplementary Figure 1 Characterization of stable expression of GlucB and sshbira in the CT26 cell line (a) Live cell imaging of stable CT26 cells expressing green fluorescent protein
T H E J O U R N A L O F C E L L B I O L O G Y
 T H E J O U R N A L O F C E L L B I O L O G Y Supplemental material Amelio et al., http://www.jcb.org/cgi/content/full/jcb.201203134/dc1 Figure S1. mir-24 regulates proliferation and by itself induces
SOPten flox/flox (KO) Pten flox/flox (WT) flox allele 6.0 kb. Pten. Actin. ! allele 2.3 kb. Supplementary Figure S1. Yanagi, et al.
 Pten flox/flox (WT) flox allele 6.0 kb. Pten. Actin. ! allele 2.3 kb. Supplementary Figure S1. Yanagi, et al.") s1 A Pten flox/flox () SOPten flox/flox () flox allele 6. kb B Pten flox/flox () SOPten flox/flox () Pten Actin! allele 2.3 kb Supplementary Figure S1. Yanagi, et al. A B BrdU BrdU positive cells ( ) 3
s1 A Pten flox/flox () SOPten flox/flox () flox allele 6. kb B Pten flox/flox () SOPten flox/flox () Pten Actin! allele 2.3 kb Supplementary Figure S1. Yanagi, et al. A B BrdU BrdU positive cells ( ) 3
Supplementary Figures for
 mirns regulate s Supplementary igures for MicroRNs Reprogram Normal ibroblasts into Cancer ssociated ibroblasts in Ovarian Cancer nirban K. Mitra, Marion Zillhardt, Youjia Hua, Payal iwari, ndrea E. Murmann,
Antithetical NFATc1-Sox2 and p53-mir200 signaling networks govern pancreatic cancer cell plasticity
 The EMBO Journal Peer Review Process File - EMBO-2014-89574 Manuscript EMBO-2014-89574 Antithetical NFATc1-Sox2 and p53-mir200 signaling networks govern pancreatic cancer cell plasticity Shiv K. Singh,
The pro-metastasis effect of circanks1b in breast cancer
 Zeng et al. Molecular Cancer (2018) 17:160 https://doi.org/10.1186/s12943-018-0914-x RESEARCH Open Access The pro-metastasis effect of circanks1b in breast cancer Kaixuan Zeng 1,2, Bangshun He 1, Burton
Supplementary Figure 1: STAT3 suppresses Kras-induced lung tumorigenesis
 Supplementary Figure 1: STAT3 suppresses Kras-induced lung tumorigenesis (a) Immunohistochemical (IHC) analysis of tyrosine 705 phosphorylation status of STAT3 (P- STAT3) in tumors and stroma (all-time
Supplementary Figure 1. mir124 does not change neuron morphology and synaptic
 Supplementary Figure 1. mir124 does not change neuron morphology and synaptic density. Hippocampal neurons were transfected with mir124 (containing DsRed) or DsRed as a control. 2 d after transfection,
Bmi-1 regulates stem cell-like properties of gastric cancer cells via modulating mirnas
 Wang et al. Journal of Hematology & Oncology (2016) 9:90 DOI 10.1186/s13045-016-0323-9 RESEARCH Bmi-1 regulates stem cell-like properties of gastric cancer cells via modulating mirnas Open Access Xiaofeng
Supplementary Figure 1. Spitzoid Melanoma with PPFIBP1-MET fusion. (a) Histopathology (4x) shows a domed papule with melanocytes extending into the
 Histopathology (4x) shows a domed papule with melanocytes extending into the") Supplementary Figure 1. Spitzoid Melanoma with PPFIBP1-MET fusion. (a) Histopathology (4x) shows a domed papule with melanocytes extending into the deep dermis. (b) The melanocytes demonstrate abundant
Supplementary Figure 1. Spitzoid Melanoma with PPFIBP1-MET fusion. (a) Histopathology (4x) shows a domed papule with melanocytes extending into the deep dermis. (b) The melanocytes demonstrate abundant
Supplementary Table 3. 3 UTR primer sequences. Primer sequences used to amplify and clone the 3 UTR of each indicated gene are listed.
 Supplemental Figure 1. DLKI-DIO3 mirna/mrna complementarity. Complementarity between the indicated DLK1-DIO3 cluster mirnas and the UTR of SOX2, SOX9, HIF1A, ZEB1, ZEB2, STAT3 and CDH1with mirsvr and PhastCons
Long noncoding RNA ABHD11-AS1 predicts the prognosis of pancreatic cancer patients and serves as a promoter by activating the PI3K-AKT pathway
 European Review for Medical and Pharmacological Sciences 2018; 22: 8630-8639 Long noncoding RNA ABHD11-AS1 predicts the prognosis of pancreatic cancer patients and serves as a promoter by activating the
mir-132 inhibits lung cancer cell migration and invasion by targeting SOX4
 Original Article inhibits lung cancer cell migration and invasion by targeting SOX4 Yang Li, Lingling Zu, Yuli Wang, Min Wang, Peirui Chen, Qinghua Zhou Tianjin Key Laboratory of Lung Cancer Metastasis
Supplementary Information
 Supplementary Information An orally available, small-molecule interferon inhibits viral replication Hideyuki Konishi 1, Koichi Okamoto 1, Yusuke Ohmori 1, Hitoshi Yoshino 2, Hiroshi Ohmori 1, Motooki Ashihara
Supplementary Figure 1. Expression of CUGBP1 in non-parenchymal liver cells treated with TGF-β
 Supplementary Figures Supplementary Figure 1. Expression of CUGBP1 in non-parenchymal liver cells treated with TGF-β and LPS. Non-parenchymal liver cells were isolated and treated with or without TGF-β
Supplementary Figure 1. Establishment of prostacyclin-secreting hmscs. (a) PCR showed the integration of the COX-1-10aa-PGIS transgene into the
 PCR showed the integration of the COX-1-10aa-PGIS transgene into the") Supplementary Figure 1. Establishment of prostacyclin-secreting hmscs. (a) PCR showed the integration of the COX-1-10aa-PGIS transgene into the genomic DNA of hmscs (PGI2- hmscs). Native hmscs and plasmid
Supplementary Figure 1. Establishment of prostacyclin-secreting hmscs. (a) PCR showed the integration of the COX-1-10aa-PGIS transgene into the genomic DNA of hmscs (PGI2- hmscs). Native hmscs and plasmid
File Name: Supplementary Information Description: Supplementary Figures and Supplementary Tables. File Name: Peer Review File Description:
 File Name: Supplementary Information Description: Supplementary Figures and Supplementary Tables File Name: Peer Review File Description: Primer Name Sequence (5'-3') AT ( C) RT-PCR USP21 F 5'-TTCCCATGGCTCCTTCCACATGAT-3'
Supplementary Figure 1. Repression of hepcidin expression in the liver of mice treated with
 Supplementary Figure 1. Repression of hepcidin expression in the liver of mice treated with DMN Immunohistochemistry for hepcidin and H&E staining (left). qrt-pcr assays for hepcidin in the liver (right).
MicroRNA-106b Modulates Epithelial Mesenchymal Transition by Targeting TWIST1 in Invasive Endometrial Cancer Cell Lines
 MOLECULAR CARCINOGENESIS MicroRNA-106b Modulates Epithelial Mesenchymal Transition by Targeting TWIST1 in Invasive Endometrial Cancer Cell Lines Peixin Dong, 1 * Masanori Kaneuchi, 1 Hidemichi Watari,
TEB. Id4 p63 DAPI Merge. Id4 CK8 DAPI Merge
 a Duct TEB b Id4 p63 DAPI Merge Id4 CK8 DAPI Merge c d e Supplementary Figure 1. Identification of Id4-positive MECs and characterization of the Comma-D model. (a) IHC analysis of ID4 expression in the
VUmc. VU University Medical Center, Amsterdam, The Netherlands University of Pisa, Pisa, Italy
 MicroRNA-21 (mir-21) in pancreatic adenocarcinoma: correlation with clinical outcome and pharmacological aspects underlying its role in the modulation of gemcitabine activity Elisa Giovannetti, Niccola
Histone deacetylase class-i inhibition promotes epithelial gene expression in pancreatic cancer cells in a BRD4- and MYC-dependent manner
 6334 6349 Nucleic Acids Research, 2017, Vol. 45, No. 11 Published online 27 March 2017 doi: 10.1093/nar/gkx212 Histone deacetylase class-i inhibition promotes epithelial gene expression in pancreatic cancer
SSM signature genes are highly expressed in residual scar tissues after preoperative radiotherapy of rectal cancer.
 Supplementary Figure 1 SSM signature genes are highly expressed in residual scar tissues after preoperative radiotherapy of rectal cancer. Scatter plots comparing expression profiles of matched pretreatment
Nature Neuroscience: doi: /nn Supplementary Figure 1
 Supplementary Figure 1 EGFR inhibition activates signaling pathways (a-b) EGFR inhibition activates signaling pathways (a) U251EGFR cells were treated with erlotinib (1µM) for the indicated times followed
Supplementary Figure 1
 Supplementary Figure 1 14 12 SEM4C PLXN2 8 SEM4C C 3 Cancer Cell Non Cancer Cell Expression 1 8 6 6 4 log2 ratio Expression 2 1 4 2 2 p value.1 D Supplementary Figure 1. Expression of Sema4C and Plexin2
Supplementary Table S1. List of PTPRK-RSPO3 gene fusions in TCGA's colon cancer cohort. Chr. # of Gene 2. Chr. # of Gene 1
 Supplementary Tale S1. List of PTPRK-RSPO3 gene fusions in TCGA's colon cancer cohort TCGA Case ID Gene-1 Gene-2 Chr. # of Gene 1 Chr. # of Gene 2 Genomic coordiante of Gene 1 at fusion junction Genomic
a) List of KMTs targeted in the shrna screen. The official symbol, KMT designation,
 List of KMTs targeted in the shrna screen. The official symbol, KMT designation,") Supplementary Information Supplementary Figures Supplementary Figure 1. a) List of KMTs targeted in the shrna screen. The official symbol, KMT designation, gene ID and specifities are provided. Those highlighted
Supplementary Information Supplementary Figures Supplementary Figure 1. a) List of KMTs targeted in the shrna screen. The official symbol, KMT designation, gene ID and specifities are provided. Those highlighted
Supplemental Figure 1
 1 Supplemental Figure 1 Effects of DATE shortening on HGF promoter activity. The HGF promoter region (-1037 to +56) containing wild-type (30As) or truncated DATE (26As, 27As, 28A, 29As) from breast cancer
Supplementary Figure 1. Characterization of NMuMG-ErbB2 and NIC breast cancer cells expressing shrnas targeting LPP. NMuMG-ErbB2 cells (a) and NIC
 and NIC") Supplementary Figure 1. Characterization of NMuMG-ErbB2 and NIC breast cancer cells expressing shrnas targeting LPP. NMuMG-ErbB2 cells (a) and NIC cells (b) were engineered to stably express either a LucA-shRNA
Supplementary Figure 1. Characterization of NMuMG-ErbB2 and NIC breast cancer cells expressing shrnas targeting LPP. NMuMG-ErbB2 cells (a) and NIC cells (b) were engineered to stably express either a LucA-shRNA
Down-regulation of mir-23a inhibits high glucose-induced EMT and renal fibrogenesis by up-regulation of SnoN
 Human Cell (2018) 31:22 32 https://doi.org/10.1007/s13577-017-0180-z RESEARCH ARTICLE Down-regulation of mir-23a inhibits high glucose-induced EMT and renal fibrogenesis by up-regulation of SnoN Haiping
Supplementary Fig. 1 p38 MAPK negatively regulates DC differentiation. (a) Western blot analysis of p38 isoform expression in BM cells, immature DCs
 Western blot analysis of p38 isoform expression in BM cells, immature DCs") Supplementary Fig. 1 p38 MAPK negatively regulates DC differentiation. (a) Western blot analysis of p38 isoform expression in BM cells, immature DCs (idcs) and mature DCs (mdcs). A myeloma cell line expressing
Supplementary Fig. 1 p38 MAPK negatively regulates DC differentiation. (a) Western blot analysis of p38 isoform expression in BM cells, immature DCs (idcs) and mature DCs (mdcs). A myeloma cell line expressing
SUPPLEMENTARY FIGURES
 SUPPLEMENTARY FIGURES Figure S1. Clinical significance of ZNF322A overexpression in Caucasian lung cancer patients. (A) Representative immunohistochemistry images of ZNF322A protein expression in tissue
Long non coding RNA GAS5 suppresses pancreatic cancer metastasis through modulating mir 32 5p/PTEN axis
 https://doi.org/10.1186/s13578-017-0192-0 Cell & Bioscience RESEARCH Open Access Long non coding RNA GAS5 suppresses pancreatic cancer metastasis through modulating mir 32 5p/PTEN axis Zhi Qiang Gao *,