Case Studies on High Throughput Gene Expression Data Kun Huang, PhD Raghu Machiraju, PhD
|
|
|
- Marilyn Charles
- 6 years ago
- Views:
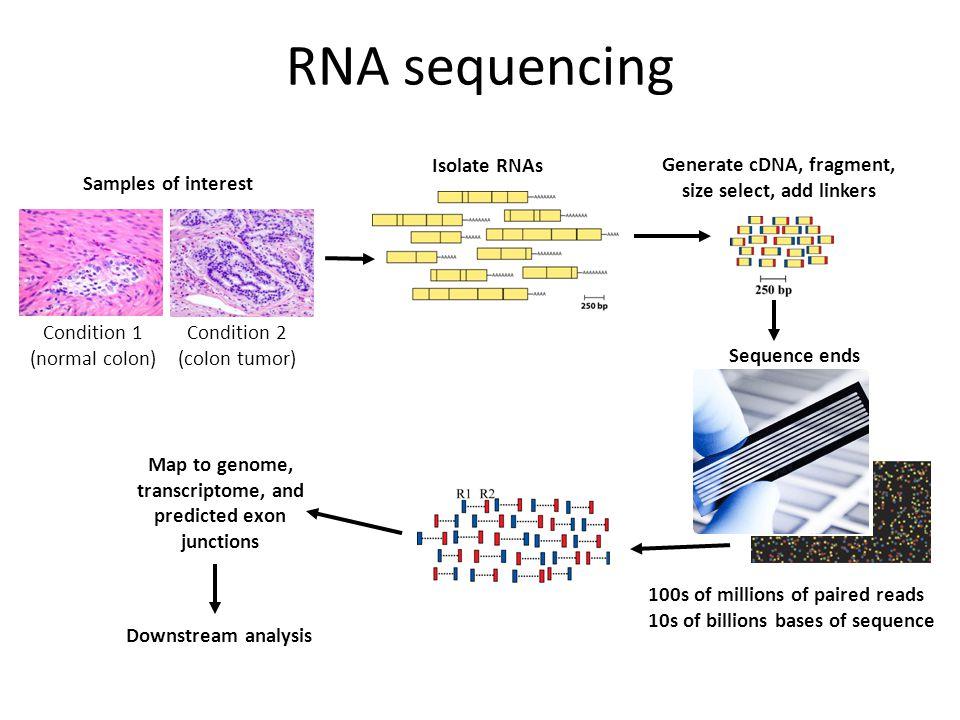
Transcription
1 Case Studies on High Throughput Gene Expression Data Kun Huang, PhD Raghu Machiraju, PhD Department of Biomedical Informatics Department of Computer Science and Engineering The Ohio State University
2 Review

3 3 Figure by Lawrence Berkeley Lab Human Genome Center, Berkeley, California, USA

4 Synopsis - Causes - dna2gr.pdf 4
5 module2012/xiaphome.html 5
6 6 Glossary html
7 Reading Assignment Chapter 2, Text 7
8 Outline What can we do with high throughput gene expression data? Profiling and comparative studies gene signatures Machine learning approaches biomarker discovery Correlation analysis gene function prediction using co-expression Network analysis network biomarkers Genomic variants the drivers (?) 8


9 Affymetrix GeneChip silicon chip oligonucleiotide probes lithographically synthesized on the array

10 How does microarray work?

11 How does microarray work?


12 Two-channel microarray Printed microarrays Long probe oligonucleotides (80-100) long are printed on the glass chip Comparative hybridization experiment
13 Reading Material Chapter 3, Text 13 13
14 Outline What can we do with high throughput gene expression data? Profiling and comparative studies Machine learning approaches biomarker discovery Correlation analysis gene function prediction using co-expression Network analysis network biomarkers 14
 Comparative analysis Clustering analysis Classification (feature selection) Enrichment analysis Pathway and network analysis Reading for")
15 Data Analysis Raw data (image) QC (artifact) Probe level data PM vs MM probes Normalization Visualization QC (MA plot, box plot, batch effect, PCA) Comparative analysis Clustering analysis Classification (feature selection) Enrichment analysis Pathway and network analysis Reading for probes

16 Hypothesis Testing Pick a dataset from GEO

17 Hypothesis Testing Two set of samples sampled from two distributions
18 New Resource
19 Outline What can we do with high throughput gene expression data? Profiling and comparative studies Machine learning approaches biomarker discovery Correlation analysis gene function prediction using co-expression Network analysis network biomarkers 19
20 A Case Study 20 20

21 Breast Cancer Prognosis Marker 21
22 Derive Prognostic Markers Gene expression microarray data for 295 breast cancer patients including 69 ER-negative ones Survival time is a major evaluation criteria for cancer treatment, thus developing prognosis markers is particularly important for cancers Full clinical information ER, PR, HERR2 status, survival status and time, metastasis status, lymph node status, etc 22

23 Unsupervised Analysis the Data Clustering 23

24 24 Gene Feature Selection

25 Supervised Analysis Test Validation 25
26 Gene Markers The 70 gene signature was later incorporated into a test called Mammaprint and is used clinically (FDA approved) for breast cancer prognosis Other clinically used gene signatures also exists such as OncoDX, PAM50 Prognosis signature is not enough for personalized treatment. Ongoing work is more and more shifted toward Predictive maker discovery (e..g, to predict drug response). 26
27 Another Case Study 27 27
28 28
29 Goal - Stratification J 29


30 PubMed Id:
31 Also publications/pub_paper.cgi? mode=view&paper_id=43 genepattern/datasets/ 31
32 The Premise Class discovery to automatically distinguish between - acute myeloid leukemia: AML - acute lymphoblastic leukemia: ALL No knowledge of these classes Genetic causes known - specific chromosomal translocations Use microarrays 32
33 The Data 38 bone marrow samples (27 ALL, 11 AML) Obtained from patients at time of diagnosis RNA from bone marrow mononuclear cells Affymetrix microarrays Probes for 6817 human genes 33
34 The Methods Schematic illustration of methodology. (a) Strategy for cancer classification. Tumor classes may be known a priori or discovered on the basis of the expression data by using Self-Organizing Maps (SOMs) as described in the text. Class Prediction involves assignment of an unknown tumor sample to the appropriate class on the basis of gene expression pattern. This consists of several steps: neighborhood analysis to assess whether there is a significant excess of genes correlated with the class distinction, selection of the informative genes and construction of a class predictor, initial evaluation of class prediction by cross-validation, and final evaluation by testing in an independent data set. 34
35 Supervised Analysis 35 Neighborhood Analysis. The class distinction is represented by an 'idealized expression pattern c, in which the expression level is uniformly high in class 1 and uniformly low in class 2. Each gene is represented by an expression vector, consisting of its expression level in each of the tumor samples. In the figure, the dataset consists of 12 samples comprised of 6 AMLs and 6 ALLs. Gene g1 is well correlated with the class distinction, while g2 is poorly correlated. Neighborhood analysis involves counting the number of genes having various levels of correlation with c. The results are compared to the corresponding distribution obtained for random idealized expression patterns c*, obtained by randomly permuting the coordinates of c. An unusually high density of genes indicates that there are many more genes correlated with the pattern than expected by chance. The precise measure of distance and other methodological details are described in notes (16,17) and on our web site.
36 Prediction The prediction of a new sample is based on 'weighted votes' of a set of informative genes. Each such gene gi votes for either AML or ALL, depending on whether its expression level x_i in the sample is closer to mu_aml or mu_all (which denote, respectively, the mean expression levels of AML and ALL in a set of reference samples). The magnitude of the vote is w_i v_i, where w_i is a weighting factor that reflects how well the gene is correlated with the class distinction and v_i = x_i - (mu_aml + mu_all)/2 reflects the deviation of the expression level in the sample from the average of mu_aml and mu_all. The votes for each class are summed to obtain total votes V_AML and V_ALL. The sample is assigned to the class with the higher vote total, provided that the prediction strength exceeds a predetermined threshold. The prediction strength reflects the margin of victory and is defined as (V_win-V_lose)/ (V_win+V_lose), where as V_win and V_lose are the respective vote totals for the winning and losing classes. Methodological details are described in the paper (notes 19,20). 36
37 Testing Prediction strengths. The scatterplots show the prediction strengths (PS) for the samples in cross-validation (left) and on the independent sample (right). Median PS is denoted by a horizontal line. Predictions with PS below 0.3 are considered as uncertain. 37

38 Results Genes distinguishing ALL from AML. The 50 genes most highly correlated with the ALL/AML class distinction are shown. Each row corresponds to a gene, with the columns corresponding to expression levels in different samples. Expression levels for each gene are normalized across the samples such that the mean is 0 and the standard deviation is 1. Expression levels greater than the mean are shaded in red, and those below the mean are shaded in blue. The scale indicates standard deviations above or below the mean. The top panel shows genes highly expressed in ALL, the bottom panel shows genes more highly expressed in AML. Note that while these genes as a group appear correlated with class, no single gene is uniformly expressed across the class, illustrating the value of a multi-gene prediction method. 38
39 Outline What can we do with high throughput gene expression data? Profiling and comparative studies Machine learning approaches biomarker discovery Correlation analysis gene function prediction using co-expression Network analysis network biomarkers 39

40 Gene Co-Expression 40
41 Gene Co-Expression Correlated gene expression profiles Both positive and negative correlation Why do genes co-express? Functional reasons? Mechanistic reasons? Genetic reasons? 41
42 Gene Co-Expression Genes co-express with multiple anchor genes Anchor genes were selected from BRCA1 pathways Goal using co-expression relationships to identify new breast cancer genes 42
 showed that certain mutation on HMMR is associated with increased breast cancer risk HMMR")
43 Gene Co-Expression HMMR was ranked highest Experimental validation sirna silencing of HMMR led to similar phenotypes in HeLa and breast cancer cells as knockout of BRCA1 multiple centrosomes GWAS study (using CGEMS data) showed that certain mutation on HMMR is associated with increased breast cancer risk HMMR sirna 43
44 Outline What can we do with high throughput gene expression data? Profiling and comparative studies Machine learning approaches biomarker discovery Correlation analysis gene function prediction using co-expression Network analysis network biomarkers 44

45 Integrative Genomics Multiple Phenotypes 45
46 Microarray Data + Protein Interaction Networks Systems approach Instead of which genes changed to which part of the network is perturbed? Network-based classification of breast cancer metastasis. (Chung et al, Mol. Sys. Bio., 2007) 46
47 47 Microarray Data + Protein Interaction Networks
48 Microarray Data + Protein Interaction Networks Defining gene network activity score Correlate the activity score with different disease conditions (e.g., metastasis vs non-metastasis) Network mining a greedy approach 48
49 Microarray Data + Protein Interaction Networks Statistical evaluation of the identified gene modules based on random permutations 49

50 Microarray Data + Protein Interaction Networks Marker reproducibility and metastasis prediction performance by European Molecular Biology Organization Han Yu Chuang et al. Mol Syst Biol 2007;3:140
51 Outline What can we do with high throughput gene expression data? Profiling and comparative studies Machine learning approaches biomarker discovery Correlation analysis gene function prediction using co-expression Network analysis network biomarkers Genomic variants the drivers 51
52 Iden%fying a causa%ve de novo muta%on Veltman and colleagues - Nat Genet Dec;42(12): Patient with idiopathic disorder (1) Sequence genome ~22,000 variants (exome re-sequencing) (2) Select only coding mutations MSGTCASTTR MSGTNASTTR ~5,640 coding variants (3) Exclude known variants seen in healthy people ~143 novel coding variants For 6/9 patients, they were able to identify a single likely-causative mutation (4) Sequence parents and exclude their private variants (5) Look at affected gene function and mutational impact ~5 de novo novel coding variants 52
53 53 53

54 DREAM 9.5 contest 54

55 55
56 Synopsis - Causes - dna2gr.pdf 56
57 The End Next Dr. Parvin s Lecture on Sequencing T 57 57
T. R. Golub, D. K. Slonim & Others 1999
 T. R. Golub, D. K. Slonim & Others 1999 Big Picture in 1999 The Need for Cancer Classification Cancer classification very important for advances in cancer treatment. Cancers of Identical grade can have
Classification of cancer profiles. ABDBM Ron Shamir
 Classification of cancer profiles 1 Background: Cancer Classification Cancer classification is central to cancer treatment; Traditional cancer classification methods: location; morphology, cytogenesis;
Gene expression analysis. Roadmap. Microarray technology: how it work Applications: what can we do with it Preprocessing: Classification Clustering
 Gene expression analysis Roadmap Microarray technology: how it work Applications: what can we do with it Preprocessing: Image processing Data normalization Classification Clustering Biclustering 1 Gene
VL Network Analysis ( ) SS2016 Week 3
 SS2016 Week 3") VL Network Analysis (19401701) SS2016 Week 3 Based on slides by J Ruan (U Texas) Tim Conrad AG Medical Bioinformatics Institut für Mathematik & Informatik, Freie Universität Berlin 1 Motivation 2 Lecture
VL Network Analysis (19401701) SS2016 Week 3 Based on slides by J Ruan (U Texas) Tim Conrad AG Medical Bioinformatics Institut für Mathematik & Informatik, Freie Universität Berlin 1 Motivation 2 Lecture
Computer Science, Biology, and Biomedical Informatics (CoSBBI) Outline. Molecular Biology of Cancer AND. Goals/Expectations. David Boone 7/1/2015
 Outline. Molecular Biology of Cancer AND. Goals/Expectations. David Boone 7/1/2015") Goals/Expectations Computer Science, Biology, and Biomedical (CoSBBI) We want to excite you about the world of computer science, biology, and biomedical informatics. Experience what it is like to be a
Goals/Expectations Computer Science, Biology, and Biomedical (CoSBBI) We want to excite you about the world of computer science, biology, and biomedical informatics. Experience what it is like to be a
Efficacy of the Extended Principal Orthogonal Decomposition Method on DNA Microarray Data in Cancer Detection
 202 4th International onference on Bioinformatics and Biomedical Technology IPBEE vol.29 (202) (202) IASIT Press, Singapore Efficacy of the Extended Principal Orthogonal Decomposition on DA Microarray
Comparison of discrimination methods for the classification of tumors using gene expression data
 Comparison of discrimination methods for the classification of tumors using gene expression data Sandrine Dudoit, Jane Fridlyand 2 and Terry Speed 2,. Mathematical Sciences Research Institute, Berkeley
Network-assisted data analysis
 Network-assisted data analysis Bing Zhang Department of Biomedical Informatics Vanderbilt University bing.zhang@vanderbilt.edu Protein identification in shotgun proteomics Protein digestion LC-MS/MS Protein
Nature Methods: doi: /nmeth.3115
 Supplementary Figure 1 Analysis of DNA methylation in a cancer cohort based on Infinium 450K data. RnBeads was used to rediscover a clinically distinct subgroup of glioblastoma patients characterized by
SubLasso:a feature selection and classification R package with a. fixed feature subset
 SubLasso:a feature selection and classification R package with a fixed feature subset Youxi Luo,3,*, Qinghan Meng,2,*, Ruiquan Ge,2, Guoqin Mai, Jikui Liu, Fengfeng Zhou,#. Shenzhen Institutes of Advanced
38 Int'l Conf. Bioinformatics and Computational Biology BIOCOMP'16
 38 Int'l Conf. Bioinformatics and Computational Biology BIOCOMP'16 PGAR: ASD Candidate Gene Prioritization System Using Expression Patterns Steven Cogill and Liangjiang Wang Department of Genetics and
Structural Variation and Medical Genomics
 Structural Variation and Medical Genomics Andrew King Department of Biomedical Informatics July 8, 2014 You already know about small scale genetic mutations Single nucleotide polymorphism (SNPs) Deletions,
An Improved Algorithm To Predict Recurrence Of Breast Cancer
 An Improved Algorithm To Predict Recurrence Of Breast Cancer Umang Agrawal 1, Ass. Prof. Ishan K Rajani 2 1 M.E Computer Engineer, Silver Oak College of Engineering & Technology, Gujarat, India. 2 Assistant
The 16th KJC Bioinformatics Symposium Integrative analysis identifies potential DNA methylation biomarkers for pan-cancer diagnosis and prognosis
 The 16th KJC Bioinformatics Symposium Integrative analysis identifies potential DNA methylation biomarkers for pan-cancer diagnosis and prognosis Tieliu Shi tlshi@bio.ecnu.edu.cn The Center for bioinformatics
Contemporary Classification of Breast Cancer
 Contemporary Classification of Breast Cancer Laura C. Collins, M.D. Vice Chair of Anatomic Pathology Professor of Pathology Beth Israel Deaconess Medical Center and Harvard Medical School Boston, MA Outline
Gene Selection for Tumor Classification Using Microarray Gene Expression Data
 Gene Selection for Tumor Classification Using Microarray Gene Expression Data K. Yendrapalli, R. Basnet, S. Mukkamala, A. H. Sung Department of Computer Science New Mexico Institute of Mining and Technology
Deep Learning Analytics for Predicting Prognosis of Acute Myeloid Leukemia with Cytogenetics, Age, and Mutations
 Deep Learning Analytics for Predicting Prognosis of Acute Myeloid Leukemia with Cytogenetics, Age, and Mutations Andy Nguyen, M.D., M.S. Medical Director, Hematopathology, Hematology and Coagulation Laboratory,
EXPression ANalyzer and DisplayER
 EXPression ANalyzer and DisplayER Tom Hait Aviv Steiner Igor Ulitsky Chaim Linhart Amos Tanay Seagull Shavit Rani Elkon Adi Maron-Katz Dorit Sagir Eyal David Roded Sharan Israel Steinfeld Yossi Shiloh
CNV PCA Search Tutorial
 CNV PCA Search Tutorial Release 8.1 Golden Helix, Inc. March 18, 2014 Contents 1. Data Preparation 2 A. Join Log Ratio Data with Phenotype Information.............................. 2 B. Activate only
Introduction to Discrimination in Microarray Data Analysis
 Introduction to Discrimination in Microarray Data Analysis Jane Fridlyand CBMB University of California, San Francisco Genentech Hall Auditorium, Mission Bay, UCSF October 23, 2004 1 Case Study: Van t
for the TCGA Breast Phenotype Research Group
 Decoding Breast Cancer with Quantitative Radiomics & Radiogenomics: Imaging Phenotypes in Breast Cancer Risk Assessment, Diagnosis, Prognosis, and Response to Therapy Maryellen Giger & Yuan Ji The University
Classifica4on. CSCI1950 Z Computa4onal Methods for Biology Lecture 18. Ben Raphael April 8, hip://cs.brown.edu/courses/csci1950 z/
 CSCI1950 Z Computa4onal Methods for Biology Lecture 18 Ben Raphael April 8, 2009 hip://cs.brown.edu/courses/csci1950 z/ Binary classifica,on Given a set of examples (x i, y i ), where y i = + 1, from unknown
Integrated Analysis of Copy Number and Gene Expression
 Integrated Analysis of Copy Number and Gene Expression Nexus Copy Number provides user-friendly interface and functionalities to integrate copy number analysis with gene expression results for the purpose
Journal: Nature Methods
 Journal: Nature Methods Article Title: Network-based stratification of tumor mutations Corresponding Author: Trey Ideker Supplementary Item Supplementary Figure 1 Supplementary Figure 2 Supplementary Figure
RNA preparation from extracted paraffin cores:
 Supplementary methods, Nielsen et al., A comparison of PAM50 intrinsic subtyping with immunohistochemistry and clinical prognostic factors in tamoxifen-treated estrogen receptor positive breast cancer.
Title: Human breast cancer associated fibroblasts exhibit subtype specific gene expression profiles
 Author's response to reviews Title: Human breast cancer associated fibroblasts exhibit subtype specific gene expression profiles Authors: Julia Tchou (julia.tchou@uphs.upenn.edu) Andrew V Kossenkov (akossenkov@wistar.org)
Cancer Informatics Lecture
 Cancer Informatics Lecture Mayo-UIUC Computational Genomics Course June 22, 2018 Krishna Rani Kalari Ph.D. Associate Professor 2017 MFMER 3702274-1 Outline The Cancer Genome Atlas (TCGA) Genomic Data Commons
National Surgical Adjuvant Breast and Bowel Project (NSABP) Foundation Annual Progress Report: 2009 Formula Grant
 Foundation Annual Progress Report: 2009 Formula Grant") National Surgical Adjuvant Breast and Bowel Project (NSABP) Foundation Annual Progress Report: 2009 Formula Grant Reporting Period July 1, 2011 June 30, 2012 Formula Grant Overview The National Surgical
National Surgical Adjuvant Breast and Bowel Project (NSABP) Foundation Annual Progress Report: 2009 Formula Grant Reporting Period July 1, 2011 June 30, 2012 Formula Grant Overview The National Surgical
A COMBINATORY ALGORITHM OF UNIVARIATE AND MULTIVARIATE GENE SELECTION
 5-9 JATIT. All rights reserved. A COMBINATORY ALGORITHM OF UNIVARIATE AND MULTIVARIATE GENE SELECTION 1 H. Mahmoodian, M. Hamiruce Marhaban, 3 R. A. Rahim, R. Rosli, 5 M. Iqbal Saripan 1 PhD student, Department
MammaPrint, the story of the 70-gene profile
 MammaPrint, the story of the 70-gene profile René Bernards Professor of Molecular Carcinogenesis The Netherlands Cancer Institute Amsterdam Chief Scientific Officer Agendia Amsterdam The breast cancer
Defining Actionable Novel Discoveries, Annotating Genomes, and Reanalysis in Cancer A Laboratory Perspective
 Integrating Large-Scale Genomic Information into Clinical Practice: A Workshop Defining Actionable Novel Discoveries, Annotating Genomes, and Reanalysis in Cancer A Laboratory Perspective Federico A. Monzon
Statistical Analysis of Biomarker Data
 Statistical Analysis of Biomarker Data Gary M. Clark, Ph.D. Vice President Biostatistics & Data Management Array BioPharma Inc. Boulder, CO NCIC Clinical Trials Group New Investigator Clinical Trials Course
Nature Neuroscience: doi: /nn Supplementary Figure 1
 Supplementary Figure 1 Illustration of the working of network-based SVM to confidently predict a new (and now confirmed) ASD gene. Gene CTNND2 s brain network neighborhood that enabled its prediction by
Identifying Thyroid Carcinoma Subtypes and Outcomes through Gene Expression Data Kun-Hsing Yu, Wei Wang, Chung-Yu Wang
 Identifying Thyroid Carcinoma Subtypes and Outcomes through Gene Expression Data Kun-Hsing Yu, Wei Wang, Chung-Yu Wang Abstract: Unlike most cancers, thyroid cancer has an everincreasing incidence rate
Nature Genetics: doi: /ng Supplementary Figure 1. SEER data for male and female cancer incidence from
 Supplementary Figure 1 SEER data for male and female cancer incidence from 1975 2013. (a,b) Incidence rates of oral cavity and pharynx cancer (a) and leukemia (b) are plotted, grouped by males (blue),
SUPPLEMENTARY INFORMATION
 doi:10.1038/nature10866 a b 1 2 3 4 5 6 7 Match No Match 1 2 3 4 5 6 7 Turcan et al. Supplementary Fig.1 Concepts mapping H3K27 targets in EF CBX8 targets in EF H3K27 targets in ES SUZ12 targets in ES
Genetic alterations of histone lysine methyltransferases and their significance in breast cancer
 Genetic alterations of histone lysine methyltransferases and their significance in breast cancer Supplementary Materials and Methods Phylogenetic tree of the HMT superfamily The phylogeny outlined in the
Figure S2. Distribution of acgh probes on all ten chromosomes of the RIL M0022
 96 APPENDIX B. Supporting Information for chapter 4 "changes in genome content generated via segregation of non-allelic homologs" Figure S1. Potential de novo CNV probes and sizes of apparently de novo
FISH mcgh Karyotyping ISH RT-PCR. Expression arrays RNA. Tissue microarrays Protein arrays MS. Protein IHC
 Classification of Breast Cancer in the Molecular Era Susan J. Done University Health Network, Toronto Why classify? Prognosis Prediction of response to therapy Pathogenesis Invasive breast cancer can have
Using CART to Mine SELDI ProteinChip Data for Biomarkers and Disease Stratification
 Using CART to Mine SELDI ProteinChip Data for Biomarkers and Disease Stratification Kenna Mawk, D.V.M. Informatics Product Manager Ciphergen Biosystems, Inc. Outline Introduction to ProteinChip Technology
Cancer outlier differential gene expression detection
 Biostatistics (2007), 8, 3, pp. 566 575 doi:10.1093/biostatistics/kxl029 Advance Access publication on October 4, 2006 Cancer outlier differential gene expression detection BAOLIN WU Division of Biostatistics,
Comparison of Gene Set Analysis with Various Score Transformations to Test the Significance of Sets of Genes
 Comparison of Gene Set Analysis with Various Score Transformations to Test the Significance of Sets of Genes Ivan Arreola and Dr. David Han Department of Management of Science and Statistics, University
Data analysis in microarray experiment
 16 1 004 Chinese Bulletin of Life Sciences Vol. 16, No. 1 Feb., 004 1004-0374 (004) 01-0041-08 100005 Q33 A Data analysis in microarray experiment YANG Chang, FANG Fu-De * (National Laboratory of Medical
Evaluation of public cancer datasets and signatures identifies TP53 mutant signatures with robust prognostic and predictive value
 Lehmann et al. BMC Cancer (2015) 15:179 DOI 10.1186/s12885-015-1102-7 RESEARCH ARTICLE Open Access Evaluation of public cancer datasets and signatures identifies TP53 mutant signatures with robust prognostic
SUPPLEMENTARY INFORMATION
 doi:.38/nature8975 SUPPLEMENTAL TEXT Unique association of HOTAIR with patient outcome To determine whether the expression of other HOX lincrnas in addition to HOTAIR can predict patient outcome, we measured
Quantitative Biology Lecture 1 (Introduction + Probability)
") 21 st Sep 2015 Quantitative Biology Lecture 1 (Introduction + Probability) Gurinder Singh Mickey Atwal Center for Quantitative Biology Why Quantitative Biology? (1. Models) Galileo Galilei The Book of
21 st Sep 2015 Quantitative Biology Lecture 1 (Introduction + Probability) Gurinder Singh Mickey Atwal Center for Quantitative Biology Why Quantitative Biology? (1. Models) Galileo Galilei The Book of
SUPPLEMENTARY APPENDIX
 SUPPLEMENTARY APPENDIX 1) Supplemental Figure 1. Histopathologic Characteristics of the Tumors in the Discovery Cohort 2) Supplemental Figure 2. Incorporation of Normal Epidermal Melanocytic Signature
UNIVERSITI TEKNOLOGI MARA COPY NUMBER VARIATIONS OF ORANG ASLI (NEGRITO) FROM PENINSULAR MALAYSIA
 FROM PENINSULAR MALAYSIA") UNIVERSITI TEKNOLOGI MARA COPY NUMBER VARIATIONS OF ORANG ASLI (NEGRITO) FROM PENINSULAR MALAYSIA SITI SHUHADA MOKHTAR Thesis submitted in fulfillment of the requirements for the degree of Master of Science
UNIVERSITI TEKNOLOGI MARA COPY NUMBER VARIATIONS OF ORANG ASLI (NEGRITO) FROM PENINSULAR MALAYSIA SITI SHUHADA MOKHTAR Thesis submitted in fulfillment of the requirements for the degree of Master of Science
Predicting clinical outcomes in neuroblastoma with genomic data integration
 Predicting clinical outcomes in neuroblastoma with genomic data integration Ilyes Baali, 1 Alp Emre Acar 1, Tunde Aderinwale 2, Saber HafezQorani 3, Hilal Kazan 4 1 Department of Electric-Electronics Engineering,
Figure S1. Analysis of endo-sirna targets in different microarray datasets. The
 Supplemental Figures: Figure S1. Analysis of endo-sirna targets in different microarray datasets. The percentage of each array dataset that were predicted endo-sirna targets according to the Ambros dataset
Single SNP/Gene Analysis. Typical Results of GWAS Analysis (Single SNP Approach) Typical Results of GWAS Analysis (Single SNP Approach)
 Typical Results of GWAS Analysis (Single SNP Approach)") High-Throughput Sequencing Course Gene-Set Analysis Biostatistics and Bioinformatics Summer 28 Section Introduction What is Gene Set Analysis? Many names for gene set analysis: Pathway analysis Gene set
High-Throughput Sequencing Course Gene-Set Analysis Biostatistics and Bioinformatics Summer 28 Section Introduction What is Gene Set Analysis? Many names for gene set analysis: Pathway analysis Gene set
Multigene Testing in NCCN Breast Cancer Treatment Guidelines, v1.2011
 Multigene Testing in NCCN Breast Cancer Treatment Guidelines, v1.2011 Robert W. Carlson, M.D. Professor of Medicine Stanford University Chair, NCCN Breast Cancer Treatment Guidelines Panel Selection of
Supplementary Figures
 Supplementary Figures Supplementary Figure 1. Pan-cancer analysis of global and local DNA methylation variation a) Variations in global DNA methylation are shown as measured by averaging the genome-wide
Breast cancer. Risk factors you cannot change include: Treatment Plan Selection. Inferring Transcriptional Module from Breast Cancer Profile Data
 Breast cancer Inferring Transcriptional Module from Breast Cancer Profile Data Breast Cancer and Targeted Therapy Microarray Profile Data Inferring Transcriptional Module Methods CSC 177 Data Warehousing
Supplementary information for: Human micrornas co-silence in well-separated groups and have different essentialities
 Supplementary information for: Human micrornas co-silence in well-separated groups and have different essentialities Gábor Boross,2, Katalin Orosz,2 and Illés J. Farkas 2, Department of Biological Physics,
Expert-guided Visual Exploration (EVE) for patient stratification. Hamid Bolouri, Lue-Ping Zhao, Eric C. Holland
 for patient stratification. Hamid Bolouri, Lue-Ping Zhao, Eric C. Holland") Expert-guided Visual Exploration (EVE) for patient stratification Hamid Bolouri, Lue-Ping Zhao, Eric C. Holland Oncoscape.sttrcancer.org Paul Lisa Ken Jenny Desert Eric The challenge Given - patient clinical
Expert-guided Visual Exploration (EVE) for patient stratification Hamid Bolouri, Lue-Ping Zhao, Eric C. Holland Oncoscape.sttrcancer.org Paul Lisa Ken Jenny Desert Eric The challenge Given - patient clinical
Comparison of Triple Negative Breast Cancer between Asian and Western Data Sets
 2010 IEEE International Conference on Bioinformatics and Biomedicine Workshops Comparison of Triple Negative Breast Cancer between Asian and Western Data Sets Lee H. Chen Bioinformatics and Biostatistics
Nature Genetics: doi: /ng Supplementary Figure 1. PCA for ancestry in SNV data.
 Supplementary Figure 1 PCA for ancestry in SNV data. (a) EIGENSTRAT principal-component analysis (PCA) of SNV genotype data on all samples. (b) PCA of only proband SNV genotype data. (c) PCA of SNV genotype
Supplementary note: Comparison of deletion variants identified in this study and four earlier studies
 Supplementary note: Comparison of deletion variants identified in this study and four earlier studies Here we compare the results of this study to potentially overlapping results from four earlier studies
Canadian College of Medical Geneticists (CCMG) Cytogenetics Examination. May 4, 2010
 Cytogenetics Examination. May 4, 2010") Canadian College of Medical Geneticists (CCMG) Cytogenetics Examination May 4, 2010 Examination Length = 3 hours Total Marks = 100 (7 questions) Total Pages = 8 (including cover sheet and 2 pages of prints)
Canadian College of Medical Geneticists (CCMG) Cytogenetics Examination May 4, 2010 Examination Length = 3 hours Total Marks = 100 (7 questions) Total Pages = 8 (including cover sheet and 2 pages of prints)
MicroRNA expression profiling and functional analysis in prostate cancer. Marco Folini s.c. Ricerca Traslazionale DOSL
 MicroRNA expression profiling and functional analysis in prostate cancer Marco Folini s.c. Ricerca Traslazionale DOSL What are micrornas? For almost three decades, the alteration of protein-coding genes
Nature Genetics: doi: /ng Supplementary Figure 1
 Supplementary Figure 1 Expression deviation of the genes mapped to gene-wise recurrent mutations in the TCGA breast cancer cohort (top) and the TCGA lung cancer cohort (bottom). For each gene (each pair
SSM signature genes are highly expressed in residual scar tissues after preoperative radiotherapy of rectal cancer.
 Supplementary Figure 1 SSM signature genes are highly expressed in residual scar tissues after preoperative radiotherapy of rectal cancer. Scatter plots comparing expression profiles of matched pretreatment
The Tail Rank Test. Kevin R. Coombes. July 20, Performing the Tail Rank Test Which genes are significant?... 3
 The Tail Rank Test Kevin R. Coombes July 20, 2009 Contents 1 Introduction 1 2 Getting Started 1 3 Performing the Tail Rank Test 2 3.1 Which genes are significant?..................... 3 4 Power Computations
Mutational Impact on Diagnostic and Prognostic Evaluation of MDS
 Mutational Impact on Diagnostic and Prognostic Evaluation of MDS Elsa Bernard, PhD Papaemmanuil Lab, Computational Oncology, MSKCC MDS Foundation ASH 2018 Symposium Disclosure Research funds provided by
Aspects of Statistical Modelling & Data Analysis in Gene Expression Genomics. Mike West Duke University
 Aspects of Statistical Modelling & Data Analysis in Gene Expression Genomics Mike West Duke University Papers, software, many links: www.isds.duke.edu/~mw ABS04 web site: Lecture slides, stats notes, papers,
Award Number: W81XWH TITLE: Characterizing an EMT Signature in Breast Cancer. PRINCIPAL INVESTIGATOR: Melanie C.
 AD Award Number: W81XWH-08-1-0306 TITLE: Characterizing an EMT Signature in Breast Cancer PRINCIPAL INVESTIGATOR: Melanie C. Bocanegra CONTRACTING ORGANIZATION: Leland Stanford Junior University Stanford,
Molecular Methods in the Diagnosis and Prognostication of Melanoma: Pros & Cons
 Molecular Methods in the Diagnosis and Prognostication of Melanoma: Pros & Cons Ben J. Friedman, MD Senior Staff Physician Department of Dermatology Department of Pathology and Laboratory Medicine Henry
Wen et al. (1998) PNAS, 95:
 PNAS, 95:") Large-scale temporal gene expression mapping of central nervous system development Fluctuations in mrna expression of 2 genes during rat central nervous system development, focusing on the cervical spinal
Large-scale temporal gene expression mapping of central nervous system development Fluctuations in mrna expression of 2 genes during rat central nervous system development, focusing on the cervical spinal
Airway epithelial gene expression in the diagnostic evaluation of smokers with suspect lung cancer
 Airway epithelial gene expression in the diagnostic evaluation of smokers with suspect lung cancer Avrum Spira, Jennifer E Beane, Vishal Shah, Katrina Steiling, Gang Liu, Frank Schembri, Sean Gilman, Yves-Martine
Breast cancer classification: beyond the intrinsic molecular subtypes
 Breast cancer classification: beyond the intrinsic molecular subtypes Britta Weigelt, PhD Signal Transduction Laboratory CRUK London Research Institute Summary Breast cancer heterogeneity Molecular classification
Computational Identification and Prediction of Tissue-Specific Alternative Splicing in H. Sapiens. Eric Van Nostrand CS229 Final Project
 Computational Identification and Prediction of Tissue-Specific Alternative Splicing in H. Sapiens. Eric Van Nostrand CS229 Final Project Introduction RNA splicing is a critical step in eukaryotic gene
Genomics in the Clinical Practice - Today and Tomorrow
 Genomics in the Clinical Practice - Today and Tomorrow Pier Giuseppe Pelicci, MD-PhD Director of Research, IEO, Milan Professor of Pathology, University of Milan Workshop on Processing of Genomic Information:
Probability-Based Protein Identification for Post-Translational Modifications and Amino Acid Variants Using Peptide Mass Fingerprint Data
 Probability-Based Protein Identification for Post-Translational Modifications and Amino Acid Variants Using Peptide Mass Fingerprint Data Tong WW, McComb ME, Perlman DH, Huang H, O Connor PB, Costello
Chapter 1. Introduction
 Chapter 1 Introduction 1.1 Motivation and Goals The increasing availability and decreasing cost of high-throughput (HT) technologies coupled with the availability of computational tools and data form a
1.5. Research Areas Treatment Selection
 1.5. Research Areas Cancer biomarker research embraces many areas of study, including tumorigenesis, metastasis, clinical trial and surrogate endpoints, cell isolation, target identification, drug resistance,
5/2/18. After this class students should be able to: Stephanie Moon, Ph.D. - GWAS. How do we distinguish Mendelian from non-mendelian traits?
 corebio II - genetics: WED 25 April 2018. 2018 Stephanie Moon, Ph.D. - GWAS After this class students should be able to: 1. Compare and contrast methods used to discover the genetic basis of traits or
User Guide. Association analysis. Input
 User Guide TFEA.ChIP is a tool to estimate transcription factor enrichment in a set of differentially expressed genes using data from ChIP-Seq experiments performed in different tissues and conditions.
Nature Genetics: doi: /ng Supplementary Figure 1. Somatic coding mutations identified by WES/WGS for 83 ATL cases.
 Supplementary Figure 1 Somatic coding mutations identified by WES/WGS for 83 ATL cases. (a) The percentage of targeted bases covered by at least 2, 10, 20 and 30 sequencing reads (top) and average read
Detection of copy number variations in PCR-enriched targeted sequencing data
 Detection of copy number variations in PCR-enriched targeted sequencing data German Demidov Parseq Lab, Saint-Petersburg University of Russian Academy of Sciences, current: Center for Genomic Regulation
MODEL-BASED CLUSTERING IN GENE EXPRESSION MICROARRAYS: AN APPLICATION TO BREAST CANCER DATA
 International Journal of Software Engineering and Knowledge Engineering Vol. 13, No. 6 (2003) 579 592 c World Scientific Publishing Company MODEL-BASED CLUSTERING IN GENE EXPRESSION MICROARRAYS: AN APPLICATION
micrornas (mirna) and Biomarkers
 and Biomarkers") micrornas (mirna) and Biomarkers Small RNAs Make Big Splash mirnas & Genome Function Biomarkers in Cancer Future Prospects Javed Khan M.D. National Cancer Institute EORTC-NCI-ASCO November 2007 The Human
micrornas (mirna) and Biomarkers Small RNAs Make Big Splash mirnas & Genome Function Biomarkers in Cancer Future Prospects Javed Khan M.D. National Cancer Institute EORTC-NCI-ASCO November 2007 The Human
Module 3: Pathway and Drug Development
 Module 3: Pathway and Drug Development Table of Contents 1.1 Getting Started... 6 1.2 Identifying a Dasatinib sensitive cancer signature... 7 1.2.1 Identifying and validating a Dasatinib Signature... 7
MOST: detecting cancer differential gene expression
 Biostatistics (2008), 9, 3, pp. 411 418 doi:10.1093/biostatistics/kxm042 Advance Access publication on November 29, 2007 MOST: detecting cancer differential gene expression HENG LIAN Division of Mathematical
CS2220 Introduction to Computational Biology
 CS2220 Introduction to Computational Biology WEEK 8: GENOME-WIDE ASSOCIATION STUDIES (GWAS) 1 Dr. Mengling FENG Institute for Infocomm Research Massachusetts Institute of Technology mfeng@mit.edu PLANS
Hybridized KNN and SVM for gene expression data classification
 Mei, et al, Hybridized KNN and SVM for gene expression data classification Hybridized KNN and SVM for gene expression data classification Zhen Mei, Qi Shen *, Baoxian Ye Chemistry Department, Zhengzhou
Corporate Medical Policy
 Corporate Medical Policy Microarray-based Gene Expression Testing for Cancers of Unknown File Name: Origination: Last CAP Review: Next CAP Review: Last Review: microarray-based_gene_expression_testing_for_cancers_of_unknown_primary
International Journal of Computer Science Trends and Technology (IJCST) Volume 5 Issue 1, Jan Feb 2017
 Volume 5 Issue 1, Jan Feb 2017") RESEARCH ARTICLE Classification of Cancer Dataset in Data Mining Algorithms Using R Tool P.Dhivyapriya [1], Dr.S.Sivakumar [2] Research Scholar [1], Assistant professor [2] Department of Computer Science
RESEARCH ARTICLE Classification of Cancer Dataset in Data Mining Algorithms Using R Tool P.Dhivyapriya [1], Dr.S.Sivakumar [2] Research Scholar [1], Assistant professor [2] Department of Computer Science
Models of cell signalling uncover molecular mechanisms of high-risk neuroblastoma and predict outcome
 Models of cell signalling uncover molecular mechanisms of high-risk neuroblastoma and predict outcome Marta R. Hidalgo 1, Alicia Amadoz 2, Cankut Çubuk 1, José Carbonell-Caballero 2 and Joaquín Dopazo
Digitizing the Proteomes From Big Tissue Biobanks
 Digitizing the Proteomes From Big Tissue Biobanks Analyzing 24 Proteomes Per Day by Microflow SWATH Acquisition and Spectronaut Pulsar Analysis Jan Muntel 1, Nick Morrice 2, Roland M. Bruderer 1, Lukas
Implementation of nation-wide molecular testing in oncology in the French Health care system : quality assurance issues & challenges
 Implementation of nation-wide molecular testing in oncology in the French Health care system : quality assurance issues & challenges Frédérique Nowak - 21 october 2015 "Putting Science into Standards event:
Cross-Study Projections of Genomic Biomarkers: An Evaluation in Cancer Genomics
 of Genomic Biomarkers: An Evaluation in Cancer Genomics Joseph E. Lucas 1 *, Carlos M. Carvalho 2, Julia Ling-Yu Chen 1, Jen-Tsan Chi 1, Mike West 3 1 Institute for Genome Sciences and Policy, Duke University,
ncounter Assay Automated Process Immobilize and align reporter for image collecting and barcode counting ncounter Prep Station
 ncounter Assay ncounter Prep Station Automated Process Hybridize Reporter to RNA Remove excess reporters Bind reporter to surface Immobilize and align reporter Image surface Count codes Immobilize and
IN SPITE of a very quick development of medicine within
 INTL JOURNAL OF ELECTRONICS AND TELECOMMUNICATIONS, 21, VOL. 6, NO. 3, PP. 281-286 Manuscript received July 1, 21: revised September, 21. DOI: 1.2478/v1177-1-37-9 Application of Density Based Clustering
SUPPLEMENTARY INFORMATION
 DOI: 1.138/ncb3355 a S1A8 + cells/ total.1.8.6.4.2 b S1A8/?-Actin c % T-cell proliferation 3 25 2 15 1 5 T cells Supplementary Figure 1 Inter-tumoral heterogeneity of MDSC accumulation in mammary tumor
MammaPrint Improving treatment decisions in breast cancer Support and Involvement of EU
 MammaPrint Improving treatment decisions in breast cancer Support and Involvement of EU 1 Bas van der Baan VP Clinical Affairs Irvine, California Amsterdam, The Netherlands 2 Two Crucial Questions in Cancer
CHAPTER 6. Conclusions and Perspectives
 CHAPTER 6 Conclusions and Perspectives In Chapter 2 of this thesis, similarities and differences among members of (mainly MZ) twin families in their blood plasma lipidomics profiles were investigated.
Supplementary Figure 1: Comparison of acgh-based and expression-based CNA analysis of tumors from breast cancer GEMMs.
 Supplementary Figure 1: Comparison of acgh-based and expression-based CNA analysis of tumors from breast cancer GEMMs. (a) CNA analysis of expression microarray data obtained from 15 tumors in the SV40Tag
Van test naar diagnose naar
 Van test naar diagnose naar V therapie op maat Marjolein Kriek, LUMC Joris Veltman, RUNMC Exome diagnostics in genetically heterogeneous disease Joris Veltman, PhD Department of Human Genetics Radboud
ACE ImmunoID Biomarker Discovery Solutions ACE ImmunoID Platform for Tumor Immunogenomics
 ACE ImmunoID Biomarker Discovery Solutions ACE ImmunoID Platform for Tumor Immunogenomics Precision Genomics for Immuno-Oncology Personalis, Inc. ACE ImmunoID When one biomarker doesn t tell the whole