UC San Diego UC San Diego Electronic Theses and Dissertations
|
|
|
- Julianna Smith
- 6 years ago
- Views:
Transcription
1 UC San Diego UC San Diego Electronic Theses and Dissertations Title The interferon pathway attenuates acute myeloid leukemia development Permalink Author Lewin, Benjamin L. Publication Date Peer reviewed Thesis/dissertation escholarship.org Powered by the California Digital Library University of California
2 UNIVERSITY OF CALIFORNIA, SAN DIEGO The Interferon Pathway Attenuates Acute Myeloid Leukemia Development A thesis submitted in partial satisfaction of the requirements for the degree Master of Science in Biology by Benjamin L Lewin Committee in charge Dong-Er Zhang, Chair Michael David Aaron Coleman 2012
3 Copyright Benjamin L Lewin, 2012 All rights reserved.
4 The thesis of Benjamin L Lewin is approved, and it is acceptable in quality and form for publication on microfilm and electronically: University of California, San Diego 2012 Chair iii
5 I dedicate this thesis to my friends and family for their love and support. iv
6 Table of Contents Signature Page....iii Dedication....iv Table of Contents.v List of Figures..vi Acknowledgements vii Abstract...viii I. Introduction...1 II. III. IV. Results..8 Discussion..39 Materials and Methods.45 References.50 v
7 List of Figures Figure 1. AE expression induces a stronger IFN response than AE9a in U937T cell line...19 Figure 2. Figure 3. AE and IFN decrease cell proliferation..23 AE expression induces a stronger IFN response than AE9a in mouse bone marrow cells and the IFN response is partially lost in cells that are Ifnar1 KO Figure 4. Proliferation and self-renewal ability of MIP-AE and MIP-AE9a infected bone marrow cells is inhibited by IFN and loss of Ifnar Figure 5. Mouse recipients of Ifnar1 KO AE9a infected fetal liver cells experience rapid leukemogenesis Figure 6. Comparison of C57BL/6 WT and Ifnar1 KO leukemic mice...34 vi
8 Acknowledgements I would like to thank Dr. Zhang for the opportunity to join her lab and pairing me with Russ DeKelver. Russ has been a great mentor and friend during my entire time in the Zhang lab. I would also like to thank the entire Zhang lab for their selfless help with my project. vii
9 ABSTRACT OF THE THESIS The Interferon Pathway Attenuates Acute Myeloid Leukemia Development by Benjamin L Lewin Master of Science in Biology University of California, San Diego, 2012 Professor Dong-Er Zhang, Chair The fusion protein AML1-ETO is generated from the translocation t(8;21)(q22;q22) and is identified in over 12% of normal acute myeloid leukemia cases. While AML1-ETO does not induce acute myeloid leukemia in the murine retroviral transduction model, a spliced isoform, AML1-ETO9a, is able to induce viii
10 acute myeloid leukemia. One difference between AML1-ETO and AML1-ETO9a is the ability of AML1-ETO to induce an interferon response to a greater degree than AML1-ETO9a. Here I verify that interferons and interferon stimulated genes are transcribed to a greater degree in the presence of AE than AE9a in the U937T cell lines. I also show that AE expression and universal interferon treatment inhibit proliferation in the U937T cell line. Next I verify in mouse bone marrow cells that AE induces interferon stimulated genes more effectively than AE9a. In addition, the induction of interferon stimulated genes is greater in bone marrow cells of C57BL/6 wild type mice than interferon receptor knockout mice. I also show that both global interferon treatment and loss of interferon receptor lead to decreases in proliferation and self-renewal ability. Finally I show that lethally irradiated mice treated with AE9a transduced fetal liver cells from mice without interferon receptor experience enhanced acute myeloid leukemia development compared to mice receiving AE9a transduced fetal liver cells from wild type mice. I also show that similar spleen and liver mass, and leukocyte composition is observed in leukemic mice regardless of the genotype of the donor fetal liver cells. ix
11 I Introduction 1
12 2 Acute myeloid leukemia abnormalities Acute myeloid leukemia (AML) is a disease characterized by leukocyte abnormalities such as excessive proliferation and poor differentiation oftentimes due to chromosomal anomalies. 1 In fact, chromosomal translocation abnormalities can be identified in more than half of all AML cases but difficulty in identifying these abnormalities has contributed to the poor 25% five year survival rate. 1,2 A common chromosomal translocation in AML is the 8q22;21q22 (t8;21). 3 The t8;21 translocation is associated with up to 12% of normal AML cases and 40% of the subtype M2 AML cases of the French-American-British (FAB) classification, a subtype associated with maturation of the granulocytic family of white blood cells. 4 Characteristics of the t(8;21) related AML The t(8;21) translocation involves the acute myeloid leukemia 1 (AML1) gene on chromosome 21 and the eight-twenty one (ETO) gene on chromosome 8 to generate the fusion gene AML1-ETO (AE). 4 The AE gene contains the 5 portion of the AML1 gene along most of the coding region from ETO and encodes for a 752 amino acid protein. 5 The AML1 portion of the AE fusion protein consists of the DNA-binding runt homology domain (RHD) while the ETO portion contains four Nervy homologous regions (NHR1-4). AML1 is also known as core binding factor-α (CBFα) and forms a heterodimer with core binding factor-β (CBFβ) to transcriptionally activate AML1 target genes, such as the T- cell receptors (TCRs), granulocyte-macrophage colony stimulating factor (GM-
13 3 CSF) and p14 ARF. 6,7 All of these genes have AML1 binding sites in their promoter or in a distal enhancer. Other binding partners of AML1 include factors such as transcription factor PU.1 (PU.1) and core binding factor protein (C/EBPα). The ETO portion of the fusion protein does not bind DNA but it has been thought to be a global gene repressor through interactions with histone deacetylases (HDACs), histone methyltransferases and DNA methyltransferases. Through its NHR domains, ETO recruits certain co-repressors, such as nuclear receptor corepressor (NCoR) and thyroid hormone receptor (SMRT), which in turn recruit HDACs to decrease overall gene expression. 6 In addition to utilizing HDACs, AE has also been thought to silence genes by recruiting DNA methyltransferases (DNMT) since DNMT inhibitors, such as 5-aza-2 -deoxycytidine, helps restore AML1 target gene transcription. 8 DNA histone transferases such as protein arginine methyltransferase 1 (PRMT1) have also been identified in cells expressing leukemic isoforms of AE. 9 An alternatively spliced isoform of AE An alternatively spliced isoform of the AE transcript, AML1-ETO (AE9a), encodes for a 575 amino acid protein. 5 AE9a differs from AE because its protein product is truncated at the C-terminus and contains an extra ETO exon named 9a. The exon 9a encodes for an early stop causing translational termination after exon 8, leaving exons 9, 10 and 11 untranslated. This results in the loss of the two domains, NHR3 and NHR4, from the ETO portion of AE in AE9a.
14 4 Functions of AML1-ETO and AML1-ETO9a The AE fusion protein represses expression of AML1 target genes since the RHD domain of AML1 allows for DNA binding of AML1 target genes and the ETO portion of the fusion gene represses expression of the AML1 target genes by recruiting HDACs and other repressors. Some of the notable genes repressed by AE are TCR, GM-CSF and p14 ARF. 7 GM-CSF is an important factor for myeloid cell development and has recently been shown to be important in AE induced leukemia. 10 The factor p14 ARF is a tumor suppressor and has been shown to be directly inhibited by AE at the transcription level. 7 In addition to decreasing expression of AML1 target genes, AE is able to decrease expression of transcription factors via binding of the RHD domain. Factors such as CBEPα and PU.1 have been identified as transcriptional regulators with decreased activity due to AE interactions. 11,12 AE inhibits the antiproliferative transcription factor CEBPα at its promoter, leading to a block in neutrophil differentiation suggesting a role in leukemogenesis. 13 AE also inhibits the transactivation activity of the transcription factor PU.1 essential for myeloid differentiation in the murine model. 12 Taken together these data suggest AE has serious effects upon genes associated with hematopoiesis and tumor development, ultimately contributing to leukemogenesis. AE expression also leads to an overall decrease in cell number by inhibiting cell division and promoting apoptosis. 14,15 A decrease in cell number is inconsistent with the excessive leukocyte proliferation observed in AML development. However, blocked differentiation of myeloid, lymphoid and
15 5 erythroid lines in established and primary cell lines expressing the AE protein, suggests a role in leukemogenesis. 14,15 The AE gene affects gene expression and cell proliferation, but the AE fusion protein alone is not enough to lead to leukemia development. 5 Though AE is unable to induce AML in the murine retroviral transduction-transplantation model, AE9a is able to induce leukemia in this murine model The interferon pathway Interferons (IFNs) are a class of cytokines first described by Isaac and Lindenmann in 1957 and are important in the function of the human immune system. 16 There are three types of IFNs; IFN type I, type III and type III. The type I IFNs consist of IFN-α and IFN-β. 17 The type I IFNs signal through the receptor Ifnar11/2 to yield their antiviral, antiproliferative and apoptotic effects. 18 This signal is then passed on through a Janus-kinase STAT pathway to have an effect upon gene expression in the nucleus. The type II IFNs are made up of only IFN-γ and this type of IFN exhibits antiviral activity by acting as an immunomodulatory cytokine and signals through the receptor IFNGR1/2. The third group of interferons consists of interleukins (signaling molecules which promote differentiation of both lymphoid and myeloid cells) such as IL-29, IL-28A and IL- 28B. 19 The type III interferons also function to protect cells against virus replication through the IL-10 receptor and the Il-28 receptor. The type I interferons were previously used as a drug to treat AML because of their antiproliferative and immunomodulatory activities. IFN-α has
16 6 been shown to be an antineoplastic agent while treating several solid and hematological malignancies. 20 IFN-α has also been shown to be active in treatment of chronic myeloid leukemia (CML), a condition closely related to AML. 21 IFN-α has been used in the clinical setting as a treatment to AML with varying degrees of success. Studies have analyzed methods of IFN-α treatment to AML patients and suggest that continuous delivery of IFN-α is critical to successful treatment. 22 IFN- α treatment of AML remains an attractive alternative due to the poor effectiveness and relatively toxic properties of current AML treatments. Role of AE, AE9a and IFN in leukemogenesis While published and unpublished microarray data from the Zhang lab at University of California San Diego and from the Speck lab at University of Pennsylvania suggest that in established human blood cell lines, AE causes greater expression of ISGs than AE9a. 23,24 It has already been shown that AE9a can induce AML in the mouse model while AE is unable to do so, but the mechanism of AE9a induced AML remains a mystery. It is possible that AE induces an IFN response which attenuates murine AML while AE9a fails to induce a strong enough IFN response to combat murine AML. It is important to test if expression of IFNs and ISGs can play a role in preventing the leukemic phenotype in primary cell lines, established cell lines and in mice. While microarray data has shown increased levels of IFN and IFN inducible genes, these results have to be first confirmed by RT-qPCR. We will
17 7 use the human blood cell line U937T along with U937T-AE and U937-AE9a with tetracycline inducible promoters. Upon induction of AE and AE9a, we will compare expression of IFN-α, IFN-β and ISGs such as (ISG15 ubiquitin-like modifier) ISG15, (Interferon regulatory factor 7) IRF7, (Interferon induced protein 44) IFI44 and (2-5 -oligoadenylate synthetase-like protein) OASL by qrt-pcr. We will then perform a proliferation assay on the U937T cell lines treated with IFNs to see if IFN changes the proliferative potential of the cells. In addition, we will test levels of IFN and ISGs in AE or AE9a infected bone marrow cells of both wild type C57BL/6 mice and in IFN-alpha/beta receptor knockout (Ifnar1 KO) C57BL/6 mice. We will perform a colony assay on bone marrow cells and treat with IFN to study the role of IFN upon bone marrow cell proliferation and selfrenewal. We will irradiate both wild type C57BL/6 mice and Ifnar1 KO C57BL/6 mice in order to destabilize the immune system and bone marrow reserves. The irradiated mice will then be rescued with bone marrow transplant (BMT) via tail vein injections from either wild type C57BL/6 mice or from C57BL/6 mice infected with AE or AE9a. This will show the importance of both Ifnar1 in preventing AML development. Collectively, these results may explain why AE9a successfully induces murine leukemia and why AE fails.
18 II Results 8
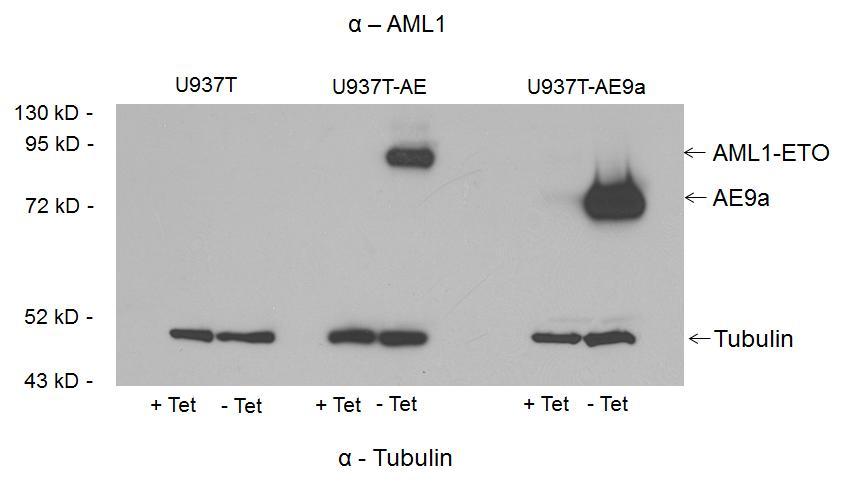
19 9 AE expression strongly stimulates the IFN response in U937T cells but AE9a expression still induces the IFN response The U937T cell line was generated by fusion of the VP16 transcriptional activating domain to a tetracycline repressor to form a transactivator. 14 When the cell line is cultured in the presence of tetracycline, the transactivator is unable to bind to an inducible promoter responsible for expression of the genes under its control (AE and AE9a). Upon removal of tetracycline, the transactivator induces expression of AE and AE9a in the U937T-AE and U937T-AE9a cell line, respectively. U937T, U937T-AE and U937T-AE9a were cultured in RPMI with 10% FBS. Tetracycline was removed from the media by centrifugation for three minutes at 500g followed by aspiration of the supernatant and resuspension of the U937T cells in phosphate buffered saline (PBS). This was performed a total of three times followed by culture of the U937T, U937T-AE and U937T-AE9a cells in tetracycline free media for 48 h. Western blot reveals expression of AE in U937T-AE cells 48h after withdrawal of tetracycline, but lack of expression in U937T-AE cells when cultured in media with 1 µg/ml tetracycline (Figure 1A). Similarly, expression of AE9a is detected in the U937T-AE9a cells 48h after withdrawal of tetracycline but much lower levels of detectable AE9a expression when U937T-AE9a cells were cultured with 1 µg/ml tetracycline. The control U937T cells showed no expression of AE or AE9a under tetracycline or tetracycline free media conditions. The expression of AE and AE9a in U937T-AE
20 10 and U937T-AE9a cells cultured in tetracycline free media was confirmed at 48 hrs prior to qpcr analysis of interferon pathway activation. Analysis of unpublished data from the Zhang lab and the Speck lab suggested IRF7, OASL, ISG15 and IFI44 were some ISGs that are stimulated by AE and AE9a with higher levels of expression in the presence of AE than in AE9a. Comparing levels of gene expression by RT-qPCR revealed that IRF7, OASL, ISG15 and IFI44 expression was indeed increased at the mrna level after induction of AE or AE9a (Figure 1B). Interestingly, expression of AE led to higher levels of these genes; IRF7 mrna levels were increased 49.9 fold after expression of AE but only 8.4 fold after expression of AE9a. Similarly OASL, ISG15 and IFI44 mrna levels increased 169.1, 32.8 and 40.5 fold after AE expression but only 31.4 fold, 7.6 fold and 10.3 fold after AE9a expression, respectively. The U937T control cell line showed little change of ISGs expression and revealed that the expression AE and AE9a were responsible for these changes. These results show that both AE and AE9a can induce the IFN evidenced by the increased expression of the four ISGs of interest. Also, AE is more adept at inducing the IFN response than AE9a. Next the levels of type I IFNs in the U937T cell line were measured. Primers specific for IFN α mrna (set 1 detected IFN α 1, 13 while set 2 detected IFN α (1, 6, 10, 13, 16, 17, 21) and for IFN β mrna were used in qrt- PCR to observe levels of transcription induced by AE and AE9a (Figure 1C). Expression of AE led to greater induction of type I IFN than AE9a. Levels of IFN α mrna were 14.5 and 14.9 fold higher after AE expression and were only 7.8
21 11 and 7.0 fold higher after AE9a expression. Similarly, levels of IFN β mrna were 16.0 fold higher after AE expression and 8.8 fold higher after AE9a expression. The control cell line U937T had increased type I IFN levels of just under two fold after tetracycline withdrawal, but these levels were much lower than the levels induced by AE and AE9a expression. This data of type I IFN levels along with levels of ISGs confirmed that both AE and AE9a expression evoke the IFN response, at least partially by stimulating type I IFN production. Also, expression of AE leads to a stronger IFN response than AE9a. AE expression and IFN treatment leads to inhibition of proliferation in U937T cells An MTS assay was performed upon the U937T cell lines after confirmation of induction of ISGs after AE and AE9a expression and treatment of IFN. This assay utilized the MTS reagent, which is reduced by actively metabolizing cells, and is used to approximate proliferation by spectrophotometer. When U937T was cultured with tetracycline, the absorbance readings at 490 nm were measured and were 1 and 1.81 on day 2 and day 3 after being seeded out at 250,000 cells/ml (Fig. 2A). When the U937T cells were cultured without tetracycline, the readings were 1 and 2.12, showing no decrease of proliferation after tetracycline withdrawal. There was a decrease in cell proliferation after induction of AE but not AE9a. Absorbance readings of the U937T-AE cultured with tetracycline at day 2 were 0.67 and 1.54, respectively. When U937T-AE cells were cultured without
22 12 tetracycline, the absorbance readings were 0.66 and 1.1, showing a decrease in cell proliferation by day 3. The readings of absorbance at 490 nm for the U937T- AE9a cells cultured with tetracycline were 0.97 and When the U937T-AE9a cells were cultured without tetracycline the readings were 0.93 and 1.81, showing no change or an increase in cell proliferation after tetracycline withdrawal. There was a loss of proliferation in the U937T cell lines after treatment with interferon but this loss of proliferation was the same at 500 units and 1000 units of IFN/mL. In addition the loss of proliferation was most easily seen when AE and AE9a cells were cultured without tetracycline. When U937T-AE cells were cultured with tetracycline and 500 or 1000 units/ml interferon, the absorbance readings were 0.63 and 0.64 during day 2 and 1.57 and 1.71 during day 3. When the U937T-AE cells were cultured without tetracycline and 500 or 1000 units/ml interferon, the absorbance readings fell to 0.49 and 0.46 during day 2 and 0.61 and 0.63 during day 3. The decrease in proliferation can be seen by day 2 but is significant by day 3. When U937T-AE9a cells were cultured with tetracycline and 500 or 1000 units/ml universal IFN, the absorbance readings were 0.7 and 0.79 during day 2 and 1.45 and 1.49 during day 3. When U937T- AE9a cells were cultured without tetracycline and 500 or 1000 units/ml universal IFN, the absorbance readings were 0.56 and 0.62 during day 2 and 1.3 and 1.26 during day 3. The differences in proliferation are not as striking as those in the U937T-AE cell line but are still significant.
23 13 AE induces a strong IFN response while AE9a induces a weaker IFN response in C57BL/6 mouse bone marrow cells and both responses are reduced in Ifnar1 KO cells Bone marrow cells from C57BL/6 WT and C57BL/6 Ifnar1 KO cells were infected twice with virus made from 293T cells. The virus was produced by transfecting 293T with Ecopac for ecotropic retrovirus production and MIP, MIP- AE or MIP-AE9a. After transfection of 293T cells with Ecopac and MIP-AE, a strong band of AE was detected by western blot with α-ha (Fig. 3A). Also, after transfection of 293T cells with Ecopac and MIP-AE9a, a strong band of AE9a was detected. No such bands were detected when 293T cells were only transfected with Ecopac and MIP. The infected C57BL/6 WT and C57BL/6 Ifnar1 KO cells were harvested a day after infection. Western blot revealed expression of AE in both C57BL/6 WT and Ifnar1 KO bone marrow cells infected with the supernatant of 293T MIP-AE transfected cells (Fig. 3B). AE9a expression was also detected in both C57BL/6 WT and Ifnar1 KO bone marrow cells infected with the supernatant of 293T MIP- AE9a transfected cells. No bands of AE or AE9a were detected in bone marrow cells infected with the supernatant of 293T MIP transfected cells. RT-qPCR of the same infected C57BL/6 WT and Ifnar1 KO bone marrow cells reveal that ISGs expression is increased strongly by MIP-AE infection and more weakly by MIP-AE9a. The expression of ISGs is lower in Ifnar1 KO cells compared to C57BL/6 cells but is not lost completely. In C57BL/6 WT bone marrow MIP-AE infected cells (C57BL/6 WT-AE), Lymphocyte antigen 6a (Ly6a)
24 14 mrna levels increased 6.3 fold, Oasl2 mrna levels increased 9.2 fold, Oasl1 mrna levels increased 6.8 fold, Irf7 mrna levels increased 5.8 fold and IFN γ induced GTPase (Igtp) mrna levels increased 1.5 fold (Fig. 3C). These levels of transcription only increased by 2.3 fold for Ly6a, 5.3 fold for Oasl2, 3.4 fold for Oasl1, 3.2 fold for Irf7 and 1.4 fold for Igtp when the C57BL/6 WT bone marrow cells were infected with MIP-AE9a instead (C57BL/6 WT-AE9a). When C57BL/6 Ifnar1 KO bone marrow cells were infected with MIP-AE (C57BL/6 Ifnar1 KO- AE), the levels of transcription only increased 2, 2.2, 2.4, 2 and 0.4 fold, for the same genes as above. Similarly, after C57BL/6 Ifnar1 KO bone marrow cells were infected with MIP-AE9a (C57BL/6 Ifnar1 KO-AE9a), levels of transcription increased 1.3, 1.7, 1.3, 1.2 and 0.6 fold. These results show that AE induces stronger expression of ISGs than AE9a in mouse bone marrow cells and that this induction is partially lost in Ifnar1 KO bone mouse bone marrow cells Proliferation and self-renewal of bone marrow cells is inhibited weakly by addition of universal IFN and by loss of Ifnar1 C57BL/6 WT-AE, C57BL/6 WT-AE9a, C57BL/6 Ifnar1 KO-AE and C57BL/6 Ifnar1 KO-AE9a cells were plated onto M3434 methylcellulose for a cell colony assay. The C57BL/6 WT and Ifnar1 KO bone marrow cells infected with MIP were also plated onto M3434 methylcellulose for a cell colony assay but
25 15 were unable to form colonies more than one week after selection and numbered 15,000 cells (Fig 4A). C57BL/6 WT-AE cells formed ten colonies (280 thousand cells) the first week after selection, but by week three there were 173 colonies (4 million cells). Treatment of these C57BL/6 WT-AE cells with universal IFN led to eight colonies formed (917 thousand cells) the first week after selection, and the formation of 88 colonies (2.85 million cells) three weeks after selection. Interestingly, the C57BL/6 Ifnar1 KO- AE formed four colonies (205 thousand cells) one week after selection and 23 colonies (500 thousand cells) three weeks after selection. C57BL/6 WT-AE9a cells formed 91 colonies (3.5 million cells) one week after selection and 203 (3.2 million cells) colonies three weeks after selection.when the C57BL/6 WT-AE9a cells were treated with universal IFN, 55 (3.6 million cells) and 133 (3.1 million cells) colonies were formed one and three weeks after selection, respectively. C57BL/6 Ifnar1 KO-AE9a cells formed 60 colonies (3 million cells) one week after selection and 93 colonies (2 million cells) three weeks after selection. These results taken together indicate that AE and AE9a give bone marrow cells similar self-renewal and proliferation abilities, but that the self-renewal and proliferation is weaker in cells with AE compared to AE9a. Also, universal IFN treatment of bone marrow cells leads to decreased ability of self-renewal. Finally, loss of Ifnar1 also leads to decreased ability to self-renew, especially for cells infected with AE. Only one trail of the colony formation assay begun early enough to have data up to the fifth replating. Five weeks after selection, C57BL/6 WT-AE cells
26 16 formed 155 colonies (3.5 million cells) (Fig. 4B). C57BL/6 WT-AE treated with universal IFN formed 199 colonies (2.9 million cells) five weeks after selection. The C57BL/6 Ifnar1 KO-AE cells formed 134 colonies (2.7 million cells) five weeks after selection. Also, C57BL/6 WT-AE9a cells formed 66 colonies (2 million cells) 5 weeks after selection. Upon treating C57BL/6 WT-AE9a cells with universal IFN, 69 colonies (750 thousand cells) were formed after 5 weeks. C57BL/6 Ifnar1 KO-AE9a cells formed 194 colonies (3.7 million cells). These results suggest that the block of proliferation and self-renewal by AE and loss of Ifnar1 may be only temporary. Also, this suggests that IFN treatment may only work in the short term to block proliferation and self-renewal. Mice receiving Ifnar1 KO BMT experience rapid death from leukemia To examine the leukemic potential of AE and AE9a, mice were lethally irradiated and BMT was performed with fetal liver cells (FLC) infected with MIG, MIG-AE or MIG-AE9a. The survival of mice 20 weeks after receiving C57BL/6 WT FLC infected with MIG, MIG-AE and MIG-AE9a was 93%, 77% and 84%, respectively (Fig. 5A). The survival of mice 20 weeks after receiving C57BL/6 Ifnar1 KO FLC infected with MIG, MIG-AE and MIG-AE9a was 85%, 80% and 27%, respectively. Mice receiving cells infected with MIG-AE9a were the only mice to develop leukemia as identified by enlarged spleen and liver, FACS analysis and cell morphology. This confirms that AE9a is able to induce leukemia in the murine BMT model and that the Ifnar1 may be an important factor in preventing leukemia.
27 17 Recipients of C57BL/6 WT and Ifnar1 KO FLC develop leukemia with similar profiles Mice developing leukemia both displayed hepatosplenomegaly and similar percentages of blood cell markers in peripheral blood. The average mass of a leukemic mouse s spleen and liver receiving C57BL/6 WT MIG-AE9a FLC was 0.36 g and 0.51 g respectively (Fig. 6A). The average mass of a mouse spleen and liver receiving C57BL/6 Ifnar1 KO MIG-AE9a FLC was 1.25 g and g respectively. These results indicate that both the spleen and livers were enlarged for leukemic mice and were similar in weight for C57BL/6 WT and Ifnar1 KO mice. FACS analysis was performed on spleen cells, bone marrow cells and peripheral blood cells to determine the makeup of the white blood cells in leukemic mice. Analysis of GFP+ peripheral blood cells revealed that there were 2.7% CD3+ (T cell marker) cells and 0.6% B220+ cells in mice receiving C57BL/6 WT AE9a infected FLC (Fig. 6B) The percentages of CD3+ and B220+ cells in mice receiving C57BL/6 Ifnar1 KO AE9a infected FLC were 1.9% and 1.5% respectively. The percentages of Gr-1+ or CD11b+ cells in mice receiving C57BL/6 WT AE9a infected FLC was 1.9% and was 3.0% in mice receiving C57BL/6 Ifnar1 KO AE9a infected FLC. In addition, mice receiving C57BL/6 WT AE9a infected FLC had 52.8% c-kit+ Sca-1- and 15.1% c-kit+ and Sca-1+ cells. The mice receiving C57BL/6 Ifnar1 KO AE9a infected FLC had 53.6% c-kit+ Sca- 1- and 13.4% c-kit+ Sca-1+ cells.
28 18 Analysis of GFP+ bone marrow cells confirmed similarities of hematopoietic cells in leukemic mice receiving different AE9a infected FLC. In the mouse receiving FLC from C57BL/6 WT AE9a mice, 50.4% and 13.7% of bone marrow cells were c-kit+ Sca-1- and c-kit+ Sca-1+, respectively. In the mouse receiving FLC from C57BL/6 Ifnar1 KO AE9a mice, 55.3% and 9.0% of the bone marrow cells were c-kit+ Sca-1 and c-kit+ Sca-1+, respectively. These results reveal that the characteristics of leukemia experienced by C57BL6 WT and Ifnar1 KO AE9a recipients were similar.
29 19 Figure 1. AE expression induces a stronger IFN response than AE9a in U937T cell line (A) Western Blot of U937T, U937T-AE and U937T-AE9a cells cultured with RPMI and 10% FBS with or without tetracycline for 48 h. (B-C) RT-qPCR of U937T, U937T-AE and U937T-AE9a cells. The cells were cultured in RPMI and 10% FBS with or without tetracycline for 48 h. RNA was harvested from the cells and 1 ug of RNA was reverse transcribed to cdna. SYBR green reagent was used for RT-qPCR and the C t values for the genes of interest were first normalized to GAPDH. The C t values of the samples without tetracycline were then normalized to those with tetracycline.
30 A 20
31 Fold change relative to control cells cultured in tetracycline 21 B U937T U937T-AE U937T-AE9a IRF7 OASL ISG15 IFI44 Figure 1 Cont.
32 Fold change relative to control cells cultured in tetracycline 22 C IFN α 1 IFN α 2 IFN β U937T U937T-AE U937T-AE9A Figure 1 Cont.
33 23 Figure 2. AE and IFN decrease cell proliferation (A) U937T cell line all seeded out at an initial concentration of 100,000 cells/ml. Cells were treated with or without tetracycline. Cells were also treated with no IFN, 500 units of IFN or 1000 units of IFN. MTS assay used to measure proliferation..
34 24 A 2.5 U937T cell lines cultured with tetracycline hr untreated 72 hr untreated 48 hr 500 IFN 72 hr 500 IFN 48 hr 1000 IFN 72 hr 1000 IFN 0 U937T U937T-AE U937T-AE9a U937T cell lines cultured without tetracycline hr untreated hr untreated 48 hr 500 IFN 72 hr 500 IFN hr 1000 IFN 72 hr 1000 IFN 0 U937T U937T-AE U937T-AE9a
35 25 Figure 3. AE expression induces a stronger IFN response than AE9a in mouse bone marrow cells and the IFN response is partially lost in cells that are Ifnar1 KO (A) (B) (C) Transfection of Ecopac with MIP, MIP-HA-AE and MIP-HA-AE9a into 293T cells. Samples harvested 36 hr post transfection. Infection of C57BL/6 WT and Ifnar1 KO bone marrow cells by retrovirus produced in 293T cells in Fig 3A. RT-qPCR of C57BL/6 WT and Ifnar1 KO bone marrow cells infected a retrovirus for MIP, MIP-HA-AE and MIP-HA-AE9a. Cells were infected two days in a row and selection in 2 µg/ml puromycin was started the 24 hr after the second infection and the cells were harvested 48 hrs later. RNA was extracted and 0.5 µg of RNA reverse transcribed to cdna. C t values normalized to GAPDH and then levels of MIP in C57BL/6 WT and C57BL/6 Ifnar1 KO mice.
36 A 26
37 27 B Figure 3 Cont.
38 Fold 28 C C57 WT - AE C57 WT - AE9a C57 Ifnar1 KO - AE C57 Ifnar1 KO - AE9a Ly6a Oasl2 Oasl1 Irf7 Igtp Figure 3 Cont.
39 29 Fig 4. Proliferation and self-renewal ability of MIP-AE and MIP-AE9a infected bone marrow cells is inhibited by IFN and loss of Ifnar1 (A) (B) Combined data from three separate colony assays of C57BL/6 WT and Ifnar1 KO bone marrow cells infected with MIP, MIP-AE or MIP-AE9a either untreated or treated with 500 units/ml of IFN. Data from one colony assay of C57BL/6 WT and Ifnar1 KO bone marrow cells infected with MIP, MIP-AE or MIP-AE9a either untreated or treated with 500 units/ml of IFN.
40 Cells (in thousands)/condition Colonies/2 x 10 4 cells/ml 30 A Weeks post selection WT MIP KO MIP WT AE WT AE IFN KO AE WT AE9a WT AE9a IFN KO AE9a Weeks post selection WT MIP KO MIP WT AE WT AE IFN KO AE WT AE9a WT AE9a IFN KO AE9a
41 Cells (in thousands)/condition Colonies/2 x 10 4 cells/ml 31 B Weeks post selection WT MIP KO MIP WT AE WT AE IFN KO AE WT 9A WT 9A IFN KO 9A Weeks post selection WT MIP KO MIP WT AE WT AE IFN KO AE WT 9A WT 9A IFN KO 9A Figure 4 Cont.
42 32 Figure 5. Mouse recipients of Ifnar1 KO AE9a infected fetal liver cells experience rapid leukemogenesis (A) Survival curve of irradiated mice rescued with bone marrow transplant from C57BL/6 WT or Ifnar1 KO mouse fetal liver cells infected with MIG, MIG-AE or MIG-AE9a.
43 A 33
44 34 Figure 6. Comparison of C57BL/6 WT and Ifnar1 KO leukemic mice (A) (B) (C) (D) Average mass of spleen and liver of C57BL/6 WT and Ifnar1 KO leukemic mice. For C57BL/6 Ifnar1 KO and WT mice n=5 and n=2 respectively. Percentage of GFP+ cells with certain blood cell markers. For C57BL/6 Ifnar1 KO and WT mice n=5 and n=2 respectively. Single stain controls of FACS analysis of a C57BL/6 Ifnar1 KO leukemic mouse for the markers c-kit and Sca-1. Example of FACS analysis of GFP+ cells from C57BL/6 WT and Ifnar1 KO leukemic mice with blood cell markers c-kit and Sca-1.
45 Mass in grams 35 A C57 WT AE9a C57 Ifnar1 KO AE9a Spleen Liver
46 36 B Ckit+ Sca+ Ckit+ Sca- Gr1+ or CD11b+ B220+ CD3+ C57 IFNAR KO AE9a C57 WT AE9a Percent of Cells in GFP+ Population Figure 6 Cont.
47 37 C Figure 6 Cont.
48 38 D Figure 6 Cont.
49 III Discussion 39
50 40 I have used the human U937T myeloid cell line to show that stable expression of both AE and AE9a will induce the interferon response (Fig. 1A-C). With an MTS assay, I have shown that AE expression and universal IFN treatment inhibit proliferation of U937T cells (Fig. 2A). I have also shown that the interferon response can be induced in primary bone marrow cells transduced with AE and AE9a (Fig. 3A-C). Through a colony formation assay I revealed the effects of stable AE and AE9a expression and interferon pathway stimulation upon the proliferation and self-renewal of mouse bone marrow cells (Fig. 4A-B). I revealed that while retroviral-transduction of AE9a induces leukemia in mice receiving FLC from C57BL/6 WT mice, the onset of leukemia is accelerated in mice receiving FLC from C57BL/6 Ifnar1 KO mice (Fig. 5A). Finally I show that leukemic mice receiving AE9a FLC cells from C57BL/6 WT or Ifnar1 KO mice develop leukemia with similar characteristics (Fig. 6A-D). Interferon response induced after AE and AE9a expression In the U937T cell line, the interferon response was activated after expression of AE and AE9a (Fig 1A-C). A stronger response was observed with expression of AE, but AE9a still induced the interferon response. This is consistent with the observations that murine retroviral-transduction of AE9a but not AE lead to the onset of leukemia since IFNs are antiviral, antitumor, antiproliferative and immunomodulatory molecules. The decreased IFN response in cells expressing AE9a could partially explain the increased leukemic potential of AE9a compared to AE.
51 41 It remains to be seen why AE and AE9a both stimulate the interferon response. AE is usually a repressor of transcription and the fact that the interferon pathway is an exception to the normal way in which AE acts is fascinating. It has been shown that AE9a is a less repressive factor because of the loss of the NHR3 and NHR4 domains which recruit HDACs in order to repress target genes. This raises the question whether the NHR3 and NHR4 domains work to stimulate the IFN response through HDACs or a different mechanism? If AE works to stimulate the interferon response through HDACs, it might do so by recruiting HDACs to repressors of the interferon pathway. Similar induction of the IFN response by AE and AE9a was also observed in bone marrow of C57BL/6 mice (Fig. 3A-C). This response was high in bone marrow of C57BL/6 wild type mice but was decreased in bone marrow C57BL/6 Ifnar1 KO mice. This suggests that both AE and AE9a work through an Ifnar1 dependent pathway to activate the IFN response but further studies are needed to confirm this. Since AE and AE9a still activate the IFN pathway in cells from Ifnar1 KO mice, this also suggests that AE and AE9a also work through an Ifnar1 independent pathway to activate the IFN response. The question that remains is which pathway(s) are responsible for IFN pathway stimulation that can account for the IFN response stimulation in Ifnar1 KO bone marrow cells. While IFN expression is typically dependent upon type I IFN binding to Ifnar1 and activation of the JAK-STAT pathway, there are other facets through which ISGs can become highly expressed.
52 42 Ifnar1 KO AE9a mice develop leukemia rapidly Lethally irradiated C57BL/6 mice receiving BMT from C57BL/6 Ifnar1 KO FLC transduced with AE9a develop leukemia more rapidly than mice receiving FLC from the WT counterparts (Fig. 5A). This suggests that activation of Ifnar1 by IFN and subsequent activation of the JAK-STAT pathway is an important factor in delaying leukemia in a mammalian organism. Mice receiving BMT from AE9a transduced Ifnar1 KO FLC model as a way to study the effects of leukemia when the IFN pathway is decreased but it is important to show the effects when the IFN pathway is increased. For this, a suitable model would be AE9a transduced FLC from UBP43 KO mice since UBP43 KO mice display increased activation of IFN pathway. In addition, while mice receiving BMT from Ifnar1 KO FLC transduced with AE9a have developed leukemia, only a few positive control mice receiving BMT from C57BL/6 WT-AE9a have developed leukemia. In another report by Yan et al., the median survival of C57BL/6 mice recipients of FLC transduced with AE9a was 25 weeks. 7 The C57BL/6 WT-AE9a mice will have to continue to be monitored until death by leukemia to validate the rapid onset of leukemia observed by C57BL/6 Ifnar1 KO recipient mice. Leukemic mice transduced with C57BL/6 WT or Ifnar1 KO AE9a FLC display similar traits Mice that became leukemic due to BMT of AE9a transduced C57BL/6 WT or Ifnar1 KO cells displayed similar leukocyte composition and spleen and liver
53 43 weight (Fig. 6A-D). The spleen and liver of the recipients of C57BL/6 Ifnar1 KO- AE9a seemed to be slightly larger than their WT counterparts, but the difference was not statistically significant. The same was true for the percentage of GFP+ peripheral blood cells with certain blood cell markers such as c-kit, Sca-1, Gr-1, CD11b, B220 and CD3. The percentage of markers in GFP+ bone marrow cells was also consistent between the recipients of the two genotypes. This suggests that the same type of leukemia is developed in BMT recipients of C57BL/6 WT- AE9a and Ifnar1 KO-AE9a cells but is simply accelerated in recipients of C57BL/6 Ifnar1 KO-AE9a. The IFN pathway inhibits proliferation in the U937T cell line but its role in bone marrow cells is unclear In the U937T cell line system, treatment of cells with IFN leads to a block of proliferation (Fig 2A). In fact, after induction of AE9a and treatment with 1000 units/ml of IFN, absorbance levels were 0.62 and 1.26, very similar to the absorbance readings after induction of AE but without treatment of IFN, 0.66 and 1.1. In addition, when AE9a is induced but there is no IFN treatment, measured absorbance levels are higher at 0.93 and It seems that IFN treatment does decrease proliferation in cells expressing AE9a to levels near cells expressing AE. This is useful because BMT recipient mice of FLC transduced with AE don t develop leukemia but those recipients of AE9a transduced FLC do develop leukemia. It is possible that this is in part because of the inhibition of proliferation by AE.
54 44 In mouse bone marrow cells, treatment with IFN reduced ability for both C57BL/6 WT and Ifnar1 KO bone marrow cells to self-renew and proliferate (Fig. 4A-B). Also, between C57BL/6 WT and Ifnar1 KO bone marrow cells, the loss of Ifnar1 led to reduced ability of bone marrow cells to self-renew and proliferate. The inhibition of self-renewal and proliferation by IFN treatment is expected as IFN are both antitumor and anti-proliferative agents. The greater inhibition by loss of Ifnar1 is surprising as poor activation of the IFN pathway should lead to increased proliferation and increased risk of tumor development. It s possible that Ifnar1 is responsible for more than stimulation of ISGs responsible for these effects in C57BL/6 mice and that another pathway is being affected by the loss of Ifnar1.
55 IV Materials and Methods 45
56 46 Cell Culture U937T, U937T-AE and U937T-HA-AE9a cells were cultured in RPMI medium containing 10% fetal bovine serum, 1% penicillin/streptomycin, 1% glutamine and 1 ug/ml tetracycline. The cells were cultured in a 37 C incubator with 5% carbon dioxide. The cell lines were established as previously described T cells were cultured in DMEM containing 10% fetal bovine serum, 1% penicillin/streptomycin and 1% glutamine. Primary mouse bone marrow and fetal liver cells were cultured in Isocove s Modified Dulbecco s Medium (IMDM) with 4% IL3-CM and 4% SCF- CM (2x BM) prior to infection. Western Blot Cell samples were washed in PBS and resuspended in sample buffer containing 160 mm Tris ph 6.8, 6.4% sodium dodecyl sulfate (SDS), 32% glycerol, 0.032% bromophenol blue and 20% b-mercaptoethanol. After SDSpolyacrylamide gel electrophoresis (PAGE), the proteins were transferred to a nitrocellulose membrane. The membrane was blocked in 5% dry milk in phosphate buffered saline with 0.1% Tween 20 (PBS-T). The blot was then washed with PBS-T and incubated with primary antibodies overnight. Antibodies used included α-aml1, α-tubulin and α-ha-hrp. Following primary antibody incubation, the blot was washed with PBS-T and incubated with the
57 47 corresponding secondary antibodies. After treatment with luminol and oxidizing substrates, the blot was visualized on Blue Devil film. Retrovirus and Infection To produce retrovirus, 293T cells were transfected with 5 µg of MSCV- IRES-PURO (MIP), MIP-AE, MIP-AE9a, MSCV-IRES-GFP (MIG), MIG-AE or MIG-AE9a vectors and with 5 ug of Ecopac vector by PEI reagent with Optimem. The 293T media was changed from DMEM to IMDM again 8 hrs post transfection. Retrovirus supernatants were harversted 48 hours after transfection and were filtered through a 0.45 um filter. The retrovirus supernatant from MIP and MIG vectors was added to recipient bone marrow cells and fetal liver cells, respectively, along with 4% IL3-CM, 4% SCF-CM, 1% HEPES and 1 µl/ml polybrene. The infected cells were centrifuged at 3000 x g for 3 hr at 30 C then incubated at 37 C with 5% carbon dioxide. Infections were performed twice on consecutive days for all cells. The cells infected with MIG constructs were identified by their fluorescence after FACS analysis. The cells infected with MIP were identified via puromycin selection. RT-qPCR RNA was harvested from cells with Qiagen s RNeasy Mini Kit. RNA was reverse transcribed into cdna using Invitrogen s Super Script III Reverse Transcriptase. 1 µl of cdna from each sample was used with KAPA SYBR 2x
58 48 mix on Biorad s CFX Connect TM Real-Time PCR Detection System. All C t results were normalized to GAPDH. The forward and reverse primers used to detect genes via RT-qPCR were: hgapdh (5 -GAA GGT GAA GGT CGG AGT C GAA GAT GGT GAT GGG ATT TC-3 ), hirf7 (5 -TAT ACC ATC TAC CTG GGC TTC GG-3 5 -GCT CCA GCT TTC TGG AGT TCT CAT T-3 ), hoasl (5 -AGG ACT GTT GCT ATG ACA ACA GGG A-3 5 -TGC TGC TGA GAA GCT GCC TCT C-3 ), hisg15 (5 -TTT GCC AGT ACA GGA CTT GTG-3 5 -GCT CAG AGG TTC GTC GCA TTT-3 ), hifi44 (5 -TTC GAT GCG AAG ATT CAC TG-3 5 -CCC TTG GAA AAC AGA CCT CA-3 ), mgapdh (5 -GGT GCT GAG TAT GTC GTG GAG TCT A-3 5 -AAA GTT GTC ATG GAT GAC CTT GG-3 ), mly6a (5 -GGA GGC AGC AGT TAT TGT GGA TTC T-3 5 -GTG GGA ACA TTG CAG GAC CCC A-3 ), moasl2 (5 -AGC CGT GAT GGA GCT CCT CGT-3 5 -GGA TGA TGG GCC GGT CTC CCT-3 ), moasl1 (5 -TGG AGG GTG AAG AGA GCA CCC G-3 5 -AGG CGA GCG TGC AAT GGC TT-3 ), mirf7 (5 -TCC GGT ACC AGG GTC CAG CC-3 5 -CGG GAG CGC ACA CGT GAT GT-3 ), mifi44(5 -TGT AAG GCT TCT GAG CAG GTT CTG A-3 5 -TGT GGG CCT GAA CTC TGT GGG T- 3 ). Replating After bone marrow and fetal liver cells were infected, they were cultured in 2x BM with 2 ug/ml puromycin for two days. Cells were resuspended at a density of 4 x 10 4 cells/ml M3434 semisolid media with 1 ug/ml puromycin and 1% penicillin/streptomycin. The solution was vortexed and passed through an 18
59 49 ½ gauge needle onto 30 mm wide tissue culture plates and placed in a 37 C incubator with 5% carbon dioxide. After one week, the first replating was performed. 2 ml pre-warmed IMDM was used to dissolve the M3434 media. The cells were plated out at 2 x 10 4 cells/ml of M3434 media with 1% penicillin/streptomycin but without puromycin. After one week the number of colonies was counted. The cells for each condition were counted and the cells were replated again at 2 x 10 4 cells/ml of M3434 media with 1% penicillin/streptomycin but without puromycin. Bone Marrow Transplants Fetal liver cells (FLC) were harvested and infected as described above. C57BL/6 wild type and Ifnar1KO mice were irradiated at 700 rad. FLC were injected into the tail veins of recipient mice with a 25 gauge needle. Recipient mice were given acid treated water for three weeks following the bone marrow transplant. MTS Assay U937T, U937T-AE and U937T-AE9a cells were seeded out in duplicate into a 96 well plate at a density of 250,000 cells/ml in 100 µl. Cells were treated with MTS reagent and the absorbance at 490 nm and 700 nm was measured 100 minutes after addition of the reagent. The readings of 700 nm and the readings of the blanks were subtracted from the readings of the converted MTS reagent at 490 nm to determine the actual absorbance.
60 References 1. Peterson, L.F., Boyapati, A., Ahn, E.-Y., Biggs, J.R., Okumura, A.J., Lo, M.-C., Yan, M., and Zhang, D.-E. (2007). Acute myeloid leukemia with the 8q22;21q22 translocation: secondary mutational events and alternative t(8;21) transcripts. Blood 110, Altekruse Sf, Kosary CL, Krapcho M, Neyman N, Aminou R, Waldron W et al. (2010). SEER Cancer Statistics Review, National Cancer Institute: Bethesda, MD. 3. Rowley, J.D. (1973). Identificaton of a translocation with quinacrine fluorescence in a patient with acute leukemia. Ann. Genet. 16, Lai, Y.-Y., Qiu, J.-Y., Jiang, B., Lu, X.-J., Huang, X.-J., Zhang, Y., Liu, Y.- R., Shi, H.-L., and Lu, D.-P. (2005). Characteristics and prognostic factors of acute myeloid leukemia with t (8; 21) (q22; q22). Zhongguo Shi Yan Xue Ye Xue Za Zhi 13, Yan, M., Kanbe, E., Peterson, L.F., Boyapati, A., Miao, Y., Wang, Y., Chen, I.-M., Chen, Z., Rowley, J.D., Willman, C.L., et al. (2006). A previously unidentified alternatively spliced isoform of t(8;21) transcript promotes leukemogenesis. Nat. Med. 12, Peterson, L.F., and Zhang, D.-E. (2004). The 8;21 translocation in leukemogenesis. Oncogene 23, Linggi, B., Müller-Tidow, C., van de Locht, L., Hu, M., Nip, J., Serve, H., Berdel, W.E., van der Reijden, B., Quelle, D.E., Rowley, J.D., et al. (2002). The t(8;21) fusion protein, AML1 ETO, specifically represses the transcription of the p14(arf) tumor suppressor in acute myeloid leukemia. Nat. Med. 8, Klisovic, M.I., Maghraby, E.A., Parthun, M.R., Guimond, M., Sklenar, A.R., Whitman, S.P., Chan, K.K., Murphy, T., Anon, J., Archer, K.J., et al. (2003). Depsipeptide (FR ) promotes histone acetylation, gene transcription, apoptosis and its activity is enhanced by DNA methyltransferase inhibitors in AML1/ETO-positive leukemic cells. Leukemia 17, Shia, W.-J., Okumura, A.J., Yan, M., Sarkeshik, A., Lo, M.-C., Matsuura, S., Komeno, Y., Zhao, X., Nimer, S.D., Yates, J.R., 3rd, et al. (2012). PRMT1 interacts with AML1-ETO to promote its transcriptional activation and progenitor cell proliferative potential. Blood 119,
61 Matsuura, S., Yan, M., Lo, M.-C., Ahn, E.-Y., Weng, S., Dangoor, D., Matin, M., Higashi, T., Feng, G.-S., and Zhang, D.-E. (2012). Negative effects of GM-CSF signaling in a murine model of t(8;21)-induced leukemia. Blood 119, Radomska, H.S., Huettner, C.S., Zhang, P., Cheng, T., Scadden, D.T., and Tenen, D.G. (1998). CCAAT/enhancer binding protein alpha is a regulatory switch sufficient for induction of granulocytic development from bipotential myeloid progenitors. Mol. Cell. Biol. 18, Vangala, R.K., Heiss-Neumann, M.S., Rangatia, J.S., Singh, S.M., Schoch, C., Tenen, D.G., Hiddemann, W., and Behre, G. (2003). The myeloid master regulator transcription factor PU.1 is inactivated by AML1- ETO in t(8;21) myeloid leukemia. Blood 101, Pabst, T., Mueller, B.U., Harakawa, N., Schoch, C., Haferlach, T., Behre, G., Hiddemann, W., Zhang, D.E., and Tenen, D.G. (2001). AML1-ETO downregulates the granulocytic differentiation factor C/EBPalpha in t(8;21) myeloid leukemia. Nat. Med. 7, Burel, S.A., Harakawa, N., Zhou, L., Pabst, T., Tenen, D.G., and Zhang, D.E. (2001). Dichotomy of AML1-ETO functions: growth arrest versus block of differentiation. Mol. Cell. Biol. 21, Choi, Y., Elagib, K.E., and Goldfarb, A.N. (2005). AML-1-ETO-Mediated erythroid inhibition: new paradigms for differentiation blockade by a leukemic fusion protein. Crit. Rev. Eukaryot. Gene Expr. 15, Isaacs, A., and Lindenmann, J. (1987). Virus interference. I. The interferon. By A. Isaacs and J. Lindenmann, J. Interferon Res. 7, Taniguchi, T., Fujii-Kuriyama, Y., and Muramatsu, M. (1980). Molecular cloning of human interferon cdna. Proc. Natl. Acad. Sci. U.S.A. 77, Novick, D., Cohen, B., and Rubinstein, M. (1994). The human interferon alpha/beta receptor: characterization and molecular cloning. Cell 77, Kotenko, S.V., Gallagher, G., Baurin, V.V., Lewis-Antes, A., Shen, M., Shah, N.K., Langer, J.A., Sheikh, F., Dickensheets, H., and Donnelly, R.P. (2003). IFN-lambdas mediate antiviral protection through a distinct class II cytokine receptor complex. Nat. Immunol. 4,
Toluidin-Staining of mast cells Ear tissue was fixed with Carnoy (60% ethanol, 30% chloroform, 10% acetic acid) overnight at 4 C, afterwards
 overnight at 4 C, afterwards") Toluidin-Staining of mast cells Ear tissue was fixed with Carnoy (60% ethanol, 30% chloroform, 10% acetic acid) overnight at 4 C, afterwards incubated in 100 % ethanol overnight at 4 C and embedded in
Toluidin-Staining of mast cells Ear tissue was fixed with Carnoy (60% ethanol, 30% chloroform, 10% acetic acid) overnight at 4 C, afterwards incubated in 100 % ethanol overnight at 4 C and embedded in
Supplementary Table 3. 3 UTR primer sequences. Primer sequences used to amplify and clone the 3 UTR of each indicated gene are listed.
 Supplemental Figure 1. DLKI-DIO3 mirna/mrna complementarity. Complementarity between the indicated DLK1-DIO3 cluster mirnas and the UTR of SOX2, SOX9, HIF1A, ZEB1, ZEB2, STAT3 and CDH1with mirsvr and PhastCons
c Tuj1(-) apoptotic live 1 DIV 2 DIV 1 DIV 2 DIV Tuj1(+) Tuj1/GFP/DAPI Tuj1 DAPI GFP
 apoptotic live 1 DIV 2 DIV 1 DIV 2 DIV Tuj1(+) Tuj1/GFP/DAPI Tuj1 DAPI GFP") Supplementary Figure 1 Establishment of the gain- and loss-of-function experiments and cell survival assays. a Relative expression of mature mir-484 30 20 10 0 **** **** NCP mir- 484P NCP mir- 484P b Relative
Supplementary Figure 1 Establishment of the gain- and loss-of-function experiments and cell survival assays. a Relative expression of mature mir-484 30 20 10 0 **** **** NCP mir- 484P NCP mir- 484P b Relative
Supplementary Figure 1 a
 Supplementary Figure a Normalized expression/tbp (A.U.).6... Trip-br transcripts Trans Trans Trans b..5. Trip-br Ctrl LPS Normalized expression/tbp (A.U.) c Trip-br transcripts. adipocytes.... Trans Trans
Supplemental Data. Shin et al. Plant Cell. (2012) /tpc YFP N
 /tpc YFP N") MYC YFP N PIF5 YFP C N-TIC TIC Supplemental Data. Shin et al. Plant Cell. ()..5/tpc..95 Supplemental Figure. TIC interacts with MYC in the nucleus. Bimolecular fluorescence complementation assay using
MYC YFP N PIF5 YFP C N-TIC TIC Supplemental Data. Shin et al. Plant Cell. ()..5/tpc..95 Supplemental Figure. TIC interacts with MYC in the nucleus. Bimolecular fluorescence complementation assay using
a) Primary cultures derived from the pancreas of an 11-week-old Pdx1-Cre; K-MADM-p53
 Primary cultures derived from the pancreas of an 11-week-old Pdx1-Cre; K-MADM-p53") 1 2 3 4 5 6 7 8 9 10 Supplementary Figure 1. Induction of p53 LOH by MADM. a) Primary cultures derived from the pancreas of an 11-week-old Pdx1-Cre; K-MADM-p53 mouse revealed increased p53 KO/KO (green,
1 2 3 4 5 6 7 8 9 10 Supplementary Figure 1. Induction of p53 LOH by MADM. a) Primary cultures derived from the pancreas of an 11-week-old Pdx1-Cre; K-MADM-p53 mouse revealed increased p53 KO/KO (green,
Supplementary Document
 Supplementary Document 1. Supplementary Table legends 2. Supplementary Figure legends 3. Supplementary Tables 4. Supplementary Figures 5. Supplementary References 1. Supplementary Table legends Suppl.
Figure S1. Analysis of genomic and cdna sequences of the targeted regions in WT-KI and
 Figure S1. Analysis of genomic and sequences of the targeted regions in and indicated mutant KI cells, with WT and corresponding mutant sequences underlined. (A) cells; (B) K21E-KI cells; (C) D33A-KI cells;
Supplementary Figure 1 MicroRNA expression in human synovial fibroblasts from different locations. MicroRNA, which were identified by RNAseq as most
 Supplementary Figure 1 MicroRNA expression in human synovial fibroblasts from different locations. MicroRNA, which were identified by RNAseq as most differentially expressed between human synovial fibroblasts
Supplementary Appendix
 Supplementary Appendix This appendix has been provided by the authors to give readers additional information about their work. Supplement to: Sherman SI, Wirth LJ, Droz J-P, et al. Motesanib diphosphate
Supplementary Figure 1. ROS induces rapid Sod1 nuclear localization in a dosagedependent manner. WT yeast cells (SZy1051) were treated with 4NQO at
 were treated with 4NQO at") Supplementary Figure 1. ROS induces rapid Sod1 nuclear localization in a dosagedependent manner. WT yeast cells (SZy1051) were treated with 4NQO at different concentrations for 30 min and analyzed for
Supplementary Figure 1. ROS induces rapid Sod1 nuclear localization in a dosagedependent manner. WT yeast cells (SZy1051) were treated with 4NQO at different concentrations for 30 min and analyzed for
SUPPLEMENTARY INFORMATION
 doi: 10.1038/nature05883 SUPPLEMENTARY INFORMATION Supplemental Figure 1 Prostaglandin agonists and antagonists alter runx1/cmyb expression. a-e, Embryos were exposed to (b) PGE2 and (c) PGI2 (20μM) and
Abbreviations: P- paraffin-embedded section; C, cryosection; Bio-SA, biotin-streptavidin-conjugated fluorescein amplification.
 Supplementary Table 1. Sequence of primers for real time PCR. Gene Forward primer Reverse primer S25 5 -GTG GTC CAC ACT ACT CTC TGA GTT TC-3 5 - GAC TTT CCG GCA TCC TTC TTC-3 Mafa cds 5 -CTT CAG CAA GGA
Nature Structural & Molecular Biology: doi: /nsmb Supplementary Figure 1
 Supplementary Figure 1 U1 inhibition causes a shift of RNA-seq reads from exons to introns. (a) Evidence for the high purity of 4-shU-labeled RNAs used for RNA-seq. HeLa cells transfected with control
Supplemental Information. Cancer-Associated Fibroblasts Neutralize. the Anti-tumor Effect of CSF1 Receptor Blockade
 Cancer Cell, Volume 32 Supplemental Information Cancer-Associated Fibroblasts Neutralize the Anti-tumor Effect of CSF1 Receptor Blockade by Inducing PMN-MDSC Infiltration of Tumors Vinit Kumar, Laxminarasimha
Supplementary Table 2. Conserved regulatory elements in the promoters of CD36.
 Supplementary Table 1. RT-qPCR primers for CD3, PPARg and CEBP. Assay Forward Primer Reverse Primer 1A CAT TTG TGG CCT TGT GCT CTT TGA TGA GTC ACA GAA AGA ATC AAT TC 1B AGG AAA TGA ACT GAT GAG TCA CAG
Supplementary Materials
 Supplementary Materials 1 Supplementary Table 1. List of primers used for quantitative PCR analysis. Gene name Gene symbol Accession IDs Sequence range Product Primer sequences size (bp) β-actin Actb gi
Supplementary Figure 1
 Supplementary Figure 1 3 3 3 1 1 Bregma -1.6mm 3 : Bregma Ref) Http://www.mbl.org/atlas165/atlas165_start.html Bregma -.18mm Supplementary Figure 1 Schematic representation of the utilized brain slice
CD31 5'-AGA GAC GGT CTT GTC GCA GT-3' 5 ' -TAC TGG GCT TCG AGA GCA GT-3'
 Table S1. The primer sets used for real-time RT-PCR analysis. Gene Forward Reverse VEGF PDGFB TGF-β MCP-1 5'-GTT GCA GCA TGA ATC TGA GG-3' 5'-GGA GAC TCT TCG AGG AGC ACT T-3' 5'-GAA TCA GGC ATC GAG AGA
Supplementary Figures
 Supplementary Figures Supplementary Figure 1. H3F3B expression in lung cancer. a. Comparison of H3F3B expression in relapsed and non-relapsed lung cancer patients. b. Prognosis of two groups of lung cancer
Plasmids Western blot analysis and immunostaining Flow Cytometry Cell surface biotinylation RNA isolation and cdna synthesis
 Plasmids psuper-retro-s100a10 shrna1 was constructed by cloning the dsdna oligo 5 -GAT CCC CGT GGG CTT CCA GAG CTT CTT TCA AGA GAA GAA GCT CTG GAA GCC CAC TTT TTA-3 and 5 -AGC TTA AAA AGT GGG CTT CCA GAG
Supplemental Figures: Supplemental Figure 1
 Supplemental Figures: Supplemental Figure 1 Suppl. Figure 1. BM-DC infection with H. pylori does not induce cytotoxicity and treatment of BM-DCs with H. pylori sonicate, but not heat-inactivated bacteria,
Beta Thalassemia Case Study Introduction to Bioinformatics
 Beta Thalassemia Case Study Sami Khuri Department of Computer Science San José State University San José, California, USA sami.khuri@sjsu.edu www.cs.sjsu.edu/faculty/khuri Outline v Hemoglobin v Alpha
*To whom correspondence should be addressed. This PDF file includes:
 www.sciencemag.org/cgi/content/full/science.1212182/dc1 Supporting Online Material for Partial Retraction to Detection of an Infectious Retrovirus, XMRV, in Blood Cells of Patients with Chronic Fatigue
BHP 2-7 and Nthy-ori 3-1 cells were grown in RPMI1640 medium (Hyclone) supplemented with 10% fetal bovine serum (Gibco), 2mM L-glutamine, and 100 U/mL
 supplemented with 10% fetal bovine serum (Gibco), 2mM L-glutamine, and 100 U/mL") 1 2 3 4 Materials and Methods Cell culture BHP 2-7 and Nthy-ori 3-1 cells were grown in RPMI1640 medium (Hyclone) 5 supplemented with 10% fetal bovine serum (Gibco), 2mM L-glutamine, and 100 U/mL 6 penicillin-streptomycin.
1 2 3 4 Materials and Methods Cell culture BHP 2-7 and Nthy-ori 3-1 cells were grown in RPMI1640 medium (Hyclone) 5 supplemented with 10% fetal bovine serum (Gibco), 2mM L-glutamine, and 100 U/mL 6 penicillin-streptomycin.
Table S1. Oligonucleotides used for the in-house RT-PCR assays targeting the M, H7 or N9. Assay (s) Target Name Sequence (5 3 ) Comments
 Target Name Sequence (5 3 ) Comments") SUPPLEMENTAL INFORMATION 2 3 Table S. Oligonucleotides used for the in-house RT-PCR assays targeting the M, H7 or N9 genes. Assay (s) Target Name Sequence (5 3 ) Comments CDC M InfA Forward (NS), CDC M
SUPPLEMENTAL INFORMATION 2 3 Table S. Oligonucleotides used for the in-house RT-PCR assays targeting the M, H7 or N9 genes. Assay (s) Target Name Sequence (5 3 ) Comments CDC M InfA Forward (NS), CDC M
Phylogenetic analysis of human and chicken importins. Only five of six importins were studied because
 Supplementary Figure S1 Phylogenetic analysis of human and chicken importins. Only five of six importins were studied because importin-α6 was shown to be testis-specific. Human and chicken importin protein
BIOLOGY 621 Identification of the Snorks
 Name: Date: Block: BIOLOGY 621 Identification of the Snorks INTRODUCTION: In this simulation activity, you will examine the DNA sequence of a fictitious organism - the Snork. Snorks were discovered on
ice-cold 70% ethanol with gentle vortexing, incubated at -20 C for 4 hours, and washed with PBS.
 Cell cycle analysis For cell cycle analysis, single cell suspensions of E12.5 fetal liver cells were suspended in 4 ml ice-cold 7% ethanol with gentle vortexing, incubated at -2 C for 4 hours, and washed
Nature Immunology: doi: /ni.3836
 Supplementary Figure 1 Recombinant LIGHT-VTP induces pericyte contractility and endothelial cell activation. (a) Western blot showing purification steps for full length murine LIGHT-VTP (CGKRK) protein:
Citation for published version (APA): Oosterveer, M. H. (2009). Control of metabolic flux by nutrient sensors Groningen: s.n.
: Oosterveer, M. H. (2009). Control of metabolic flux by nutrient sensors Groningen: s.n.") University of Groningen Control of metabolic flux by nutrient sensors Oosterveer, Maaike IMPORTANT NOTE: You are advised to consult the publisher's version (publisher's PDF) if you wish to cite from it.
University of Groningen Control of metabolic flux by nutrient sensors Oosterveer, Maaike IMPORTANT NOTE: You are advised to consult the publisher's version (publisher's PDF) if you wish to cite from it.
Supplementary Materials and Methods
 DD2 suppresses tumorigenicity of ovarian cancer cells by limiting cancer stem cell population Chunhua Han et al. Supplementary Materials and Methods Analysis of publicly available datasets: To analyze
 www.lessonplansinc.com Topic: Protein Synthesis - Sentence Activity Summary: Students will simulate transcription and translation by building a sentence/polypeptide from words/amino acids. Goals & Objectives:
Astaxanthin prevents and reverses diet-induced insulin resistance and. steatohepatitis in mice: A comparison with vitamin E
 Supplementary Information Astaxanthin prevents and reverses diet-induced insulin resistance and steatohepatitis in mice: A comparison with vitamin E Yinhua Ni, 1,2 Mayumi Nagashimada, 1 Fen Zhuge, 1 Lili
Cross-talk between mineralocorticoid and angiotensin II signaling for cardiac
 ONLINE SUPPLEMENT TO Crosstalk between mineralocorticoid and angiotensin II signaling for cardiac remodeling An Di ZHANG,,3, Aurelie NGUYEN DINH CAT*,,3, Christelle SOUKASEUM *,,3, Brigitte ESCOUBET, 4,
SUPPLEMENTARY DATA. Supplementary Table 1. Primer sequences for qrt-pcr
 Supplementary Table 1. Primer sequences for qrt-pcr Gene PRDM16 UCP1 PGC1α Dio2 Elovl3 Cidea Cox8b PPARγ AP2 mttfam CyCs Nampt NRF1 16s-rRNA Hexokinase 2, intron 9 β-actin Primer Sequences 5'-CCA CCA GCG
Supplemental Information. Th17 Lymphocytes Induce Neuronal. Cell Death in a Human ipsc-based. Model of Parkinson's Disease
 Cell Stem Cell, Volume 23 Supplemental Information Th17 Lymphocytes Induce Neuronal Cell Death in a Human ipsc-based Model of Parkinson's Disease Annika Sommer, Franz Maxreiter, Florian Krach, Tanja Fadler,
A smart acid nanosystem for ultrasensitive. live cell mrna imaging by the target-triggered intracellular self-assembly
 Electronic Supplementary Material (ESI) for Chemical Science. This journal is The Royal Society of Chemistry 2017 A smart ZnO@polydopamine-nucleic acid nanosystem for ultrasensitive live cell mrna imaging
Beta Thalassemia Sami Khuri Department of Computer Science San José State University Spring 2015
 Bioinformatics in Medical Product Development SMPD 287 Three Beta Thalassemia Sami Khuri Department of Computer Science San José State University Hemoglobin Outline Anatomy of a gene Hemoglobinopathies
Supplementary Figure 1a
 Supplementary Figure 1a Hours: E-cadherin TGF-β On TGF-β Off 0 12 24 36 48 24 48 72 Vimentin βactin Fig. S1a. Treatment of AML12 cells with TGF-β induces EMT. Treatment of AML12 cells with TGF-β results
Culture Density (OD600) 0.1. Culture Density (OD600) Culture Density (OD600) Culture Density (OD600) Culture Density (OD600)
 0.1. Culture Density (OD600) Culture Density (OD600) Culture Density (OD600) Culture Density (OD600)") A. B. C. D. E. PA JSRI JSRI 2 PA DSAM DSAM 2 DSAM 3 PA LNAP LNAP 2 LNAP 3 PAO Fcor Fcor 2 Fcor 3 PAO Wtho Wtho 2 Wtho 3 Wtho 4 DTSB Low Iron 2 4 6 8 2 4 6 8 2 22 DTSB Low Iron 2 4 6 8 2 4 6 8 2 22 DTSB
A. B. C. D. E. PA JSRI JSRI 2 PA DSAM DSAM 2 DSAM 3 PA LNAP LNAP 2 LNAP 3 PAO Fcor Fcor 2 Fcor 3 PAO Wtho Wtho 2 Wtho 3 Wtho 4 DTSB Low Iron 2 4 6 8 2 4 6 8 2 22 DTSB Low Iron 2 4 6 8 2 4 6 8 2 22 DTSB
Supplementary Figure 1
 Supplementary Figure 1 Supplementary Figure 1: Cryopreservation alters CD62L expression by CD4 T cells. Freshly isolated (left) or cryopreserved PBMCs (right) were stained with the mix of antibodies described
Description of Supplementary Files. File Name: Supplementary Information Description: Supplementary Figures and Supplementary Tables
 Description of Supplementary Files File Name: Supplementary Information Description: Supplementary Figures and Supplementary Tables Supplementary Figure 1: (A), HCT116 IDH1-WT and IDH1-R132H cells were
Supplementary Figure 1
 Supplementary Figure 1 Supplementary Figure 1. Lats1/2 deleted ihbs and ihps showed decreased transcripts of hepatocyte related genes (a and b) Western blots (a) and recombination PCR (b) of control and
Baseline clinical characteristics for the 81 CMML patients Routine diagnostic testing and statistical analyses... 3
 Next-Generation Sequencing Technology Reveals a Characteristic Pattern of Molecular Mutations in 72.8% of Chronic Myelomonocytic Leukemia (CMML) by Detecting Frequent Alterations in TET2, CBL, RAS, and
McAlpine PERK-GSK3 regulates foam cell formation. Supplemental Material. Supplementary Table I. Sequences of real time PCR primers.
 Mclpine PERK-GSK3 regulates foam cell formation Supplemental Material Supplementary Table I. Sequences of real time PCR primers. Primer Name Primer Sequences (5-3 ) Product Size (bp) GRP78 (human) Fwd:
Formylpeptide receptor2 contributes to colon epithelial homeostasis, inflammation, and tumorigenesis
 Supplementary Data Formylpeptide receptor2 contributes to colon epithelial homeostasis, inflammation, and tumorigenesis Keqiang Chen, Mingyong Liu, Ying Liu, Teizo Yoshimura, Wei Shen, Yingying Le, Scott
Supplementary Figure 1
 Metastatic melanoma Primary melanoma Healthy human skin Supplementary Figure 1 CD22 IgG4 Supplementary Figure 1: Immunohisochemical analysis of CD22+ (left) and IgG4 (right), cells (shown in red and indicated
A basic helix loop helix transcription factor controls cell growth
 A basic helix loop helix transcription factor controls cell growth and size in root hairs Keke Yi 1,2, Benoît Menand 1,3, Elizabeth Bell 1, Liam Dolan 1,4 Supplementary note Low soil phosphate availability
Table S1. Primers used to quantitatively amplify the human mirnas precursors and indicated genes
 Table S1. Primers used to quantitatively amplify the human mirnas precursors and indicated genes Forward primer (5 3 ) Rervese primer (5 3 ) U6 CTCGCTTCGGCAGCACA AACGCTTCACGAATTTGCGT 5S TACGGCCATACCACCCTGAA
Supplementary Information
 Supplementary Information Remodeling of heterochromatin structure slows neuropathological progression and prolongs survival in an animal model of Huntington s disease Junghee Lee, Yu Jin Hwang, Yunha Kim,
Journal of Cell Science Supplementary information. Arl8b +/- Arl8b -/- Inset B. electron density. genotype
 J. Cell Sci. : doi:.4/jcs.59: Supplementary information E9. A Arl8b /- Arl8b -/- Arl8b Arl8b non-specific band Gapdh Tbp E7.5 HE Inset B D Control al am hf C E Arl8b -/- al am hf E8.5 F low middle high
Nature Immunology: doi: /ni Supplementary Figure 1. Huwe1 has high expression in HSCs and is necessary for quiescence.
 Supplementary Figure 1 Huwe1 has high expression in HSCs and is necessary for quiescence. (a) Heat map visualizing expression of genes with a known function in ubiquitin-mediated proteolysis (KEGG: Ubiquitin
TetR repressor-based bioreporters for the detection of doxycycline using Escherichia
 Supplementary materials TetR repressor-based bioreporters for the detection of doxycycline using Escherichia coli and Acinetobacter oleivorans Hyerim Hong and Woojun Park * Department of Environmental
CIRCRESAHA/2004/098145/R1 - ONLINE 1. Validation by Semi-quantitative Real-Time Reverse Transcription PCR
 CIRCRESAHA/2004/098145/R1 - ONLINE 1 Expanded Materials and Methods Validation by Semi-quantitative Real-Time Reverse Transcription PCR Expression patterns of 13 genes (Online Table 2), selected with respect
Development of RT-qPCR-based molecular diagnostic assays for therapeutic target selection of breast cancer patients
 Development of RT-qPCR-based molecular diagnostic assays for therapeutic target selection of breast cancer patients Sangjung Park The Graduate School Yonsei University Department of Biomedical Laboratory
Integration Solutions
 Integration Solutions (1) a) With no active glycosyltransferase of either type, an ii individual would not be able to add any sugars to the O form of the lipopolysaccharide. Thus, the only lipopolysaccharide
SUPPORTING INFORMATION
 SUPPORTING INFORMATION Biology is different in small volumes: endogenous signals shape phenotype of primary hepatocytes cultured in microfluidic channels Amranul Haque, Pantea Gheibi, Yandong Gao, Elena
Advanced Subsidiary Unit 1: Lifestyle, Transport, Genes and Health
 Write your name here Surname Other names Edexcel GCE Centre Number Candidate Number Biology Advanced Subsidiary Unit 1: Lifestyle, Transport, Genes and Health Thursday 8 January 2009 Morning Time: 1 hour
without LOI phenotype by breeding female wild-type C57BL/6J and male H19 +/.
 Sakatani et al. 1 Supporting Online Material Materials and methods Mice and genotyping: H19 mutant mice with C57BL/6J background carrying a deletion in the structural H19 gene (3 kb) and 10 kb of 5 flanking
Detection of 549 new HLA alleles in potential stem cell donors from the United States, Poland and Germany
 HLA ISSN 2059-2302 BRIEF COMMUNICATION Detection of 549 new HLA alleles in potential stem cell donors from the United States, Poland and Germany C. J. Hernández-Frederick 1, N. Cereb 2,A.S.Giani 1, J.
SUPPLEMENTARY INFORMATION
 doi:10.1038/nature11095 Supplementary Table 1. Summary of the binding between Angptls and various Igdomain containing receptors as determined by flow cytometry analysis. The results were summarized from
Expression of Selected Inflammatory Cytokine Genes in Bladder Biopsies
 Borneo Journal of Resource Science and Technology (2013) 3(2): 15-20 Expression of Selected Inflammatory Cytokine Genes in Bladder Biopsies EDMUND UI-HANG SIM *1, NUR DIANA ANUAR 2, TENG-AIK ONG 3, GUAN-
Molecular Hematopathology Leukemias I. January 14, 2005
 Molecular Hematopathology Leukemias I January 14, 2005 Chronic Myelogenous Leukemia Diagnosis requires presence of Philadelphia chromosome t(9;22)(q34;q11) translocation BCR-ABL is the result BCR on chr
Viral hepatitis, which affects half a billion people
 GASTROENTEROLOGY 2006;130:435 452 BASIC LIVER, PANCREAS, AND BILIARY TRACT Natural Killer Cells Ameliorate Liver Fibrosis by Killing Activated Stellate Cells in NKG2D-Dependent and Tumor Necrosis Factor
SUPPLEMENTAL FIGURE 1
 SUPPLEMENTL FIGURE 1 C Supplemental Figure 1. pproach for removal of snorns from Rpl13a gene. () Wild type Rpl13a exonintron structure is shown, with exo in black and intronic snorns in red rectangles.
Loyer, et al. microrna-21 contributes to NASH Suppl 1/15
 Loyer, et al. microrna-21 contributes to NASH Suppl 1/15 SUPPLEMENTARY MATERIAL: Liver MicroRNA-21 is Overexpressed in Non Alcoholic Steatohepatitis and Contributes to the Disease in Experimental Models
Sunitinib, an orally available receptor tyrosine kinase inhibitor, induces monocytic
 Sunitinib, an orally available receptor tyrosine kinase inhibitor, induces monocytic differentiation of acute myeogenouse leukemia cells that is enhanced by 1,25-dihydroxyviatmin D 3. To the Editor: Sunitinib,
Nature Genetics: doi: /ng Supplementary Figure 1
 Supplementary Figure 1 MSI2 interactors are associated with the riboproteome and are functionally relevant. (a) Coomassie blue staining of FLAG-MSI2 immunoprecipitated complexes. (b) GO analysis of MSI2-interacting
Supporting Information
 Supporting Information Malapeira et al. 10.1073/pnas.1217022110 SI Materials and Methods Plant Material and Growth Conditions. A. thaliana seedlings were stratified at 4 C in the dark for 3 d on Murashige
Lezione 10. Sommario. Bioinformatica. Lezione 10: Sintesi proteica Synthesis of proteins Central dogma: DNA makes RNA makes proteins Genetic code
 Lezione 10 Bioinformatica Mauro Ceccanti e Alberto Paoluzzi Lezione 10: Sintesi proteica Synthesis of proteins Dip. Informatica e Automazione Università Roma Tre Dip. Medicina Clinica Università La Sapienza
Supplementary Information. Bamboo shoot fiber prevents obesity in mice by. modulating the gut microbiota
 Supplementary Information Bamboo shoot fiber prevents obesity in mice by modulating the gut microbiota Xiufen Li 1,2, Juan Guo 1, Kailong Ji 1,2, and Ping Zhang 1,* 1 Key Laboratory of Tropical Plant Resources
Nucleotide Sequence of the Australian Bluetongue Virus Serotype 1 RNA Segment 10
 J. gen. Virol. (1988), 69, 945-949. Printed in Great Britain 945 Key words: BTV/genome segment lo/nucleotide sequence Nucleotide Sequence of the Australian Bluetongue Virus Serotype 1 RNA Segment 10 By
(14): DOI: /j.issn ORCID: ( )
: DOI: /j.issn ORCID: ( )") 20 14 2016 04 01 Chinese Journal of Tissue Engineering Research April 1, 2016 Vol.20, No.14 ( 473000). [J]. 2016 20(14):2033-2039. DOI: 10.3969/j.issn.2095-4344.2016.14.008 ORCID: 0000-0002-8672-7109()
20 14 2016 04 01 Chinese Journal of Tissue Engineering Research April 1, 2016 Vol.20, No.14 ( 473000). [J]. 2016 20(14):2033-2039. DOI: 10.3969/j.issn.2095-4344.2016.14.008 ORCID: 0000-0002-8672-7109()
HCV Persistence and Immune Evasion in the Absence of Memory T Cell Help.
 SOM Text HCV Persistence and Immune Evasion in the Absence of Memory T Cell Help. Arash Grakoui 1, Naglaa H. Shoukry 2, David J. Woollard 2, Jin-Hwan Han 1, Holly L. Hanson 1, John Ghrayeb 3, Krishna K.
Supplementary information
 Supplementary information Unique polypharmacology nuclear receptor modulator blocks inflammatory signaling pathways Mi Ra Chang 1, Anthony Ciesla 1, Timothy S. Strutzenberg 1, Scott J. Novick 1, Yuanjun
PATIENTS AND METHODS. Subjects
 PATIENTS AND METHODS Subjects Twenty-nine morbidly obese subjects involved in a gastric surgery program were enrolled in the study between October 25 and March 21. Bariatric surgery was performed in patients
CHAPTER 4 RESULTS. showed that all three replicates had similar growth trends (Figure 4.1) (p<0.05; p=0.0000)
 (p<0.05; p=0.0000)") CHAPTER 4 RESULTS 4.1 Growth Characterization of C. vulgaris 4.1.1 Optical Density Growth study of Chlorella vulgaris based on optical density at 620 nm (OD 620 ) showed that all three replicates had similar
CHAPTER 4 RESULTS 4.1 Growth Characterization of C. vulgaris 4.1.1 Optical Density Growth study of Chlorella vulgaris based on optical density at 620 nm (OD 620 ) showed that all three replicates had similar
CYTOKINE RECEPTORS AND SIGNAL TRANSDUCTION
 CYTOKINE RECEPTORS AND SIGNAL TRANSDUCTION What is Cytokine? Secreted popypeptide (protein) involved in cell-to-cell signaling. Acts in paracrine or autocrine fashion through specific cellular receptors.
Mutation Screening and Association Studies of the Human UCP 3 Gene in Normoglycemic and NIDDM Morbidly Obese Patients
 Mutation Screening and Association Studies of the Human UCP 3 Gene in Normoglycemic and NIDDM Morbidly Obese Patients Shuichi OTABE, Karine CLEMENT, Séverine DUBOIS, Frederic LEPRETRE, Veronique PELLOUX,
SUPPLEMENTARY INFORMATION Glucosylceramide synthase (GlcT-1) in the fat body controls energy metabolism in Drosophila
 in the fat body controls energy metabolism in Drosophila") SUPPLEMENTARY INFORMATION Glucosylceramide synthase (GlcT-1) in the fat body controls energy metabolism in Drosophila Ayako Kohyama-Koganeya, 1,2 Takuji Nabetani, 1 Masayuki Miura, 2,3 Yoshio Hirabayashi
SUPPLEMENTARY INFORMATION Glucosylceramide synthase (GlcT-1) in the fat body controls energy metabolism in Drosophila Ayako Kohyama-Koganeya, 1,2 Takuji Nabetani, 1 Masayuki Miura, 2,3 Yoshio Hirabayashi
SUPPLEMENTAL METHODS Cell culture RNA extraction and analysis Immunohistochemical analysis and laser capture microdissection (LCM)
") SUPPLEMENTAL METHODS Cell culture Human peripheral blood mononuclear cells were isolated from healthy donors by Ficoll density gradient centrifugation. Monocyte differentiation to resting macrophages ()
SUPPLEMENTAL METHODS Cell culture Human peripheral blood mononuclear cells were isolated from healthy donors by Ficoll density gradient centrifugation. Monocyte differentiation to resting macrophages ()
Single-Molecule Analysis of Gene Expression Using Two-Color RNA- Labeling in Live Yeast
 Supplemental Figures, Tables and Results Single-Molecule Analysis of Gene Expression Using Two-Color RNA- Labeling in Live Yeast Sami Hocine 1, Pascal Raymond 2, Daniel Zenklusen 2, Jeffrey A. Chao 1 &
ECM1 controls T H 2 cell egress from lymph nodes through re-expression of S1P 1
 ZH, Li et al, page 1 ECM1 controls T H 2 cell egress from lymph nodes through re-expression of S1P 1 Zhenhu Li 1,4,Yuan Zhang 1,4, Zhiduo Liu 1, Xiaodong Wu 1, Yuhan Zheng 1, Zhiyun Tao 1, Kairui Mao 1,
What do you think of when you here the word genome?
 What do you think of when you here the word genome? What do you think of when you here the word genome? Personal Genomics Outline Review of pre-lab work Genomics and Medicine Case Overview & Assignment
Isolate Sexual Idiomorph Species
 SUPLEMENTARY TABLE 1. Isolate identification, sexual idiomorph and species of each isolate used for MAT locus distribution in Paracoccidioides species. Isolate Sexual Idiomorph Species Pb01 MAT1-1 P. lutzii
SUPPLEMENTARY RESULTS
 SUPPLEMENTARY RESULTS Supplementary Table 1. hfpr1- Flpln-CHO hfpr2-flpln-cho pec 50 E max (%) Log( /K A) Log( /K A) N pec 50 E max (%) Log( /K A) Log( /K A) n ERK1/2 phosphorylation fmlp 9.0±0.6 80±7
Structure and Function of Fusion Gene Products in. Childhood Acute Leukemia
 Structure and Function of Fusion Gene Products in Childhood Acute Leukemia Chromosomal Translocations Chr. 12 Chr. 21 der(12) der(21) A.T. Look, Science 278 (1997) Distribution Childhood ALL TEL-AML1 t(12;21)
Supplementary data Supplementary Figure 1 Supplementary Figure 2
 Supplementary data Supplementary Figure 1 SPHK1 sirna increases RANKL-induced osteoclastogenesis in RAW264.7 cell culture. (A) RAW264.7 cells were transfected with oligocassettes containing SPHK1 sirna
Figure S1. Generation of inducible PTEN deficient mice and the BMMCs (A) B6.129 Pten loxp/loxp mice were mated with B6.
 B6.129 Pten loxp/loxp mice were mated with B6.") Figure S1. Generation of inducible PTEN deficient mice and the BMMCs (A) B6.129 Pten loxp/loxp mice were mated with B6.129-Gt(ROSA)26Sor tm1(cre/ert2)tyj /J mice. To induce deletion of the Pten locus,
Figure S1. Generation of inducible PTEN deficient mice and the BMMCs (A) B6.129 Pten loxp/loxp mice were mated with B6.129-Gt(ROSA)26Sor tm1(cre/ert2)tyj /J mice. To induce deletion of the Pten locus,
~Lentivirus production~
 ~Lentivirus production~ May 30, 2008 RNAi core R&D group member Lentivirus Production Session Lentivirus!!! Is it health threatening to lab technician? What s so good about this RNAi library? How to produce
BMP6 treatment compensates for the molecular defect and ameliorates hemochromatosis in Hfe knockout mice
 SUPPLEMENTARY MATERIALS BMP6 treatment compensates for the molecular defect and ameliorates hemochromatosis in Hfe knockout mice Elena Corradini, Paul J. Schmidt, Delphine Meynard, Cinzia Garuti, Giuliana
Characterizing intra-host influenza virus populations to predict emergence
 Characterizing intra-host influenza virus populations to predict emergence June 12, 2012 Forum on Microbial Threats Washington, DC Elodie Ghedin Center for Vaccine Research Dept. Computational & Systems
Supplementary Fig. 1 No relative growth advantage of Foxp3 negative cells.
 Supplementary Fig. 1 Supplementary Figure S1: No relative growth advantage of Foxp3 negative cells. itreg were induced from WT (A) or FIR (B) CD4 + T cells. FIR itregs were then removed from the TCR signal
The Effect of Epstein-Barr Virus Latent Membrane Protein 2 Expression on the Kinetics of Early B Cell Infection
 The Effect of Epstein-Barr Virus Latent Membrane Protein 2 Expression on the Kinetics of Early B Cell Infection Laura R. Wasil, Monica J. Tomaszewski, Aki Hoji, David T. Rowe* Department of Infectious
Supplementary information
 Supplementary information Full methods The conduct of the study was approved by an NHS research ethical committee prior to commencement (reference 12/WS/0288) and was conducted according to the principles
Supporting Information. Mutational analysis of a phenazine biosynthetic gene cluster in
 Supporting Information for Mutational analysis of a phenazine biosynthetic gene cluster in Streptomyces anulatus 9663 Orwah Saleh 1, Katrin Flinspach 1, Lucia Westrich 1, Andreas Kulik 2, Bertolt Gust
Relationship of the APOA5/A4/C3/A1 gene cluster and APOB gene polymorphisms with dyslipidemia
 elationship of the APOA5/A4/C3/A1 gene cluster and APOB gene polymorphisms with dyslipidemia H.J. Ou 1, G. Huang 2, W. Liu 3, X.L. Ma 2, Y. Wei 4, T. Zhou 5 and Z.M. Pan 3 1 Department of Neurology, The
Supplementary Data. Clinical Setup. References. Program for Embryo Donation
 Supplementary Data Clinical Setup Notwithstanding their value in stem cell research, the source of supernumerary human blastocysts for the derivation of new stem cell lines and the modalities of their
HIV-1 Virus-like Particle Budding Assay Nathan H Vande Burgt, Luis J Cocka * and Paul Bates
 HIV-1 Virus-like Particle Budding Assay Nathan H Vande Burgt, Luis J Cocka * and Paul Bates Department of Microbiology, Perelman School of Medicine at the University of Pennsylvania, Philadelphia, USA