ABOUT THE OFFICE OF THE CHIEF MEDICAL OFFICER OF HEALTH
|
|
|
- Peter Holland
- 6 years ago
- Views:
Transcription
1
2 ABOUT THE DEPARTMENT OF HEALTH AND SOCIAL SERVICES The Department of Health and Social Services, a department of the Yukon Government, coordinates health and social services for the people of Yukon with regional health partners. Our mission is to promote, protect, and enhance the well-being of Yukon people through a continuum of quality, accessible, and appropriate health and social services. ABOUT THE OFFICE OF THE CHIEF MEDICAL OFFICER OF HEALTH The office of the Yukon Chief Medical Officer of Health is responsible for the Department of Health and Social Services legislated responsibility to protect and promote the public s health in a variety of areas. PROJECT TEAM AND ACKNOWLEDGEMENTS This report represents the work of a collaborative initiative across several departments of Yukon Government and the British Columbia Cancer Agency which supports the Yukon Cancer Registry. Catherine Elliott (Executive Lead) Deputy Chief Medical Officer of Health Office of the Chief Medical Officer of Health Department of Health and Social Services Government of Yukon Sherri Wright Assistant Deputy Minister Health Services Department of Health and Social Services Government of Yukon Shauna Demers Vital Statistics Registrar Government of Yukon Shauna Demers Vital Statistics Registrar Government of Yukon The Deputy Chief Medical Officer of Health and the Project Team are grateful for the assistance of a number of individuals who contributed to this report. We are grateful for the technical and analytical work of Jonathan Simkin, Contract Epidemiologist, to the Office of the Chief Medical Officer of Health and Yukon Vital Statistics Registrar who assisted with coordinating the project, writing, analysis and desktop publishing of this report. We thank Dr. Brendan Hanley, Chief Medical Officer of Health Yukon for his support of this project and sage advice throughout the project from inception to completion. We would also like to thank the Yukon Territorial Health Investment Fund and the Canadian Partnership Against Cancer who s support enabled us to complete this report. This publication is available from the Department of Health and Social Services website at: 1
3 CONTACT INFORMATION If you have any questions, feedback, or would like more information on this report, the Yukon Cancer Registry, or the Office of the Chief Medical Officer of Health, please feel free to contact us. Catherine Elliott Deputy Chief Medical Officer of Health, Office of the Chief Medical Officer of Health Health and Social Services Government of Yukon 4 th Floor, 204 Lambert St. PO BOX 2703 Whitehorse, YT, Y1A 2C6, Canada Tel: +1 (867) Fax: Catherine.Elliott@gov.yk.ca CITATION Material appearing in this publication may be reproduced or copied without permission; however, the following citation must be used to indicate the source: Cancer Mortality Trends, , Yukon Cancer Registry. Whitehorse, Yukon. Department of Health and Social Services, Yukon Government; [August, 2017] 2
4 TABLE OF CONTENTS Tables... 4 Figures... 5 Foreward from the Deputy Chief Medical Officer of Health... 6 Executive Summary... 7 About this Report... 8 Glossary Abbreviations Cancer Mortality All-Cancer Mortality Trends Major Cancers in Yukon Trends in Cancer Mortality by Cancer Type All-Cancer Mortality by Sex and Age Groups All-Cancer Mortality by Community Factors that Influence Cancer Mortality Early detection, Screening and Treatment Avoiding Cancer Health Behaviours Tobacco Use Nutrition Body Composition and Obesity Physical Activity and Sedentary Behaviour Alcohol Consumption Infectious Agents Human Papilloma Virus Helicobacter Pylori Hepatitis B Virus and Hepatitis C Virus Environmental Factors Ultraviolet Radiation Radon Recommendations References Appendix I: Methodology Data Sources Analysis Limitations Appendix II: Data Tables
5 TABLES (SEE APPENDIX II FOR DATA TABLES) Table 1. Number of Total Cancer Deaths by Sex and Five-Year Aggregates, Table 2. Number and Proportion of People 65 Years or Older in Yukon Table 3. Yukon All-Cancer Age-Standardized Mortality Rates and Average Rate Change by Sex and Year, Table 4. Canadian All-Cancer Age-Standardized Mortality Rates and Five-Year Average Rate Change by Sex and Year, Table 5. Yukon All-Cancer Standardized Mortality Ratios by Sex Relative to Canadian All-Cancer Mortality Rates, Table 6. Yukon Population by Age Group and Sex June 1999 and Percent Change from June 1999 to June Table 7.1. Number and Proportion of All Male Cancer Deaths by Cancer Type, and Table 7.2. Number and Proportion of All Female Cancer Deaths by Cancer Type, and Table 8.1. Number and Proportion of All Male Cancer Deaths in Yukon and Canada by Cancer Type, Table 8.2. Number and Proportion of All Female Cancer Deaths in Yukon and Canada by Cancer Type, Table 9. Yukon and Canadian Cumulative Five-Year Rolling Age-Standardized Lung Cancer Mortality Rates by Sex, Table 10. Yukon and Canadian Age-Standardized Mortality Rates by Sex and Ten-Year Aggregates for Selected Cancers, Table 11. Yukon Standardized Mortality Ratios Relative to Canadian Cancer Mortality Rates by Sex and Cancer Type, Table 12. Number and Percent Distribution of Cancer Deaths Among Males and Females by Five-Year Aggregates for Selected Cancer Types, Table 13. Population Size and Cancer Deaths by Sex, Age Group and Five-Year Aggregates, Table 14. Number and Proportion of All Cancer Deaths by Community and Five-Year Aggregates, Table 15. All-Cancer Age-Standardized Mortality Rates by Community,
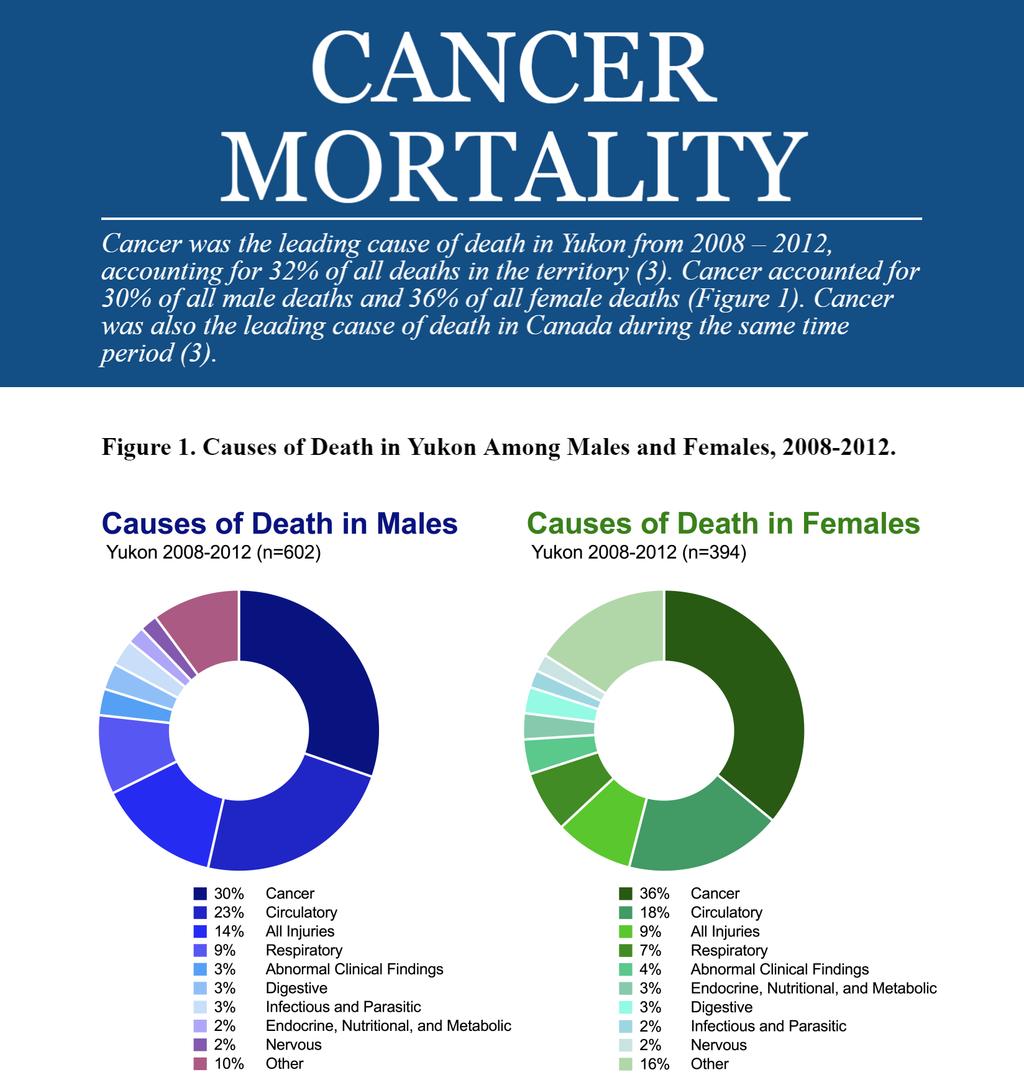
6 FIGURES Figure 1. Causes of Death in Yukon Among Males and Females, Figure 2. Population by Age Group and Sex, June 1999 to June Figure 3. Yukon and Canadian All-Cancer Age-Standardized Mortality Rates by Sex and Year, Figure 4. Standardized Mortality Ratios for All Cancers Combined by Sex Relative to Canadian All-Cancer Mortality Rates, Figure 5.1. Major Cancers Causing Death by Sex, Figure 5.2. Major Cancers Causing Death in Yukon and Canada by Sex, Figure 6.1. Yukon and Canadian Lung Cancer Cumulative Five-Year Rolling Age-Standardized Mortality Rates by Sex, Figure 6.2. Standardized Mortality Ratios for Lung Cancer Relative to Canadian Lung Cancer Mortality Rates, Figure 7.1. Ten-Year Cumulative Age-Standardized Mortality Rate for Select Cancers by Sex in Yukon and Canada, Figure 7.2. Standardized Mortality Ratios for Colorectal Cancer Relative to Canadian Colorectal Cancer Mortality Rates, Figure 7.3. Standardized Mortality Ratios for Female Breast Cancer Relative to Canadian Female Breast Cancer Mortality Rates, Figure 7.4. Standardized Mortality Ratios for Prostate Cancer Relative to Canadian Prostate Cancer Mortality Rates, Figure 7.5. Standardized Mortality Ratios for Stomach Cancer Relative to Canadian Stomach Cancer Mortality Rates, Figure 8. Age-Specific Cumulative Five-Year Rolling Mortality Rates for All Cancers Combined by Sex, Figure 9. All-Cancer Cumulative Five-Year Age-Standardized Mortality Rates by Community,

7 Cancer can take a heavy toll on a person physically, emotionally, socially and spiritually. Each person with cancer has a unique story about their cancer journey and how it has affected them, their family and community. Many Yukoners who have not themselves had cancer, have been touched by cancer in a friend, neighbor or loved one. Perhaps this is why cancer is such a growing concern for Yukoners. We want to understand why cancer is occurring, whether the rates are higher than they should be and what we can do to reduce suffering and disease from cancer. With this in mind it is my great pleasure to present Cancer Mortality Trends This report provides the first comprehensive analysis of cancer mortality in Yukon. We provide valuable information about major causes of cancer death in Yukon and trends across 15 years. We examine differences between males and females and between Whitehorse and other towns and communities. Throughout the analysis we compare mortality rates for the Yukon population to those for Canada. Then we take a closer look at the causes of cancer, the risk factors that make a person more likely to develop disease as well as factors that can protect a person from developing disease. Cancer Mortality Trends shows that cancer is the leading cause of death for Yukoners and lung cancer is the most common cause of cancer death. With this unpleasant news we offer some positive directions: recommendations to improve cancer outcomes for the major causes of cancer deaths in Yukon, recommendations that are grounded in current evidence and best practice. We also outline ways to maintain and improve on the high standard of data management in Yukon Cancer Registry so that we are able to quantify new cancer diagnoses, examine stage at diagnosis and track mortality over time. This would lead to better cancer information to provide the evidence to prioritize new and to measure effectiveness of existing cancer control initiatives. Overall we recommend a coordinated approach to cancer control in Yukon with close collaboration across Yukon Government and between Yukon Government and First Nations. Cancer Mortality Trends will be useful for many Yukoners. Health care administrators and policy makers will find valuable information to help them prioritize programs across the spectrum of cancer control from prevention through to end-of-life care. Health care providers can use this information to set the disease of their patients into the Yukon context. Community leaders and members will have more information than ever to inform their work to prevent cancer, to promote screening and to improve the lives of those with cancer. I hope that this report will help Yukoners better understand cancer mortality in Yukon and motivate us to work collaboratively to limit the onset of cancer and reduce the harms of cancer when it occurs. Catherine Elliott Deputy Chief Medical Officer of Health 6
8 7
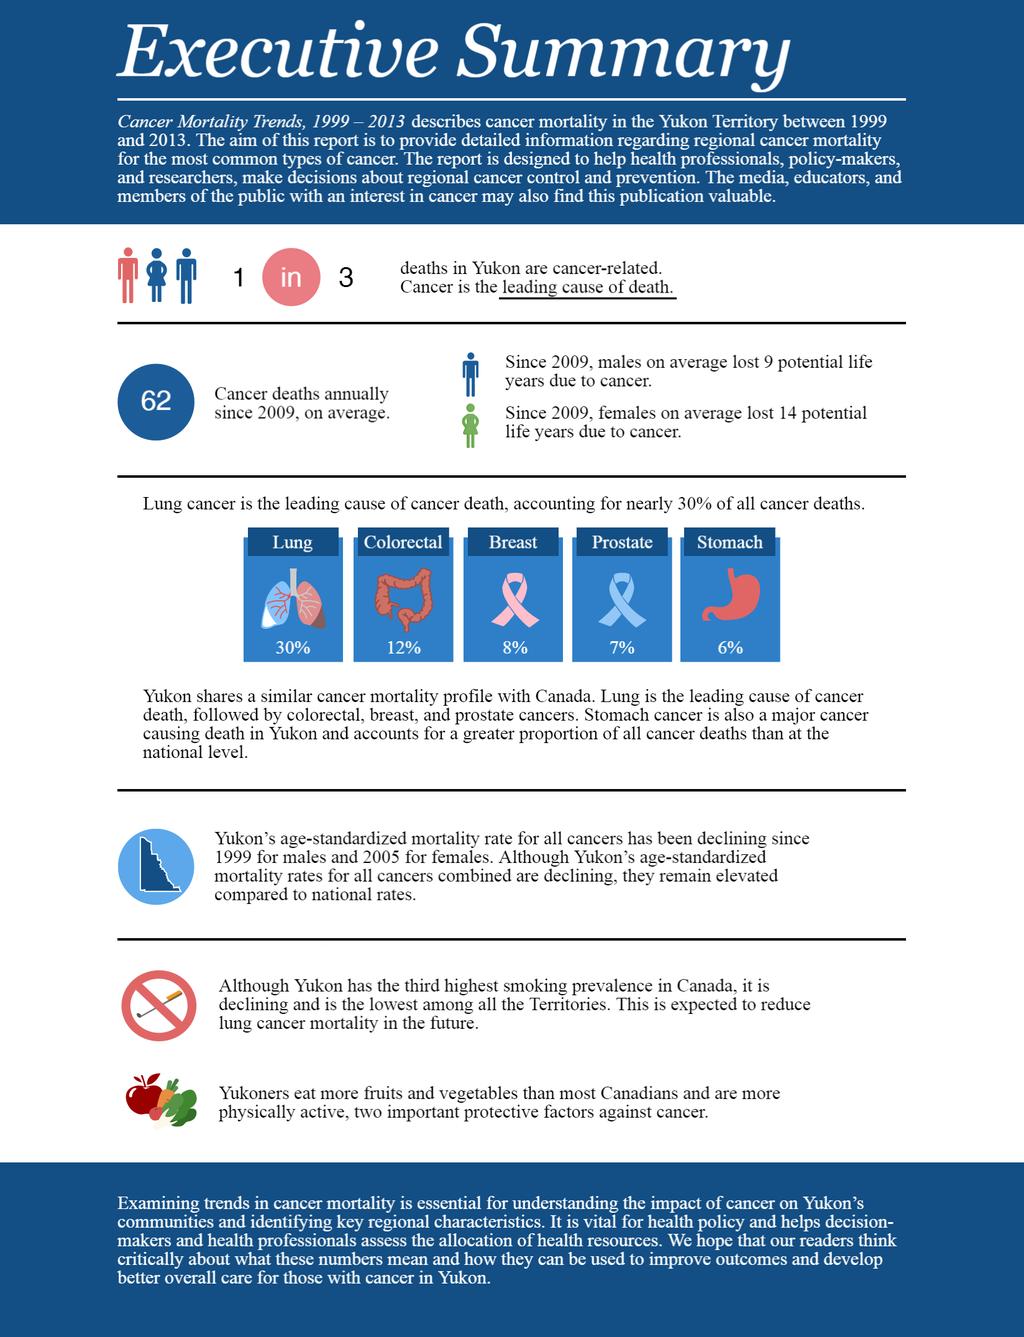
9 ABOUT THIS REPORT Purpose and Intended Audience Cancer Mortality Trends, describes cancer mortality in the Yukon Territory between 1999 and The aim of this report is to provide detailed information regarding regional cancer mortality for the most common types of cancer. The report is designed to help health professionals, policy-makers, and researchers make decisions about regional cancer control and prevention. The media, educators, and members of the public with an interest in cancer may also find this publication valuable. Yukon Cancer Registry The Yukon Cancer Registry is a population-based registry of all cancers diagnosed in Yukon residents. The purpose of a population-based cancer registry is to collect information required to plan and evaluate cancer-control activities for the population. The Yukon Cancer Registry is overseen by the Department of Health and Social Services, which contracts the British Columbia Cancer Agency (BCCA) (an agency of the Provincial Health Services Authority) to build and maintain a separate territorial registry within its infrastructure. The registry was built in 1987 and began to enter and stage all Yukon cancer cases diagnosed from 2010 and onwards. Today, the Yukon Cancer Registry receives notifications of cancer from many sources including diagnostic laboratories, health care providers, and vital statistics. The Yukon Cancer Registry contains personal and demographic information, information about the specific cancer diagnosis, as well as mortality information received from the Yukon Vital Statistics Registry. Cancer registries across Canada are used to generate cancer statistics that describe trends and regional differences in cancer incidence and mortality, project future service needs, and evaluate patient outcomes and the effectiveness of cancer control programs. The data generated also support important research into the causes, prevention, screening, diagnosis and clinical management of cancer and the demand it places on the public health care system. Scope of Report This report conveys the most up to date information available for cancer mortality in Yukon. Since the annual number of cancer cases and deaths is relatively small in statistical terms, data were aggregated in five and ten-year groups based on year of death to produce more stable rates and enable meaningful statistical analysis. Accurate reporting of cancers is especially important in Yukon as cancer statistics in jurisdictions with small populations are sensitive to small changes in the number of cases. The methodology used in preparation and analysis of Yukon data reflects these considerations (Appendix I: Methodology). Data tables can be found at the end of this report in Appendix II: Data Tables. In this report, we examined cancer mortality only in residents of Yukon. Therefore, former residents of Yukon who were residing elsewhere at the time of death were not included in these analyses. Information on cancer mortality trends are based on data extracted from the Yukon Cancer Registry and Yukon Vital Statistics Registry. Trends were compared to national level data obtained from Statistics Canada s Canadian Socioeconomic Information Management (CANSIM) database (1). 8
10 Cautions on Interpretation Many of the rates presented in this report have a large degree of uncertainty due to the small number of cancer deaths. For example, as cancer deaths are further categorized by sex, year and cancer type, the numbers in each sub-category drops substantially, resulting in increasingly imprecise rates for the smallest groups. To limit the uncertainty, data were aggregated to five-year periods and in some cases ten-year periods were used. Although aggregating data may limit uncertainty, the aggregated estimates may not be truly reflective of current estimates. When examining rates, the reader is cautioned to consider the number of cases and the period upon which the estimate is based on. Confidentiality Data in this report are presented in such a way to prevent the identification of individuals with cancer. For this reason, cells with less than five cases, which can occur for rare cancers and when stratifying (e.g. by age, sex and year), have been suppressed from presentation. 9
11 GLOSSARY Age-standardized mortality rate The number of cancer deaths per 100,000 people, standardized to the age structure of the 1991 Canadian population to account for changes in age distribution over time. Standardized mortality ratio A ratio comparing the number of observed cancer deaths to the expected number of cancer deaths, relative to Canadian age-specific cancer mortality rates for a given time period. It is reported as a percent, that is, 100% means the number of observed cancer deaths equaled the expected number. A percentage greater than 100% indicates that there were more observed cancer deaths than expected. For example, if the standardized mortality ratio between population A and B was 110%, the observed number of cancer deaths in population A was 10% greater than expected relative to the age-specific mortality rates of population B. If the standardized mortality ratio was 90%, the observed number of cancer deaths in population A was 10% less than expected. Cancer incidence The number of new cancer cases of a specific cancer type per person in the general population. Cancer incidence rate The number of new cancers of a specific cancer type occurring in a specified population during a given period of time. The cancer rate is expressed as the number of new cancers per 100,000 persons. Cancer mortality The number of deaths attributed to a specific cancer type for a given time period. Cancer mortality rate The number of cancer deaths of a specific cancer type occurring in a specified population during a given period of time. The cancer rate is expressed as the number of cancer deaths per 100,000 persons. Confidence intervals Confidence intervals help quantify statistical uncertainty associated with estimates such as age-standardized mortality rates. Confidence intervals are often expressed as 95% lower and upper intervals. That is, we are 95% confident that the true value lies within the lower and upper confidence intervals. Potential years of life lost The average number of additional years a person would have lived if he or she had not died prematurely. Years of life lost is a measure of premature mortality. For this report, Yukon sex-specific life expectancies were used as references and obtained from Statistics Canada (2). 10
12 ABBREVIATIONS ASMR Age-standardized mortality rate BC British Columbia BMI Body Mass Index CA Canada CANSIM Canadian Socioeconomic Information Management Database CI Confidence Intervals HBV Hepatitis B Virus HCV Hepatitis C Virus HPV Human Papilloma Virus PAP Papanicolauo test; also known as Pap test or Pap Smear. SMR Standardized mortality ratio UVR Ultraviolet Radiation YCR Yukon Cancer Registry 11
13 12

14 ALL-CANCER MORTALITY TRENDS From 1999 to 2013, there were an average of 54 cancer-related deaths annually among Yukon residents. In the most recent period from 2009 to 2013, this figure had increased to 62 cancer-related deaths annually. Among males, the annual number of cancer deaths ranged from 22 to 39, whereas among females, the annual number of cancer deaths ranged from 13 to 33. The wide variation in the number of cases per year can be attributed to both the increasing number of annual cancer deaths since 1999 and the expected random variation within a small population. On average, from 1999 to 2013, the number of potential years of life lost due to cancer death was 12 for males and 15 for females. Since 2009, these figures have decreased slightly where males on average lost 9 potential life years and females lost 14 potential life years. The overall number of cases for all cancers combined among males and females is shown in Table 1. The number of cancer deaths among males and females nearly doubled between 1999 and 2013 (Table 1). This is largely due to population aging and growth. Similar observations have been seen at the national level (3). Table 1. Number of Total Cancer Deaths by Sex and Five-Year Aggregates, Year Males Females Total Total Population aging and growth in Yukon Since 1999, Yukon s population has been aging and growing (Figure 2). Population aging and growth have important health implications. That is, as the population ages we can expect a greater number of individuals developing diseases that are strongly linked with age, like cancer. Similarly, as the population grows, the actual number of cases and deaths are expected to increase, that is, if rates remain constant. Figure 2. Population by Age Group and Sex, June 1999 to June Yukon s population grew by approximately 17% since 1999 (Table 6). The population has aged as well (Figure 2). The number of Yukoners aged 65 years or older has increased as a proportion of the total population since 1999 (Table 2). 13
15 All-cancer mortality trends Since 1999, the all-cancer age-standardized mortality rate (ASMR) has been declining for males. Among females, the all-cancer ASMR peaked in approximately 2005 and declined thereafter (Figure 3). How do Yukon and Canada compare? Yukon s ASMRs are elevated compared to Canadian rates (Figure 3, Tables 3 and 4). Among males, Yukon s rate has been declining similar to the national rate. Among females, Yukon s rate has been declining after peaking in approximately The Canadian rate has been declining since the early 1990 s (3). Figure 4 shows Yukon s observed number of all cancer deaths compared to the expected number of cancer deaths relative to agespecific Canadian all-cancer mortality rates from 2008 to The total number of observed cancer deaths in Yukon was 21% higher than expected relative to Canadian rates. Figure 3. Yukon and Canadian All-Cancer Age-Standardized Mortality Rates by Sex and Year, Figure 4. Standardized Mortality Ratios for All Cancers Combined by Sex Relative to Canadian All-Cancer Mortality Rates, When separated by sex, a statistically significant difference was detected in females but not males. Cancer mortality in Yukon females was 25% higher than would be expected relative to Canadian female rates. Among Yukon males, cancer mortality was 14% greater than expected however, this was not statistically significant. What do these statistics mean? While all-cancer mortality rates in Yukon are declining, they are elevated compared to national rates. Nationally, rates have been declining for the past two decades (3). Declining trends are attributed to reductions in cancer incidence through cancer prevention efforts, such as cancer screening and reductions in smoking among Canadians, as well as improvements in cancer care (3). There is a clear gap in cancer mortality between Yukon and Canada and this difference is largely due to differences in rates for certain types of cancer, which will be discussed in the following sections. Although Yukon s all-cancer mortality rates are declining, the actual number of cancer deaths continues to increase due to the aging and growth of the population (4). This is well documented at the national level as well (3). This has implications for health policy and resource planning. Measuring cancer deaths over time allows us to evaluate efforts to reduce cancer deaths and improve survival. It also allows us to project potential resource implications for Yukon s healthcare system. 14
. Figure 5.1. Major Cancers Causing Death by Sex, 2009-2013. Tables 7.1 and 7.")
16 MAJOR CANCERS IN YUKON In the past two decades, lung, colorectal, breast, and prostate cancers were the most common causes of cancer death in Yukon. They remain to be the most common cancers causing death in (Figure 5.1). Figure 5.1. Major Cancers Causing Death by Sex, Tables 7.1 and 7.2 show the number of cancer deaths in Yukon among males and females for major cancers. From 2009 to 2013, there were 308 cancer deaths. The major cancers causing death in both males and females, that is, lung, colorectal, breast, and prostate cancers, account for approximately 50% of all cancer deaths among both sexes combined. Approximately a third of cancer deaths were caused by other cancers, a category that summarizes several cancer types that are less common. Leading causes of cancer deaths: Lung cancer was the leading cause of cancer death for both sexes. It was responsible for approximately equal proportions of all cancer deaths in males and females. Colorectal cancer was the second most common cause of cancer death for males and third most common for females. Breast cancer was the second most common cause of cancer death for females. Prostate cancer was the third most common cause of cancer death in males. Although it is much less diagnosed than many other cancers, stomach cancer is the fourth leading cause of cancer death in males and fifth in females. Pancreatic cancer was the fourth most common cancer among females and the sixth among males. 15
.")
17 How do Yukon and Canada compare? Figure 5.2 and Tables 8.1 and 8.2 compare the number of cancer deaths and proportion of all cancer deaths by cancer type in Yukon and Canada. Yukon and Canada share a similar cancer mortality profile, in which the most common cancers causing death are lung, colorectal, breast, and prostate cancers (3). Notably, stomach cancer mortality accounts for a greater proportion of all cancer deaths in Yukon than it does nationally. Stomach cancer accounted for 7% of all Yukon cancer deaths in males and 4% in females, nearly double that of national figures (3). Pancreatic cancer, a highly fatal cancer, was the fourth most common cause of cancer death among males and females in Canada. From 2008 to 2012, it was the fourth most common cancer causing death in Yukon females and sixth in males (3% of all cancer deaths). Figure 5.2. Major Cancers Causing Death in Yukon and Canada by Sex, What do these statistics mean? While some of the causes of cancer mortality follow national trends, certain causes stand out in Yukon. Lung cancer is the leading cause of cancer death, followed by colorectal, breast and prostate cancers. These are the major cancers causing death in both Yukon and Canada (3). Stomach cancer is a major cancer causing death in Yukon. It represents a greater proportion of cancer deaths in Yukon compared to Canada. It is not clear why this is occurring. Understanding the risk factors for stomach cancer and their prevalence in Yukon will be critical for identifying measures to reduce stomach cancer-related deaths (see Factors That Influence Cancer Mortality). Overall, identifying the major cancers in Yukon and comparing these to national statistics helps inform decision-makers and health professionals on regional characteristics for health planning. 16
.")
18 TRENDS IN CANCER MORTALITY BY CANCER TYPE Tables 9 to 11 and Figures 6 and 7 show ASMRs and SMRs for the most common cancers causing death. SMRs compare Yukon s cancer-specific mortality to that which would be expected relative to age-specific Canadian cancer mortality rates (Table 10, Figures 6-7). Lung cancer Among males, Yukon s lung cancer mortality rate has been declining since In contrast, the Yukon female rate has been increasing since but appears to be reaching a plateau in the last 5-year period (Figure 6.1). Figure 6.1. Yukon and Canadian Lung Cancer Cumulative Five-Year Rolling Age-Standardized Mortality Rates by Sex, In , Yukon s observed lung cancer mortality was 21% and 45% higher in males and females, respectively, compared to that which would be expected relative to Canadian rates (Figure 6.2). Among females and males combined, lung cancer mortality in Yukon was 33% greater expected relative to Canadian rates. A statistically significant finding was found among females and among males and females combined. 1 Figure 6.2. Standardized Mortality Ratios for Lung Cancer Relative to Canadian Lung Cancer Mortality Rates, As cancer deaths are further categorized by sex, year and cancer type, the numbers in each sub-category drops substantially, resulting in increasingly imprecise rates for the smallest groups. Due to small numbers, statistical significance is often not reached and confidence intervals widen. 17
.")
19 Figure 7.1. Ten-Year Cumulative Age-Standardized Mortality Rates for Select Cancers by Sex in Yukon and Canada, Colorectal cancer From , the mortality rate from colorectal cancer was elevated in Yukon versus Canada, for males and females (Figure 7.1). In the most recent 5-year period, Yukon s observed colorectal cancer mortality was 36% and 44% greater in males and females, respectively, than expected relative to Canadian rates; neither estimate was statistically significant (Figure 7.2). 1 Figure 7.2. Standardized Mortality Ratios for Colorectal Cancer Relative to Canadian Colorectal Cancer Mortality Rates, As cancer deaths are further categorized by sex, year and cancer type, the numbers in each sub-category drops substantially, resulting in increasingly imprecise rates for the smallest groups. Due to small numbers, statistical significance is often not reached and confidence intervals widen. 18
20 Breast cancer From , the female breast cancer mortality rate was slightly elevated in Yukon versus Canada (Figure 7.1). Yukon s observed female breast cancer mortality was 13% greater than expected relative to Canadian rates (Figure 7.3). However, the difference was not statistically significant. 1 Estimates represent cumulative mortality over a tenyear period and may not be truly reflective of the current rate. Figure 7.3. Standardized Mortality Ratios for Female Breast Cancer Relative to Canadian Female Breast Cancer Mortality Rates, Prostate cancer From the mortality rate for prostate cancer was elevated in Yukon versus Canada (Figure 7.1). Yukon s observed prostate cancer mortality between 2003 and 2012 was 42% greater than expected, relative to Canadian rates (Figure 7.4). However, the difference was not statistically significant. 1 Figure 7.4. Standardized Mortality Ratios for Prostate Cancer Relative to Canadian Prostate Cancer Mortality Rates, As cancer deaths are further categorized by sex, year and cancer type, the numbers in each sub-category drops substantially, resulting in increasingly imprecise rates for the smallest groups. Due to small numbers, statistical significance is often not reached and confidence intervals widen. 19
. The difference was statistically significant.")
21 Stomach cancer From , the mortality rate for stomach cancer among both sexes was elevated in Yukon versus Canada (Figure 7.1). Yukon s observed stomach cancer mortality between 2003 and 2012 was 84% greater than expected, relative to Canadian rates (Figure 7.5). The difference was statistically significant. 1 We could not further categorize stomach cancer mortality by sex because the number of deaths for this period was too small. Figure 7.5. Standardized Mortality Ratios for Stomach Cancer Relative to Canadian Stomach Cancer Mortality Rates, What do these statistics mean? Yukon s overall cancer mortality rate is higher than Canada s and this difference is driven by cancer-specific trends. Mortality rates for major cancers are generally elevated in Yukon compared to Canada. Notably, lung cancer mortality among Yukon females is elevated compared to the Canadian female population. In Yukon, female lung cancer mortality has been increasing since 1999 but the rate of increase is slowing in more recent years. Nationally, the female lung cancer mortality rate peaked around 2005 (3). For males, national lung cancer mortality rates have been declining since the late 1980 s (3). The gap in lung cancer mortality is likely related to smoking prevalence in Yukon, which is elevated compared to national counterparts (5). Approximately 26% of Yukon s population are daily or occasional smokers (5). This is elevated compared to Canada as a whole, where approximately 15% of Canadians are daily or occasional smokers. Additionally, the difference in smoking prevalence between Yukon females and other Canadian females is greater than their male counterparts (3,5). This is likely related to the marked difference in lung cancer mortality rates between Yukon females and the Canadian female population. Despite a higher smoking prevalence, it is declining in the Territory. Before 2010, greater than 30% of the population were daily or occasional smokers (5). Reductions in Yukon s smoking prevalence will likely reduce the lung cancer death rate in the future. Presently, Yukon s male trend is declining and similar to what is seen nationally (3). 20
22 ALL-CANCER MORTALITY BY SEX AND AGE GROUPS Mortality by sex Cancer mortality rates vary between different age groups and by sex. Examining cancer deaths by sex and age provides a sense of who is dying from cancer and therefore, help inform planning for targeted cancer control services. In , 56% of all cancer deaths occurred among males and 44% among females (Table 12). Although rates are higher relative to Canadian rates (see section All-Cancer Mortality Trends), the relative proportion of cancer deaths in males versus females is similar to that of Canada for a similar time period (3). The distribution of all cancer deaths by sex does not appear to have changed since 1999 however, the distribution by cancer type has changed. Deaths due to lung cancer among males and females have changed substantially in the past two decades (Table 12). Overall, 61% of lung cancer deaths occurred among males and 39% among females. In contrast during , male deaths accounted for 54% of all lung cancer deaths while females accounted for 46%. This is reflective of the declining lung cancer mortality rate in males and the increasing lung cancer mortality rate in females. Mortality by age During 2009 to 2013, almost 53% of cancer deaths in Yukon occurred in people aged 70 years and older, with the median age for all cancer deaths being 69. In Canada, 62% of cancer deaths occur in people aged 70 years and older (3). Yukoners aged 70 years or older accounted for 53% of all cancer deaths. Yukoners aged years accounted for an additional 29%. Yukoners aged 0 59 years accounted for 18% of all cancer deaths. Older adults account for the largest proportion of deaths from the most common cancers. Figure 8. Age-Specific Cumulative Five-Year Rolling Mortality Rates for All Cancers Combined by Sex, Trends over time Cancer mortality rates have changed to varying degrees over time for different age groups (Figure 8). Mortality rates for 0-39 years were suppressed due to low numbers of cancer death. While mortality rates for age groups below 70 years have decreased or remained stable, the same cannot be said about those aged 70 years or older. Mortality rates in those aged 70 years or older are reflective of the all-cancer ASMRs in Figure 2, as they account for the majority of cancers in Yukon. The mortality rate in males 70+ years has steadily declined since In females 70+ years, the mortality rate has increased since though, appears to have peaked around and decreased thereafter. 21
23 What do these statistics mean? Yukon s cancer death rates are generally higher for males compared to females, which is also seen at the national level (3). The sex distribution of cancer deaths for most cancers has remained relatively stable over the past two decades, except for lung cancer. Female lung cancer deaths as a proportion of all lung cancer deaths in Yukon has steadily increased since If lung cancer trends continue as they are, it is possible that females will account for a greater proportion of all lung cancer deaths in Yukon within the coming decades. Approximately half of cancer deaths in Yukon occur among those 70 years or older, which appears less than the proportion observed at the national level for this age group (3). This suggests that cancer deaths occur at younger ages in Yukon, resulting in a greater number of potential life years lost. It would be valuable to evaluate the stage at detection for cancers in Yukon to determine whether we are detecting cancers as early as possible. Investigating these areas further will be essential for improving cancer outcomes in Yukon. 22
.")
24 ALL-CANCER MORTALITY BY COMMUNITY Currently, Yukon is home to approximately 38,200 residents. Roughly three-quarters of the population live in and around Whitehorse, the Territory s capital and urban center (6). Apart from Whitehorse, the two largest communities are Dawson City and Watson Lake, and the rest of the population live in communities around the Territory (6). Figure 9. All-Cancer Cumulative Five-Year Age-Standardized Mortality Rates by Community, Approximately two-thirds of all cancer deaths in Yukon occurred in Whitehorse residents (Table 14). Figure 9 shows all-cancer cumulative five-year ASMRs corresponding to different communities in Yukon (Table 15). Areas outside of Whitehorse had elevated rates relative to Whitehorse, although this was not statistically significant. 1 As cancer deaths are further categorized by community category, the number of cancer cases in each sub-category drops. This results in increasingly imprecise rates for the smallest groups, which is reflected by wider confidence intervals around the estimated rate. 1 This means we are less certain of the estimates. Differences in cancer mortality between urban, rural and remote communities are not anomalous to Yukon and have been previously reported in Canada (7 11). A recent Pan-Canadian report found that cancer mortality rates among rural Canadians for lung and colorectal cancer were higher compared to urban counterparts (7). 3 In terms of factors that influence cancer mortality, such as early detection, screening and treatment, rural Canadians residing in British Columbia and Ontario have been found to access these services less than their urban counterparts (7,9 11). 1 As cancer deaths are further categorized by sex, year, cancer type and community category, the numbers in each sub-category drops substantially, resulting in increasingly imprecise rates for the smallest groups. Due to small numbers, statistical significance is often not reached and confidence intervals widen. 23
25 FACTORS THAT INFLUENCE CANCER MORTALITY Yukon s cancer mortality rates are declining however, compared to national rates they are elevated overall and for several cancers. Trends in cancer mortality are related to a variety of factors such as the stage of the cancer at diagnosis and the availability of early detection, diagnostic and treatment services. Additionally, cancer is influenced by non-modifiable factors, like our genetic composition, and modifiable factors, like smoking and what we eat. Research indicates that half of cancers can be prevented and individuals can reduce their risk of developing cancer by following a healthy lifestyle and avoiding risk factors. EARLY DETECTION, SCREENING AND TREATMENT Early detection of cancer is a Canadian cancer control priority (3). When cancer is detected early, namely at stages I and II, it is easier to treat and patients experience better outcomes compared to cancers diagnosed at later and more aggressive stages (i.e. stages III and IV) (3). Routine screening of average-risk healthy individuals is one of many strategies to improve early detection. In Yukon, there are currently three routine screening programs: Mammography for breast cancer, Papanicolauo (PAP) tests for cervical cancer, and fecal immunochemical tests (FIT) for colorectal cancer. Although prostate and lung cancer are also major cancers causing death in Yukon, there is insufficient evidence of effectiveness for routine screening at the population level. Yukon cancer screening programs are informed by evidence-based guidelines published by the Canadian Task Force on Preventive Health Care (12). Treatment also plays an important role in reducing cancer mortality. Nationally, declining rates are partly reflected by the availability of better treatment options. Advances in treatment have also led to improvements in survival, particularly when cancers are detected early (3). The impact of treatment on mortality and survivorship has been well documented for colorectal, breast, and prostate cancers among others (3). In Yukon, certain chemotherapies are available while radiation therapy is accessed outside the territory. Treatment services are provided in collaboration with the Yukon Hospital Corporation, Health and Social Services, British Columbia Cancer Agency, and other provincial cancer agencies. Although early detection, screening, and treatment play an important role in reducing the cancer burden in Yukon, an in-depth analysis of these factors is beyond the scope of this report. AVOIDING CANCER Cancer is a complex disease and our risk of developing cancer is influenced by both non-modifiable factors, like our genetic composition, and modifiable factors, like smoking and what we eat. Factors that increase the risk of cancer are referred to as risk factors, like smoking (3). In contrast, factors that decrease the risk of cancer are referred to as protective factors, such as physical activity and a nutritious diet (3). Additionally, our risk of cancer is largely influenced by the social circumstances we live in, like social and economic factors, as well as the built environment. Differences in social and economic factors within the population result in health inequities, in which some individuals may be at a disadvantage when it comes to achieving optimum health and well-being (13). Although these are not 24
26 readily modifiable by the individual, together, policy makers, decision makers in health, and community leaders are in a unique position to address health inequities and improve the health and wellbeing of the population. Cancer typically takes several years or decades to develop and is dependent on the duration, intensity, and frequency of exposure, as well as the type of risk and protective factor over the life course. Generally, the greater the duration, intensity and frequency of exposure, the greater it s impact will be on the risk of developing cancer (14). Research suggests that half of cancers can be prevented (15). Measuring the prevalence of modifiable factors in Yukon is highly informative for understanding trends and identifying areas where we can focus our cancer control and prevention efforts. In the following section, we will discuss the link between cancer and a variety of factors related to health behaviours, infectious agents, and the environment. AVOIDING CANCER: HEALTH BEHAVIOURS TOBACCO USE Tobacco use is the largest cause of cancer worldwide and the most avoidable risk factor for cancer. It causes cancer in multiple organs and is most strongly related to lung cancer (3,16,17). Cigarettes are the main form of tobacco use and there are over 70 known carcinogens in tobacco smoke. There is also clear evidence that other tobacco products, such as cigars and chewing tobacco or exposure to second-hand smoke, have dangerous health effects (16,17). E-cigarettes are electronic, battery-powered devices that simulate the feeling of smoking without actually smoking tobacco (18,19). When one puffs an E-cigarette, they inhale vapour and nicotine, if the latter is present. The presence and amount of nicotine vary by brand and model (18,19). There are potential harms and benefits to E-cigarette use and research is still ongoing. Although E-cigarettes are likely harmful to health, they are substantially less harmful than tobacco alternatives (18,19). Quitting smoking reduces the risk of tobacco-related cancers with a greater reduction in risk when one quits at a younger age (16). Smoking is the most important risk factor for lung cancer (16,17), the leading cause of cancer death in Canada (3). Smoking is a significant public health issue in Northern Canada, where the Territories show a higher smoking prevalence compared to the rest of Canada (5). In 2014, 26% of Yukon s population were daily or occasional smokers, which is well-above Canada as a whole at 18% (5). That being said, Yukon has the lowest smoking prevalence among the Territories (5). Smoking prevalence appears to have declined from pre-2010 levels, which were above 30% (5). This is likely due to territorial and national tobacco cessation and prevention efforts, as well as changes in attitudes towards smoking in the population. In Yukon, the Yukon Tobacco Reduction Strategy aims to empower both youth and adults to say No to tobacco and increase the number of former smokers. It achieves this by engaging with individuals directly and supporting current smokers with the necessary resources to quit (20). Early onset smoking is an important public health issue as it increases nicotine dependence in adulthood (21,22). Nationally, smoking among youth is at its lowest (21,22). Approximately 11% of youth aged 15 to 19 years old and 2% of youth in grades 6 to 9 are daily or occasional smokers. In Yukon, smoking among youth appears elevated compared to national figures and differs between urban and rural status (21). According to the 2014 Yukon Health Behaviours in School-aged Children Study, 19% of grade 9-10 rural girls self-reported smoking daily. Daily smoking among urban girls was 7%, similar to urban and rural boys (22). Although smoking may be elevated among Yukon s youth, research suggests that the majority of youth smokers seriously consider quitting or attempt to quit (21). As school environments play an important role in promoting healthy 25
27 behaviors and act as an important support system for youth (22,23), it is essential that tobacco reduction and prevention efforts in Yukon continue to engage youth, particularly rural girls. NUTRITION Dietary factors play an essential role in maintaining health and are linked to various chronic diseases like diabetes, cardiovascular disease and cancer. What we eat matters. Our diet can protect us from cancer or put us at risk (16,24). Diets high in dietary fibre, fruits and vegetables, are protective against cancer. In contrast, diets high in red and processed meats, and salted foods increase the risk for cancer (16,24). What we eat plays a significant role in maintaining health and influences our risk for various chronic diseases like diabetes and cardiovascular disease. When it comes to cancer, nutrition is no different. What we eat over the life course can either protect us from cancer or increase our risk (16,24). Although it is difficult to identify specific foods that put us at risk or protect us, there is scientific evidence to suggest that diets high in red and processed meats, as well as salted foods, increase our risk of cancer. On the other hand, diets high in fibre, fruits and vegetables are protective against cancer (16,24,25). Compared to Canada as a whole, Yukoners report a similar amount of fruit and vegetable consumption. That is, in 2014, 42% of Yukoners and 40% of Canadians reported consuming fruits and vegetables at least five times a day (5). Moreover, Yukon reported the highest fruit and vegetable consumption among the Territories. Given the barriers in accessing nutritious food in Northern Canada, Yukon fairs well compared to other Canadians (26). BODY COMPOSITION AND OBESITY Overweight and obesity is a significant risk factor for many chronic diseases, including cancer. Evidence shows that body fat, particularly abdominal fat, and adult weight gain increases the risk for certain cancers (16,24,25). Body composition and obesity are closely related to nutrition, physical activity and sedentary behaviours (24,25). There are clear benefits to having an active lifestyle and eating nutritious for all, regardless of one s weight and body composition (24). A balanced lifestyle is essential for maintaining a healthy weight and body composition, which reduces our risk for several chronic diseases including cancer (24). Weight and body composition are largely determined by lifestyle behaviors like physical activity, sedentary behavior, and diet. Everyone, regardless of weight or body composition, can benefit from regular exercise and a nutritious diet (24). In 2014, 54% of Canadians and 57% of Yukoners 18 years and over reported that they were overweight or obese 1 (5). The reader is cautioned when interpreting these statistics as they are self-reported. Other measures of body composition and obesity were not available at the time of this publication. In respect to Canadian youth, approximately 1 in 3 boys and 1 in 4 girls, among students in grades 6 to 10, self-reported a BMI classified as overweight or obese 1 Body composition is measured in several ways, such as the body mass index (BMI). BMI is a commonly used measure of cancer risk and is calculated by dividing the respondent s body weight (in kilograms) by their height (in meters) squared (5). Although BMI is used internationally as a measure of risk for a variety of diseases, it does not account for the distribution of fat around the body, which more accurately assesses our risk for disease. For example, greater fat around the abdomen increases our risk for certain cancers compared to fat around the rest of the body (16). 26
28 (23). Yukon s estimates are similar however, there are disparities between rural and urban Youth (22). Rural youth in Yukon are more likely to report a BMI that is considered overweight or obese than urban youth (22,27). 27
29 PHYSICAL ACTIVITY AND SEDENTARY BEHAVIOUR Regular physical activity and limiting sedentary behaviour have several health benefits, improves our quality of life and reduces the risk of chronic diseases like cancer (16,24,28,29). Adults are recommended to be active for at least 150 minutes a week of moderate to vigorous aerobic activity. Youth aged years, are recommended to accumulate at least 60 minutes of moderate to vigorous physical activity daily (29). Physical inactivity is considered distinct from sedentary behaviour, such as prolonged sitting, which can still increase the risk of cancer despite one s level of physical activity (16,24,28 30). Staying physically active throughout life and limiting sedentary behavior can substantially reduce one s lifetime risk of developing chronic diseases like cancer (16,24,28,29). The Canadian Society for Exercise Physiology and Public Health Agency of Canada recommend that adults be active for at least 150 minutes a week of moderate to vigorous aerobic activity. Youth aged years, are recommended to accumulate at least 60 minutes of moderate to vigorous physical activity daily. Moderate activities include brisk walking or bike riding, while jogging or cross-country skiing are considered vigorous (29). Although physical activity is an individual choice, it is facilitated by the community in which one lives in. Creating a community environment that increases access to physical activity is essential for building healthier communities (24). Scientific literature indicates that physical activity and sedentary behavior are distinct (28,30). That is, sedentary behavior, categorized by time spent doing very little physical movement such as sitting for long periods, is an important independent risk factor for cancer. Public health organizations internationally recommend cutting down on sitting down (16,24,29,30). The Canadian Society for Exercise Physiology recommend opting for active transportation when possible, like walking or biking to work, and active family time, like walking the dog or a family bike ride (29). In 2014, 54% of Canadians aged 12 years and over, reported moderately active or active physical activity during leisure-time. Nationally, Yukoners rank highest in this regard. That is, 65% of Yukoners, aged 12 years and over, report physical activity that is moderately active or active during leisure-time (5). It is important to consider that these measures only account for physical activity during leisure-time, that is, time spent away from work or school. Additionally, it does not take into account sedentary behavior like prolonged sitting, which can still increase the risk of cancer despite one s level of physical activity (24). Nationally, 1 in 5 youth meet Canada s physical activity guidelines (23) (i.e. at least 60 minutes of moderate to vigorous intensity physical activity daily). During school time, approximately 30-23% of boys and 19-23% of girls participate in at least 4 or more hours per week of moderate to vigorous physical activity (23). In Yukon, estimates are slightly higher. However, urban girls are more likely to report physical activity than rural girls (22). In respect to sedentary behavior, 1 in 10 Canadian youth meet the Canadian sedentary behavior guidelines (23) (i.e. a maximum of 2 hours of screen time per day). Additionally, over 50% of boys and 40% of girls in grades 6 to 10 reported watching two or more hours of television per day (23). Similarly, in Yukon, the proportion of youth watching television for two or more hours per day ranged from 46% to 73% (22). 28
CANCER. in the Northwest Territories March 2014
 CANCER in the Northwest Territories 2001-2010 March 2014 www.hss.gov.nt.ca Contents Message from the Minister. 1 Message from the Chief Public Health Officer. 2 Executive Summary. 3 Introduction. 5 What
Nutrition and Physical Activity Situational Analysis
 Nutrition and Physical Activity Situational Analysis A Resource to Guide Chronic Disease Prevention in Alberta Executive Summary December 2010 Prepared by: Alberta Health Services, AHS Overview Intrinsic
Wellness Along the Cancer Journey: Health Habits and Cancer Screening Revised October 20, 2015
 Wellness Along the Cancer Journey: Health Habits and Cancer Screening Revised October 20, 2015 Healthy Habits and Cancer Screening Rev. 10.20.15 Page 164 WELLNESS ALONG THE CANCER JOURNEY: HEALTHY HABITS
Cancer in Halton. Halton Region Cancer Incidence and Mortality Report
 Cancer in Halton Halton Region Cancer Incidence and Mortality Report 2008 2012 The Regional Municipality of Halton March 2017 Reference: Halton Region Health Department, Cancer in Halton: Halton Region
CHAPTER 3: Modifiable risk factors and diabetes self-care
 CHAPTER 3: Modifiable risk factors and diabetes self-care Diabetes is caused by a number of genetic, environmental and biological factors, many of which are not within an individual s control, such as
Prostate cancer was the most commonly diagnosed type of cancer among Peel and Ontario male seniors in 2002.
 Cancer HIGHLIGHTS Prostate, colorectal, and lung cancers accounted for almost half of all newly diagnosed cancers among Peel seniors in 22. The incidence rates of lung cancer in Ontario and Peel have decreased
Cancer in First Nations People in Ontario:
 Cancer in First Nations People in Ontario: Incidence, Mortality, Survival and Prevalence 1 of 14 Colorectal (Large Intestine) Cancer in First Nations People in Ontario Outline This chapter will discuss
chapter 8 CANCER Is cancer becoming more common? Yes and No.
 chapter 8 CANCER In Canada, about 4% of women and 45% of men will develop cancer at some time in their lives, and about 25% of the population will die from cancer. 1 Is cancer becoming more common? Yes
Cancer in the Northern Territory :
 Cancer in the Northern Territory 1991 21: Incidence, mortality and survival Xiaohua Zhang John Condon Karen Dempsey Lindy Garling Acknowledgements The authors are grateful to the many people, who have
Keeping Albertans healthy
 Keeping Albertans healthy HEALTH AND WELLNESS Fall 24 How healthy are Albertans? Health is much more than just the absence of disease or disability. It is a state of physical, emotional and social well-being.
Baptist Health Nassau Community Health Needs Assessment Priorities Implementation Plans
 Baptist Health Nassau Community Health Needs Assessment Priorities Implementation Plans Health Disparities Heart Disease Stroke Hypertension Diabetes Adult Type II Preventive Health Care Smoking and Smokeless
Baptist Health Beaches Community Health Needs Assessment Priorities Implementation Plans
 Baptist Health Beaches Community Health Needs Assessment Priorities Implementation Plans Health Disparities Heart Disease Stroke Hypertension Diabetes Adult Type II Preventive Health Care Smoking and Smokeless
Minnesota Postsecondary Institutions Tobacco-use Policies and Changes in Student Tobacco-use Rates ( )
") Minnesota Postsecondary Institutions Tobacco-use Policies and Changes in Student Tobacco-use Rates (2007 2013) Boynton Health Service Minnesota Postsecondary Institutions Tobacco-use Policies and Changes
Minnesota Postsecondary Institutions Tobacco-use Policies and Changes in Student Tobacco-use Rates (2007 2013) Boynton Health Service Minnesota Postsecondary Institutions Tobacco-use Policies and Changes
The table below presents the summary of observed geographic variation for incidence and survival by type of cancer and gender.
 Results and Maps Overview When disparities in cancer incidence and survival are evident, there are a number of potential explanations, including but not restricted to differences in environmental risk
Leeds, Grenville & Lanark Community Health Profile: Healthy Living, Chronic Diseases and Injury
 Leeds, Grenville & Lanark Community Health Profile: Healthy Living, Chronic Diseases and Injury Executive Summary Contents: Defining income 2 Defining the data 3 Indicator summary 4 Glossary of indicators
Australian Longitudinal Study on Women's Health TRENDS IN WOMEN S HEALTH 2006 FOREWORD
 Australian Longitudinal Study on Women's Health TRENDS IN WOMEN S HEALTH 2006 FOREWORD The Longitudinal Study on Women's Health, funded by the Commonwealth Government, is the most comprehensive study ever
Provincial Cancer Control Advisory Committee
 Provincial Cancer Control Advisory Committee Annual Performance Report 2012-2013 Table of Contents 1.0 Overview... 4 2.0 Shared Partnerships... 7 3.0 Highlights and Accomplishments... 7 4.0 Report on
Seniors Health in York Region
 Seniors Health in York Region Seniors in York Region are generally healthy York Region is set to experience tremendous growth in its seniors population. A Profile of Baby Boomers and Seniors in York Region,
Tobacco Use in Canada: Patterns and Trends
 Tobacco Use in Canada: Patterns and Trends 21 EDITION University of Waterloo Waterloo, Ontario www.tobaccoreport.ca Tobacco Use in Canada: Patterns and Trends 21 Edition This report was prepared by Jessica
Obesity in Cleveland Center for Health Promotion Research at Case Western Reserve University. Weight Classification of Clevelanders
 Obesity in Cleveland 2005-2006 March 2008 Report Contents Weight Classification of Clevelanders Local, State and National Trends in the Prevalence of Obesity Obesity by Demographic Characteristics Nutrition,
UPDATE OF THE EUROPEAN CODE AGAINST CANCER
 UPDATE OF THE EUROPEAN CODE AGAINST CANCER Dr Carolina Espina Open Forum European Partnership Action Against Cancer Ljubljana, Slovenia. November 26-27 RATIONALE RATIONALE Leading cause of death worldwide
A Glance at Cancer in Waterloo Region
 Building Healthy and Supportive Communities A Glance at Cancer in Waterloo Region This is one of a series of Public Health Perspectives reports developed by Region of Waterloo Public Health. It focuses
Looking Toward State Health Assessment.
 CONNECTICUT DEPARTMENT OF PUBLIC HEALTH Policy, Planning and Analysis. Looking Toward 2000 - State Health Assessment. Table of Contents Glossary Maps Appendices Publications Public Health Code PP&A Main
The number of new cases is expected to rise by about 70% over the next 2 decades.
 World Health Organization Cancer Fact sheet February 2017 Key facts Cancer is one of the leading causes of morbidity and mortality worldwide, with approximately 14 million new cases in 2012 1. The number
The Scottish Health Survey 2014 edition summary A National Statistics Publication for Scotland
 The Scottish Health Survey 2014 edition summary A National Statistics Publication for Scotland INTRODUCTION The Scottish Health Survey (SHeS) is commissioned by the Scottish Government Health Directorates
Lung Cancer in First Nations People in Ontario: Incidence, Mortality, Survival and Prevalence
 Lung Cancer in First Nations People in Ontario: Incidence, Mortality, Survival and Prevalence 1 of 12 Lung Cancer in First Nations People in Ontario Outline This chapter will discuss the following: What
Physicians for a Smoke-Free Canada. A look at young adults and smoking Findings from the Canadian Tobacco Use Monitoring Survey
 Fact Sheet Physicians for a Smoke-Free Canada A look at young adults and smoking Findings from the Canadian Tobacco Use Monitoring Survey The Canadian Tobacco Use Monitoring Survey is conducted annually
Burden of Illness. Chapter 3 -- Highlights Document ONTARIO WOMEN'S HEALTH EQUITY REPORT
 Burden of Illness Chapter 3 -- Highlights Document A primary objective of the POWER (Project for an Ontario Women's Health Report) Study is to develop a tool that can be used to improve the health and
SDHU Population Health Profile. Summary Report
 SDHU Population Health Profile Summary Report Sudbury & District Health Unit Revised: January 29, 2016 Authors Michael King, Epidemiologist Dar Malaviarachchi, Epidemiologist Alissa Palangio, Data Analyst
Reducing the Impact of Cancer. Listening to American Indians in Minnesota
 Reducing the Impact of Cancer Listening to American Indians in Minnesota Table of Contents Background... 2 Summary of Results... 3 Part 1: Summary of responses from American Indian listening sessions...
REPORT FROM THE CANADIAN CHRONIC DISEASE SURVEILLANCE SYSTEM:
 REPORT FROM THE CANADIAN CHRONIC DISEASE SURVEILLANCE SYSTEM: PROTECTING AND EMPOWERING CANADIANS TO IMPROVE THEIR HEALTH TO PROMOTE AND PROTECT THE HEALTH OF CANADIANS THROUGH LEADERSHIP, PARTNERSHIP,
Baptist Health Jacksonville Community Health Needs Assessment Implementation Plans. Health Disparities. Preventive Health Care.
 Baptist Health Jacksonville Community Health Needs Assessment Implementation Plans Health Disparities Infant Mortality Prostate Cancer Heart Disease and Stroke Hypertension Diabetes Behavioral Health Preventive
Saskatchewan Cancer Control Report. Profiling Cancer in Regional Health Authorities
 Saskatchewan Cancer Control Report Profiling Cancer in Regional Health Authorities Saskatchewan Cancer Control Report Profiling Cancer in Regional Health Authorities Recommended citation: Phillips Z, Narasimhan
Hull s Adult Health and Lifestyle Survey: Summary
 Hull s 211-212 Adult Health and Lifestyle Survey: Summary Public Health Sciences, Hull Public Health April 213 Front cover photographs of Hull are taken from the Hull City Council Flickr site (http://www.flickr.com/photos/hullcitycouncil/).
Colorado Health Disparities Profiles
 Health Disparities Profiles includes: Larimer County Population Total Population Source: CDC/NCHS 2007-based, bridged-race population estimates, 2007. Social Determinants of Health 287,574 248,312 26,629
Initial Report of Oregon s State Epidemiological Outcomes Workgroup. Prepared by:
 Alcohol Consumption and Consequences in Oregon Prepared by: Addictions & Mental Health Division 5 Summer Street NE Salem, OR 9731-1118 To the reader, This report is one of three epidemiological profiles
2018 Texas Cancer Registry Annual Report
 2018 Texas Cancer Registry Annual Report As Required by Texas Health and Safety Code Section 82.007 November 2018 Table of Contents Executive Summary... 1 1. Introduction... 2 2. Background... 3 Cancer
Trends in colorectal cancer incidence in younger Canadians,
 Trends in colorectal cancer incidence in younger Canadians, 1969-2010 Prithwish De, MHSc, PhD 1,2 ; Parth Patel, MPH 2 1 Surveillance & Ontario Cancer Registry, Cancer Care Ontario 2 Dalla Lana School
Report on Cancer Statistics in Alberta. Breast Cancer
 Report on Cancer Statistics in Alberta Breast Cancer November 2009 Surveillance - Cancer Bureau Health Promotion, Disease and Injury Prevention Report on Cancer Statistics in Alberta - 2 Purpose of the
Colorado Health Disparities Profiles
 Health Disparities Profiles County includes: Jackson, Moffat, Rio Blanco, and Counties Population Total Population 22,382 43,638 4,861,515 21,015 39,473 3,508,736 904 3,224 909,833 140 263 228,718 210
Healthy People, Healthy Communities
 Healthy People, Healthy Communities Public Health Policy Statements on Public Health Issues The provincial government plays an important role in shaping policies that impact both individual and community
Reports on the survey can be downloaded at
 New Jersey 2007 Student Health Survey New Jersey Department of Education Division of Student Services Office of Educational Support Services STUDY FUNDING Funding for the survey was provided by the New
Cancer & the Environment: What is known, & what can we do to prevent cancer?
 Cancer & the Environment: What is known, & what can we do to prevent cancer? John McLaughlin VP, Population Studies & Surveillance, Cancer Care Ontario Professor, Public Health Sciences, U of Toronto Senior
TRENDS IN SUBSTANCE USE AND ASSOCIATED HEALTH PROBLEMS
 Fact Sheet N 127 August 1996 TRENDS IN SUBSTANCE USE AND ASSOCIATED HEALTH PROBLEMS Psychoactive substance use is an increasing public health concern. Problems associated with this use cover a broad spectrum
Colorectal Cancer Report on Cancer Statistics in Alberta. December Cancer Care. Cancer Surveillance
 December 212 21 Acknowledgements 2 This report was made possible through Alberta Health Services,, and the many contributions of staff and management across Alberta Health Services as well as external
Cancer Council NSW Submission to Draft NSW Cancer Plan
 Cancer Council NSW Submission to Draft NSW Cancer Plan 2016-2020 Note: Input (via online questionnaire), October 2015 Do you have any comments or feedback about the introductory section of the NSW Cancer
Indiana Cancer Control Plan,
 Indiana Cancer Control Plan, 2018-2020 Data Compendium Contents About this Document... 1 Data Sources... 1 Primary Measures... 4 GOAL AREA: Primary Prevention... 4 Objective 1: Increase percentage of Hoosiers
Cancer Key facts The problem Cancer causes
 Cancer Key facts Cancer is a leading cause of death worldwide, accounting for 7.6 million deaths (around 13% of all deaths) in 2008 (1). Lung, stomach, liver, colon and breast cancer cause the most cancer
What You Will Learn to Do. Linked Core Abilities
 Courtesy of Army JROTC U4C1L3 Components of Whole Health Key Words: Balance Behavior Calories Decision Fitness Metabolism Self-discipline What You Will Learn to Do Develop a plan for life-long health Linked
Insights from 10,000 Women on the Impact of NCDs Executive Summary. Executive Summary
 Executive Summary I EXECUTIVE SUMMARY Background: Women and NCDs Non-communicable diseases (NCDs) represent the world s leading cause of death. While they are the culprit in 63% of all mortalities worldwide,
*It can appear almost anywhere in the body. *The tumor can invade adjoining parts of the body and metastasize to other organs.
 CANCER Cancer is an uncontrollable process of growth and cell dissemination. It can appear almost anywhere in the body. The tumor can invade adjoining parts of the body and metastasize to other organs.
Nutrition and Cancer Prevention. Elisa V. Bandera, MD, PhD
 Nutrition and Cancer Prevention Elisa V. Bandera, MD, PhD The Causes of Cancer in the US. Sedentary lifestyle 5% Other 12% Family history 5 % Occupation 5% Tobacco 30% Reproductive factors 3% Pollution
The National perspective Public Health England s vision, mission and priorities
 The National perspective Public Health England s vision, mission and priorities Dr Ann Hoskins Director Children, Young People and Families Public Health England May 2013 Mission Public Health England
Smoking prevalence among Inuit in Canada
 Catalogue no. 82-003-X ISSN 1209-1367 Health Reports Smoking prevalence among Inuit in Canada by velyne Bougie and Dafna Kohen Release date: February 15, 2017 How to obtain more information For information
Evaluation Plan Iowa Cancer Plan.
 2018-2022 Iowa Cancer Plan Evaluation Plan www.canceriowa.org/cancerplanevaluationplan *This plan was developed using the CDC s Comprehensive Cancer Control Evaluation Toolkit https://www.cdc.gov/cancer/ncccp/pdf/ccc_program_evaluation_toolkit.pdf
Cancer Prevention: the gap between what we know and what we do
 Cancer Prevention: the gap between what we know and what we do John D Potter MBBS PhD Public Health Sciences Division Fred Hutchinson Cancer Research Center Global Trends Global Trends Increasing population
Presentation to the Standing Committee on Health Chronic Diseases Related to Aging. October 17, 2011
 THE CANADIAN CHIROPRACTIC ASSOCIATION Presentation to the Standing Committee on Health Chronic Diseases Related to Aging October 17, 2011 Prevention as a mean to manage or delay chronic diseases related
Health Promotion, Screening, & Early Detection
 OCN Test Content Outline 2018 Health Promotion, Screening, & Early Detection Kelley Blake MSN, RN, AOCNS, OCN UW Medicine/Valley Medical Center I. Care Continuum 19% A. Health promotion & disease prevention
Quit 4 Life Helping Youth Quit Smoking PROMISING INTERVENTION. Intervention Categories. Latest Project Updates. Quit 4 Life Helping Youth Quit Smoking
 Quit 4 Life Helping Youth Quit Smoking Original Reviewed: March 2006 Last Updated: March 2006 INTERVENTION This summary is based on a program developed and revised by: Health Canada in 2005 and pilot tested
What is the Impact of Cancer on African Americans in Indiana? Average number of cases per year. Rate per 100,000. Rate per 100,000 people*
 What is the Impact of Cancer on African Americans in Indiana? Table 13. Burden of Cancer among African Americans Indiana, 2008 2012 Average number of cases per year Rate per 100,000 people* Number of cases
A PERFECT STORM OF HEART DISEASE LOOMING ON OUR HORIZON 2010 HEART AND STROKE FOUNDATION ANNUAL REPORT ON CANADIANS HEALTH A PERFECT STORM 1
 A PERFECT STORM OF HEART DISEASE LOOMING ON OUR HORIZON January 25, 2010 2010 HEART AND STROKE FOUNDATION ANNUAL REPORT ON CANADIANS HEALTH A PERFECT STORM 1 A perfect storm The Heart and Stroke Foundation
They are updated regularly as new NICE guidance is published. To view the latest version of this NICE Pathway see:
 Strategy,, policy and commissioning to delay or prevent ent of dementia, bring together everything NICE says on a topic in an interactive flowchart. are interactive and designed to be used online. They
Himalayan CHRNA (Community Health Resources and Needs Assessment)
") Himalayan CHRNA (Community Health Resources and Needs Assessment) Between November 2013 and August 2014, the Center for the Study of Asian American Health (CSAAH) collected 156 surveys in the Himalayan
Himalayan CHRNA (Community Health Resources and Needs Assessment) Between November 2013 and August 2014, the Center for the Study of Asian American Health (CSAAH) collected 156 surveys in the Himalayan
Indian CHRNA (Community Health Resources and Needs Assessment)
") (Community Health Resources and Needs Assessment) Between 2014 and 2015, the Center for the Study of Asian American Health collected 113 surveys in the Indian community in NYC in partnership with community
(Community Health Resources and Needs Assessment) Between 2014 and 2015, the Center for the Study of Asian American Health collected 113 surveys in the Indian community in NYC in partnership with community
The AICR 2013 Cancer Risk Awareness Survey Report
 The AICR 2013 Cancer Risk Awareness Survey Report INTRODUCTION In 2001, the American Institute for Cancer Research (AICR) commissioned a survey to gauge public awareness of various lifestyle-related cancer
CSQI BACKGROUNDER What is The Cancer Quality Council of Ontario (CQCO)? What does CQCO do? What is the Cancer System Quality Index?
? What does CQCO do? What is the Cancer System Quality Index?") CSQI BACKGROUNDER What is The Cancer Quality Council of Ontario (CQCO)? Established in 2002 by the Ministry of Health and Long-Term Care (MOHLTC), the Cancer Quality Council of Ontario (CQCO) is an arm
CSQI BACKGROUNDER What is The Cancer Quality Council of Ontario (CQCO)? Established in 2002 by the Ministry of Health and Long-Term Care (MOHLTC), the Cancer Quality Council of Ontario (CQCO) is an arm
Texas Chronic Disease Burden Report. April Publication #E
 Texas Chronic Disease Burden Report April 2010 Publication #E81-11194 Direction and Support Lauri Kalanges, MD, MPH Medical Director Health Promotion and Chronic Disease Prevention Section, Texas Department
National Strategy. for Control and Prevention of Non - communicable Diseases in Kingdom of Bahrain
 Kingdom of Bahrain Ministry of Health National Strategy for Control and Prevention of Non - communicable Diseases in Kingdom of Bahrain 2014 2025 Behavioural Risk Factors Tobacco Use Unhealthy Diets Physical
Lincolnshire JSNA: Cancer
 What do we know? Summary Around one in three of us will develop cancer at some time in our lives according to our lifetime risk estimation (Sasieni PD, et al 2011). The 'lifetime risk of cancer' is an
Korean CHRNA (Community Health Resources and Needs Assessment)
") Korean CHRNA (Community Health Resources and Needs Assessment) Between November 2013 and August 2014, the Center for the Study of Asian American Health (CSAAH) collected 161 surveys in the Korean community
Korean CHRNA (Community Health Resources and Needs Assessment) Between November 2013 and August 2014, the Center for the Study of Asian American Health (CSAAH) collected 161 surveys in the Korean community
Cancer Disparities in Arkansas: An Uneven Distribution. Prepared by: Martha M. Phillips, PhD, MPH, MBA. For the Arkansas Cancer Coalition
 Cancer Disparities in Arkansas: An Uneven Distribution Prepared by: Martha M. Phillips, PhD, MPH, MBA For the Arkansas Cancer Coalition Table of Contents Page Burden of Cancer 3 Cancer Disparities 3 Cost
Colorado s Progress toward Year 2000 Objectives
 Colorado s Progress toward Year Objectives An update from the Survey Research Unit No. 26 November 1998 Two major roles of Public Health are to reduce preventable death and disability and to enhance quality
RISK FACTORS FOR HYPERTENSION IN INDIA AND CHINA: A COMPARATIVE STUDY
 Health and Population - Perspectives and Issues 37 (1 & 2), 40-49, 2014 RISK FACTORS FOR HYPERTENSION IN INDIA AND CHINA: A COMPARATIVE STUDY FuJun Wang*, V. K. Tiwari** and Hao Wang*** ABSTRACT To identify
2012 Report on Cancer Statistics in Alberta
 212 Report on Cancer Statistics in Alberta Kidney Cancer Surveillance & Reporting CancerControl AB February 215 Acknowledgements This report was made possible through Surveillance & Reporting, Cancer Measurement
Introduction to the POWER Study Chapter 1
 ONTARIO WOMEN S HEALTH EQUITY REPORT Introduction to the POWER Study Chapter 1 AUTHORS Susan K. Shiller, MSc Arlene S. Bierman, MD, MS, FRCPC INSIDE Why do we need a Women s Health Equity Report in Ontario?
Physical activity guidelines No. 2017/08e. Executive summary
 Physical activity guidelines 2017 No. 2017/08e Executive summary Executive summary Physical activity guidelines 2017 page 2 of 6 Background Three standards for physical activity are applied in the Netherlands:
Report on Cancer Statistics in Alberta. Kidney Cancer
 Report on Cancer Statistics in Alberta Kidney Cancer November 29 Surveillance - Cancer Bureau Health Promotion, Disease and Injury Prevention Report on Cancer Statistics in Alberta - 2 Purpose of the Report
Kidney Cancer Report on Cancer Statistics in Alberta. December Cancer Care. Cancer Surveillance
 December 212 21 Report on Cancer Statistics in Alberta Report on Cancer Statistics in Alberta Acknowledgements 2 This report was made possible through Alberta Health Services,, and the many contributions
Winnebago County, Illinois. Review of Winnebago County Cancer Mortality and Incidence ( )
") Winnebago County, Illinois Review of Winnebago County Cancer Mortality and Incidence (1988 2008) August 2011 Review of Winnebago County Cancer Mortality and Incidence August 2011 Background: Cancer is
Winnebago County, Illinois Review of Winnebago County Cancer Mortality and Incidence (1988 2008) August 2011 Review of Winnebago County Cancer Mortality and Incidence August 2011 Background: Cancer is
Vietnamese CHRNA (Community Health Resources and Needs Assessment)
") Vietnamese CHRNA (Community Health Resources and Needs Assessment) Between 2013 and 2015, the Center for the Study of Asian American Health (CSAAH) and Mekong NYC collected 103 surveys in the Vietnamese
Vietnamese CHRNA (Community Health Resources and Needs Assessment) Between 2013 and 2015, the Center for the Study of Asian American Health (CSAAH) and Mekong NYC collected 103 surveys in the Vietnamese
American Indian Cancer Burden. Kris Rhodes, MPH Bad River Band of Lake Superior Chippewa Fond du Lac Band of Lake Superior Chippewa
 American Indian Cancer Burden Kris Rhodes, MPH Bad River Band of Lake Superior Chippewa Fond du Lac Band of Lake Superior Chippewa The AICAF Story American Indian Cancer Foundation (AICAF) is a national
Health of the City & Community Health Improvement Planning. Raynard Washington, PhD, MPH Chief Epidemiologist
 Health of the City & Community Health Improvement Planning Raynard Washington, PhD, MPH Chief Epidemiologist What is the Community Health Assessment (CHA)? An annual assessment of population health in
Regional framework for action on cancer prevention and control Executive summary
 Regional Committee for the Eastern Mediterranean Sixty-fourth session Provisional agenda item 3(a) EM/RC64/3 September 2017 Regional framework for action on cancer prevention and control Executive summary
TARGETS To reduce the age-standardised mortality rate from cervical cancer in all New Zealand women to 3.5 per or less by the year 2005.
 Cervical Cancer Key points Annually, around 85 women die from, and 230 women are registered with, cervical cancer. The decline in both incidence and mortality rates for cervical cancer has accelerated
Cancer Facts for Women
 Cancer Facts for Women Some of the cancers that most often affect women are breast, colorectal, endometrial, lung, cervical, skin, and ovarian cancers. Knowing about these cancers and what you can do to
Yukon Palliative Care Framework
 Yukon Palliative Care Framework Contents Executive Summary...2 Introduction...3 Principles of the Framework...6 Continuum of Integrated Services...7 Supporting Care Providers...8 Best Practice Service
Estimating the Current and Future Burden of Cancer in Canada: Identifying Opportunities for Prevention
 Estimating the Current and Future Burden of Cancer in Canada: Identifying Opportunities for Prevention Darren R. Brenner Assistant Professor Departments of Oncology and Community Health Sciences Cumming
The following are recommendations to help public health better address seniors health.
 Public Health Mandate There is only one provincial requirement specifically targeted for seniors. It currently addresses falls in the elderly. Peel Public Health also addresses medication use through a
The Phenomena of Movement pg 3. Physical Fitness and Adolescence pg 4. Fitness as a Lifestyle pg 5. Physical Education and the Student pg 6
 Introduction pg 2 The Phenomena of Movement pg 3 Physical Fitness and Adolescence pg 4 Fitness as a Lifestyle pg 5 Physical Education and the Student pg 6 The Program pg 7 Program Outline pg 8 Proposal
Leukemia Report on Cancer Statistics in Alberta. December Cancer Care. Cancer Surveillance
 December 212 21 Report on Cancer Statistics in Alberta Report on Cancer Statistics in Alberta Acknowledgements 2 This report was made possible through Alberta Health Services,, and the many contributions
Physiotherapists in Canada, 2011 National and Jurisdictional Highlights
 pic pic pic Physiotherapists in Canada, 2011 National and Jurisdictional Highlights Spending and Health Workforce Our Vision Better data. Better decisions. Healthier Canadians. Our Mandate To lead the
Almost 1 in 10 adults have been diagnosed with diabetes. Alabama is ranked fifth in prevalence of diabetes in the United States and its territories.
 2008 FACT SHEET The Diabetes Branch addresses the impact of diabetes in Alabama by developing policies, recommendations, and programs about the disease and related issues. The program is funded through
Community Needs Analysis Report
 Grampians Medicare Local Community Needs Analysis Report Summary October 2013 2 Contents Introduction 3 Snapshot of results 4 Stakeholder feedback 5 Health status of residents 6 Health behaviour of residents
Table of Contents INTRODUCTION... 2 METHODOLOGY Appendix 1 Comparison of Peer Counties... 6
 Table of Contents INTRODUCTION... 2 METHODOLOGY... 4 Appendix 1 Comparison of... 6 Appendix 2 Key Findings from the MAPP Assessments... 7 BARRIERS TO HEALTHCARE ACCESS... 7 HEALTH STATUS... 9 DEATH INDICATORS...
Community Health Needs Assessment. Implementation Strategy.. SAMPLE TEMPLATE
 Community Health Needs Assessment & Implementation Strategy SAMPLE TABLE OF CONTENTS Executive Summary I. Service Area and Population II. Community Health Needs Assessment Partners.. III. IV. Community
Nutrition, Physical Activity and the Cancer Reform Strategy. Professor Sir Mike Richards September 2010
 Nutrition, Physical Activity and the Cancer Reform Strategy Professor Sir Mike Richards September 2010 Overview of presentation Cancer in England The political context How many cancers are preventable?
ACTIVE PEOPLE HEALTHY BODIES. Reducing Your Risk of Cancer. The lead agency for developing sport in Northern Ireland
 ACTIVE PEOPLE HEALTHY BODIES Reducing Your Risk of Cancer The lead agency for developing sport in Northern Ireland ACTIVE PEOPLE: HEALTHY BODIES Sport Northern Ireland is keen to promote the message that
Evaluation of ATOD programs. Vietnamese Social Services
 Evaluation of ATOD programs Vietnamese Social Services J U N E 2 0 0 6 Evaluation of ATOD programs Vietnamese Social Services June 2006 Prepared by: Brian Pittman & Nicole Martin Wilder Research 1295 Bandana
Figure 1: Socio-demographic characteristics of the students (n= 2263)
") Percentage RESULTS (Unpublished Data) Comparative Analysis of Baseline, Intermediate and End line Data - Knowledge, Attitude and Practice (KAP) Survey The impact of two year intervention was assessed through
Percentage RESULTS (Unpublished Data) Comparative Analysis of Baseline, Intermediate and End line Data - Knowledge, Attitude and Practice (KAP) Survey The impact of two year intervention was assessed through