Supplemental Information. High-Throughput Microfluidic Labyrinth for the. Label-free Isolation of Circulating Tumor Cells
|
|
|
- Andrew Snow
- 6 years ago
- Views:
Transcription
1 Cell Systems, Volume 5 Supplemental Information High-Throughput Microfluidic Labyrinth for the Label-free Isolation of Circulating Tumor Cells Eric Lin, Lianette Rivera-Báez, Shamileh Fouladdel, Hyeun Joong Yoon, Stephanie Guthrie, Jacob Wieger, Yadwinder Deol, Evan Keller, Vaibhav Sahai, Diane M. Simeone, Monika L. Burness, Ebrahim Azizi, Max S. Wicha, and Sunitha Nagrath
2 Figure S1
3 Figure S2
4 Figure S3
5 Figure S4
6 Table S1 Sample number P.1 P.2 P.3 P.4 P.5 P.6 P.7 P.8 P.9 P.10 P.11 P.12 P.13 P.14 P.15 type Staining CTC/mL Stage CK ATDC 2 Unknown ZEB1 5 CK ATDC 0 Unknown ZEB1 5 CK ATDC 0 ZEB1 20 CK Locally ATDC 0 advanced/borderline ZEB1 0 resectable CK ATDC 0 Borderline resectable ZEB1 25 CK ATDC 2 ZEB1 0 CK Borderline ATDC 12 resectable/metastatic ZEB1 30 CK Borderline ATDC 7 resectable/metastatic ZEB1 32 CK ATDC 0 ZEB1 63 CK ATDC 0 ZEB1 10 CK ATDC 4 ZEB1 2 CK Borderline ATDC 10 resectable/metastatic ZEB1 19 CK ZEB1 23 CK ZEB1 15 Locally advanced CK ZEB1 19 Borderline resectable
7 P.16 P.17 P.18 P.19 P.20 CK ZEB1 6 CK ZEB1 39 CK ZEB1 23 CK ZEB1 19 CK-19 4 ZEB1 8 Unknown Locally advanced
8 Table S2 Sample Number Type CTC/mL Stage Tumor type ER/PR/HER2 B1 Breast 0.0 ER/PR+/HER2- B2 Breast 0 ER/PR+/HER2- B3 Breast 3.3 ER/PR+/HER2+ B4 Breast 6.3 ER/PR+/HER2- B5 Breast 8.0 ER/PR+/HER2- B6 Breast 8.0 ER/PR+/HER2- B7 Breast 12.5 ER/PR+/HER2- B8 Breast 12.5 ER/PR+HER2- B9 Breast 31.3 ER/PR+/HER2- B10 Breast 0 ER/PR+HER2- B11 Breast 0 ER/PR/HER2- B12 Breast 0.7 ER/PR+/HER2+ B13 Breast 1.4 ER/PR+/HER2- B14 Breast 1.4 ER+/PR-/HER2+ B15 Breast 1.4 ER/PR+/HER2- B16 Breast 1.4 ER/PR+/HER2- B17 Breast 1.4 ER/PR+HER2+ B18 Breast 2.1 ER/PR+/HER2- B19 Breast 2.1 ER/PR+/HER2- B20 Breast 2.1 ER/PR+/HER2- B21 Breast 2.1 ER/PR+/HER2- B22 Breast 2.8 ER+/PR-/HER2- B23 Breast 2.8 ER/PR+/HER2+ B24 Breast 2.8 ER/PR+/HER2- B25 Breast 2.8 ER/PR+/HER2- B26 Breast 2.8 ER/PR+/HER2- B27 Breast 3.5 ER+/PR-/HER2- B28 Breast 3.5 ER/PR+/HER2- B29 Breast 4.2 ER/PR+/HER2- B30 Breast 4.2 ER/PR+/HER2- B31 Breast 4.2 ER+/PR-/HER2- B32 Breast 4.9 ER/PR+/HER2- B33 Breast 5.6 ER/PR+/HER2-
9 B34 Breast 5.6 ER/PR+/HER2+ B35 Breast 6.3 ER/PR+/HER2- B36 Breast 6.3 ER/PR+/HER2- B37 Breast 7 ER/PR+/HER2- B38 Breast 7 ER/PR-/HER2+ B39 Breast 7 ER+/PR-/HER2- B40 Breast 7.7 ER/PR-/HER2+ B41 Breast 7.7 ER/PR/HER2- B42 Breast 7.7 ER/PR-HER2+ B43 Breast 8.4 ER/PR/HER2- B44 Breast 9.1 ER/PR+/HER2- B45 Breast 9.8 ER/PR+/HER2- B46 Breast 12.6 ER/PR+/HER2- B47 Breast 13.3 ER/PR+/HER2- B48 Breast 16.8 ER/PR+/HER2- B49 Breast 21.7 ER/PR+/HER2- B50 Breast 11.7 ER/PR+/HER2+ B51 Breast 10.3 ER/PR+/HER2- B52 Breast 11.2 ER/PR+/HER2- B53 Breast 7.5 ER/PR-/HER2+ B54 Breast 9.3 ER/PR+/HER2- B55 Breast 6.6 ER/PR+/HER2- B56 Breast 9.8 ER/PR+/HER2-
10 Table S3 GAPDH CD24 KRT5 CDH3 CTNNB1 IL6 HPRT1 CD44 KRT7 TGFb1 WNT2 IL6R RAB7A ALDH1a1 KRT8 TGFbR1 Twist1 IL6STP1 EpCAM ALDH1a3 AR TP53 SNAI1 CXCL8 Vimentin PROM1 KRT18 PTEN SNAI2 CXCR1 ERBB2 CCND1 KRT19 PI3K ZEB1 CXCR4 EGFR ANXA3 CDH1 AKT1 ZEB2 MTOR GSK3B GATA3 CDH2 AKT3 EZH2 NFKB1 ESR1 ABCG2 ID1 NOTCH1 MCL1 MKI67 PGR ABCB1 ID2 NOTCH2 BAX PCNA TAZ NESTIN MET NOTCH3 BCL2 CD3D YAP1 LIN28A BRCA1 NUMB TSPAN6 ITGAM SOX2 ITGB3 MUC1 HES1 TM4SF1 CD14 UXT ITGA6 STAP2 HEY2 TMEM57 MS4A1 SOCS3 FBXW7 AMOTL2 DLL1 NANOG PTPRC TP63 MMP9 TNKS1BP1 JAG2 POU5F1 MCAM
11 Table S4 CTC Category EMT Definition (based on marker expression) CD44 + and CD24 low/- MET ALDH1a3 + Dual ALDH1a3 +, CD24 low/- and CD44 + CK 2 CK + markers (CK 7, 8, 18, 19) WBC 1 Blood marker (PTPRC, ITGAM, MS4A1, and CD3D)
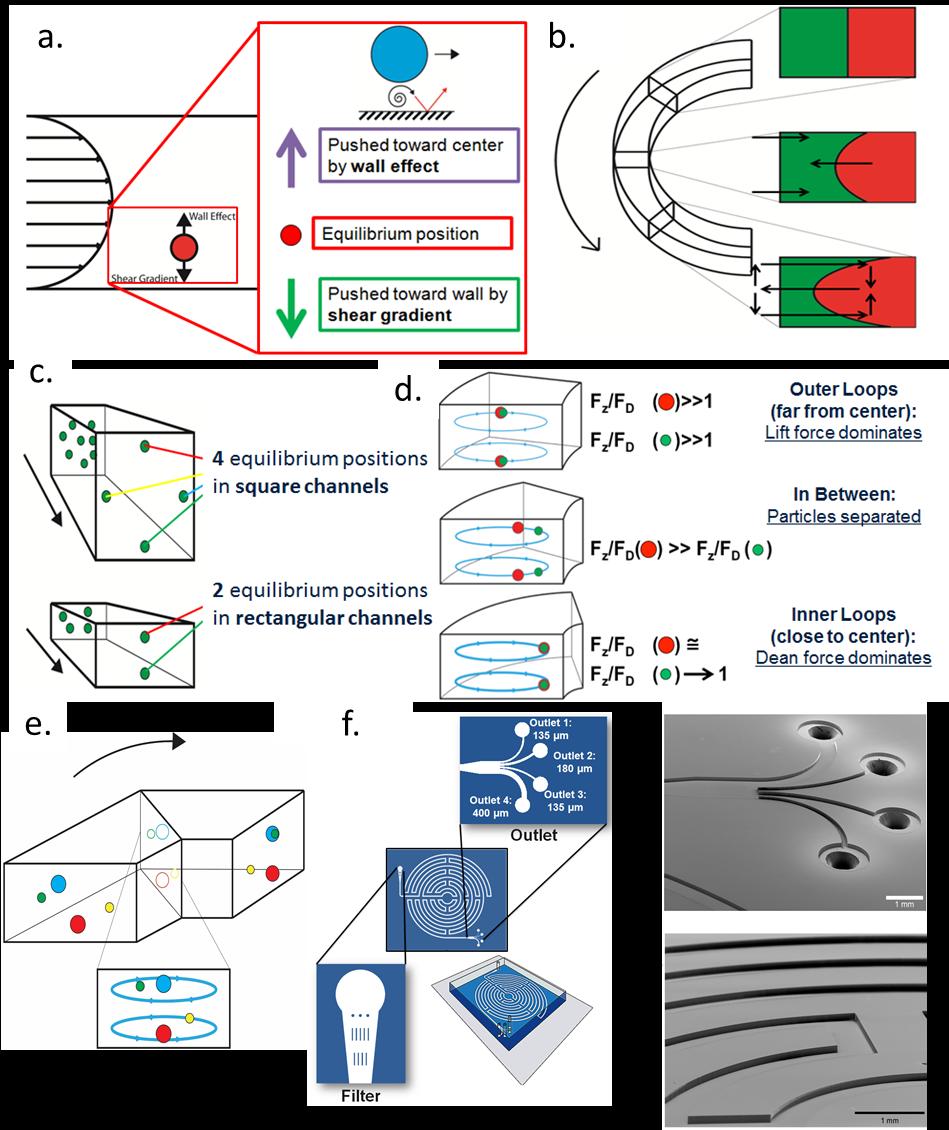
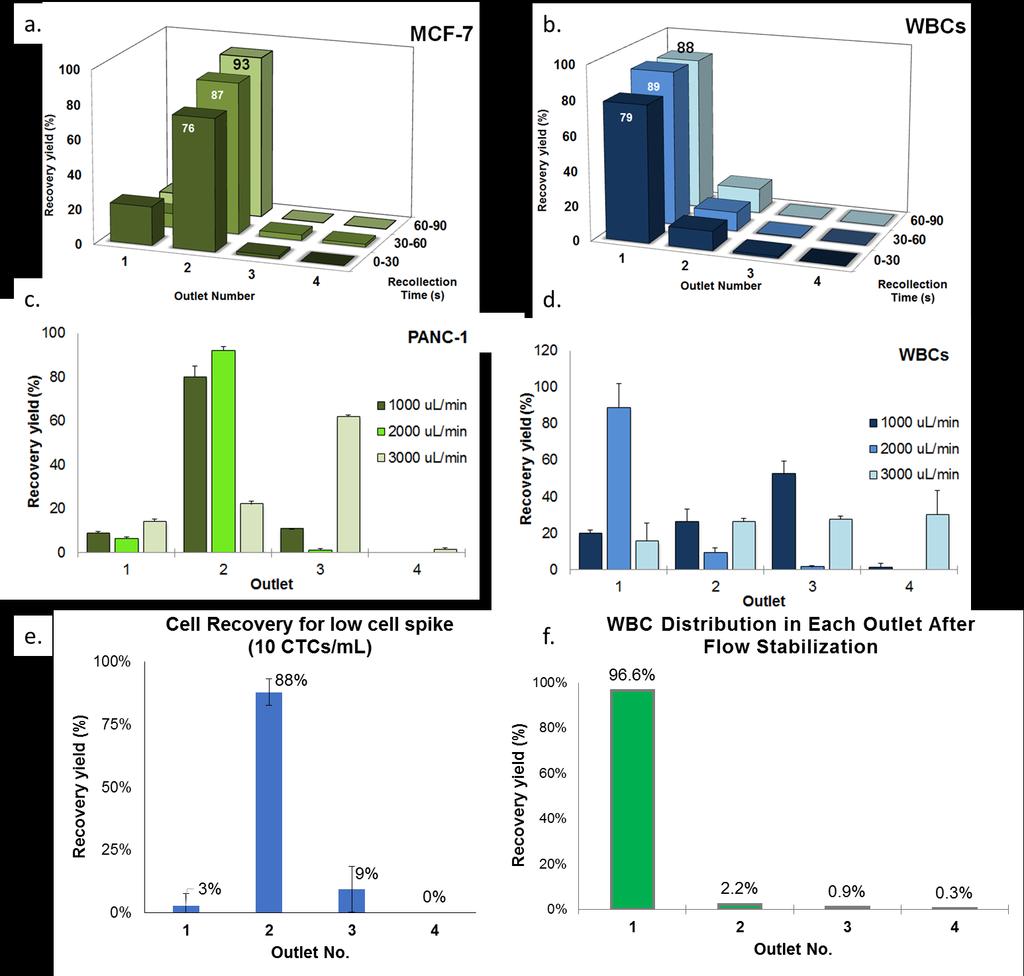
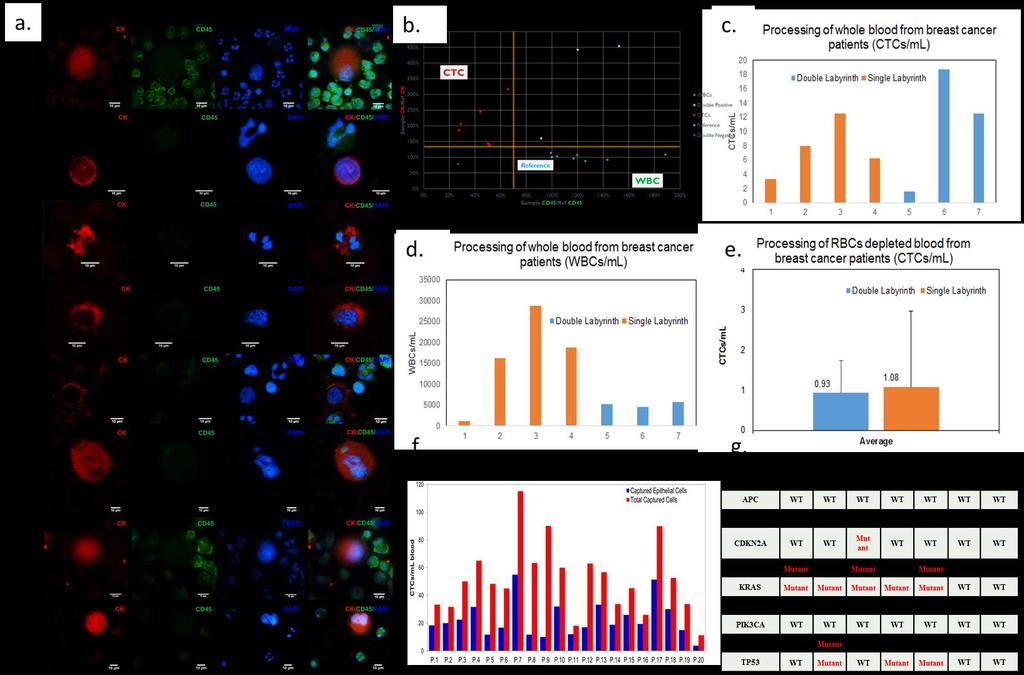
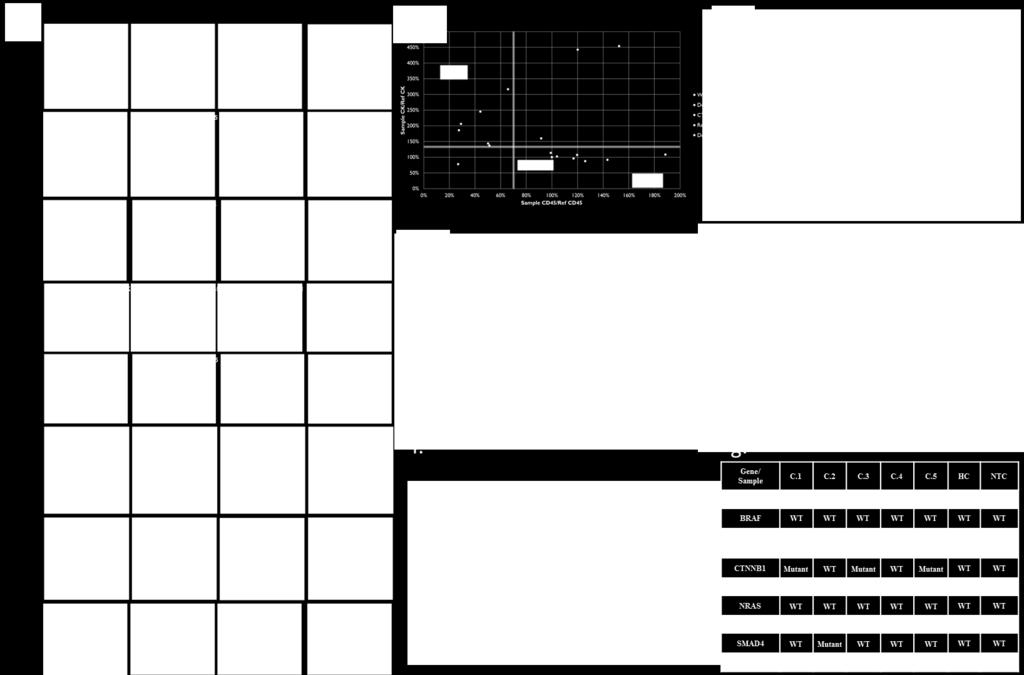
12 Supplementary Figure captions Figure S1. Related to Figure 1. Physics of the Labyrinth. a, Particle on a channel is focused by lift forces, which includes the force from shear gradient and from wall effect. When the two forces are balanced, the particles reach their equilibrium position. b, In a curved channel, the fluid close to the inner wall will be drawn away from the center of curvature by centrifugal force, causing two vortices to appear at top and bottom, accordingly. c, Particles will be focused to several equilibrium positions in microfluidic channels. For square channels, there will be 4 equilibrium positions and for rectangular channels, there will be 2. d, Desired focusing position occurs when ratio for the larger particle is greater than the ratio for small particle, and the ratios are not too close to 1 nor too greater than 1. At such position, the particles can be well separated. e. Hypothesis for sharp corners in Labyrinth. Strong Dean vortices at corners would help the focusing of small particles. Inertial lift forces acting on smaller particles are much weaker compared to that on larger particles (F Z is proportional to the 4th power of particle size). Therefore, smaller particles (e.g. RBCs, WBCs) are generally difficult to focus. For instance, the large particles (red and blue) are easily focused thus they are already at the focusing position while passing through the sharp corners. The smaller particles (green and yellow), on the other hand, are not focused yet at the corner. The focusing of the green particle is enhanced by the strong Dean vortex at the corner and thus the green particle gets closer to its focusing position after passing through the corner. The focusing of yellow particle will be enhanced by the other corners in opposite direction. f. Optimized design of Labyrinth g. SEM image of Labyrinth s outlet h. SEM image of corners and turns in Labyrinth. Scale bar 1mm. Figure S2. Related to Figure 2. Optimization of Labyrinth using cell lines. Flow stabilization measurements for a. MCF-7 breast cancer cell line and b. WBCs. c. PANC1 cell line recovery measured at different at flow rates ranging from 1-3 ml/min. d. WBC removal measured at different at flow rates ranging from 1-3 ml/min. e. Cell Recovery for low number (10cells/mL) of cell spiked in blood. f. WBC distribution across four outlets in Labyrinth after flow stabilization Figure S3. Related to Figure 3. Patient sample processing. a. Gallery of CTCs recovered from breast cancer patients. b. Scatter plot of CK and CD45 fluorescent intensity levels from patient samples for CTC identification. As shown in the plot, the upper left quarter contains CTCs and the lower right quarter contains the WBCs. After a patient sample was processed through Labyrinth and fluorescently stained with DAPI, CD45, and CK, a typical WBC from the slide was selected as reference for its CD45 and CK fluorescent intensity levels. A cell could be identified as a WBC by having similar CD45 and CK expressions comparing to the reference cell. A cell could be identified as a CTC by having at least 50% lower CD45 and 50% higher CK expressions comparing to the reference cell. Cells with both CD45 and CK significant expressions with respect to the reference cell would be considered as double positive cells. Cells with DAPI positive but much lower expressions in CD45 and CK when compared to the reference cell would be considered as double negative cells. c. CTCs/mL of blood recovered from breast cancer patients using whole blood with single and double Labyrinth. d. WBC/mL of blood remained after processing whole blood (without any RBC removal/pre-processing) from breast cancer patients using both single and double Labyrinth. e. Single vs Double Labyrinth CTC counts (per ml of whole blood) in breast cancer patients using pretreated blood for RBC removal. f. Comparison between total number of CTCs/mL in pancreatic cancer patients stained positive for CK19 vs total number of CTCs/mL in whole blood that stained positive for either epithelial (CK19) or for any of the two EMT markers used (ZEB1 and ATDC). g. Somatic mutations for pancreatic cancer related genes observed in 5 patient samples (C.1-C.5), Healthy Control (HC) and No Template Control (NTC)
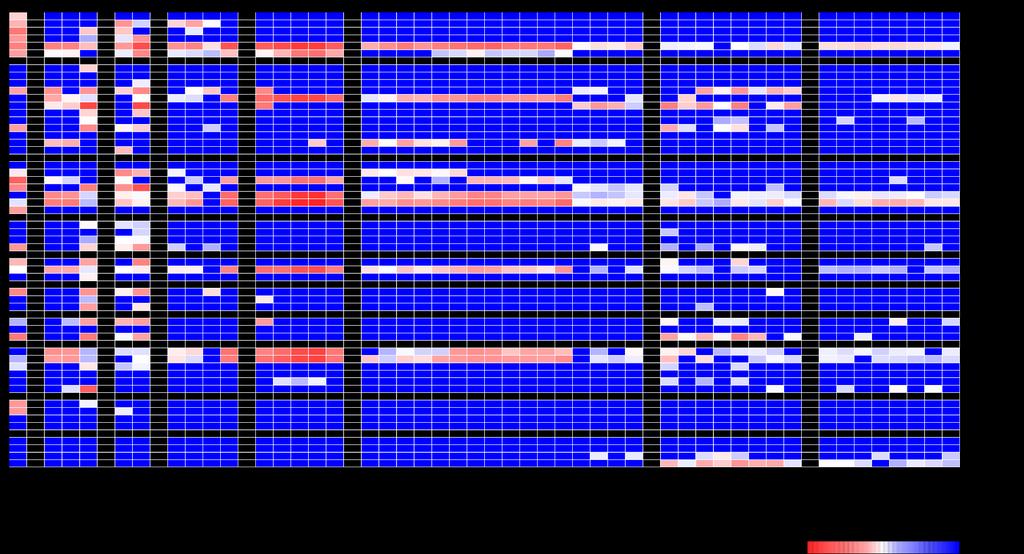
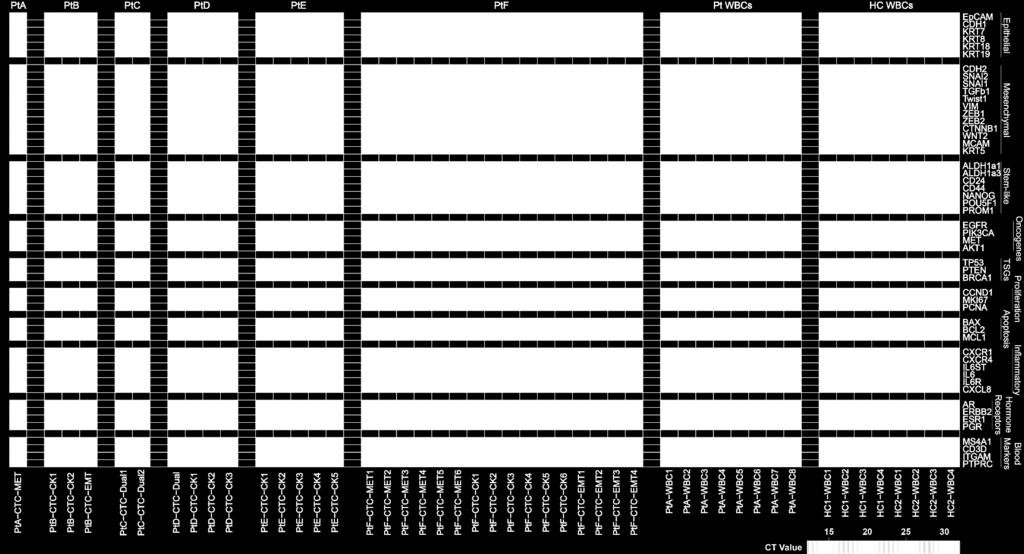
13 Figure S4. Related to Figure 4. Single cell multiplex gene expression profile of isolated CTCs. Blood samples from cancer patients and healthy controls were processed by Labyrinth as described in the methods. Heat map analysis of the gene expression levels of 47 single cells including 31 patient derived CTCs from 6 different patients, 8 patient derived contaminating WBCs (Pts-WBCs) and 8 WBCs from healthy controls (HC-WBCs). The genes are grouped based on the genotypic characterization as described in Table S4. Supplementary Table captions Table S1. Related to Figure 3. Quantification of CTCs from pancreatic cancer patients Table S2. Related to Figure 3. Quantification of CTCs from breast cancer patients Table S3. Related to Figure 4. List of 96 genes studied in single CTCs Table S4. Related to Figure 4. CTC categories for marker-based classification
Title: Single Cell Dual Adherent-Suspension Co-Culture Micro-Environment for Studying Tumor- Stromal Interactions
 Electronic Supplementary Material (ESI) for Lab on a Chip. This journal is The Royal Society of Chemistry 2016 Title: Single Cell Dual Adherent-Suspension Co-Culture Micro-Environment for Studying Tumor-
SUPPLEMENTARY INFORMATION
 doi:10.1038/nature15260 Supplementary Data 1: Gene expression in individual basal/stem, luminal, and luminal progenitor cells. Box plots show expression levels for each gene from the 49-gene differentiation
Nature Methods: doi: /nmeth Supplementary Figure 1
 Supplementary Figure 1 Finite-element analysis of cell cluster dynamics in different cluster trap architectures. (a) Cluster-Chip (b) Filter (c) A structure identical to the Cluster-Chip except that one
High-Throughput Microfluidic Labyrinth for the Label-free Isolation of Circulating Tumor Cells
 Report High-Throughput Microfluidic Labyrinth for the Label-free Isolation of Circulating Tumor Cells Graphical Abstract Authors Eric Lin, Lianette Rivera-Báez, Shamileh Fouladdel,..., Ebrahim Azizi, Max
A Novel CTC-Detecting Technique Using TelomeScan and Its Clinical Applications
 A Novel CTC-Detecting Technique Using TelomeScan and Its Clinical Applications Yasuo Urata CEO and President Oncolys BioPharma Inc. February 16, 2013 Telomere Length is a Limiting Factor for Cell Replication
Supplementary Figure S1 Expression of mir-181b in EOC (A) Kaplan-Meier
 Kaplan-Meier") Supplementary Figure S1 Expression of mir-181b in EOC (A) Kaplan-Meier curves for progression-free survival (PFS) and overall survival (OS) in a cohort of patients (N=52) with stage III primary ovarian
Supplementary Figure S1 Expression of mir-181b in EOC (A) Kaplan-Meier curves for progression-free survival (PFS) and overall survival (OS) in a cohort of patients (N=52) with stage III primary ovarian
Table S1: Analysis of Notch gene rearrangements in triple negative breast cancer subtypes
 Supplemental Tables Table S1: Analysis of Notch gene rearrangements in triple negative breast cancer subtypes NOTCH1 or NOTCH2 Basal Immune Luminal AR Mesenchymal Stem Like WT 27 (87%) 24 (100%) 4 (66%)
Plasma-Seq conducted with blood from male individuals without cancer.
 Supplementary Figures Supplementary Figure 1 Plasma-Seq conducted with blood from male individuals without cancer. Copy number patterns established from plasma samples of male individuals without cancer
The Avatar System TM Yields Biologically Relevant Results
 Application Note The Avatar System TM Yields Biologically Relevant Results Liquid biopsies stand to revolutionize the cancer field, enabling early detection and noninvasive monitoring of tumors. In the
Supplemental Table S1
 Supplemental Table S. Tumorigenicity and metastatic potential of 44SQ cell subpopulations a Tumorigenicity b Average tumor volume (mm ) c Lung metastasis d CD high /4 8. 8/ CD low /4 6./ a Mice were injected
Supplementary Figure (OH) 22 nanoparticles did not affect cell viability and apoposis. MDA-MB-231, MCF-7, MCF-10A and BT549 cells were
 22 nanoparticles did not affect cell viability and apoposis. MDA-MB-231, MCF-7, MCF-10A and BT549 cells were") Supplementary Figure 1. Gd@C 82 (OH) 22 nanoparticles did not affect cell viability and apoposis. MDA-MB-231, MCF-7, MCF-10A and BT549 cells were treated with PBS, Gd@C 82 (OH) 22, C 60 (OH) 22 or GdCl
Supplementary Figure 1. Gd@C 82 (OH) 22 nanoparticles did not affect cell viability and apoposis. MDA-MB-231, MCF-7, MCF-10A and BT549 cells were treated with PBS, Gd@C 82 (OH) 22, C 60 (OH) 22 or GdCl
Detecting Oncogenic Mutations in Whole Blood
 WHITE PAPER Detecting Oncogenic Mutations in Whole Blood Analytical validation of Cynvenio Biosystems LiquidBiopsy circulating tumor cell (CTC) capture and next-generation sequencing (NGS) September 2013
Dr David Guttery Senior PDRA Dept. of Cancer Studies and CRUK Leicester Centre University of Leicester
 Dr David Guttery Senior PDRA Dept. of Cancer Studies and CRUK Leicester Centre University of Leicester dsg6@le.ac.uk CFDNA/CTDNA Circulating-free AS A LIQUID DNA BIOPSY (cfdna) Tumour Biopsy Liquid Biopsy
TP53 Mutation, Epithelial-Mesenchymal Transition, and Stemlike Features in Breast Cancer Subtypes
 Journal of Biomedicine and Biotechnology Volume 0, Article ID 0, pages doi:0./0/0 Research Article TP Mutation, Epithelial-Mesenchymal Transition, and Stemlike Features in Breast Cancer Subtypes Danila
Supplementary Table 1: List of the 242 hypoxia/reoxygenation marker genes collected from literature and databases
 Supplementary Tables: Supplementary Table 1: List of the 242 hypoxia/reoxygenation marker genes collected from literature and databases Supplementary Table 2: Contingency tables used in the fisher exact
SUPPLEMENTARY INFORMATION
 DOI: 10.1038/ncb2607 Figure S1 Elf5 loss promotes EMT in mammary epithelium while Elf5 overexpression inhibits TGFβ induced EMT. (a, c) Different confocal slices through the Z stack image. (b, d) 3D rendering
Challenges for use of CTCs as a Diagnostic. Farideh Z. Bischoff, Ph.D. Interim CSO Sr. Director, Translational Clinical Development Biocept, Inc.
 Challenges for use of CTCs as a Diagnostic Farideh Z. ischoff, Ph.D. Interim CSO Sr. Director, Translational Clinical Development iocept, Inc. Current Technology for CTC Testing Existing CTC testing platform
Targeted Agent and Profiling Utilization Registry (TAPUR ) Study. February 2018
 Study. February 2018") Targeted Agent and Profiling Utilization Registry (TAPUR ) Study February 2018 Precision Medicine Therapies designed to target the molecular alteration that aids cancer development 30 TARGET gene alterations
Targeted Agent and Profiling Utilization Registry (TAPUR ) Study February 2018 Precision Medicine Therapies designed to target the molecular alteration that aids cancer development 30 TARGET gene alterations
Figure S1. ERBB3 mrna levels are elevated in Luminal A breast cancers harboring ERBB3
 Supplemental Figure Legends. Figure S1. ERBB3 mrna levels are elevated in Luminal A breast cancers harboring ERBB3 ErbB3 gene copy number gain. Supplemental Figure S1. ERBB3 mrna levels are elevated in
The mir-199a/brm/egr1 axis is a determinant of anchorage-independent growth in epithelial tumor cell lines
 Supplementary information Supplementary Figure -9 Supplementary Table -4 The mir-99a/brm/egr axis is a determinant of anchorage-independent growth in epithelial tumor cell lines Kazuyoshi Kobayashi, Kouhei
Layered-IHC (L-IHC): A novel and robust approach to multiplexed immunohistochemistry So many markers and so little tissue
: A novel and robust approach to multiplexed immunohistochemistry So many markers and so little tissue") Page 1 The need for multiplex detection of tissue biomarkers. There is a constant and growing demand for increased biomarker analysis in human tissue specimens. Analysis of tissue biomarkers is key to
Page 1 The need for multiplex detection of tissue biomarkers. There is a constant and growing demand for increased biomarker analysis in human tissue specimens. Analysis of tissue biomarkers is key to
Supplementary Figure 1
 Supplementary Figure 1 Supplementary Figure 1. Lats1/2 deleted ihbs and ihps showed decreased transcripts of hepatocyte related genes (a and b) Western blots (a) and recombination PCR (b) of control and
Fluxion Biosciences and Swift Biosciences Somatic variant detection from liquid biopsy samples using targeted NGS
 APPLICATION NOTE Fluxion Biosciences and Swift Biosciences OVERVIEW This application note describes a robust method for detecting somatic mutations from liquid biopsy samples by combining circulating tumor
ONLINE DATA SUPPLEMENT. Single Cell RNA-Sequencing Identifies Diverse Roles of Epithelial Cells in. Idiopathic Pulmonary Fibrosis
 ONLINE DATA SUPPLEMENT Single Cell RNA-Sequencing Identifies Diverse Roles of Epithelial Cells in Idiopathic Pulmonary Fibrosis Yan Xu Takako Mizuno Anusha Sridharan Yina Du Minzhe Guo Jie Tang Kathryn
Supplementary Figure 1. Effects of EDTA and ACD anticoagulants on blood storage. (a) EDTA
 EDTA") Supplementary Figure 1. Effects of EDTA and ACD anticoagulants on blood storage. (a) EDTA vacutainers (4.9 mm EDTA in 10 ml of blood) induce hemolysis after overnight storage in room temperature. (b) Viability
Supplementary Figure 1. Effects of EDTA and ACD anticoagulants on blood storage. (a) EDTA vacutainers (4.9 mm EDTA in 10 ml of blood) induce hemolysis after overnight storage in room temperature. (b) Viability
EDUCATION AND TRAINING
 Monika L. Burness, M.D. Assistant Professor, Internal Medicine Division of Hematology/Oncology University of Michigan Medical School University of Michigan Comprehensive Cancer Center Office: NCRC, B26/319S
Phosphorylation Site Company Cat #
 Supplemental Table 1. Antibodies used for RPPA analysis. Label Protein Phosphorylation Site Company Cat # Used on MDA_CLSS Used on MDA_Pilot 4EBP1 4EBP1 Cell Signaling 9452 No 4EBP1.pS65 4EBP1 S65 Cell
Ductal pancreatic cancer modeling and drug screening using human pluripotent stem cell and patient-derived tumor organoids
 Ductal pancreatic cancer modeling and drug screening using human pluripotent stem cell and patient-derived tumor organoids Ling Huang 1, Audrey Holtzinger 1,2,11, Ishaan Jagan 1,11, Michael BeGora 1, Ines
CD Marker Antibodies. atlasantibodies.com
 CD Marker Antibodies atlasantibodies.com CD Marker Antibodies Product Name Product Number Validated Applications Anti-ACE HPA029298 IHC,WB Anti-ACKR1 HPA016421 IHC Anti-ACKR1 HPA017672 IHC Anti-ADAM17
The Center for PERSONALIZED DIAGNOSTICS
 The Center for PERSONALIZED DIAGNOSTICS Precision Diagnostics for Personalized Medicine A joint initiative between The Department of Pathology and Laboratory Medicine & The Abramson Cancer Center The (CPD)
Case Study - Informatics
 bd@jubilantbiosys.com Case Study - Informatics www.jubilantbiosys.com Validating as a Prognostic marker and Therapeutic Target for Multiple Cancers Introduction Human genome projects and high throughput
SSM signature genes are highly expressed in residual scar tissues after preoperative radiotherapy of rectal cancer.
 Supplementary Figure 1 SSM signature genes are highly expressed in residual scar tissues after preoperative radiotherapy of rectal cancer. Scatter plots comparing expression profiles of matched pretreatment
High Sensitivity Immunomagnetic CTC Isolation as Compared to Alternative Isolation Methods
 High Sensitivity Immunomagnetic CTC Isolation as Compared to Alternative Isolation Methods 1. Introduction: An overview of CTC isolation methods 2. Challenges for direct comparisons of CTC recovery 3.
Bezzi et al., Supplementary Figure 1 *** Nature Medicine: doi: /nm Pten pc-/- ;Zbtb7a pc-/- Pten pc-/- ;Pml pc-/- Pten pc-/- ;Trp53 pc-/-
 Gr-1 Gr-1 Gr-1 Bezzi et al., Supplementary Figure 1 a Gr1-CD11b 3 months Spleen T cells 3 months Spleen B cells 3 months Spleen Macrophages 3 months Spleen 15 4 8 6 c CD11b+/Gr1+ cells [%] 1 5 b T cells
Supplementary Figure 1. Characterization of ALDH-positive cell population in MCF-7 cells. (a) Expression level of stem cell markers in MCF-7 cells or
 Expression level of stem cell markers in MCF-7 cells or") Supplementary Figure 1. Characterization of ALDH-positive cell population in MCF-7 cells. (a) Expression level of stem cell markers in MCF-7 cells or ALDH-positive cell population by qpcr. Data represent
Supplementary Figure 1. Characterization of ALDH-positive cell population in MCF-7 cells. (a) Expression level of stem cell markers in MCF-7 cells or ALDH-positive cell population by qpcr. Data represent
Fig. S1. Upregulation of K18 and K14 mrna levels during ectoderm specification of hescs. Quantitative real-time PCR analysis of mrna levels of OCT4
 Fig. S1. Upregulation of K18 and K14 mrna levels during ectoderm specification of hescs. Quantitative real-time PCR analysis of mrna levels of OCT4 (n=3 independent differentiation experiments for each
Dox. R26-rtTA Tyr-CreERT2. any ink/arf, no rtta (n=8) ink/arf +/+ (n=5) Day 0 Day 11 Day 18 Day 28
 ink/arf +/+ (n=5) Day 0 Day 11 Day 18 Day 28") A 4OHT Dox hraf iip tumors inras ddh 2 O -RT Ink/Arf / Pten l/ l R26-lsl-rtTA Tyr-reERT2 TetO-hRAF V6E Ink/Arf / Pten / R26-rtTA Tyr-reERT2 TetO-hRAF V6E Ink/Arf / Pten / R26-rtTA Tyr-reERT2 TetO-hRAF
A 4OHT Dox hraf iip tumors inras ddh 2 O -RT Ink/Arf / Pten l/ l R26-lsl-rtTA Tyr-reERT2 TetO-hRAF V6E Ink/Arf / Pten / R26-rtTA Tyr-reERT2 TetO-hRAF V6E Ink/Arf / Pten / R26-rtTA Tyr-reERT2 TetO-hRAF
Clinical Grade Genomic Profiling: The Time Has Come
 Clinical Grade Genomic Profiling: The Time Has Come Gary Palmer, MD, JD, MBA, MPH Senior Vice President, Medical Affairs Foundation Medicine, Inc. Oct. 22, 2013 1 Why We Are Here A Shared Vision At Foundation
(A) Dose response curves of HMLE_shGFP (blue circle), HMLE_shEcad (red square),
 Dose response curves of HMLE_shGFP (blue circle), HMLE_shEcad (red square),") Supplementary Figures and Tables Figure S1. Validation of EMT-selective small molecules (A) Dose response curves of HMLE_shGFP (blue circle), HMLE_shEcad (red square), and HMLE_Twist (black diamond) cells
Supplementary Figures and Tables Figure S1. Validation of EMT-selective small molecules (A) Dose response curves of HMLE_shGFP (blue circle), HMLE_shEcad (red square), and HMLE_Twist (black diamond) cells
mir-509-5p and mir-1243 increase the sensitivity to gemcitabine by inhibiting
 mir-509-5p and mir-1243 increase the sensitivity to gemcitabine by inhibiting epithelial-mesenchymal transition in pancreatic cancer Hidekazu Hiramoto, M.D. 1,3, Tomoki Muramatsu, Ph.D. 1, Daisuke Ichikawa,
ras Multikinase Inhibitor Multikinase Inhibitor 0.1
 a ras ** * ** * ** ** ** ** un in et m lu Se ib SL G 32 W 7 So 50 ra 74 fe ni b LY W 294 or 0 tm 02 R an ap n a in Ev my er cin ol im BE us Z2 3 En P 5 za I13 st 0 au rin D as SP ati 60 nib C 012 is 5
T H E J O U R N A L O F C E L L B I O L O G Y
 Supplemental material Díaz et al., http://www.jcb.org/cgi/content/full/jcb.201209151/dc1 T H E J O U R N A L O F C E L L B I O L O G Y Figure S1. Hypoxia induces invadopodia formation in different epithelial
Supplement Results, Figures and Tables
 Supplement Results, Figures and Tables Results PET imaging The SUV was significantly higher in tumours of the parental HSC-3 cell line than tumours of the EV and the MMP-8 overexpressing cell lines (Figure
Supplementary Table 3. 3 UTR primer sequences. Primer sequences used to amplify and clone the 3 UTR of each indicated gene are listed.
 Supplemental Figure 1. DLKI-DIO3 mirna/mrna complementarity. Complementarity between the indicated DLK1-DIO3 cluster mirnas and the UTR of SOX2, SOX9, HIF1A, ZEB1, ZEB2, STAT3 and CDH1with mirsvr and PhastCons
stomach p63/krt5 CDH17 CEACAM5 CEACAM7 ANXA13 ANXA10 CLDN18 VSIG1 TFF2 VIL1 GDA
 Supplementary Fig. 1 a esophagus Barrett s e FABP1 Ecad stomach TFF3 b p63/krt5 CDH17 REG4 CDH17 f c signal intensity p63/krt5 EsoSC 5000 4000 3000 2000 CDH17 1500 1000 Barrett s KRT14 KRT6A KRT13 KRT5
SureSelect Cancer All-In-One Custom and Catalog NGS Assays
 SureSelect Cancer All-In-One Custom and Catalog NGS Assays Detect all cancer-relevant variants in a single SureSelect assay SNV Indel TL SNV Indel TL Single DNA input Single AIO assay Single data analysis
Supplementary Figure 1: High-throughput profiling of survival after exposure to - radiation. (a) Cells were plated in at least 7 wells in a 384-well
 Cells were plated in at least 7 wells in a 384-well") Supplementary Figure 1: High-throughput profiling of survival after exposure to - radiation. (a) Cells were plated in at least 7 wells in a 384-well plate at cell densities ranging from 25-225 cells in
Supplementary Figure 1: High-throughput profiling of survival after exposure to - radiation. (a) Cells were plated in at least 7 wells in a 384-well plate at cell densities ranging from 25-225 cells in
Supplemental Figure 1: Lrig1-Apple expression in small intestine. Lrig1-Apple is observed at the crypt base and in insterstial cells of Cajal, but is
 Supplemental Figure 1: Lrig1-Apple expression in small intestine. Lrig1-Apple is observed at the crypt base and in insterstial cells of Cajal, but is not co-expressed in DCLK1-positive tuft cells. Scale
Supplementary Figure 1. Identification of tumorous sphere-forming CSCs and CAF feeder cells. The LEAP (Laser-Enabled Analysis and Processing)
") Supplementary Figure 1. Identification of tumorous sphere-forming CSCs and CAF feeder cells. The LEAP (Laser-Enabled Analysis and Processing) platform with laser manipulation to efficiently purify lung
Supplementary Figure 1. Identification of tumorous sphere-forming CSCs and CAF feeder cells. The LEAP (Laser-Enabled Analysis and Processing) platform with laser manipulation to efficiently purify lung
Supplementary Figure 1
 Supplementary Figure 1 Supplementary Fig. 1: Quality assessment of formalin-fixed paraffin-embedded (FFPE)-derived DNA and nuclei. (a) Multiplex PCR analysis of unrepaired and repaired bulk FFPE gdna from
CTC molecular characterization: Are we ready to move forward with clinical testing?
 CTC molecular characterization: Are we ready to move forward with clinical testing? Michail Ignatiadis MD, PhD Jules Bordet Institute, Université Libre de Bruxelles Brussels, Belgium Breast cancer: Diagnostics
Treating patients affordably: personalized medicine in India
 economic Treating patients affordably: personalized medicine in India biologic B Moni Abraham Kuriakose MB ChB, MD, FDSRCS, FFDRCS, FRCS Ed., FRCS, Dip AB Professor and Director, Department of Surgical
SUPPLEMENTARY INFORMATION
 DOI:.38/ncb3399 a b c d FSP DAPI 5mm mm 5mm 5mm e Correspond to melanoma in-situ Figure a DCT FSP- f MITF mm mm MlanaA melanoma in-situ DCT 5mm FSP- mm mm mm mm mm g melanoma in-situ MITF MlanaA mm mm
Supplementary Figure 1. Basal level EGFR across a panel of ESCC lines. Immunoblots demonstrate the expression of phosphorylated and total EGFR as
 Supplementary Figure 1. Basal level EGFR across a panel of ESCC lines. Immunoblots demonstrate the expression of phosphorylated and total EGFR as well as their downstream effectors across a panel of ESCC
Supplemental Figure 1
 mrn/ mirn expression 3.5 3.5.5.5 +Jagged mir-5+jagged Supplemental Figure HS mir-5 Z H HS mir-5 Z H HS mir-5 Z H HM MF PT HM JG HS Percentage of 4-44 + cells (%) mrn/mirn 8 6 4.5.5.5 mir-5 sh-jg +Jagged
AdnaNews. News from the meeting on Advances in Circulating Tumor Cells (ACTC), Reythymnon, Crete, Greece October 8-11, 2014.
, Reythymnon, Crete, Greece October 8-11, 2014.") News from the meeting on Advances in Circulating Tumor Cells (ACTC), Reythymnon, Crete, Greece October 8-11, 2014. The ACTC meeting (www.actc2014.org) is together with the ISMRC meeting one of the most
News from the meeting on Advances in Circulating Tumor Cells (ACTC), Reythymnon, Crete, Greece October 8-11, 2014. The ACTC meeting (www.actc2014.org) is together with the ISMRC meeting one of the most
Supplementary Figure 1. SA-β-Gal positive senescent cells in various cancer tissues. Representative frozen sections of breast, thyroid, colon and
 Supplementary Figure 1. SA-β-Gal positive senescent cells in various cancer tissues. Representative frozen sections of breast, thyroid, colon and stomach cancer were stained with SA-β-Gal and nuclear fast
Supplementary Data Dll4-containing exosomes induce capillary sprout retraction ina 3D microenvironment
 Supplementary Data Dll4-containing exosomes induce capillary sprout retraction ina 3D microenvironment Soheila Sharghi-Namini 1, Evan Tan 1,2, Lee-Ling Sharon Ong 1, Ruowen Ge 2 * and H. Harry Asada 1,3
Genomic Analyses across Six Cancer Types Identify Basal-like Breast Cancer as a Unique Molecular Entity
 Genomic Analyses across Six Cancer Types Identify Basal-like Breast Cancer as a Unique Molecular Entity Aleix Prat, Barbara Adamo, Cheng Fan, Vicente Peg, Maria Vidal, Patricia Galván, Ana Vivancos, Paolo
well for 2 h at rt. Each dot represents an individual mouse and bar is the mean ±
 Supplementary data: Control DC Blimp-1 ko DC 8 6 4 2-2 IL-1β p=.5 medium 8 6 4 2 IL-2 Medium p=.16 8 6 4 2 IL-6 medium p=.3 5 4 3 2 1-1 medium IL-1 n.s. 25 2 15 1 5 IL-12(p7) p=.15 5 IFNγ p=.65 4 3 2 1
Enabling Personalized
 Molecular Enabling Personalized Diagnostics Medicine- Targeted Sequencing: NGS-based solutions Silvia Dorn Roel Reinders- Andreas Diplas Friday, 19.06.2015 Company Overview Founded in April 2011 Development
The Study of Pancreatic Circulating Tumor Cells via Isolation with an Integrated Microfluidic Immunomagnetic (IMI) Device. Rhonda Martha Jack
 Device. Rhonda Martha Jack") The Study of Pancreatic Circulating Tumor Cells via Isolation with an Integrated Microfluidic Immunomagnetic (IMI) Device by Rhonda Martha Jack A dissertation submitted in partial fulfillment of the requirements
The Study of Pancreatic Circulating Tumor Cells via Isolation with an Integrated Microfluidic Immunomagnetic (IMI) Device by Rhonda Martha Jack A dissertation submitted in partial fulfillment of the requirements
Social deficits in Shank3-deficient mouse models of autism are rescued by histone deacetylase (HDAC) inhibition
 inhibition") SUPPLEMENTARY INFORMATION Articles https://doi.org/10.1038/s41593-018-0110-8 In the format provided by the authors and unedited. Social deficits in Shank3-deficient mouse models of autism are rescued by
SUPPLEMENTARY INFORMATION Articles https://doi.org/10.1038/s41593-018-0110-8 In the format provided by the authors and unedited. Social deficits in Shank3-deficient mouse models of autism are rescued by
Moving cells on chips, microfluidics, and clinical medicine. Practical Gap in Biomedical Innovation:
 Massachusetts General Hospital Harvard Medical School Harvard-MIT Division of Health Sciences and Technology Moving cells on chips, microfluidics, and clinical medicine Mehmet Toner PhD Daniel Irimia MD
Protocol for A-549 VIM RFP (ATCC CCL-185EMT) TGFβ1 EMT Induction and Drug Screening
 TGFβ1 EMT Induction and Drug Screening") Protocol for A-549 VIM RFP (ATCC CCL-185EMT) TGFβ1 EMT Induction and Drug Screening Introduction: Vimentin (VIM) intermediate filament (IF) proteins are associated with EMT in lung cancer and its metastatic
Protocol for A-549 VIM RFP (ATCC CCL-185EMT) TGFβ1 EMT Induction and Drug Screening Introduction: Vimentin (VIM) intermediate filament (IF) proteins are associated with EMT in lung cancer and its metastatic
Supplementary Figure S1: Tanycytes are restricted to the central/posterior hypothalamus
 Supplementary Figure S1: Tanycytes are restricted to the central/posterior hypothalamus a: Expression of Vimentin, GFAP, Sox2 and Nestin in anterior, central and posterior hypothalamus. In the anterior
SUPPLEMENTARY FIGURE LEGENDS
 SUPPLEMENTARY FIGURE LEGENDS Supplementary Figure 1. Hippocampal sections from new-born Pten+/+ and PtenFV/FV pups were stained with haematoxylin and eosin (H&E) and were imaged at (a) low and (b) high
Inhibition of Cdk5 Promotes β-cell Differentiation from Ductal Progenitors
 Inhibition of Cdk5 Promotes β-cell Differentiation from Ductal Progenitors Ka-Cheuk Liu, Gunter Leuckx, Daisuke Sakano, Philip A. Seymour, Charlotte L. Mattsson, Linn Rautio, Willem Staels, Yannick Verdonck,
SUPPLEMENTARY FIG. S2. Representative counting fields used in quantification of the in vitro neural differentiation of pattern of dnscs.
 Supplementary Data SUPPLEMENTARY FIG. S1. Representative counting fields used in quantification of the in vitro neural differentiation of pattern of anpcs. A panel of lineage-specific markers were used
Figure S1. Reduction in glomerular mir-146a levels correlate with progression to higher albuminuria in diabetic patients.
 Supplementary Materials Supplementary Figures Figure S1. Reduction in glomerular mir-146a levels correlate with progression to higher albuminuria in diabetic patients. Figure S2. Expression level of podocyte
Figure S1, related to Figure 1. Escaper p38a-expressing cancer cells repopulate the tumors (A) Scheme of the mt/mg reporter that expresses a
 Scheme of the mt/mg reporter that expresses a") Cancer Cell, Volume 33 Supplemental Information Targeting p38a Increases DNA Damage, Chromosome Instability, and the Anti-tumoral Response to Taxanes in Breast Cancer Cells Begoña Cánovas, Ana Igea, Alessandro
Cancer Cell, Volume 33 Supplemental Information Targeting p38a Increases DNA Damage, Chromosome Instability, and the Anti-tumoral Response to Taxanes in Breast Cancer Cells Begoña Cánovas, Ana Igea, Alessandro
Supplementary Figure 1
 Combination index (CI) Supplementary Figure 1 2. 1.5 1. Ishikawa AN3CA Nou-1 Hec-18.5...2.4.6.8 1. Fraction affected (Fa) Supplementary Figure 1. The synergistic effect of PARP inhibitor and PI3K inhibitor
Thomas Jefferson University Annual Progress Report: 2008 Formula Grant
 Thomas Jefferson University Annual Progress Report: 2008 Formula Grant Reporting Period July 1, 2012 December 31, 2012 Formula Grant Overview The Thomas Jefferson University received $3,455,597 in formula
TEB. Id4 p63 DAPI Merge. Id4 CK8 DAPI Merge
 a Duct TEB b Id4 p63 DAPI Merge Id4 CK8 DAPI Merge c d e Supplementary Figure 1. Identification of Id4-positive MECs and characterization of the Comma-D model. (a) IHC analysis of ID4 expression in the
Early dissemination in prostate cancer
 Early dissemination in prostate cancer Miodrag Guzvic, University of Regensburg, Germany Adjuvant Palliative M0 Initiation Diagnosis Surgery Metastasis Death Intervention window to delay or prevent metastasis
Nature Genetics: doi: /ng Supplementary Figure 1. Depths and coverages in whole-exome and targeted deep sequencing data.
 Supplementary Figure 1 Depths and coverages in whole-exome and targeted deep sequencing data. Depth (top) and coverage (bottom) of whole-exome sequencing for 38 independent JPN cases (mean depth = 130)
The Presence and Persistence of Resistant and Stem Cell- Like Tumor Cells as a Major Problem in Ovarian Cancer
 Welcome! The Presence and Persistence of Resistant and Stem Cell- Like Tumor Cells as a Major Problem in Ovarian Cancer Prof. Sabine Kasimir-Bauer Department of Gynecology and Obstetrics University Hospital
Type of file: PDF Size of file: 0 KB Title of file for HTML: Supplementary Information Description: Supplementary Figures
 Type of file: PDF Size of file: 0 KB Title of file for HTML: Supplementary Information Description: Supplementary Figures Supplementary Figure 1 mir-128-3p is highly expressed in chemoresistant, metastatic
Nature Neuroscience: doi: /nn Supplementary Figure 1. Trial structure for go/no-go behavior
 Supplementary Figure 1 Trial structure for go/no-go behavior a, Overall timeline of experiments. Day 1: A1 mapping, injection of AAV1-SYN-GCAMP6s, cranial window and headpost implantation. Water restriction
ENFERMEDAD AVANZADA Qué hacemos con el triple negativo? Nuevas aproximaciones
 ENFERMEDAD AVANZADA Qué hacemos con el triple negativo? Nuevas aproximaciones Javier Cortes, Hospital Universitario Ramon y Cajal, Madrid Vall d Hebron Institute of Oncology (VHIO), Barcelona Triple Negative
Figure S4. 15 Mets Whole Exome. 5 Primary Tumors Cancer Panel and WES. Next Generation Sequencing
 Figure S4 Next Generation Sequencing 15 Mets Whole Exome 5 Primary Tumors Cancer Panel and WES Get coverage of all variant loci for all three Mets Variant Filtering Sequence Alignments Index and align
CTC in clinical studies: Latest reports on GI cancers
 CTC in clinical studies: Latest reports on GI cancers François-Clément Bidard, MD PhD GI cancers are characterized by Multimodal treatment strategies Treatments are adapted to tumor burden & prognosis
ILC1 and ILC3 isolation and culture Following cell sorting, we confirmed that the recovered cells belonged to the ILC1, ILC2 and
 Supplementary Methods and isolation and culture Following cell sorting, we confirmed that the recovered cells belonged to the, ILC2 and subsets. For this purpose we performed intracellular flow cytometry
High expression of cellular retinol binding protein-1 in lung adenocarcinoma is associated with poor prognosis
 High expression of cellular retinol binding protein-1 in lung adenocarcinoma is associated with poor prognosis Supplementary Material Supplementary Figure S1. Representative CRBP-1 immunostaining of non-neoplastic
Supplementary Table S1. List of PTPRK-RSPO3 gene fusions in TCGA's colon cancer cohort. Chr. # of Gene 2. Chr. # of Gene 1
 Supplementary Tale S1. List of PTPRK-RSPO3 gene fusions in TCGA's colon cancer cohort TCGA Case ID Gene-1 Gene-2 Chr. # of Gene 1 Chr. # of Gene 2 Genomic coordiante of Gene 1 at fusion junction Genomic
Next generation histopathological diagnosis for precision medicine in solid cancers
 Next generation histopathological diagnosis for precision medicine in solid cancers from genomics to clinical application Aldo Scarpa ARC-NET Applied Research on Cancer Department of Pathology and Diagnostics
Supplementary Table 1. The primers used for quantitative RT-PCR. Gene name Forward (5 > 3 ) Reverse (5 > 3 )
 Reverse (5 > 3 )") 770 771 Supplementary Table 1. The primers used for quantitative RT-PCR. Gene name Forward (5 > 3 ) Reverse (5 > 3 ) Human CXCL1 GCGCCCAAACCGAAGTCATA ATGGGGGATGCAGGATTGAG PF4 CCCCACTGCCCAACTGATAG TTCTTGTACAGCGGGGCTTG
770 771 Supplementary Table 1. The primers used for quantitative RT-PCR. Gene name Forward (5 > 3 ) Reverse (5 > 3 ) Human CXCL1 GCGCCCAAACCGAAGTCATA ATGGGGGATGCAGGATTGAG PF4 CCCCACTGCCCAACTGATAG TTCTTGTACAGCGGGGCTTG
Changing the Culture of Cancer Care II. Eric Holland Fred Hutchinson Cancer Research Center University of Washington Seattle
 Changing the Culture of Cancer Care II Eric Holland Fred Hutchinson Cancer Research Center University of Washington Seattle Transforming Cancer Therapy Eric Holland Fred Hutchinson Cancer Research Center
Supplementary Materials and Methods
 DD2 suppresses tumorigenicity of ovarian cancer cells by limiting cancer stem cell population Chunhua Han et al. Supplementary Materials and Methods Analysis of publicly available datasets: To analyze
Development of Circulating Tumor DNA
 Development of Circulating Tumor DNA Title of presentation Arial Bold 30pt in White Biomarkers Secondary title 22pt using Arial Next in White Generation Sequencing Brian Dougherty PhD, MBA Translational
SUPPLEMENTARY INFORMATION
 DOI: 10.1038/ncb3200 Supplementary Figure 1 Expression analysis of stomach markers in gutlike structure. (a) Differentiation scheme of gut-like structure formation from embryonic stem cells. (b) RT-PCR
Supplementary Tables. Supplementary Figures
 Supplementary Files for Zehir, Benayed et al. Mutational Landscape of Metastatic Cancer Revealed from Prospective Clinical Sequencing of 10,000 Patients Supplementary Tables Supplementary Table 1: Sample
a 10 4 Link et al. Supplementary Figure 1 Nature Immunology: doi: /ni.1842 Cells per mouse ( 10 5 ) TRPV2KO anti-gr1 anti-gr anti-f4/80
 TRPV2KO anti-gr1 anti-gr anti-f4/80") a 10 4 WT 10 4 TRPV2KO 10 3 10 3 anti-gr1 10 2 10 1 anti-gr1 10 2 10 1 10 0 10 0 10 1 10 2 10 3 10 4 anti-f4/80 42.3 45.2 10 0 10 0 10 1 10 2 10 3 10 4 anti-f4/80 10 4 10 4 40 42.5 anti-cd11b 10 3 10 2
a 10 4 WT 10 4 TRPV2KO 10 3 10 3 anti-gr1 10 2 10 1 anti-gr1 10 2 10 1 10 0 10 0 10 1 10 2 10 3 10 4 anti-f4/80 42.3 45.2 10 0 10 0 10 1 10 2 10 3 10 4 anti-f4/80 10 4 10 4 40 42.5 anti-cd11b 10 3 10 2
Comprehensive Genomic Profiling, in record time. Accurate. Clinically Proven. Fast.
 Comprehensive Genomic Profiling, in record time Accurate. ly Proven. Fast. PCDx advantages Comprehensive genomic profiling, in record time PCDx Comprehensive Genomic Profiling (CGP) provides precise information
Accel-Amplicon Panels
 Accel-Amplicon Panels Amplicon sequencing has emerged as a reliable, cost-effective method for ultra-deep targeted sequencing. This highly adaptable approach is especially applicable for in-depth interrogation
EMT and ECM. Jesse Liang, Ph.D. Sample & Assay Technologies
 EMT and ECM Jesse Liang, Ph.D. 1 Epithelial Cells.1. Closely adjoined.2. Polarized.Epithelial Markers: E-Cadherin (adherens junctions) Claudins (tight junctions) Occludin (tight junctions) Desmoplakin
Mitosis. Single Nano Micro Milli Macro. Primary. PCNA expression
 a b c DAPI YFP CC3 DAPI YFP PCNA DAPI YFP ph3 DAPI YFP KI67 e 6 Mitosis f 1 PCNA expression %ph3 + /YFP + n= 63 87 61 3 13 8 n= 15 3 9 1 5 %PCNA+/YFP+ 8 6 Supplementary Figure 1. Proliferation/apoptosis
Supplementary Figures
 Supplementary Figures Supplementary Figure 1 Characterization of stable expression of GlucB and sshbira in the CT26 cell line (a) Live cell imaging of stable CT26 cells expressing green fluorescent protein
Nature Neuroscience: doi: /nn Supplementary Figure 1. Neuron class-specific arrangements of Khc::nod::lacZ label in dendrites.
 Supplementary Figure 1 Neuron class-specific arrangements of Khc::nod::lacZ label in dendrites. Staining with fluorescence antibodies to detect GFP (Green), β-galactosidase (magenta/white). (a, b) Class
Supplementary Table S1. Primers used for quantitative real-time polymerase chain reaction. Marker Sequence (5 3 ) Accession No.
 Accession No.") Supplementary Tables Supplementary Table S1. Primers used for quantitative real-time polymerase chain reaction Marker Sequence (5 3 ) Accession No. Angiopoietin 1, ANGPT1 A CCCTCCGGTGAATATTGGCTGG NM_001146.3
Supplementary Tables Supplementary Table S1. Primers used for quantitative real-time polymerase chain reaction Marker Sequence (5 3 ) Accession No. Angiopoietin 1, ANGPT1 A CCCTCCGGTGAATATTGGCTGG NM_001146.3