ΠΑΝΕΠΙΣΤΗΜΙΟ ΠΑΤΡΩΝ ΤΜΗΜΑ ΙΑΤΡΙΚΗΣ ΤΜΗΜΑ ΦΥΣΙΚΗΣ ΔΙΑΤΜΗΜΑΤΙΚΟ ΠΡΟΓΡΑΜΜΑ ΜΕΤΑΠΤΥΧΙΑΚΩΝ ΣΠΟΥΔΩΝ ΣΤΗΝ ΙΑΤΡΙΚΗ ΦΥΣΙΚΗ
|
|
|
- Sheila Rodgers
- 6 years ago
- Views:
Transcription
1 ΠΑΝΕΠΙΣΤΗΜΙΟ ΠΑΤΡΩΝ ΤΜΗΜΑ ΙΑΤΡΙΚΗΣ ΤΜΗΜΑ ΦΥΣΙΚΗΣ ΔΙΑΤΜΗΜΑΤΙΚΟ ΠΡΟΓΡΑΜΜΑ ΜΕΤΑΠΤΥΧΙΑΚΩΝ ΣΠΟΥΔΩΝ ΣΤΗΝ ΙΑΤΡΙΚΗ ΦΥΣΙΚΗ ΠΟΙΟΤΙΚΗ ΚΑΙ ΠΟΣΟΤΙΚΗ ΕΚΤΙΜΗΣΗ ΔΙΑΜΕΣΗΣ ΝΟΣΟΥ ΤΟΥ ΠΝΕΥΜΟΝΑ ΣΤΗΝ ΠΟΛΥΤΟΜΙΚΗ ΥΠΟΛΟΓΙΣΤΙΚΗ ΤΟΜΟΓΡΑΦΙΑ ΝΙΚΟΛΑΟΣ ΠΑΠΑΠΑΝΑΓΙΩΤΟΥ ΙΑΤΡΟΣ ΔΙΠΛΩΜΑΤΙΚΗ ΕΡΓΑΣΙΑ ΠΑΤΡΑ 2013
2 UNIVERSITY OF PATRAS SCHOOL OF MEDICINE DEPARTMENT OF PHYSICS INTERDEPARTMENTAL COURSE OF POSTGRADUATE STUDIES IN MEDICAL PHYSICS QUANTITATIVE METHODS FOR THE ASSESSMENT OF INTESTITIAL LUNG DISEASE IN MDCT QUANTITATIVE METHODS FOR THE ASSESSMENT OF INTERSTITIAL LUNG DISEASE EXTENT IN MDCT NIKOLAOS PAPAPANAGIOTOU, MD MSc THESIS PATRAS
3 SUPERVISOR ASSOCIATE PROFESSOR L.COSTARIDOU DEPARTMENT OF MEDICAL PHYSICS, MEDICAL SCHOOL, UNIVERSITY OF PATRAS THREE MEMBERS EXAMMING COMMITEE PROFESSOR T. PETSAS DEPARTMENT OF RADIOLOGY, MEDICAL SCHOOL, UNIVERSITY OF PATRAS ASSOCIATE PROFESSOR L. COSTARIDOU DEPARTMENT OF MEDICAL PHYSICS, MEDICAL SCHOOL, UNIVERSITY OF PATRAS ASSISTANT PROFESSOR C. KALOGEROPOULOU DEPARTMENT OF RADIOLOGY, MEDICAL SCHOOL, UNIVERSITY OF PATRAS 3
4 ACKNOWLEDGEMENTS I wish to express my gratitude to my supervisor, L. Costaridou for her support and cooperation during the planning and development of this research work. My sincerest appreciation to Dr. C. Kalogeropoulou, who offered invaluable assistance and guidance during this effort and moreover for being an inspiring teacher in Radiology. Thanks also to Professor of Radiology T. Petsas for his guidance and support throughout my radiology residency program, as well as contribution in my Thesis. I am grateful to P. Korfiatis for his help with experimental setup and general advice; without his personal effort and support, this project would not have been materialized. I would like to thank S. Skiadopoulos for the statistical analysis, his valuable contribution and constructive recommendations during this work. I would also like to thank Dr. Sandra Kazantzi for her advice, useful critiques and for setting the stage of this research work. Finally, I am forever indebted to my family for their understanding, support and encouragement all these years. Amor fati et memento vivere 4
5 TABLE OF CONTENTS INTRODUCTION...8 PART 1 CHAPTER 1 INTRODUCTION TO LUNG ANATOMY 1.1. Lung anatomy Fissures and segments The Lung Interstitium Lung anatomical units CHAPTER 2 INTERSTITIAL LUNG DISEASES 2.1. Definition, Epidemiology, Classification Clinical course Pathophysiology- Histopathology Radiological findings X- Ray HRCT MD- HRCT Pattern recognition on HRCT Classification of Idiopathic Interstitial Pneumonias Collagen Vascular diseases Systemic Lupus Erythematosous Rheumatoid Arthritis Progressive systemic sclerosis Polymyositis - Dermatomyositis
6 2.7.5 Sjoegren Syndrome Mixed tissue connective disease Ankylosing Spondylitis Clinical assessment of patients with ILDs CHAPTER 3 BASICS ON COMPUTER AIDED DIAGNOSIS SYSTEMS (CAD) 3.1. History general aspects CADe and CADx CAD in Thoracic Imaging CHAPTER 4 QUANTIFICATION METHODS OF INTERSTITIAL LUNG DISEASE IN H- R COMPUTED TOMOGRAPHY 4.1. Visual scoring methods Comparative visual methods Semi- quantitative visual methods Semi- automated scoring methods Pixel- Based scoring methods Histogram semi- automated thresholding techniques Automated Systems PART II CHAPTER 5 MATERIALS AND METHODS 5.1. Clinical Dataset Image acquisition protocol
7 5.3. STEP 1: Semi- quantitative visual scoring STEP 2: Pixel- based visual scoring STEP 3: Disease extent assessment with histogram thresholding STEP 4: Disease extent assessment by a prototype CAD tool CHAPTER 6 RESULTS AND DISCUSSION 6.1. SEMI- QUANTITATIVE SCORING RAD1 - PIXEL- BASED RAD HISTOGRAM THRESHOLDING - PIXEL- BASED RAD CAD SYSTEM - PIXEL- BASED RAD CAD SYSTEM - HISTOGRAM THRESHOLDING SEMI- QUANTITATIVE SCORING - HISTOGRAM THRESHOLDING CAD SYSTEM - SEMI- QUANTITATIVE SCORING INTER- OBSERVER COMPARISON (RAD1 RADCONS) CHAPTER 7 CONCLUSIONS ABSTRACT ΠΕΡΙΛΗΨΗ REFERENCES
8 INTRODUCTION Interstitial lung diseases (ILDs), also called diffuse infiltrative lung diseases, are a heterogeneous group of disorders that predominantly affect the lung parenchyma and vary widely in etiology, clinic- radiologic presentation, histopathologic features, and clinical course. A wide range of acute and chronic pulmonary disorders is capable of diffusely affecting the lung parenchyma with variable amounts of inflammation, fibrosis, and architectural distortion. MDCT is the modality of choice for determining the extent of diffuse interstitial lung disease, especially idiopathic interstitial pneumonias. In addition, MDCT is useful for predicting the clinical outcomes, as the scoring of fibrosis correlates well with the mortality rate. Different systems for evaluating ILDs extent on HRCT have been developed over the past 20 years. Several scoring methods have been used to characterize and quantify the disease, correlate with common clinical parameters, prognose patients, assess disease progression and evaluate response to treatment. Among them, visual scoring remains the method of choice for assessing disease extent. However, the disease has been subjectively and qualitatively evaluated by radiologists using visual parameters who analyze a medical image by searching for specific disease patterns. The reproducibility of these scoring systems is reported as variable in literature and therefore, automated classification systems are necessary for objective and reproducible assessment of disease extent. Several automated classification systems have been developed based on the specific features of texture or intensity, such as a histogram, gradient and run- length matrix. The aim of this Thesis is to evaluate four different available methods for the assessment of interstitial lung disease extent. A radiologist in training evaluated disease extent using: (a) semi- quantitative visual scoring, as well as (b) pixel- based visual scoring and (c) a semi- automated histogram thresholding technique. Disease extent was also estimated by an automated CAD prototype system (d). All methods were applied to the same data sample of patients with collagen vascular diseases and lung involvement. Performances of all applied methods derived by the radiologist were compared pairwise in terms of degree of agreement. Finally, inter- observer variation between radiologist- in- trainee and two experienced radiologists in consensus was also investigated. 8
9 THESIS CONTRIBUTION: Evaluation of an Automated Image Quantification System of Interstitial Lung Disease in CT A. Kazantzi, P. Korfiatis, N. Papapanagiotou, S. Skiadopoulos, D. Daousis, T. Petsas, L. Costaridou, C. Kalogeropoulou. Scientific Exhibit - European Society of Thoracic Imaging Annual Meeting, London 2012 A pixel based scoring system for the assessment of image analysis quantification tools in ILD (Interstitial Lung Diseases) N. Papapanagiotou, A. Kazantzi, P. Korfiatis, S. Skiadopoulos, E. Costaridou, C. Kalogeropoulou Scientific Exhibit European Congress of Radiology, Vienna
10 PART I 10
11 PART I CHAPTER 1 INTRODUCTION TO LUNG ANATOMY The lung is uniquely designed to accomplish its major functions of movement of air, delivery of oxygen and removal of carbon dioxide from the circulation. Pulmonary anatomic compartments are tightly integrated for this purpose, while redundancy of structures and provisions for collateral ventilation and blood flow enable the lung to rapidly adjust to physiologic demands and meet the challenges imposed by disease. The intricate net- like connective tissue skeleton of the lung, with its intrinsic elasticity, enables the lung to function as a cohesive unit. Protected by the rigid thoracic cage and sealed in a bellows- like chamber, the lung responds to cyclical volume and pressure fluctuations coordinated with contractions of the diaphragm and thoracic muscles of respiration. The understanding of normal anatomy is essential for the recognition and appreciation of abnormal structure. Knowledge of normal lung structure is also crucial for evaluating radiologic appearances and in making radiographic - pathologic correlations. 1.1 LUNG ANATOMY The right and left lungs, invested in the visceral pleura, reside in their respective hemithoracic cavities, separated by the heart and mediastinal structures and bordered inferiorly by the diaphragm (Figure 1.1) (Gray, 2009). Because the size of the lung is dependent on its volume, lung weight is the usual measurement provided in anatomic descriptions. The normal weight range of each lung in an adult is roughly 300 to 450 g. 11
12 1.2 FISSURES AND SEGMENTS The right lung is divided into three lobes- upper, middle, and lower- that are demarcated from one another by a diagonal (major) fissure that separates the lower from the upper and middle lobes, and a horizontal (minor) fissure that separates the middle from the upper lobe. The left lung is composed of an upper and lower lobe separated by a single diagonal fissure. The lingula, which represents the anterior- inferior division of the left upper lobe, overrides the left cardiac ventricle, and is the counterpart of the right middle lobe (Figure 1.2, Figure 1.3). Deviations in fissure anatomy and distribution, including accessory and partial fissures, are common. Both lungs are divided in bronchopulmonary segments. A segment refers to that portion of lung supplied by a segmental bronchus. Except in situations of aberrant fissures, bronchopulmonary segments do not have defined anatomic boundaries. Connective tissue and smooth muscle provide the basic structure of the conducting airways. There are 16 to 20 tracheal cartilage rings, each of which is a C- ring that encircles approximately two thirds of the circumference of the trachea. Just below the level of the aortic arch, the tracheal carina marks the bifurcation of the right and left main bronchi. The left main bronchus angles 40 to 60 degrees off the original course of the trachea and extends longer than the right main bronchus as it circumvents the left side of the heart. The right main bronchus deviates only 20 to 30 degrees off the course of the trachea, following a nearly straight path into the right lower lobe bronchus. The rigidity of the extrapulmonary bronchi is maintained by cartilaginous C- rings. In the right hilum the main bronchus divides into the right upper lobe bronchus and a short segment, the bronchus intermedius, which then divides into the middle and lower lobe bronchi. The upper lobar bronchus divides into the three segmental bronchi. The middle lobe bronchus divides into the medial and lateral segmental bronchi. The right lower lobe bronchus is quite short due to the abrupt take off of the posteriorly directed lower lobe superior segmental bronchus at about the 23 level of the middle lobe bronchial origin. The lower lobe bronchus then proceeds toward the more distal bifurcations of the four basal segmental bronchi (Figure 1.4) (Enc.Britannica). 12
 division.")

13 The left main bronchus divides into upper and lower lobar branches. The left upper lobe bronchus branches into a superior division, which gives rise to apicoposterior and anterior segmental branches, and the inferior (lingular) division. The lower lobe bronchus divides into the superior segmental bronchus (as on the right) and continues to the four basal segmental divisions (Figure 1.4). The bronchi accompany the pulmonary arteries as bronchovascular bundles surrounded by a connective tissue sheath. With each division the caliber of the airways narrows. The number of airway divisions varies among lobes. The axial pathway (from the main bronchus to the terminal bronchiole) may contain as many as 25 divisions or as few as five airway generations (along shorter pathways). Normally bronchi are not macroscopically visible within 2cm of the visceral pleura. Figure 1.1: Lungs and mediastinum (Gray's Anatomy of the Human Body) Figure 1.2: Lung segmentation (Webb et al, 2001) 13
 The tracheobronchial tree consists of the following subdivisions from the trachea to the lung periphery: Trachea Main Bronchus Lobar Bronchus")

14 Figure 1.3: Lateral and medial aspect of both lungs (Webb et al, 2001) Figure 1.4: Tracheal division (Encyclopaedia Britannica) The tracheobronchial tree consists of the following subdivisions from the trachea to the lung periphery: Trachea Main Bronchus Lobar Bronchus Segmental Bronchus Conducting bronchiole Terminal bronchiole. A terminal bronchiole is a bronchiole at the end of the conducting zone. At the transition into the respiratory zone, alveoli become present.the terminal bronchiole is the most distal segment of the conducting zone. It branches off the lesser bronchioles. Each of the terminal bronchioles divides to form respiratory bronchioles, which contain a small number of alveoli. Terminal bronchioles are lined with simple cuboidal epithelium. Respiratory bronchiole 14

15 Alveolar duct. Alveolar ducts are tiny ducts that connect the respiratory bronchioles to alveolar sacs, each of which contain a bunch of alveoli (the balls). They are tiny end ducts of the branching airways that fill the lungs. Each lung holds approximately 1.5 to 2 million of them. The tubules divide into two or three alveolar sacs at the distal end. They are formed from the confluence openings of several alveoli. Distal terminations of alveolar ducts are atria which then end in alveolar sacs. Alveolar sack Alveolus. An alveolus is an anatomical structure that has the form of a hollow cavity. Found in the lung parenchyma, the pulmonary alveoli are the terminal ends of the respiratory tree, which outcrop from either alveolar sacs or alveolar ducts, which are both sites of gas exchange with the blood as well. The alveolar membrane is the gas- exchange surface. Carbon dioxide rich blood is pumped from the rest of the body into the alveolar blood vessels where it through diffusion releases its carbon dioxide and absorbs oxygen (Fig 1.5) (The respiratory system, antranik.org). Figure 1.5: Structures of the respiratory zone (The respiratory system, antranik.org) 15
16 1.3 THE LUNG INTERSTITIUM The lung is supported by a network of connection tissue fibers called the lung interstitium and is divided in two parts: The peribronchovascular interstitium is a system of fibers that invests bronchi and pulmonary arteries. In the perihilar regions the peribronchovascular interstitium forms a strong connective tissue sheath that surrounds large bronchi and arteries. The more peripheral continuum of this interstitial fiber system, which is associated with small centrilobular bronchioles and arteries is termed the centrilobular interstitium. These two components together correspond to the axial fiber system, which extends peripherally from the pulmonary hila to the level of the alveolar ducts and sacs. The subpleural interstitium is located beneath the visceral pleura; it envelops the lung in a fibrus sac from which connective tissue septa penetrate into the lung parenchyma. These septa include the interlobular septa and together with the subpleural interstitium form the peripheral fiber system. The intralobular interstitium is a network of thin fiber system that forms a fine connective tissue mesh in the walls of alveoli and thus bridges the gap between the centrilobular interstitium in the center of lobules and the interlobular septa and subpleural interstitium in the lobular periphery. Intralobular interstitium, peribronchovascular interstitium, centrilobular interstitium, subpleural interstitium and interlobular septa create a continuous fiber skeleton in the lung (Figure 1.6) (Webb, 2008). 16
17 Figure 1.6: Lung interstitium (Webb, 2008) 1.4 LUNG ANATOMICAL UNITS The lung is comprised of numerous anatomical units, which are smaller than a lobe or segment. Among them, secondary pulmonary lobule and acinus (Figures 1.7, 1.10) are widely regarded to be the most important from physiological, pathological but also radiological aspect. The secondary pulmonary lobule according to Miller, refers to the smallest unit of lung structure that is marginated by connective tissue septa (Figures 1.7, 1.8). These structures are irregularly polyhedral in shape and vary in size, measuring from 1 to 2,5 cm in diameter in most locations. Airways, pulmonary arteries and veins, lymphatics and the various components of the pulmonary interstitium are all represented at the level of the secondary pulmonary lobule. Each lobule is supplied by a small bronchiole and pulmonary artery branch (Figures 1.8, 1.9), 17
. Figure 1.")


 Figure 1.")
18 Figure 1.7: Secondary lobule and acinus (The Fleischner Lecture W. Richard Webb, Radiology 2006, 239, ). Figure 1.8: X- ray of an 1mm thin slice that shows two secondary lobules. S: interlobular septa, V: venules, Α: arterioles, Β: centrilobular bronchioles. (Thin- Section CT of the Secondary Pulmonary Lobule: Anatomy and the Image 2004 The Fleischner Lecture W. Richard Webb, Radiology 2006, 239, ). Figure 1.9: Secondary lobule s blood supply (Webb, 2009) Figure 1.10: Secondary lobule and acinus. Terminal bronchioles (arrows) (Webb, 2009) 18
19 and is variably marginated in different lung regions by connective tissue interlobular septa, containing pulmonary veins and lymphatics. Secondary lobular anatomy is easily visible on the surface of the lung because of these interlobular septa. Secondary pulmonary nodules are usually comprised of a dozen or fewer acini, although the number varies. It has three principal components: Interlobular septa. Secondary lobules are emarginated by connective tissue interlobular septa, which extend inward from the pleural surface, as part of the peripheral fiber system. These septa contain vein and lymphatics. Centrilobular structures. The central portion of the lobule contains the pulmonary artery and bronchiolar branches that supply the lobule, as well as some supporting connective tissue. Lobular parenchyma and lung acini. It consists of functioning lung parenchyma, namely, alveoli and the associated capillary bed, supplied by small airways and branches of the pulmonary artery and veins. The pulmonary acinus is smaller than the secondary lobule and is defined as the portion of the lung distal to a terminal bronchiole e.g the last pure conductive airway- and is supplied by a first order respiratory bronchiole or bronchioles (Figure 1.10). Because respiratory bronchioles are the largest airways that have alveoli in their wall, an acinus is the largest lung unit in which all airways participate in gas exchange. Acini are usually described as ranging from 6 to 10 mm in diameter in adults. This parenchyma is supported by a connective tissue stroma, a fine network of very thin fibers within the alveolar septa termed the intralobular interstitium. 19
20 CHAPTER 2 INTERSTITIAL LUNG DISEASES 2.1 DEFINITION EPIDEMIOLOGY - CLASSIFICATION Interstitial lung diseases (ILDs), also called diffuse infiltrative lung diseases, are a heterogeneous group of disorders that predominantly affect the lung parenchyma and vary widely in etiology, clinic- radiologic presentation, histopathologic features, and clinical course. A wide range of acute and chronic pulmonary disorders is capable of diffusely affecting the lung parenchyma with variable amounts of inflammation, fibrosis, and architectural distortion. These diseases form a heterogeneous group of disorders that includes at least 150 distinct clinical entities. The pulmonary interstitium is confined to the microscopic anatomic space that is bounded by the basement membranes of epithelial and endothelial cells. The pathologic features of these diseases, even if originating in the interstitium, regularly include structures that are well beyond it, including the alveolar space, small airways, vessels, and even the pleura. No universally accepted classification of ILDs exists. Various classification schemes have been proposed with stratification based on parameters such as clinical presentation (acute vs chronic), histopathologic findings, radiologic patterns, and response to corticosteroid therapy (responsive vs nonresponsive to corticosteroids). Perhaps the most practical classification of ILDs for clinicians is a scheme based on cause (Webb, 2009) (Figures 2.1, 2.2). 20
21 Figure 2.1: ILDs classification (Diagnosis of Interstitial Lung Diseases, Mayo Clin Proc. 2007;82(8): ) Figure 2.2: ATS- ERS classification (Mueller- Mang et al, 2007) 21
22 2.2 CLINICAL COURSE In essence, without a medical history, all ILDs are of unknown cause. For an accurate diagnosis there is no substitute for a complete clinical evaluation. Although the presence of diffuse lung disease in the immunocompetent host poses a significant challenge, clinicians recognize some general findings that are common to most patients who have ILD. These include: a) exertional dyspnea or cough; b) bilateral diffuse interstitial infiltrates on chest radiographs; c) physiologic and gas exchange abnormalities, including a decreased DLCO and an abnormal alveolararteriolar PO2 difference [P(A- a)o2] at rest or with exertion; and d) histopathologic abnormalities of the pulmonary parenchyma that are characterized by varying degrees of inflammation, fibrosis, and remodeling. The major physiologic consequence of ILDs is impaired gas exchange. Thus, progressive ILD results in worsening respiratory insufficiency and ultimately death due to respiratory failure (Brown et al, Clin Chest Med 25 (2004) ). 2.3 PATHOPHYSIOLOGY - HISTOPATHOLOGY This group of disorders has been categorized on the basis of clinical dysfunction ( restrictive lung disease ) or radiologic appearance (ILD s), neither of which accurately reflects the pathologic processes involved. Diffuse ILDs encompass mainly inflammatory processes that involve the structural elements of this organ. The general histopathologic findings in ILD s can be categorized in six major histologic patterns. Acute lung injury: Diffuse alveolar damage (DAD) with hyaline membranes Fibrosis: accrual of collagen in the lung, with permanent structural remodeling 22


23 Cellular interstitial infiltrates. Lymphocytes, plasma cells, and macrophages are present in the alveolar walls Airspace filling. This pattern is characterized by the presence of cells or other material filling the alveolar spaces (proteinaceous material, blood, cells) Nodules. The presence of discrete nodules in the lung parenchyma raises a differential diagnosis that includes nodular infections, benign and malignant neoplasms, sarcoidosis, Langerhans cell histiocytosis, and various bronchiolocentric diseases. Subtle small airways disease, in which pruning, dilatation, and generalized scarring of the small airways occur (Leslie et al, Clin Chest Med 25 (2004) ). 1. Pattern 1: Acute lung injury. DAD with hyaline membranes, classically encountered in the clinical setting of ARDS. 2. Pattern 2: Fibrosis. Lung diseases that lead to the accrual of collagen in the lung, with permanent structural remodeling, are represented by this pattern. 3. Pattern 3: Cellular interstitial infiltrates. Lymphocytes, plasma cells, and macrophages are present. 4. Pattern 4: Airspace filling. The alveolar spaces are filled with cells or other material. Organizing pneumonia is the prototype of this pattern. 5. Pattern 5: Nodules. The presence of discrete nodules in the lung parenchyma raises a narrow differential diagnosis. 6. Pattern 6: Near normal lung. The surgical lung biopsy that has barely discernible abnormalities. The changes may be subtle at low magnification. The prototype is small airways disease. Figure 2.3: Histologic patterns in ILDs (K.O. Leslie / Clin Chest Med 25 (2004) ) 23

24 2.4 RADIOLOGIC FINDINGS CHEST X- RAY Chest X Ray is the first step in imaging processes of the diffuse lung diseases. It remains a low cost and low dose procedure and widely available. The main imaging features of intestitial lung diseases are: lung volume loss and presence of bilateral reticular or reticular/nodular pattern. The sensitivity and specificity of this method is 80% and 82% respectively. False negative results may occur in 10-15% of patients with confirmed interstitial disease. Figure 2.4: Chest Radiographic patterns in Interstitial Lung diseases. Schwarz, MI, King, TE Jr. Approach to the evaluation and diagnosis of interstitial lung disease. Interstitial Lung Disease, 4th ed, ON, Canada. 2003). 24
 techniques are capable of imaging the lung with excellent spatial resolution providing useful anatomical detail.")
25 Figure 2.5: Reticular pattern demonstrated on the x- ray of a patient with ILD (Zompatori et al., 2004) HRCT - MD- HRCT High resolution computed tomography (HRCT) techniques are capable of imaging the lung with excellent spatial resolution providing useful anatomical detail. HRCT can demonstrate the normal and abnormal lung interstitium and morphologic characteristics of both localized and diffuse parenchymal abnormalities and is clearly superior to plain radiographs. The components of the HRCT findings that are helpful in the diagnosis of ILD include the pattern of parenchymal abnormality (eg, consolidation, reticular pattern), the anatomic distribution (upper vs lower, central vs peripheral), and associated findings (eg, mediastinal lymphadenopathy). Combining the tempo of the disease process with the radiologic findings helps narrowing the differential diagnosis. HRCT may be performed with individual axial scans being obtained at spaced intervals usually 1 to 2 cm without table motion from apices to bases (single mode for MDCT step and shoot technique). HRCT intents to sample lung anatomy, with the assumptions that a diffuse lung disease will be visible in at least one of the levels sampled and the findings seen at the levels scanned will be representative of the pathology through the lung. 25


26 The use of MDCT scanners capable of rapid scanning and thin slice acquisition has revolutionized HRCT technique. Multi detector row CT generates isotropic volumetric high- resolution data and allows contiguous visualization of the lung parenchyma. The various patterns of diffuse lung disease seen at high- resolution CT have all been described. This information is now being used for volumetric multi detector row CT. Although the various high- resolution CT patterns are still valid, multi detector row CT allows visualization in three dimensions (Figures 2.6, 2.7) by providing an isotropic volumetric data set and the ability to create two- dimensional (2D) and three- dimensional (3D) reformatted images of excellent quality and significance. In conclusion, volumetric HRCT has several advantages: a) it allows complete imaging of the lungs and thorax (Figure 2.6), b) defines more accurate the lung abnormalities due to contiguous slices, c) scan data may be reconstructed in any plane or used to create MIP and MinIP algorithms, d) enables level by level comparison of different studies obtained in different times for disease progression assessment. However, the use of volumentric helical HRCT results in a greater radiation dose than does spaced axial imaging (2-8 msv). The use of low dose protocols in HR- MDCT may replace the conventional technique in the future. Conventional HRCT has also shown better quality in imaging of ground glass opacities (Webb, 2009). Figure 2.6: Reticular pattern with honey- combing appearance demonstrated on axial, coronal and saggital plane after MIP reconstruction MIP: Maximum Intensity Projection (from an archive case). 26

27 Figure 2.7: Volume rendering reconstruction of the same case (Fig. 2.6) that allows imaging of the thoracic cage bone algorithm. 2.5 PATTERN RECOGNITION ON HRCT Radiological findings on HRCT may be categorized to groups according to the impact on lung attenuation. This subdivision forms several patterns of appearance for the abnormal findings. These findings are categorized mainly into two large subgroups, depending whether they increase or decrease the lung attenuation. Ø INCREASED LUNG ATTENUATION I. Linear and reticular opacities This pattern is defined as thickening of the interstitial fiber network of the lung by fluid or fibrous tissue, or because of interstitial infiltration by cells or other substances. These incidents result primarily in an increase in linear or reticular lung opacities and can be seen on HRCT as: peribronchovascular interstitial thickening, interlobular septal thickening, parenchymal bands, subpleural interstitial thickening, intralobular interstitial thickening, honeycombing, irregular reticulation, and subpleural lines (Figure 2.8). 27
 (Webb, 2011) II.")


28 a b c d Figure 2.8a,b: Schematic representation of linear (a) and reticular (b) opacities. Axial CT slices from different patients show thickened, smooth interlobular septa (c,d) (Webb, 2011) II. Nodular opacities The term nodule is used to describe a rounded opacity, well or ill defined, and no more than 3 cm in diameter. The assessment and differential diagnosis is based on their size, distribution, appearance and attenuation. Micronodule is a nodule smaller than 3mm and a small nodule has a diameter < 10 mm. A large nodule is used to refer to nodules 1cm or larger in diameter. According to the appearance, nodules can be described as ill or well defined. Usually, interstitial nodules are well defined where air space nodules are ill defined. This distinction is often arbitrary on HRCT. Their distribution may be centrilobular, perilympatic or random. A centrilobular distribution of nodular opacities may also be associated with an important finding, termed tree in bud and reflects the dilated centrilobular bronchioles from mucus, fluid or pus (Figure 2.9). 28
, centrilobular (b) and random (c) distribution of nodules in MIP reconstructed images of")


.")

29 a b c Figure 2.8: Figures a,b,c: Perilymphatic (a), centrilobular (b) and random (c) distribution of nodules in MIP reconstructed images of of different patients. Tree- in- bud I also noticed (arrows) on image (b) (Webb, ( 2009) III. Parenchymal opacification Parenchymal opacification refers to a diffuse or multifocal increase in lung attenuation and is a common finding on HRCT. Ground glass opacity refers to a hazy increase in lung opacity that is not associated with obscuration of the underlying vessels or bronchial margins (Figure 2.9a). If vessels are obscured then the term consolidation is used to describe the increased lung opacification (Figure 2.9b). Both may be results of interstitial and air space disease. It may reflect minimal interstitial thickening of alveolar interstitium, thickening of alveolar walls, or the presence of cells or fluid that partially fill the alveolar spaces. GGO often indicates the presence of an ongoing, active and potentially treatable process. The superimposition of reticular pattern in ground glass opacity creates the crazy paving pattern. a Figure 2.9: Axial slices showing ground glass opacification (a) and consolidation with air- bronchogram (b) in different patients ( b 29
30 Ø DECREASED LUNG ATTENUATION I. Cystic lesions The cystic lesions include honeycombing, lung cysts, emphysema, bullae, pneumatoceles, cavitary nodules and bronchiectasis. Honeycombing (Figure 2.10a) is formatted by dilatation of alveolar ducts and bronchial dilatation in patients with pulmonary fibrosis. The term lung cyst refers to a well- rounded and defined lesion variable in thickness but usually thin (less than 2-3mm thick). It usually contains air but liquid, solid or semi- solid material can be present. Emphysema is a permanent abnormal enlargement of air spaces distal to terminale bronchiole and accompanied by destruction of the walls of the involved air spaces (Figure 2.10b). Bronchiectasis is generally defined as localized, irreversible bronchial dilatation, often with thickening of the bronchial wall (Figure 2.12a). II. Mosaic attenuation Lung density and attenuation are partially determined by the amount of blood present in lung tissue. Inhomogeneous lung opacity can result from regional differences in lung perfusion in patients with airway disease or pulmonary vascular disease (Figure 2.12b). III. Air trapping Air trapping in chest imaging refers to retention of excess gas ( air ) in all or part of the lung, especially during expiration, either as a result of complete or partial airway obstruction or as a result of local abnormalities in pulmonary compliance. It is a descriptor used in lung CT seem as a decreased attenuation of pulmonary parenchyma, especially manifest as less than normal increase in attenuation during expiration acquisition. Must be differentiated from the decreased attenuation of hypoperfusion secondary to locally increased pulmonary arterial resistance. The presence of air 30

 and")
 b a b Figure 2.")
 and expiration (b).")
 (sciencedirect.com) a b Figure 2.")
31 trapping can arise from a number of causes but usually suggests obstructive airway disease (Figure 2.11). b a Figure 2.10: Axial slices showing honeycombing (a) and centrilobular emphysema (b) ( b a b Figure 2.11: Axial chest CT slices of the same patient in deep inspiration (a) and expiration (b). Areas of air trapping are demonstrated on the second image (b) (sciencedirect.com) a b Figure 2.12: Dilated bronchi (a) and mosaic perfusion (b) (Die Lunge im Netz research.de) 31
32 2.6 CLASSIFICATION OF IDIOPATHIC INTERSTITIAL PNEUMONIAS (IIPs) The American Thoracic Society European Respiratory Society classification of idiopathic interstitial pneumonias (IIPs), published in 2002, defines the morphologic patterns on which clinical- radiologic- pathologic diagnosis of IIPs is based. 1. Idiopathic Pulmonary Fibrosis (IPF) Usual Interstitial Pneumonia (UIP) IPF is the most common entity of the IIPs and refers to the clinical syndrome associated with the morphologic pattern of UIP. With a median survival time ranging from 2 to 4 years, IPF has a substantially poorer prognosis than NSIP, COP, RB- ILD, DIP, and LIP. The main symptoms are progressively worsening dyspnea and nonproductive cough. Many patients also report that the subtle onset of their symptoms months or even years earlier was mistaken for a less serious respiratory disease, which delayed referral to a specialized center. There is no statistically significant gender predilection. Smoking is considered as a risk factor. Hence, it doesn t affect the prognosis. Therapy with high doses of corticosteroid does not alter the physical course of the disease. However, a combination therapy of cyclosporine A and corticosteroids seems to be efficacious for acute exacerbations of IPF. The only effective treatment for these patients is lung transplantation. Ø Radiologic features: Subpleural reticular opacities, macrocystic honeycombing combined with traction bronchiectasis and the apicobasal gradient represents a trio of signs that is highly suggestive of UIP (Figure 2.13). The findings are more extensive on the basal section of the high- resolution CT examination. Volume loss and ground glass opacities are present in the majority of patients with UIP but are usually limited in extent. Imaging findings are heterogeneous and areas of fibrosis alter with areas of normal lung. (Mueller- Mang et al, Radiographics, 2009) 32
 Ø Histologic features: The characteristic histologic finding of UIP is the presence of scattered fibroblastic foci.")

33 Figure 2.13: Axial (a) and coronal images (b) of a patient with IPF. Honeycombing (head arrows) and bronchiectasis (arrows), with apicobasal distribution (radiographics.rsna.org) Ø Histologic features: The characteristic histologic finding of UIP is the presence of scattered fibroblastic foci. Interstitial inflammation and honeycombing alternate with normal lung (Figure 2.14). Multiple biopsy specimens need to be evaluated due to the patchy involvement. High- resolution CT should serve as a guiding tool for determining the appropriate anatomic location of the biopsy site. Figure 2.14: Patchy fibrosis with remodeling of the lung architecture. Cystically dilated airspaces that produce a honeycomb pattern and areas of relatively unaffected lung are present (en.wikipedia.org) 33
34 2. Non- Specific Interstitial Pneumonia (NSIP) NSIP is associated with a variety of imaging and histologic findings. The diagnosis of this pattern is very challenging because the treatment of these patients with corticosteroids is beneficial. The typical patient with NSIP is is usually about a decade younger than the patient with IPF. Symptoms of NSIP are similar to those of IPF but usually milder. Patients present with gradually worsening dyspnea over months. There is no gender predilection, and cigarette smoking is not an obvious risk factor. The systematic administration of steroids in combination with cytotoxic drugs improves in most cases the clinical status. The morphologic pattern of NSIP is also present in other conditions, such as connective tissue diseases, hypersensitivity pneumonitis and drug exposure. Ø Radiologic Features: High- resolution CT typically reveals a subpleural and rather symmetric distribution of lung abnormalities. The most common manifestation consists of patchy ground- glass opacities combined with irregular linear or reticular opacities and scattered micronodules. Traction bronchiectasis and consolidation can be spontaneously seen. Ground- glass opacities are the most frequently seen in high- resolution CT (Figure 2.15c). Other findings in advanced NSIP include subpleural cysts, but compared to those of UIP, these cysts are smaller and limited in extent. The term microcystic honeycombing is used for these cystic changes in NSIP, as opposed to the macrocystic honeycombing seen in UIP. Although the CT features of cellular and fibrotic NSIP overlap considerably, it has been shown that honeycombing is seen almost exclusively in patients with fibrotic NSIP. Other CT findings that have been correlated with increased likelihood of fibrosis in NSIP are the extent of traction bronchiectasis and intralobular reticular opacities. Owing to the substantial overlap of high- resolution CT patterns, the major CT differential diagnosis for NSIP is UIP. The key CT features that favor the diagnosis of NSIP over UIP are homogeneous lung involvement without an obvious apicobasal gradient, extensive ground- glass abnormalities, a finer reticular pattern, and micronodules. The ground glass abnormalities progress almost always in fibrosis in patients with UIP in contrast to NSIP. 34

.")
,(b) Photomicrograph (hematoxylin- eosin stain) of cellular NSIP shows a uniform appearance of interstitial inflammation which consists of lymphocytes and plasma cells.")
35 Ø Histologic Features: The histologic pattern of NSIP is characterized by temporally and spatially homogeneous lung involvement. This homogeneity is crucial for differentiating the NSIP pattern from the UIP pattern. On the basis of the varying proportions of inflammation and fibrosis, NSIP is divided into cellular and fibrosing subtypes. In cellular type, the thickening of alveolar septa is primarily caused by inflammatory cells; in fibrosing type, interstitial fibrosis is seen in addition to mild inflammation (Figure 2.15a,b). Cellular NSIP is less common than fibrosing NSIP but shows a better response to corticosteroids. a b c Figure 2.15: (a),(b) Photomicrograph (hematoxylin- eosin stain) of cellular NSIP shows a uniform appearance of interstitial inflammation which consists of lymphocytes and plasma cells. (c) axial CT slice showing patchy ground glass opacities with prone subpleural distribution and fine reticulation (radiographics.rsna.org) 3. Lymphoid Intestitial Pneumonia (LIP) LIP is very rare and usually accompanies systemic disorders, especially Sjogren syndrome, HIV infection and variable immunodeficiency syndromes. Patients present with slowly progressive dyspnea and cough over years. LIP is more common in women than in men, and occasionally, patients report systemic symptoms, such as fever, night sweats, and weight loss. In the past, LIP was considered a pulmonary lymphoproliferative disorder, with subsequent progression to malignant lymphoma. However, many of these cases were reclassified as lymphoma from the outset, and only a small number of definite LIP cases seem to actually undergo malignant transformation. Steroids are used to treat patients with LIP; however, it is 35

. Occasionally, centrilobular nodules and septal thickening are seen.")
36 not yet proved if these drugs improve the patients status. Ø Radiologic Features: Diffuse bilateral abnormalities with often a lower lung predominance is the most common finding in HRCT. Another characteristic finding is thin- walled perivascular cysts. These lesions are usually within the lung parenchyma throughout the mid lung zones and presumably result from air trapping due to peribronchiolar cellular infiltration. In combination with ground glass opacities, these cysts are highly suggestive of LIP (Figure 2.16a,b). Occasionally, centrilobular nodules and septal thickening are seen. Ø Histologic Features: The LIP pattern is characterized by diffuse infiltration of the interstitium by lymphocytes, plasma cells, and histiocytes (Figure 2.16c). Reactive lymphoid follicles are often present and distributed along the peribronchiolar regions, which are highly inflamed. Although the predominant changes are interstitial, the airspaces display secondary changes, which range from compression by the interstitial infiltrates to proteinaceous fluid and macrophage collections. a b Figure 2.16: (a) Ground glass opacities (star) and perivascular cysts (arrow heads) on axial CT image of a patient with LIP. Mild subpleural reticulation is noted (black arrow). (b) Different patient with LIP and multiple small cysts (arrow heads) on CT. (c) Photomicrograph (hematoxylin- eosin stain) shows widening of alveolar septa by lymphoid infiltrates, which consist of mature lymphocytes, plasma cells, and histiocytes (radiographics.rsna.org) 36 c
37 4. Cryptogenic Organizing Pneumonia (COP) This entity was formerly referred to as bronchiolitis obliterans organizing pneumonia (BOOP). The term BOOP has been omitted to avoid confusion with airway diseases such as constrictive bronchiolitis. The average patient is about 50 years old and no gender predilection has been noticed. The symptoms are mild dyspnea, cough and fever that have been developed within weeks. In most cases, a recent respiratory infection is reported in the patients history. This entity appears more often in non- or ex- smokers and no gender predilection has been reported. COP has a favorable prognosis after steroid therapy but relapses may occur within three months after therapy has been stopped. The disease is frequently associated with other conditions, such as collagen vascular diseases, infections and drug administration. Therefore, these entities must be first excluded in order to reach a COP diagnosis. Ø Radiologic Features: Unilateral or bilateral patchy consolidations are usually present on chest x- ray. This finding does not resemble active pneumonia but intraalveolar fibroblastic proliferation usually after a prior viral infection. Some patients present with nodular opacities on the chest radiograph. Lung volumes are preserved in most patients. The lung abnormalities show a characteristic peripheral or peribronchial distribution, and the lower lung lobes are more frequently involved. In some cases, the outermost subpleural area is spared. Typically, the appearance of the lung opacities varies from ground glass to consolidation; in the latter, air bronchograms and mild cylindrical bronchial dilatation are a common finding. These opacities have a tendency to migrate, changing location and size, even without treatment. Apart from the typical imaging pattern of COP, other less specific imaging patterns can be encountered. These atypical imaging findings include irregular linear opacities, solitary focal lesions that resemble lung cancer, or multiple nodules that may cavitate. A characteristic imaging finding in COP is central ground- glass opacity surrounded by denser air- space consolidation of crescentic and ring shapes. The central ground glass opacity corresponds histopathologically to the area of alveolar septal inflammation and cellular debris, and the ring- shaped or crescentic peripheral air- space consolidation, to the area of organizing pneumonia within the alveolar ducts. Halo sign on high- resolution CT in pulmonary disease refers to the condition in which a less dense or ground- glass area of lung 37

38 attenuation (compared with the central nodule or mass) extends around the entire circumference of the central nodule or mass. Because central ground- glass opacity was surrounded by denser air- space consolidation of crescentic and ring shape in the cryptogenic organizing pneumonia cases this appearance is called reversed halo sign (Voloudaki et al) (Figure 2.17). Ø Histologic Features: The presence of granulation tissue polyps in the alveolar ducts and alveoli is the characteristic feature in COP. These fibroblast proliferations result from organization of inflammatory intraalveolar exudates. Typically, there is patchy lung involvement with preservation of lung architecture. The granulation tissue is all the same age and contains few inflammatory cells. Figure 2.17: An axial CT slice demonstrating a RLL consolidation and reverse halo sign (arrows) (radiology.ucsf.edu) 5. Respiratory Bronchiolitis associated Interstitial Pneumonia (RB- ILD) Respiratory Bronchiolitis associated Interstitial Pneumonia represents an exaggerated and symptomatic type of the common and asymptomatic respiratory bronchiolitis. It is a smoking related disease of the early mid- age with a male gender predilection. RB- ILD and DIP belong to the same pathomorphologic continuum, representing different degrees of severity of the same disease process. Apart from smoking cessation, steroid therapy has also been proved beneficial. 38


39 Ø Radiologic Features: The typical pattern includes centrilobular nodules in combination with ground- glass opacities and bronchial wall thickening (Figure 2.18a). The distribution of the lesions at high- resolution CT is mostly diffuse. The ground- glass opacities have been shown to correlate with macrophage accumulation in alveolar ducts and alveolar spaces. The centrilobular nodules are presumably caused by the peribronchial distribution of the intraluminal infiltrates. Coexisting moderate centrilobular emphysema is common, given that most patients have a smoking history. Ø Histologic Features: The dominant histologic finding of RB- ILD is bronchiolocentric accumulation of alveolar macrophages containing brown particles and mild bronchiolar fibrosis (Figure 2.18b). The histologic appearance cannot differentiate RB- ILD from an asymptomatic respiratory bronchiolitis. Figure 2.18: (a) Centrilobular nodules (arrows) and small cysts (arrow heads) on a CT scan of a patient with RB- ILD. (b) Photomicrograph (hematoxylin- eosin stain) shows pigmented alveolar macrophages in a terminal bronchiole and the adjacent alveoli. Moderate peribronchiolar inflammation and fibrosis are present (radiographics.rsna.org) 6. Desquamative Interstitial Pneumonia (DIP) a b The name originated from the belief that the dominant histologic feature was desquamation of epithelial cells. However, this is now recognized to be intra- alveolar macrophage accumulation rather than desquamation of epithelial cells. This condition is considered by many to represent the end of a spectrum of RB- ILD in view of its similar pathology and almost invariable association with cigarette smoke. However, rare cases occur in non- smokers, some of whom have had exposure to environmental inhalation exposures including passive exposure to cigarette smoke. DIP affects primarily cigarette smokers in their fourth or fifth 39


40 decades of life and is more common in men. Insidious onset of dyspnea and dry cough over weeks or months is usual and patients may progress to respiratory failure. The prognosis of DIP is generally good. Most patients improve with smoking cessation and corticosteroids. Ø Radiologic Features: Ground glass opacification is present on CT in all cases of DIP (Figure 219a). This has a lower zone distribution in the majority of cases, a peripheral distribution in 59% of cases, and is patchy in 23%. In other cases the distribution is diffuse and uniform in. Irregular linear opacities and reticular pattern are frequent but limited in extent and usually confined to the lung bases. Honeycombing is seen in less than one- third of cases, and is usually peripheral and limited in extent. On follow- up HRCT, patients receiving treatment can be expected to show partial or near complete resolution of areas of ground glass opacification. Progression of ground glass opacification to a reticular pattern occurs infrequently. Ø Histologic Features: DIP is histologically characterized by diffuse numerous macrophage accumulations within most of the distal airspaces. The alveolar septa are thickened by an inflammatory infiltrate that often includes plasma cells and occasional eosinophils, and they are lined by plump cuboidal pneumocytes. Lymphoid aggregates may be present. The main feature that distinguishes DIP from RB is that DIP affects the lung in a uniform diffuse manner and lacks the bronchiolocentric distribution seen in RB. The intralumenal macrophages are DIP frequently contain dusty brown pigment identical to that seen in RB (Figure 2.19b). a Figure 2.19: DIP (a) Diffuse ground glass opacities in both lungs. (b) Photomicrograph (hematoxylin- eosin stain) shows diffuse filling of the alveolar spaces with alveolar macrophages and a few desquamated alveolar epithelial cells (Imaging of idiopathic interstitial pneumonias, European Respiratory Monograph, 2004) b 40
41 7. Acute Interstitial Pneumonia (AIP) AIP is the only entity with acute onset of symptoms. Both imaging and clinical features are compatible in most cases with Adult Respiratory Distress Syndrome. Severe acute dyspnea that leads often to the need of mechanic ventilation within 3 weeks is the typical onset of the disease. Many patients report a recent respiratory viral infection. Steroids and Oxygen are used for treatment but the prognosis remains poor, with a mortality rate of 50%. Most patients that survive the acute phase develop severe fibrosis. Ø Radiologic Features: AIP has a similar radiologic appearance with ARDS. However, a symmetric, bilateral distribution with lower lobe predominance characterizes more often the AIP (Figure 2.20a). The costophrenic angles are often spared. In the early phase of AIP, ground- glass opacities are the dominant CT pattern and reflect the presence of alveolar septal edema and hyaline membranes. Areas of consolidation are also present but are usually limited to the dependent area of the lung as a result of edema and hemorrhage. In the late phase of AIP, architectural distortion, traction bronchiectasis, and honeycombing are the most striking CT features and are more severe in the nondependent areas of the lung. This can be explained by the protective effect of atelectasis and consolidation on the dependent areas of the lung during the acute phase of disease, which attenuate the potential damage associated with mechanical ventilation. Ø Histologic Features: The main feature is diffuse alveolar damage, which can be categorized into an early exudative phase and a chronic organizing phase. The early phase is characterized by interstitial and intraalveolar edema, formation of hyaline membranes, and diffuse alveolar infiltration by inflammatory cells (Figure 2.20b). The organizing phase usually begins at the end of the first week after lung injury and is characterized by formation of granulation tissue, which results in alveolar wall thickening. As opposed to the heterogeneous appearance of UIP, fibrotic changes in AIP are uniform and characterized by numerous fibroblasts but relatively little collagen deposition. Histopathologic investigation is necessary for a definitive diagnosis of AIP. However, considering the fact that patients with AIP are often too ill to tolerate surgical lung biopsy, transbronchial biopsy seems to be sufficient. 41
42 a Figure 2.20: AIP (a) Exudative phase of AIP with consolidation and diffuse ground glass opacities. (b) Photomicrograph (hematoxylin- eosin stain) shows the diffusely thickened alveolar septa (arrows) by hyaline membranes. Fibrin deposition and inflammatory cells are present in the alveoli (Webb, 2009, radiographics.rsna.org) b 2.7 COLLAGEN VASCULAR DISEASES The collagen vascular diseases are a large heterogeneous group of autoimmune disorders characterized by damage to components of connective tissue at a variety of sites in the body. Collagen vascular diseases that show features of interstitial lung disease include systemic lupus erythematosus, rheumatoid arthritis, progressive systemic sclerosis, polymyositis and dermatomyositis, Sjogren syndrome, mixed connective tissue disease, and ankylosing spondylitis. At histopathologic examination, interstitial lung diseases associated with collagen vascular disease are diverse and include usual interstitial pneumonia (UIP), nonspecific interstitial pneumonia (NSIP), cryptogenic organizing pneumonia (COP) and lymphocytic interstitial pneumonia (LIP) (Kim et al. Radiographics, 2002). The histopathologic and radiologic findings of interstitial lung diseases associated with collagen vascular diseases are identical to those of their idiopathic counterparts. However, some histopathologic findings, although not specific, are suggestive of interstitial pneumonia in association with collagen vascular disease. These findings are lymphoid hyperplasia (follicular hyperplasia) and prominent plasma cell infiltration in interstitial inflammation. High- resolution computed tomography (CT) has proved to be more sensitive than chest radiography and conventional CT in the detection and characterization of various histopathologically confirmed interstitial lung diseases in patients with collagen vascular diseases. There is evidence that the pattern of 42

43 abnormality at high resolution CT reflects the relative proportions of fibrosis and inflammation. A reticular pattern with traction bronchiectasis at CT is associated with a predominantly fibrotic process, whereas ground- glass attenuation without a reticular pattern or traction bronchiectasis is associated with an inflammatory process (Capobianco et al, Radiographics 2012) Figure 2.21: Frequency of patterns manifestation in collagen vascular diseases (Capobianco et al, Radiographics 2012) SYSTEMIC LUPUS ERYTHEMATOSOUS Pleuro- pulmonary manifestations occur in approximately 50% 60% of patients. Pleural disease occurs more often than lung participation. Both may be acute or chronic. Acute disease includes pulmonary hemorrhage, acute lupus pneumonitis, and pulmonary edema. Chronic disease, such as interstitial pneumonitis and fibrosis, is less common comparing to the other connective tissue disorders. Acute lupus pneumonitis occurs in 1% 4% of patients. Diffuse interstitial pneumonitis and fibrosis are uncommon and these cases reflect UIP or NSIP patterns. The radiologic findings are ground glass opacities, areas of consolidation and abnormalities such as interstitial thickening and rarely honeycombing. 43
44 2.7.2 RHEUMATOID ARTHRITIS Chest complications are common (40% of patients) and include interstitial pneumonitis and fibrosis, rheumatoid nodules, COP, bronchiectasis, obliterative bronchiolitis, follicular bronchiolitis, and pleural effusion or thickening. Interstitial pneumonitis and fibrosis are the most common pulmonary manifestations of rheumatoid arthritis. In the early stage, the radiographic appearance consists of irregular linear hyperattenuating areas in a fine reticular pattern. The abnormality usually involves mainly the lower lung zones. With the progression of disease, the reticular pattern becomes more coarse and diffuse, and honeycombing may be seen. Similar to the findings at radiography, the predominant abnormality at high- resolution CT consists of irregular linear hyperattenuating areas caused by a combination of intralobular lines and irregular thickening of interlobular septa. Honeycombing is seen, most markedly near the diaphragm. Three main imaging patterns have been described: 1) reticulation with or without honeycombing (UIP), 2) centrilobular branching linear structures with or without bronchial dilatation (COP), and 3) consolidation (COP/chronic eosinophilic pneumonia). Interstitial lung changes are frequent and independent of disease duration. Interstitial changes are more frequent and severe in rheumatoid factor positive patients and in patients with more severe joint involvement (Kim et al. Radiographics 2002) PROGRESSIVE SYSTEMIC SCLEROSIS Progressive systemic sclerosis (scleroderma) is a disorder of connective tissue characterized by deposition of excessive extracellular matrix and vascular obliteration. It has an approximately 3:1 female predilection. Diffuse and limited forms of systemic sclerosis refer to the extent of cutaneous involvement, with a different clinical course and prognosis for each. Pulmonary involvement is more common and more severe in systemic sclerosis than in other types of collagen vascular disease. The most common pulmonary manifestation is interstitial fibrosis (Figure 2.22a), which occurs in approximately 80% of patients. Pulmonary fibrosis is equally likely in the limited and diffuse forms of the disease but is less severe in the limited form. The histologic features are those of nonspecific or usual interstitial pneumonia. Rarely 44

 NSIP pattern on axial chest CT of a patient with systemic sclerosis, (b) COP pattern in polymyositis (Capobianco et al., Radiographics 2012) b 2.7.")
45 COP may be associated with scleroderma. High- resolution CT frequently shows interstitial pneumonitis and fibrosis. The abnormalities involve mainly the lower lobes and have a predominantly peripheral and posterior distribution. The overall extent of disease and the degrees of honeycombing and ground glass attenuation tend to increase significantly at follow- up CTs. a Figure 2.22: (a) NSIP pattern on axial chest CT of a patient with systemic sclerosis, (b) COP pattern in polymyositis (Capobianco et al., Radiographics 2012) b POLYMYOSITIS - DERMATOMYOSITIS Polymyositis is an autoimmune inflammatory myopathy characterized by symmetric weakness of the limb girdle and anterior neck muscles. Dermatomyositis is similar to polymyositis except for the presence of a characteristic skin rash. The thorax is commonly affected, generally in one or more of three forms: 1) hypoventilation and respiratory failure as a result of involvement of the respiratory muscles; 2) interstitial pneumonitis, usually with a histologic pattern of usual interstitial pneumonia or nonspecific interstitial pneumonia; and 3) aspiration pneumonia secondary to pharyngeal muscle weakness, which is the most common complication (Kim et al., Radiographics 2002). Three major groups can be identified on the basis of histologic patterns: COP, usual or nonspecific interstitial pneumonia and diffuse alveolar damage. Histologic appearance is useful for determining the prognosis. Patients with diffuse alveolar damage or usual interstitial pneumonia have a poor prognosis, with only a 33% survival rate at 5 years; however, patients with COP have an excellent prognosis (Figure 2.22b). Patients with nonspecific interstitial pneumonia have a good prognosis. The 45
. 2.7.")
46 frequency of radiographic parenchymal abnormalities is low (about 5%). The most common is a symmetric, predominantly basal reticular pattern that may become diffuse over time and progress to honeycombing (Capobianco et al., 2012) SJOEGREN SYNDROME Sjogren syndrome is characterized by a clinical triad of dry eyes (keratoconjunctivitis sicca), dry mouth (xerostomia), and arthritis. It may be primary, without features of other collagen vascular disease, or secondary in association with other collagen vascular disease, most often rheumatoid arthritis. The most common thoracic complication, lymphocytic interstitial pneumonia, is followed in frequency by airway abnormalities such as follicular bronchitis, bronchiectasis, and bronchiolitis. Less common complications include interstitial pneumonitis and fibrosis, COP, lymphoma, pulmonary hypertension, and pleural effusion or fibrosis. The most common findings consist of bronchiolectasis and poorly defined centrilobular nodular or branching linear hyperattenuating areas, areas of ground- glass attenuation and honeycombing. Honeycombing alone or with ground glass attenuation is present almost exclusively in the periphery of the lower lobes. A characteristic pattern of extensive areas of ground- glass attenuation with scattered thin- walled cysts is seen in approximately 50% of patients with lymphocytic interstitial pneumonia. a b Figure 2.23: Sjoegren Syndrome. Axial CT slices (a at a higher level than b) show scattered ground- glass opacities, intralobular interstitial thickening, and pulmonary cysts (arrows). (Capobianco et al., Radiographics 2012). 46
47 2.7.6 MIXED TISSUE CONNECTIVE DISEASE Mixed connective tissue disease has mixed features of systemic lupus erythematosus, progressive systemic sclerosis, and polymyositis. Respiratory involvement is common and includes interstitial pneumonitis and fibrosis, pulmonary hypertension, and pleural effusion. Histopathologic findings of pulmonary involvement in mixed connective tissue disease are classified into interstitial fibrosis (UIP or NSIP pattern) and vascular changes. Typical vascular changes consist of bland intimal proliferation of the lung arterioles, plexogenic angiopathy, and chronic pulmonary emboli. The lung abnormalities consist of irregular linear hyperattenuating areas with a reticular pattern and involve mainly the lung bases. With the progression of disease, the fibrosis gradually extends superiorly; in the late stage, honeycombing may be identified. High- resolution CT shows a predominant subpleural distribution of fibrosis. Other radiologic abnormalities include areas of parenchymal consolidation that may be related to COP (Kim et al., Radiographics 2002) ANKYLOSING SPONDYLITIS Ankylosing spondylitis is a chronic inflammatory disease that affects mainly the joints of the axial skeleton. There is a strong male predilection (10:1). Lung manifestations are rare and include prominent interstitial fibrosis with hyaline and elastic degeneration of collagen, especially in the apices of the lungs. Chronic inflammatory cell infiltrations have also been reported. The most common pulmonary manifestation is upper lobe fibro- bullous disease. A variety of abnormalities can be seen at high resolution CT and include evidence of apical fibrosis, paraseptal emphysema, bronchiectasis, interstitial fibrosis, mediastinal lymph node enlargement, and tracheal dilatation. 47
48 2.8 CLINICAL ASSESSMENT OF PATIENTS WITH ILDs Figure 2.24: The diagnostic process in diffuse pulmonary lung diseases (DPLDs) begins with a clinical evaluation that includes a history, physical examination, chest radiograph, and lung function tests; BAL: bronchoalveolar lavage, TBBx: Transbronchial biopsy (American Journal of Respiratory and Critical Care Medicine, 2002). 1. MEDICAL HISTORY AND SYMPTOMS This includes a thorough history elicitation, with complete evaluation of the chief complaint; a comprehensive review of multiple systems; identification of all medications or drugs, including over- the- counter and naturopathic medications; and an exhaustive review of past medical, social, family, and occupational histories with an exploration of all potential environmental exposures. The main clinical symptoms of IIPs are nonspecific and consist of cough and worsening dyspnea; besides exertional dyspnea, other specific coexisting respiratory symptoms, such as cough, hemoptysis, and chest pain, may occur. However, other factors such as age, gender, risk factors, and 48
49 course of disease can be helpful in distinguishing between the various entities. In many cases symptoms originating from other organs or systems may lead to the diagnosis of the underlying disease (G. Raghu, K.K. Brown / Clin Chest Med 25 (2004) ). 2. CLINICAL EXAMINATION Auscultated crackles, typically described as dry, Velcro, end- inspiratory, and predominantly basilar, are detected in more than 80% of patients who have IPF. Occasionally, crackles that are due to ILD may be detected on physical examination, even in the setting of a normal chest radiograph. Signs of pulmonary hypertension may be encountered in the later stages of all chronic ILDs as a result of progressive interstitial fibrosis and alveolar hypoxemia. Although examination of the respiratory system is seldom helpful because an abnormal physical examination is nonspecific and patients who have ILD may have normal findings, additional insight often is gained from the presence or absence of extrathoracic findings. 3. PULMONARY FUNCTION TESTS (PFT S) Initial pulmonary function tests (PFTs) should include a spirometry (with and without bronchodilator), plethysmographic lung volumes, and DLCO (corrected to hemoglobin). PFTs cannot diagnose a specific ILD and cannot distinguish between active lung inflammation versus fibrosis, but are critically important in the objective assessment of respiratory symptoms as well as in paring thedifferential diagnosis, grading the severity of disease, and monitoring response to therapy or progression. PFT abnormalities in ILD generally reflect the effects of elevated elastic recoil (restrictive lung defect) and alveolocapillary dysfunction (decreased diffusion capacity when corrected to hemoglobin), although increased lung volumes (eg, LAM) or an 49
50 increased diffusing capacity (eg, DAH) can be seen. A typical PFT pattern in ILD is a restrictive lung defect with symmetrically decreased lung volumes (total lung capacity [TLC], functional residual capacity [FRC], and residual volume [RV] <80% of predicted); forced expiratory volume in 1 second (FEV1) and forced vital capacity (FVC) decreased in parallel with a normal or elevated FEV1/FVC ratio; and a decreased DLCO corrected for hemoglobin. The DLCO (DLCO measures the ability of the lungs to transfer gas from inhaled air to the red blood cells in pulmonary capillaries) generally normalizes or moves toward normal when corrected for alveolar volume (DLCO/VA); however, not all of these abnormalities are detected in every patient and all PFT values may be normal in some patients. When FEV1 and DLCO are higher than 80% there is no pulmonary disfunction. The pulmonary disease is characterized mild, moderate or severe when the above mentioned indexes are 70 79%, 50 69% and <50% respectively. 50

51 CHAPTER 3 BASICS ON COMPUTED AIDED DIAGNOSIS SYSTEMS (CAD) 3.1 HISTORY GENERAL ASPECTS OF CAD SYSTEMS Giger, Kim and Doi have recently highlighted the improvements in development of automated diagnostic tools. Since the 1950s, the potential use of computers had been considered for analysis of radiographic abnormalities. In the mid- 1980s, however, medical physicists and radiologists began major research efforts for computer- aided detection or computer- aided diagnosis (CAD), using the computer output as an aid to radiologists as opposed to a completely automatic computer interpretation focusing initially on methods for the detection of lesions on chest radiographs and mammograms. Since then, extensive investigations of computerized image analysis for detection or diagnosis of abnormalities in a variety of 2D and 3D medical images have been conducted. As imaging systems become more complex and the need for better quantitative information from images grows, the future includes the combined research efforts from physicists working in CAD with those working on quantitative imaging systems to readily yield information on morphology, function, molecular structure, and more from animal imaging research to clinical patient care. Figure 3.1: Schematic Representation of CAD contribution to diagnosis (Giger,2008) 51
52 In the mid- 1980s, a team of medical physicists and radiologists in the Kurt Rossmann Laboratories in the Department of Radiology at the University of Chicago started their research efforts for computer- aided detection or computer aided diagnosis, using the computer output as an aid to radiologists as opposed to a completely automatic computer interpretation focusing initially on methods for the detection of lesions on chest radiographs and mammograms (Giger et al., 2008). CAD can be defined as a diagnosis made by a radiologist who uses the output from a computer analysis of the image data in their decision making process (Figure 3.1). The final medical decision is made by the radiologist, not the computer (Alberdi et al., 2005). With CAD, the role of the computer analysis is not to replace the radiologist but rather to aid the radiologist in his/her image interpretation and/or decision- making. (Tae- Yun Kim et al., 2011). For more than the past 20 years, investigations of computerized image analysis for detection or diagnosis of abnormalities in a variety of 2D and 3D medical images have been conducted through collaborations between medical physicists and radiologists, as Dr. Costaridou reviews in a recent publication. Radiologists were expected to ultimately use the output from computerized analysis of medical images as a second opinion, like a spellchecker, in detecting and characterizing lesions, as well as in making diagnostic decisions. It is important to note that success in CAD required knowledge of imaging physics i.e., image acquisition method, as well as knowledge of various computer vision and artificial intelligence techniques. Currently, CAD has been extended to include image analysis of various disease types breast cancer, lung cancer, interstitial disease, colon cancer, osteoporosis, osteolysis, vascular plaque, aneurysms, and others on various modalities, including analog and digital radiography, ultrasound, CT, PET, MRI, and others. On Figure 3.2, the basic components of a CAD algorithm are presented. Figure 3.2: Development of a CAD algorithm (Giger 2008) 52
53 3.2 CADe AND CADx CAD techniques and systems can broadly be categorized into two types: Computer- Aided Detection (CADe) and Computer- Aided Diagnosis (CADx). CADe implies that radiologists use computer outputs of the locations of suspect regions, leaving the characterization, diagnosis, and patient management to the radiologist. CADe is basically a detection task, i.e., a localization task. CADx extends the computer analyses to yield output on the characterization of a region or lesion, initially located by either a human or a computerized detection system. The computer might output mathematical descriptors to characterize the lesion and/or estimate the probability of malignancy or other abnormality, leaving the final diagnosis and patient management to the physician. CADx is a classification task for differential diagnosis. Ultimately, the goal of CAD is to reduce search errors, reduce interpretation errors, and reduce variation between and within observers. Once a lesion is detected, for example, such as in a screening program, further imaging of the abnormality may be necessary in order to justify subsequent patient management such as invasive evaluations e.g., a biopsy and/or therapeutic interventions. Thus, the role of a CADx system is to aid in the characterization of an already- found lesion or other abnormality in terms of its morphological or functional attributes, and in the estimation of its probability of malignancy or other disease state. Such a computer system is expected to aid a radiologist in his/her differential diagnosis and improve the positive predictive value of the interpretation. The input to a CADx algorithm could be either a radiologist- detected or a computer- detected lesion or region. This input could be in the form of an indication of the approximate center of the lesion or an actual delineation of the lesion boundary. 53

54 As clinical CADe systems begin to give more information beyond just localization, CADx is slowly being introduced. 3.3 CAD IN THORACIC IMAGING CADe: CADe systems for various lung diseases have been reported in the literature. Chest radiography is the most commonly performed procedure in medical imaging, however, interpretation of chest radiographs is a difficult task because of the overlapping ribs and its low contrast sensitivity for subtle abnormalities. CAD of lung disease was attempted in the 1970s. Dedicated efforts in the 1980s revived the interests in development of CADe systems for chest radiographs. Over the last two decades, a large number of studies have been conducted to develop computerized methods for analysis of various abnormalities in chest radiographs, including detection of lung nodules detection (Figure 3.3) and classification of Figure 3.3: Difference- image approach to detecting nodule candidates on chest radiographs. The approach aimed to enhance the nodule with one processing filter and to suppress the anatomical background with another processing filter, with the difference resulting in an image for further analysis (Ginger, 1988) 54
55 interstitial diseases, detection of pneumothorax, and temporal subtraction of chest radiographs to detect interval changes. The effects of CADe for lung nodule detection on radiologists were evaluated by a number of observer performance studies. Similar to CADe for breast cancer detection in mammography, these studies indicated that the detection accuracy for lung nodules in chest radiographs could be significantly improved with the use of CADe. A commercial lung nodule CADe system for chest radiography was approved by the FDA in 2001 (OnGuard Chest X- Ray CAD, Riverain Medical). CADx: Due to the range of potential diseases present in the thorax, various types of computer- aided diagnosis methods are being developed for both chest radiography and CT (Figures 3.4, 3.5), and include computer- aided diagnosis algorithms for pulmonary nodules and interstitial lung diseases. Use of computers for the differential diagnosis of lung nodules in chest radiographs and thoracic CTs has advanced in recent years. Candidate nodules detected on thoracic CT may be categorized as malignant or benign, or as actionable or not. Research parallels that for breast lesions in that characteristic features of the nodules are extracted from chest radiographs and merged using classifiers to yield a likelihood of malignancy. Others have developed classification methods for nodules detected on CT both conventional and thin- section CT. This characterization of lung nodules on CT has been enhanced with the advent of PET/CT systems, allowing for characteristics from both modalities to be used in the computer classification. 55
 Figure 3.")
 Atelectasis, B), C) Vessels, D) Normal anatomical structures (aortic arch) The green circle")
56 Figure 3.4: User Interface of an FDA approved CAD system for nodule detection. The nodule depicted, presents a volume increase (Medicsight Lung CAD, Medicsight PLC) Figure 3.5: False positive findings of a CAD system for nodule detection. A) Atelectasis, B), C) Vessels, D) Normal anatomical structures (aortic arch) The green circle represents the CAD ROI (Roberts at al., 2007) 56
57 CHAPTER 4 QUANTIFICATION METHODS OF INTERSTITIAL LUNG DISEASE IN H- R COMPUTED TOMOGRAPHY Different systems for evaluating ILDs extent on HRCT have been developed over the past 20 years. Several scoring methods have been used to characterize and quantify the disease, correlate with common clinical parameters, prognose patients, assess disease progression and evaluate response to treatment (Assayag et al. 2012). These systems could be categorized in two large groups, depending on the use of automated methods or not. The first group refers to simple visual scoring methods, where the radiologist evaluates the disease extend and compares or characterizes the type of lung abnormalities without using automated systems. In this group, semi- automated methods, such as histogram thresholding techniques may also be enlisted. These methods usually include friendly to users interfaces and the radiologists, using the system s potentialities, decide each time for the extend and the type of disease. The second group refers to automated systems (computer- aided detection or diagnosis). These systems using complex mathematical algorithms are able to distinguish normal from abnormal tissue and moreover to characterize abnormal findings. A sufficient number of such systems has been developed during the last decades, and apart from the use of different algorithms, they all have a common hallmark; they are fully automated and no interaction with radiologists is needed. 57
.")
58 4.1 VISUAL SCORING METHODS COMPARATIVE SEMI- QUANTITATIVE SCORING METHODS Most of the scoring systems published for ILDs have been developed from methods previously used to assess IPF. Wells et al published one of the first reading methods used to estimate ILDs extent (Figure 4.1). They presented a comparative grading system assessing the extent of one HRCT abnormality (parenchymal disease) in relation to another (reticular disease). The goal was to determine how different HRCT abnormalities correlate with lung histology, specifically inflammatory changes and fibrosis, on biopsy. This scoring method was based on a similar protocol published by Müller et al., correlating findings on HRCT of IPF with histopathology. Morelli et al. published an even simpler scoring method. They divided the lungs into three zones: apices to main carina, main carina to inferior pulmonary venous confluence, and pulmonary veins to diaphragms, representing upper, middle and lower zones respectively. A score of 0 was given if no abnormality was found in a zone, a score of 1 for any abnormality found in SSc- ILD except for honeycombing (ground- glass, reticular markings, bronchiectasis) and a score of 2 if honeycombing was present. The global score was obtained by adding up these zonal scores. Comparative scoring methods assume that a higher score or higher grade represent greater severity of disease (Assayag et al, 2012). Figure 4.1: Comparative scoring method (Wells et al., 1992) 58
59 SEMI - QUANTITATIVE SCORING METHODS Concerning the estimation of disease extent, variable semi- quantitative scoring systems have been developed (Figure 4.2) using high- resolution CT protocols (HRCT), demonstrating moderate inter- and intra- observer variability. The easiest way to assess the disease extent is the visual observation/scoring and is expressed as the percentage of the lung parenchyma that is affected by the disease, in total and specific disease patterns. Semi- quantitative scoring methods have been developed to provide more precise assessment of quantity and type of ILD abnormalities. Αl Jarad et al., introduced a visual scoring scale for fibrosis, emphysema and pleural disease and assessed three lung zones (upper, mid, lower) separately. This study has showed good inter- and intra- observer agreement and moderate correlation with the pulmonary function tests. One scoring system that has been used in several studies was developed and published by Warrick et al. (Figure 4.2). This scoring system combines severity and extent of disease. Different abnormalities corresponding to increasingly severe disease are given increasingly high scores. Extent is determined based on the total number of bronchopulmonary segments involved for each abnormality. The greater the number of segments involved, the higher the extent score. These scores are combined to obtain a global score. Application of this scoring system, however, requires more advanced knowledge of pulmonary anatomy and proficiency in identifying bronchopulmonary segments. This may not be generally useful for clinicians. Kazerooni et al., published a scoring method to assess HRCT and to correlate with pathology in IPF. Variations of this method have since been used by several groups in patients with ILDs. Ooi et al. evaluated correlation between HRCT findings and clinical markers of disease activity. Their scoring system is similar to that proposed from Kazerooni et al. The extent of each abnormality is estimated for each lobe. A semi- quantitative score is assigned (0-4) based on the approximate percentage of disease for each one. This scoring method makes a distinction between pure ground- glass opacities and ground- glass mixed with reticular disease. Differentiating between pure ground glass opacity and mixed reticular disease, and 59
60 between fibrosis and honeycombing, may permit more precise assessment of the relationship between particular abnormalities and clinical parameters. Pandey et al., used the same scoring method to assess the relationship between ILD and peak systolic pulmonary arterial pressure (spap). They scored any ground- glass disease, reticular abnormalities and honeycombing in each of 5 lobes (scoring lingula with left upper lobe) using the same 0 to 4 semi- quantitative score. They also weighted each score for relative lobar volume using correction factors. Weighting the scores based on relative volume of each lobe may allow for more accurate estimation of global disease. A score of 3 for fibrosis in the lingula may not represent the same total amount of disease as a score of 3 in the left lower lobe, for example. Goldin et al., published the scoring method that was used to assess and follow- up ILD in the Scleroderma Lung Study population. This was also based on Kazerooni s method. Instead of scoring lobes, however, they scored 3 anatomical zones (upper, middle and lower zones) in each lung (Table 4). The sum of these grades in all 6 zones make up the global score for each abnormality. In this case, pure ground- glass disease is scored as opposed to ground- glass mixed with reticular disease. Disease progression was assessed subsequently by comparing CT scans in a blinded fashion. Disease in each zone was qualitatively compared from one scan to another and each abnormality was scored as better, same or worse. Semi- quantitative scores were not used to evaluate progression in this case. In more recent studies, the observers provide semi quantitative estimation of disease extent using a 4- or 5- level scale (eg. Likert scale, 0-25%, 26-50%, 51-75%, %) (Tashkin et al. 2006) or with a step of 5% (Desai et al, 2004). into 3 or 5 anatomical levels respectively. Two or more experienced radiologists usually provide their estimation in consensus or separately and the final assessment derives in this case from the mean average of individual estimations. The extent of lung fibrosis, which can be evaluated by semi- quantitative scoring systems, is limited owing to inter- and intra- observer variations and personal abilities of each radiologist. In addition, it is time- consuming process, especially when the evaluation refers to an MDCT study, where the number of slices is large. The detection of limited changes in imaging of these patients is also difficult when using visual scoring methods. 60
61 Major limitations of HRCT protocols in extent quantification concern limited coverage of lung parenchyma volume, as well as lack of anatomic comparability in follow up studies. In this respect, volumetric CT data obtained by multi- detector CT scanners have revolutionized the evaluation of ILD. Still, quantification of disease extent utilizing volumetric data by radiologist is time consuming and not applicable in clinical practice. Therefore, development of non- invasive and reproducible automated software tools aiding at quantification of ILD is an emerging need. RECENT STUDIES FOR THE SEMI- QUANTITATIVE ASSESSMENT OF INTESTITIAL LUNG DISEASE AUTHORS MODALITY LEVELS PATTERNS QUANTIFICATION 1 Warrick et al 1991 (The journal of Rheumatology) HRCT Whole Lung GGO, Reticular, Honeycombing, Cysts, Pleural lesions 2 Al Jarad et al (Thorax) HRCT 3 Anatomical zones 3 Wells AU et al (Am REV RESP DIS HRCT 5 Anatomical Levels 4 Kazerooni 1997 (AJR) HRCT Entire Lung 3 Anatomical Levels Emphysema, Honeycombing GGO, Reticular, consolidation, Pleural lesions GGO, Reticular GGO, Reticular Quantification scale 0-15 YES OR NO Grade 0: nor GGO, neither RET Grade 1: GGO more than RET Grade 2: equal GGO and RET Grade 3: RET more than GGO Likert Scale (25% step) 1 : 1-25% 2 : 26-50% 3 : 51-75% 4 : % 5 Desai SR, 2004 (Radiology) HRCT 5 Anatomical levels 6 Tashkin DP et al, 2006 (N Eng J Med) HRCT 3 Anatomical Levels GGO, Reticular (Fine, Intermediate, Coarse) GGO, Reticular, Emphysema, Honeycomb 0-100% (5% step) Linkert Scale (25% step) 1 : 1-25% 2 : 26-50% 3 : 51-75% 4 : % 7 Goh NS, 2008 (Am J Resp Crit Care Med HRCT and PFT s All slices Total Extent, GGO, Reticular <20% >20% Figure 4.2: This table summarizes the semi quantitative methods developed in the last years (adapted and modified from A. Kazantzi PhD Thesis, University of Patras 2012). 61
62 4.2 SEMI AUTOMATED SCORING METHODS This group includes pixel- based methods, where the observer creates segments respective to the abnormal findings, using graphic user interfaces and special algorithms that calculate the percentage of the disease extent resulting for each segmentation, as a percentage per slice/lung volume PIXEL BASED VISUAL SCORING METHODS In this category, the radiologist is provided with a GUI (Graphic User Interface) developed for that purpose. The GUI supports editing by enabling manual delineation of ILD image segments, displayed as color overlays on the original 3D CT data. Editing is performed usually on an axial slice basis and in most cases after the implementation of preprocessing techniques such as lung field and vessel segmentation. A free- hand drawn segment on the axial plane is automatically and consistently propagated usually to the other two planes (i.e. sagittal and coronal). To facilitate editing, a zoomed version of the region around is provided. After initial delineation, the radiologist can review segments and performed corrections. Following segment editing, total, ground glass and reticular disease extents were provided by the GUI as percentages of the lung parenchyma area by calculating the pixels corresponding to each pattern of disease. The semi- automated method described above, is definitely a time consuming process, that demands familiarization of the user with the Graphic interface and training, especially if radiologists are not expertise in chest imaging. In addition, technical support and material is essential and every user should be familiar with image processing techniques and computer software, such as MATLAB. 62

63 Nevertheless, in spite of many requirements need to be fulfilled, this method seems to be more accurate that visual scoring methods SEMI- AUTOMATED HISTOGRAM THRESHOLDING The intensity histogram shows how individual brightness levels are occupied in an image; The image contrast is measured by the range of brightness levels. The histogram plots the number of pixels with a particular brightness level against the brightness level. For 8 bit pixels, the brightness ranges from zero (black) to 255 (white). The histogram is a graph describing the number of pixels assigned to each grey- level of a digital image. Each displayed medical image has a unique histogram (Cavouras, Medical Image Processing 2010) (Figure 4.3). Figure 4.3: (A) Axial CT slice demonstrating an ill defined nodule (adenocarcinoma). (B) Histogram demonstrating grey level values (Hounsfield units) corresponding to image A pixels. (adenocarcinoma) (science direct.com). There are several histogram modification techniques that attempt to enhance image contrast by altering the image histogram. The new histogram may be that of a known picture or a histogram with equal number of pixels per grey- level. Among them, histogram (intensity) normalization provides stretching of the range of the image intensities included. The original histogram is stretched, and shifted, to cover all the 256 (for 8- bit) available levels (Mark S. Nixon, Alberto S. Aguado, 2008). Histogram equalization is a non- linear process aimed to highlight image brightness in a way particularly suited to human visual analysis. Histogram 63
64 equalization aims to change a picture in such a way as to produce a picture with a flatter histogram, where all levels are equiprobable. Histogram thresholding selects pixels that have a particular value, or are within a specified range. It can be used to find objects within a picture if their brightness level (or range) is known. This implies that the object s brightness must be known as well. There are two main forms: uniform and adaptive thresholding. In uniform thresholding, pixels above a specified level are set to white, those below the specified level are set to black. This can therefore provide a way of isolating points of interest. Uniform thresholding clearly requires knowledge of the grey level, or the target features might not be selected in the thresholding process. If the level is not known, histogram equalization or intensity normalization can be used, but with the restrictions on performance stated earlier. This is, of course, a problem of image interpretation. These problems can only be solved by simple approaches, such as thresholding, for very special cases. In general, it is often prudent to investigate the more sophisticated techniques of feature selection and extraction. There are more advanced techniques, known as optimal thresholding. These usually seek to select a value for the threshold that separates an object from its background. This suggests that the object has a different range of intensities to the background, in order that an appropriate threshold can be chosen. There are also locally adaptive techniques that are often used to binarize document images before character recognition. Surveys of thresholding are available, and target thresholding of images whose histogram is unimodal (has a single peak). Histogram thresholding techniques have been extensively used in quantification of lung fibrosis. In CT especially the attenuation measured in Hounsfield units (HU) is determined by the relative amounts of air, soft tissue and blood (vessels) in each volume element. The attenuation value for each pixel can be expressed as a Histogram (Figure 4.4). The CT attenuation histogram of normal lung deviates from the Gaussian normal distribution in that it is sharply peaked at approximately HU and it is markedly skewed to the left. Since lung fibrosis or inflammation cause an increase in the amount of soft tissue in the lung, the mean lung attenuation will be increased and will decrease the sharpness of the histogram peak 64
. Figure 4.")
65 (kyrtosis) and the degree of leftward skewness of the curve. Mean lung attenuation, kyrtosis and skeweness can therefore be used as measures for the extend of inflammation or fibrosis (Lynch et al, 2005). Figure 4.4: Thin- section CT (left) and lung density histogram (right) of two patients with SSc (C with more extensive disease than A). Figures show that more extensive disease (c,d) is expressed by higher mean lung attenuation and lower skeweness and kyrtsosis comparing to the patient with mild disease (Camiciottoli et al, 2007) CT histogram- based measures have two potential limitations. First of all, they depend on the level of inspiration achieved for the scan and secondly they provide a global measure for normal and abnormal lung without direct assessment of the type or extent of the abnormality. 65
66 4.3 AUTOMATED SCORING SYSTEMS Since visual estimation of disease extent by experts is time consuming, the development of accurate and reproducible image analysis tools, adapted to volumetric datasets, for the automated estimation of ILD extent and progression is an emerging need. Moreover, the semi- quantitative methods show moderate inter- and intra- observer agreement that have been confirmed in several studies. Thus, the use of an automated system is required for a more objective assessment of disease extent. The evaluation of the diffuse lung disease extent, using automated methods is a major challenge in chest CT. Many different systems have been proposed so far, but none of them is in use for clinical purposes. These systems aim to distinguish the normal from abnormal lung parenchyma, as well as to characterize and categorize the type of the disease. In general, these methods include segmentation techniques, where the lungs are initially separated from other anatomical structures of the thoracic cage, such as the heart, bones and muscles. In a second step, main pulmonary vessels are also extracted using special algorithms in order to achieve the isolation of lung parenchyma. Consequently, these techniques are able to classify normal and abnormal parenchyma and to determine the type of the existing disease by using either histogram thresholding methods or more often texture feature extraction and classification. Experienced radiologists participate in the development of such methods, since they train the above- mentioned algorithms and classifiers. These classifiers vary in different systems, and neural networks, k- nearest neighbors and other types may be applied. The automated scoring methods are usually applied in a large amount of 3D data and cover the whole lung parenchyma that has been scanned. The experimental results are usually compared to visual scoring methods applied in the same 2D datasets by one or more radiologists. The process is faster comparing to pixel- based techniques and shows higher reproducibility than visual scoring. 66
67 The weak discrimination among anatomical structures, such as small vessels and normal ligaments and abnormal areas is the most important limitation of an automated classification system. These borderline patterns are not distinguishable by the system and therefore overestimation of the total disease extent may occur. The development of more accurate segmentation algorithms could improve the performance of automated systems. The following list summarizes the most recent studies of CAD algorithms in lung CT (adapted and modified from A. Kazantzi PhD Thesis, University of Patras, 2012). 67
68 Publication No. of patients Shin KE et al., 2011 N=157 ILD Total, Ggo, Reticular, Honeycomb Consolidation Patterns Protocol Readers CAD method Performance 3DHRCT 1 Radiologists Semiquantitative step 5% 4 Anatomic levels Threshold R=0.53 ( p<0.001) Rosas IO et al., 2011 N= 126 Reticular (Fibrosis) Kim HG et al., 2010 N=129 Reticular (Fibrosis) HRCT 2 Radiologists in consensus No ILD=0%, Minimal ILD, Moderate ILD, Severe ILD=0-100% HRCT 2 Radiologists 3 anatomic levels Texture Accuracy 86% Κappa coefficient texture feature ROC 1% and 25% threshold: 0.86 and 0.96 Korfiatis et al., 2010 N= 13 Ggo Reticular (Incl.honeycomb) MDCT Overlap. Texture ground glass: 0.36± 0.20 reticular: 0.50± 0.17 Total :0. 55± 0.15 Park SO, 2009 N=10 Ggo Nodular Reticular Honeycomb Emphysema Wang, 2009 N=37 normal N=31 normal Marten K et al., 2009 Ν=22 Τotal disease Extent Marten K.et al., 2008 N=52 CVD Zavaletta VA et al., D HRCT 1 Radiologists Pixel wise Normal/abnormal 3DMDCT 2 Radiologist Pixel wise 3 anatomic levels Normal/abnorm Ggo Reticular Ν=4 Normal,Ggo Reticular Honeycomb Emphysema 3D 3DMDCT 2 Radiologists Semiquantitative per lobe Step 5% 2 Radiologists Semiquantitative Semiquantitative per lobe Step 5% 3DMDC T 2 Radiologists Pixel wise Τexture Overlap NL 0.51 RET 0.72 GGO 0.34 Inter- observer 67% Τexture Sensitivity: 86% Specificity: 90% Correlation :0. 76 Threshold R= Threshold Correlation :0.76 Inter- observer 95% Texture based Overlap NL 0.60 RET 0.18 HC 0.3 Sluimer et al., 2006 N=26 Normal, Ggo Reticular,Solid Hyperlucency 2D HRCT 2 Radiologists Texture based Az=[0.74,0.95] Agreement 71-87% Xu et al., 2006 N=20 Normal,Smokers Non- smokers Emphysema,Ground Glass Honeycombing Uchiyama et al., 2003 N=150 Normal, Emphysema Ground Glass Honeycombing Nodular,Reticular Consolidatiom 3DΜDCT Performance Texture 86.2% (Bayesian) 83.8% (SVM) 2D HRCT 3 Radiologists Threshold Sensitivity: 97.4% Specificity 88% Sluimer et al., 2003 N=116 Normal/Abnormal 2D HRCT ROC/2 ακτινολόγοι Texture Az: 0.86 Chabat et al., 2003 N=30 Normal/Abnormal HRCT Αccuracy Texture Sensitivity:73.6%% Specificity 91.2% Kauzcor et al., 2000 N=84 Ground Glass HRCT 1 Radiologist Texture Accuracy: 89% Uppaluri et al., 1999 N= Normal Emphysema Ggo Honeycomb Nodular HRCT - Texture Accuracy: 93.5% 68
69 PART II 69
70 The aim of this thesis is to evaluate and compare different methods proposed for the assessment of interstitial lung disease extent. The experimental procedure includes the application of three different methods that were implemented at the same sample of chest MDCT scans. Specifically, the radiologist performed evaluation of total, ground glass and reticular disease extent using a) semi- quantitative visual scoring, b) pixel- based visual scoring and a semi- automated thresholding technique. A chest MDCT Computer- Aided Diagnosis (CAD) quantification tool (d) was also utilized to provide an automated pixel- based quantification of interstitial lung disease. The evaluation was carried out at 5 representative lung anatomic levels for each patient. All methods were implemented in 150 axial slices, corresponding to 30 patients chest CT scans, for percentage of total, ground glass and reticular disease extent. The sample performance is reported on axial slice basis in terms of mean, standard deviation and range. Furthermore, methods have been compared pairwise by means of Bland- Altman analysis, utilized in order to assess by inspection the degree of agreement for varying disease extent. In this analysis, the differences were plotted against average values for each pair of disease extent estimation. Additionally, the Intraclass Correlation Coefficient index has been calculated for all pairs compared. Finally, inter- observer variation between radiologist- in- trainee and two experienced radiologists in consensus was investigated using also the above- mentioned statistical processes. 70
71 CHAPTER 5 MATERIALS AND METHODS 5.1 CLINICAL DATASET Thirty patients with diagnosis of collagen vascular disease, meeting the criteria of the American College of Rheumatology, were referred to our institution from for chest CT scan. From an initial case sample of 34 patient scans, 30 scans were retained, exclusively exhibiting imaging findings of ground glass and reticular patterns, including honeycombing. Four scans demonstrated motion artifacts. The case sample analyzed consisted of 30 patients (22 females and 8 males) with mean age of 56.4 years and mean disease duration 7.2 years. Fifteen patients were diagnosed with scleroderma, 10 patients with rheumatoid arthritis, 2 with systemic lupus erythematosus, 1 with Sjogren syndrome and 2 mixed connective tissue disease. Informed consent was obtained from all subjects participating in this study. 5.2 IMAGE ACQUISITION PROTOCOL All patients were scanned with a 16- row multidetector CT scanner (GE Lightspeed 16, General Electric Medical Systems, Milwaukee, Wisconsin, USA) at 120 kvp, rotation time of 0.5s, automatic modulation of ma, collimation thickness of 16x0.625 mm and slice thickness of 1.25 mm, using a protocol obtaining volumetric 3D data at full inspiration, in supine position. Each scan volume comprised of approximately slices per patient. The mean volume CT dose index and the mean dose- length product were 11.5 mgy and mgy cm, respectively. Assuming msv/mgy cm for a standard chest CT examination, the effective radiation dose for the volumetric chest CT protocol used was 4.6 msv, complying with European Working Group for Guidelines on Quality Criteria in CT. 71

: origin of great vessels (i), carina (ii), pulmonary venous confluence (iii), between levels (iii) and (v) and 1cm above the right hemidiaphragm.")
72 5.3 STEP 1: SEMI- QUANTITATIVE VISUAL SCORING Semi- quantitative scoring of total, ground glass and reticular pattern extents was visually performed by the radiologist (RAD1) on 150 axial slices, resulting from the 30 patients CT scans. Radiologist estimated percentages of disease extent with an 1% step for the first 10% of disease extent and a 5% step consequently. The disease extent was assessed at five representative levels, proposed by Desai et al (Figure 5.1): origin of great vessels (i), carina (ii), pulmonary venous confluence (iii), between levels (iii) and (v) and 1cm above the right hemidiaphragm. For each level, RAD1 provided three quantitative values for total, reticular and ground glass disease extent respectively. The time required for each estimation was approximately 3 minutes. The monitor and viewing conditions were identical to those provided for the pixel- based reference and sample data were evaluated in random order. Figure 5.1: Anatomical levels of disease extent assessment (Desai et al. 2004) 72
73 5.4 STEP 2: PIXEL BASED VISUAL QUANTIFICATION OF ILD Disease extent was assessed by RAD1 at the same five representative lung anatomic levels for each patient, that have been used for semi- quantitative scoring purposes up to now (Figure 5.1): RAD1 performed disease extent assessment of the case sample (150 slices) in a blinded manner after having received a short training course by an experienced in Thoracic imaging colleague concerning the utilization options of the GUI system. The time required for disease extent estimation on each axial slice was approximately 20 minutes. For the free- hand delineation of the affected lung parenchyma, a digital matrix Wacom Intuos 3 Tokyo, Japan) with an active surface of mm with dpi and precision ±0.25 mm was utilized. Images were displayed on a high- resolution (1536x2048) gray scale diagnostic LCD monitor (Barco, Coronis3MP, Belgium). During reading, illumination was dim and kept constant, while radiologist- monitor distance was not restricted. The GUI supports editing by enabling manual delineation of ILD image segments, displayed as color overlays on the original 3D CT data. Editing is performed on an axial slice basis in the upper middle window of the GUI, shown in Figure 5.2, while the upper left window displays the current instance of editing. A free- hand drawn segment on the axial plane is automatically and consistently propagated to the other two planes (i.e. sagittal and coronal), depicted in the left lower and middle lower windows of the GUI, respectively. To facilitate editing, a zoomed version of the region around the current cursor location is provided in the lower right part (Figure 5.2). Navigation is implemented either by the use of scroll bars for each plane or interactively by cursor movement in each of the three planes. Image input (load) and output (save), as well as overlay transparency adjustments are controlled by the upper right section of the GUI. 73

74 Figure 5.2: An instance of The Graphic User Interface The following figures describe the experimental process. Firstly, the user selects and delineates the abnormal area (white area). Consequently, the user decides whether this area is classified as a ground glass opacity or as a reticular pattern. The Graphic User Interface represents the segments with colors. Green overlays corresponds to GGO and blue to reticular pattern (Figures 5.3, 5.4). Figure 5.3: Free- hand segmentation process. First step: The user outlines the abnormal parenchyma (left) Second step: User decides about the type of the pattern reticular (blue overlay). 74
75 Figure 5.4: Free- hand segmentation process. First step: The user encircles another abnormal parenchymal area (left) Second step: User decides about the type of the pattern GGO (green overlay). After initial delineation, radiologist in- trainee reviewed segments and performed corrections. Following segment editing, total, ground glass and reticular disease extents were provided by the GUI as percentages of the lung parenchyma area, according to eq. [1]- [3]: 75
76 5.5 STEP 3: DISEASE EXTENT ASSESSMENT WITH HISTOGRAM THRESHOLDING The basics of histogram thresholding techniques have been described in previous chapters. In our experimental procedure we have used a semi- automated system that allows ILD extent evaluation in three simple steps. For lung field segmentation we have used the same techniques as mentioned in the previous chapter. Figure 5.5 depicts an instance of GUI utilized for the assessment of ILD using histogram threshold based technique. Figure 5.5: An instance of Graphical User Interface for ILD quantification with a threshold based system. The first step of this procedure refers to vessel segmentation. The user selects values manually by scrolling a bar, according to visual criteria, at a random slice of the CT dataset and the system automatically implements thresholding to entire 3D data. The graphical user interface allows the constant observation of the image histogram and the changes applied by the user. After vessel extraction, a new 3D dataset is created (Figure 5.6). 76
.")
77 Figure 5.6: First step: Vessel extraction. Green overlays correspond to the extracted vessel tree. Note that system has included areas of disease (reticular) in the extracted data. Consequently, the user applies a new histogram thresholding to the new dataset in order to discriminate normal from abnormal parenchyma (Figure 5.7). This process is implemented in the same fashion as vessel extraction at random axial CT slices and the system automatically applies the new histogram values to all 3D data. The GUI allows also in this case the animation of the changes implemented using different color overlays for normal and abnormal lung. Figure 5.7: Second step: Segmentation of abnormal parenchyma. Red overlays correspond to areas of total disease. 77
78 Once user has decided about the minimum and maximum intensity values of threshoding and the system has applied them to all data provided, a third step takes place. In the last phase of the procedure, user needs to decide about the pattern of lesion, i.e. whether the abnormal lung parenchyma represents ground glass or reticular pattern of disease (Figure 5.8). The third and last application of thresholding technique has the same features with the previous steps. After this final estimation, the system calculates the percentages of total, ground glass and reticular extent corresponding to the three times applied threshold values. Figure 5.8: Third step: Classification of abnormal parenchyma to ground glass and reticular patterns (purple overlay corresponds to reticular and green to ground glass pattern). In conclusion, the 4 th step of our experimental procedure refers to a simple and friendly- to- user technique, which consists of three successive driven histogram thresholding applications. 78

79 5.6 STEP 4: DISEASE EXTEND ASSESSMENT BY A PROTOTYPE CAD QUANTIFICATION TOOL A CAD prototype tool based on a recently proposed ILD algorithm by Korfiatis et al was utilized. The algorithm was developed in the Department of Medical Physics of the School of Medicine of Patras University and is based on voxel classification of lung parenchyma volume, into normal and existing ILD voxel patterns, employing a k- nearest neighbor classifier and 3D co- occurrence texture features, taking advantage of lung field and vessel tree segmentation (Figure 5.5). Figure 5.5: Procedure of the development of CAD algorithm for ILD quantification (Korfiatis et al, 2010) 79
 by k- means")

 and after")
80 The steps of development of our CAD tool are: 1. LUNG FIELD SEGMENTATION Step 1: initial estimation of the Lung Fields (LF) by k- means clustering. Step 2: LF refinement by texture- based voxel classification of lung borders (Figures 5.6, 5.7). Figure 5.6: Volume rendering algorithm of a chest CT scan (left). Axial, coronal and sagittal planes of the original slices (first column) and after texture based voxel classification (second column) (adapted and modified from Korfiatis P. PhD Thesis, University of Patras, 2010) 80

81 Figure 5.7: 3D representation of the lung field volume extracted from the original dataset of chest CT. (adapted and modified from Korfiatis P. PhD Thesis, University of Patras, 2010) 2. VESSEL TREE SEGMENTATION This procedure includes also two steps: Step 1: Initial vessel tree volume estimation employing a multi- scale line enhancement filter. Step 2:Vessel tree volume refinement by means of supervised texture- based voxel classification. The following figures (Figure 5.8) provide a schematic representation of the vessel segmentation process. The first set represents the first step of the procedure, the application of the enhancement filter, while the second set depicts the texture based voxel classification, which offers a refinement of vessel tree volume. 81
 and texture based voxel")


82 Figure 5.8: Vessel tree segmentation in two steps. Application of the enhancement filter (first set) and texture based voxel classification (second set), which offers a refinement of vessel tree volume. The yellow arrows indicate a reticular area, incorrectly recognized as a vessel structure by the enhancement filter. The texture- based classification has excluded this area from the vessel tree volume (second set) (Korfiatis et al., 2011) 82

83 3. ILD QUANTIFICATION After the lung field has been isolated and vessels have been extracted, a complicate algorithm is applied to the 3D dataset in order to evaluate the total disease extent and to characterize the type of disease. Step 1: The classification method uses a k- Nearest Neighbor (k- NN) center voxel technique, utilizing non- overlapping VOI sampling (21x21x21 pixels) of the Lung Parenchyma. This process identifies lung parenchyma classes and provides initially labeled ILD volumes (Figure 5.9). Figure 5.9: CAD tool labels ILD volumes in step 1 and classifies voxels in normal parenchyma, ground glass and reticular ILD (adapted from Korfiatis PhD Thesis, University of Patras 2010) Consequently, a complex 3D co- occurrence texture analysis for 52 selected features is applied. 83
84 Step 2: The second step refers to the application of an unsupervised Markov Random Field segmentation that combines pixel intensity and spatial dependencies. The CAD quantification tool reported high accuracy with respect to volume overlap, true positive and false positive fraction, on a dataset of 5 CT scans. Although the CAD tool produces 3D image output, the current evaluation was performed on 2D axial slice- basis, in order to be comparable to pixel- based reference of disease extent assessment provided by the radiologist. Specifically, the CAD tool is employed to quantify total, ground glass and reticular disease extent on 150 axial slices, originating from the same dataset of 30 patients. Figures 5.10 and 5.11 correspond to the CAD tool output in two different cases, where the original (left column) and hybrid images are demonstrated in axial, coronal and sagittal plane. 84
 corresponds to original data and the second (b,d,f) to pixel based disease extent estimation by the CAD tool in axial, coronal and sagittal plane. respectively.")
85 Figure 5.10: Case 1: Ground glass pattern. The first column (a,c,e) corresponds to original data and the second (b,d,f) to pixel based disease extent estimation by the CAD tool in axial, coronal and sagittal plane. respectively. Areas of affected lung parenchyma are depicted by the system with green overlays. A false assessment by the CAD tool of small vessels and interstitial structures as ground glass opacifications is noted in all planes (adapted from S.Kazantzi PhD Thesis, University of Patras, 2012) 85
 corresponds to original data and the second (b,d,f) to pixel based disease extent estimation by the CAD tool in axial, coronal and sagittal plane. respectively.")
86 (a) (b) (a) (c) (d) (c) (e) (f) Figure 5.11: Case 2: Mixed pattern - Ground glass and reticular. The first column (a,c,e) corresponds to original data and the second (b,d,f) to pixel based disease extent estimation by the CAD tool in axial, coronal and sagittal plane. respectively. Areas of affected lung parenchyma are shown with green overlays for ground glass and blue overlays for reticular. 86
87 CHAPTER 6 RESULTS - DISCUSSION The aim of this thesis is to evaluate and compare four different available methods for the assessment of interstitial lung disease extent. The performance of a chest CT Computer- Aided Diagnosis (CAD) quantification tool (d) is evaluated, as compared to radiologist visual scoring (a), visual pixel- based disease extent assessment (b) and histogram thresholding technique. All methods were assessed in 150 axial slices (30 patient chest CT scans) for percentage of total, ground glass and reticular disease extent. To ensure an acceptable reference for our study, in the absence of a gold standard, two radiologists in consensus with 10 and 20 years of experience in chest CT (A.K. and C.K, respectively), aware of patient history, provided in consensus the independent visual pixel- based reference standard (Rcons) for the CT data of the 30 patient scans (150 slices). To achieve consensus, the two radiologists discussed and agreed on pattern type and extent per slice prior to delineating segments. After initial delineation, both radiologists reviewed segments and performed corrections. The sample performance is reported on axial slice basis in terms of mean, standard deviation and range. Furthermore, methods have been compared pairwise by means of Bland- Altman analysis, utilized in order to assess by inspection the degree of agreement for varying disease extent. In this analysis, the differences were plotted against average values for each pair of disease extent estimation. Additionally, the Intraclass Correlation Coefficient index has been calculated for all pairs compared. The degree of agreement was characterized as almost perfect (ICC = ), substantial (ICC = ), moderate (ICC = ), weak (ICC = ) or very weak to negligible (ICC = ). Inter- observer variation between RAD1 and RADcons was also studied for visual scoring assessment (a) and visual pixel- based scoring evaluation (b) of ILD disease extent. In order 87
88 investigate the degree of agreement between radiologists, Bland- Altman and reliability analysis was also implemented. Table 6.1 summarizes the mean performance of each method applied and it s standard deviation, as well as range in parenthesis of the results for each method applied, including the pixel- based assessment by the two radiologists in consensus. Mean performance differences among methods were not statistically significant (t- test for paired data, p>0,05). Statistical analysis was performed using the IBM SPSS Statistics software package (SPSS Release 20.0, SPSS Inc., Chicago, IL, USA). Figures 5.12, 5.13 and 5.14 demonstrate example cases. Table 6.1: Mean ± standard deviation (range) extent assessment (%) of total lung disease, reticular and ground glass patterns: (i) quantitatively by two expert Radiologists in consensus considered as ground truth (RAD cons), (ii) quantitatively by Radiologist- in- trainee (RAD 1), (iii) semi- quantitatively by Radiologist 1 (SEMIQ. RAD 1), (iv) by the Thresholding System and (v) by the CAD System, of the sample studied (150 axial slices derived from 30 patient scans). Extent RAD cons RAD 1(b) SEMIQ. RAD 1(a) Thresholding System (c) CAD System (d) Total Reticular Ground Glass 8.3 ± ± ± ± ± 14.2 ( ) ( ) ( ) ( ) ( ) 4.7 ± ± ± ± ± 11.2 ( ) ( ) ( ) ( ) ( ) 3.7 ± ± ± ± ± 5.5 ( ) ( ) ( ) ( ) ( ) 88
 Figure 5.")


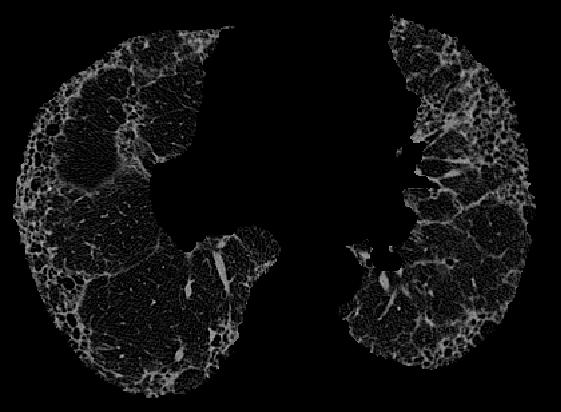
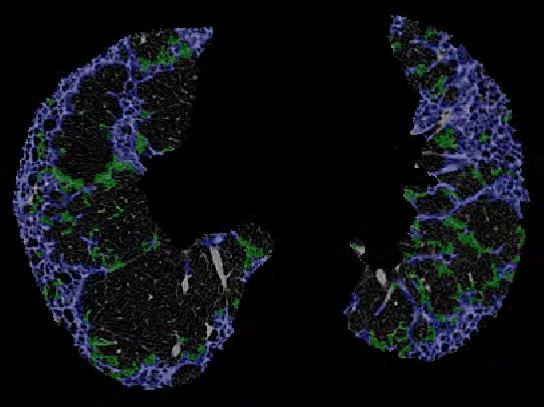
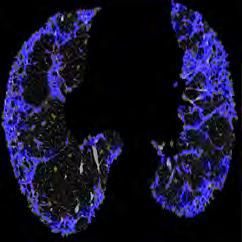
89 ORIGINAL SLICE RAD1 (b) CAD (d) HIST. HRESHOLDING (c) Figure 5.12: Case 1: Reticular pattern. Visual presentation of performances of methods applied for ILD quantification. ORIGINAL SLICE RAD1 (b) CAD (d) HIST. HRESHOLDING (c) Figure 5.13: Case 2: Mixed pattern. Visual presentation of performances of methods applied for ILD quantification. ORIGINAL SLICE RAD1 (b) CAD (d) HIST. HRESHOLDING (c) Figure 5.14: Case 3: Ground glass pattern. Visual presentation of perfomances of methods applied for ILD quantification. 89
90 6.1 SEMI- QUANTITATIVE SCORING RAD1 - PIXEL- BASED RAD1 SEMIQ. RAD1 - RAD1 (%) Figure 6.1 Total Disease Extent Average (%) SEMIQ. RAD1 - RAD1 (%) Figure 6.2 Reticular Pattern Extent Average (%) SEMIQ. RAD1 - RAD1 (%) Figure 6.3 Ground Glass Pattern Extent Average (%) 90
91 Bland- Altman plots corresponding to the differences in total, reticular and ground glass disease extent assessment between semi- quantitative visual scoring and pixel- based visual quantification by radiologist- in- trainee are depicted in figures 6.1, 6.2 and 6.3. Table 6.3 shows almost perfect agreement of the two methods concerning total disease assessment (ICC: 0,817 CI: 0,652-0,893) and a substantial agreement for reticular pattern disease extent (ICC: 0,731 CI: ). For the assessment of ground glass extent, ICC equals 0,200 (CI: ), indicating a weak agreement between the two methods. Both positive and negative differences are observed in these plots. Considering the visual pixel- based evaluation as the reference in these differencies, this fact points that the semi- quantitative method over- as well as underestimates occasionally the extent of disease. The scatter of the differences above and below the central line is increased for total and reticular extent 25%. In case of ground glass, differences are scattered earlier as compared to total and reticular extent scatter, while higher agreement is achieved for disease extent less than 15%. The observation of values distributions in these three plots show that total extent assessment is more influenced by the mismatch concerning ground glass evaluation. Dashed lines indicate confidence intervals. The disagreement between the two methods could be ascribed overall to the following reasons: Semi- quantitative methods are more subjective. The radiologists experience is a determinant factor for the assessment of the total disease, as well as for the distinction of the two subtypes. The visual pixel- based technique is more objective and depends less on experience. Ground glass opacification in particularly shows a variety of imaging patterns. This heterogeneity in association with the relative limited experience of the radiologist in trainee may lead easily to incorrect estimation. The discrimination of pattern disease may only underestimate the extent of each individual in case these patterns are superimposed. In case of free hand delineation (pixel- based assessment) the coexistence of the two patterns is by assumption characterized as reticular pattern and therefore underestimates ground glass extent. In SQ visual scoring, classification of each pattern is more feasible. The introduction of an additional imaging pattern, where both reticular and ground glass abnormalities are present would contribute to more accurate disease extent estimation. 91
92 The visual pixel- based system, which involves regions delineation,corresponding to disease patterns, offers a coarse outline that inevitably includes small lung structures, such as vessels and normal interstitial components. Consequently, it overestimates disease extent, especially reticular pattern when theoretically visual observation could distinguish these elements. Technical factors may also contribute to the lack of a total agreement between the two techniques. Low dose scanning protocol introduces image noise, while post processing techniques, such as lung and vessel segmentation algorithms may introduce false positive and negative pixels. Furthermore, motion artifacts and partial volume effects may be easily mistaken and classified as ground glass opacities, especially when the radiologist delineates abnormal lung tissue. In conclusion, both methods have advantages and weak points. Visual pixel based technique is more time consuming and requires familiarization with a GUI interface, as well as proper familiarization. Hence, is more reproducible, objective and precise. SQ visual scoring seems to fall short of visual pixel based technique in terms of accuracy of disease extent assessment, is definitely subjective but offers a faster and a more effortless estimation. Intra- class correlation coefficient indicates that these methods have an acceptable agreement concerning total and reticular disease assessment and therefore visual scoring may be preferred in terms of timesaving and convenience. The weak agreement for ground glass estimation could be attributed to deficiencies of both techniques as described above. 92
93 6.2 HISTOGRAM THRESHOLDING - PIXEL- BASED RAD1 Thres. System - RAD1 (%) Figure 6.4 Total Disease Extent Average (%) Thres. System - RAD1 (%) Figure 6.5 Reticular Pattern Extent Average (%) Thres. System - RAD1 (%) Ground Glass Pattern Extent Average (%) Figure
94 Bland- Altman plots corresponding to the differences in total, reticular and ground glass disease extent assessment between histogram thresholding and visual pixel- based quantification by radiologist- in- trainee are depicted in figures 6.4, 6.5 and 6.6. Table 6.3 shows substantial agreement of the two methods concerning total disease assessment (ICC 0,719 CI 0,631-0,788) and a moderate agreement for reticular pattern disease extent (ICC 0,557 CI ). For the assessment of ground glass extent ICC equals 0,074 (CI: ), indicating a very weak or negligible agreement between the two methods. The scatter of the differences is increased for total, reticular and ground glass extent and assessments 15%. In case of ground glass, scattering is more evident and the two techniques have no acceptable agreement. Assuming that the visual pixel based method is more precise, the thresholding technique tends to underestimate the total disease extent. During the histogram thresholding process has several limitations, as it segments total, ground glass and reticular patterns extend based on gray level pixel values, resulting into more fragmented segmentation. 94

95 6.3 CAD SYSTEM - PIXEL- BASED RAD1 EXAMPLE 1: MIXED PATERN Figure 6.7 demonstrates an example of CAD and the visual pixel - based evaluation of ILD extent by the radiologist in a case where GGO and reticular pattern coexist. The original slices refer to a 67 years old female patient with a 15years history of scleroderma. There is an agreement between the system and the radiologist in most abnormal areas of lung parenchyma. The arrows indicate some areas where CAD and radiologist have classified otherwise the findings. We san easily observe that free hand delineation offers a more coarse assessment of the disease extent. On the other hand, the CAD tool provides a more refined segmentation and classification. Nevertheless, we can identify slight lesions of increased attenuation that in reality represent small vessels. The system has incorrectly shorted these areas as abnormal parenchyma, both GGO and reticular (false positive). ORIGINAL AXIAL SLICES CAD RAD1 Figure 6.7: The first column represents the original data and includes axial slices of three different levels. Both ground glass and reticular opacities can easily be identified visually. The middle column corresponds to the CAD hybrid image where the abnormal lung is marked and classified as GGO or reticular by the system (blue=reticular, green=ggo). The right column presents the hand delineation by RAD1 using the graphical user interface. Yellow arrows show areas that have been classified differently by CAD and the radiologist. Agreement about other abnormal areas is also noticed. 95
Acute and Chronic Lung Disease
 KATHOLIEKE UNIVERSITEIT LEUVEN Faculty of Medicine Acute and Chronic Lung Disease W De Wever, JA Verschakelen Department of Radiology, University Hospitals Leuven, Belgium Clinical utility of HRCT To detect
Usual Interstitial pneumonia and Nonspecific Interstitial Pneumonia. Nitra and the Gangs.
 Usual Interstitial pneumonia and Nonspecific Interstitial Pneumonia Nitra and the Gangs. บทน ำและบทท ๓, ๑๐, ๑๒, ๑๓, ๑๔, ๑๕, ๑๗ Usual Interstitial Pneumonia (UIP) Most common & basic pathologic pattern
HRCT in Diffuse Interstitial Lung Disease Steps in High Resolution CT Diagnosis. Where are the lymphatics? Anatomic distribution
 Steps in High Resolution CT Diagnosis Pattern of abnormality Distribution of disease Associated findings Clinical history Tomás Franquet MD What is the diagnosis? Hospital de Sant Pau. Barcelona Secondary
Liebow and Carrington's original classification of IIP
 Liebow and Carrington's original classification of IIP-- 1969 Eric J. Stern MD University of Washington UIP Usual interstitial pneumonia DIP Desquamative interstitial pneumonia BIP Bronchiolitis obliterans
An Image Repository for Chest CT
 An Image Repository for Chest CT Francesco Frajoli for the Chest CT in Antibody Deficiency Group An Image Repository for Chest CT he Chest CT in Antibody Deficiency Group is an international and interdisciplinary
Outline Definition of Terms: Lexicon. Traction Bronchiectasis
 HRCT OF IDIOPATHIC INTERSTITIAL PNEUMONIAS Disclosures Genentech, Inc. Speakers Bureau Tadashi Allen, MD University of Minnesota Assistant Professor Diagnostic Radiology 10/29/2016 Outline Definition of
11/10/2014. Multi-disciplinary Approach to Diffuse Lung Disease: The Imager s Perspective. Radiology
 Multi-disciplinary Approach to Diffuse Lung Disease: The Imager s Perspective Radiology Pathology Clinical 1 Role of HRCT Diagnosis Fibrosis vs. inflammation Next step in management Response to treatment
Financial disclosure COMMON DIAGNOSES IN HRCT. High Res Chest HRCT. HRCT Pre test. I have no financial relationships to disclose. Anatomy Nomenclature
 Financial disclosure I have no financial relationships to disclose. Douglas Johnson D.O. Cardiothoracic Imaging Gaston Radiology COMMON DIAGNOSES IN HRCT High Res Chest Anatomy Nomenclature HRCT Sampling
Cryptogenic Organizing Pneumonia Diagnosis Approach Based on a Clinical-Radiologic-Pathologic Consensus
 Cryptogenic Organizing Pneumonia Diagnosis Approach Based on a Clinical-Radiologic-Pathologic Consensus Poster No.: C-1622 Congress: ECR 2012 Type: Scientific Exhibit Authors: C. Cordero Lares, E. Zorita
I have no relevant conflicts of interest to disclose
 I have no relevant conflicts of interest to disclose Diffuse parenchymal lung disease (DPLD) and its associations Secondary lobular anatomy DPLD History, clinical findings, temporal evolution, and exposures
Progress in Idiopathic Pulmonary Fibrosis
 Progress in Idiopathic Pulmonary Fibrosis David A. Lynch, MB Disclosures Progress in Idiopathic Pulmonary Fibrosis David A Lynch, MB Consultant: t Research support: Perceptive Imaging Boehringer Ingelheim
Differential diagnosis
 Differential diagnosis Idiopathic pulmonary fibrosis (IPF) is part of a large family of idiopathic interstitial pneumonias (IIP), one of four subgroups of interstitial lung disease (ILD). Differential
Manish Powari Regional Training Day 10/12/2014
 Manish Powari Regional Training Day 10/12/2014 Large number of different types of Interstitial Lung Disease (ILD). Most are very rare Most patients present with one of a smaller number of commoner diseases
NONE OVERVIEW FINANCIAL DISCLOSURES UPDATE ON IDIOPATHIC PULMONARY FIBROSIS/IPF (UIP) FOR PATHOLOGISTS. IPF = Idiopathic UIP Radiologic UIP Path UIP
 FOR PATHOLOGISTS. IPF = Idiopathic UIP Radiologic UIP Path UIP") UPDATE ON IDIOPATHIC PULMONARY FIBROSIS/IPF () FOR PATHOLOGISTS Thomas V. Colby, M.D. Professor of Pathology (Emeritus) Mayo Clinic Arizona FINANCIAL DISCLOSURES NONE OVERVIEW IPF Radiologic Dx Pathologic
UPDATE ON IDIOPATHIC PULMONARY FIBROSIS/IPF () FOR PATHOLOGISTS Thomas V. Colby, M.D. Professor of Pathology (Emeritus) Mayo Clinic Arizona FINANCIAL DISCLOSURES NONE OVERVIEW IPF Radiologic Dx Pathologic
Daria Manos RSNA 2016 RC 401. https://medicine.dal.ca/departments/depar tment-sites/radiology/contact/faculty/dariamanos.html
 Daria Manos RSNA 2016 RC 401 https://medicine.dal.ca/departments/depar tment-sites/radiology/contact/faculty/dariamanos.html STEP1: Is this fibrotic lung disease? STEP 2: Is this a UIP pattern? If yes:
How to identify interstitial pneumonias.
 How to identify interstitial pneumonias. Poster No.: C-0804 Congress: ECR 2014 Type: Educational Exhibit Authors: S. claret loaiza, M. C. Cañete Moslero, R. Carreño Gonzalez, C. de la Torre; Malaga/ES
HYPERSENSITIVITY PNEUMONITIS
 HYPERSENSITIVITY PNEUMONITIS A preventable fibrosis MOSAVIR ANSARIE MB., FCCP INTERSTITIAL LUNG DISEASES A heterogeneous group of non infectious, non malignant diffuse parenchymal disorders of the lower
5/9/2015. Multi-disciplinary Approach to Diffuse Lung Disease: The Imager s Perspective. No, I am not a pulmonologist! Radiology
 Multi-disciplinary Approach to Diffuse Lung Disease: The Imager s Perspective No, I am not a pulmonologist! Radiology Pathology Clinical 1 Everyone needs a CT Confidence in diagnosis Definitive HRCT +
Radiologic Approach to Smoking Related Interstitial Lung Disease
 Radiologic Approach to Smoking Related Interstitial Lung Disease Poster No.: C-1854 Congress: ECR 2013 Type: Educational Exhibit Authors: K.-N. Lee, J.-Y. Han, E.-J. Kang, J. Kang; Busan/KR Keywords: Toxicity,
Chest X-ray Interpretation
 Chest X-ray Interpretation Introduction Routinely obtained Pulmonary specialist consultation Inherent physical exam limitations Chest x-ray limitations Physical exam and chest x-ray provide compliment
Non-neoplastic Lung Disease II
 Pathobasic Non-neoplastic Lung Disease II Spasenija Savic Prince Pathology Program Systematic approach to surgical lung biopsies with ILD Examples (chronic ILD): Idiopathic interstitial pneumonias: UIP,
10/17/2016. Nuts and Bolts of Thoracic Radiology. Objectives. Techniques
 Nuts and Bolts of Thoracic Radiology October 20, 2016 Carleen Risaliti Objectives Understand the basics of chest radiograph Develop a system for interpreting chest radiographs Correctly identify thoracic
INTERSTITIAL LUNG DISEASE. Radhika Reddy MD Pulmonary/Critical Care Long Beach VA Medical Center January 5, 2018
 INTERSTITIAL LUNG DISEASE Radhika Reddy MD Pulmonary/Critical Care Long Beach VA Medical Center January 5, 2018 Interstitial Lung Disease Interstitial Lung Disease Prevalence by Diagnosis: Idiopathic Interstitial
TB Radiology for Nurses Garold O. Minns, MD
 TB Nurse Case Management Salina, Kansas March 31-April 1, 2010 TB Radiology for Nurses Garold O. Minns, MD April 1, 2010 TB Radiology for Nurses Highway Patrol Training Center Salina, KS April 1, 2010
Lung Allograft Dysfunction
 Lung Allograft Dysfunction Carlos S. Restrepo M.D. Ameya Baxi M.D. Department of Radiology University of Texas Health San Antonio Disclaimer: We do not have any conflict of interest or financial gain to
4/17/2010 C ini n ca c l a Ev E a v l a ua u t a ion o n of o ILD U dat a e t e i n I LDs
 Update in ILDs Diagnosis 101: Clinical Evaluation April 17, 2010 Jay H. Ryu, MD Mayo Clinic, Rochester MN Clinical Evaluation of ILD Outline General aspects of ILDs Classification of ILDs Clinical evaluation
Workshop Cyst & Lucency. How to Approach
 Workshop Cyst & Lucency How to Approach To Approach Cystic Lung Disease True cysts? Cavitary disease Cystic bronchiectasis Mosaic attenuation Subpleural cysts Bullae Paraseptal emphysema Honeycombing Birt
Case 1 : Question. 1.1 What is the intralobular distribution? 1. Centrilobular 2. Perilymphatic 3. Random
 Interesting case Case 1 Case 1 : Question 1.1 What is the intralobular distribution? 1. Centrilobular 2. Perilymphatic 3. Random Case 1: Answer 1.1 What is the intralobular distribution? 1. Centrilobular
I don t need you. Disclosure Statement. Pathology Approach to ILD 11/5/2016. Kirk D. Jones, MD UCSF Dept of Pathology
 Pathology Approach to ILD Disclosure Statement Relevant financial relationships with a commercial interest: Boeringer Ingleheim, speaker Kirk D. Jones, MD UCSF Dept of Pathology kirk.jones@ucsf.edu I don
Interesting Cases. Pulmonary
 Interesting Cases Pulmonary 54M with prior history of COPD, hep B/C, and possible history of TB presented with acute on chronic dyspnea, and productive cough Hazy opacity overlying the left hemithorax
Imaging Small Airways Diseases: Not Just Air trapping. Eric J. Stern MD University of Washington
 Imaging Small Airways Diseases: Not Just Air trapping Eric J. Stern MD University of Washington What we are discussing SAD classification SAD imaging with MDCT emphasis What is a small airway? Airway with
T he diagnostic evaluation of a patient with
 546 REVIEW SERIES Challenges in pulmonary fibrosis? 1: Use of high resolution CT scanning of the lung for the evaluation of patients with idiopathic interstitial pneumonias Michael B Gotway, Michelle M
Histopathologic Approach to Interstitial Lung Disease
 Histopathologic Approach to Interstitial Lung Disease Kirk D. Jones, MD UCSF Dept of Pathology kirk.jones@ucsf.edu Disclosures I have nothing to disclose 1 Why? Much of interstitial lung disease biopsies
Spectrum of Cystic Lung Disease and its Mimics. Kathleen Jacobs MD and Elizabeth Weihe MD UC San Diego Medical Center, Department of Radiology
 Spectrum of Cystic Lung Disease and its Mimics Kathleen Jacobs MD and Elizabeth Weihe MD UC San Diego Medical Center, Department of Radiology No Financial Disclosures Learning Objectives 1. Review the
The crazy-paving pattern: A radiological-pathological correlated and illustrated overview
 The crazy-paving pattern: A radiological-pathological correlated and illustrated overview Poster No.: C-0827 Congress: ECR 2010 Type: Educational Exhibit Topic: Chest Authors: W. F. M. De Wever, J. Coolen,
Diagnosing Idiopathic Pulmonary Fibrosis on Evidence-Based Guidelines
 Diagnosing Idiopathic Pulmonary Fibrosis on Evidence-Based Guidelines Rebecca Keith, MD Assistant Professor, Division of Pulmonary and Critical Care Medicine National Jewish Health, Denver, CO Objectives
Bronkhorst colloquium Interstitiële longziekten. Katrien Grünberg, klinisch patholoog
 Bronkhorst colloquium 2013-2014 Interstitiële longziekten De pathologie achter de CT Katrien Grünberg, klinisch patholoog K.grunberg@vumc.nl Preparing: introduction and 3 cases The introduction on microscopic
An Introduction to Radiology for TB Nurses
 An Introduction to Radiology for TB Nurses Garold O. Minns, MD September 14, 2017 TB Nurse Case Management September 12 14, 2017 EXCELLENCE EXPERTISE INNOVATION Garold O. Minns, MD has the following disclosures
The Egyptian Journal of Hospital Medicine (July 2017) Vol.68 (2), Page
 Vol.68 (2), Page") The Egyptian Journal of Hospital Medicine (July 2017) Vol.68 (2), Page 1135-1140 Role of High Resolution Computed Tomography in Diagnosis of Interstitial Lung Diseases in Patients with Collagen Diseases
The Egyptian Journal of Hospital Medicine (July 2017) Vol.68 (2), Page 1135-1140 Role of High Resolution Computed Tomography in Diagnosis of Interstitial Lung Diseases in Patients with Collagen Diseases
Chest Radiology Interpretation: Findings of Tuberculosis
 Chest Radiology Interpretation: Findings of Tuberculosis Get out your laptops, smart phones or other devices pollev.com/chestradiology Case #1 1 Plombage Pneumonia Cancer 2 Reading the TB CXR Be systematic!
Organs Histology D. Sahar AL-Sharqi. Respiratory system
 Respiratory system The respiratory system provides for exchange of O2 and CO2 to and from the blood. Respiratory organs include the lungs and a branching system of bronchial tubes that link the sites of
ARDS - a must know. Page 1 of 14
 ARDS - a must know Poster No.: C-1683 Congress: ECR 2016 Type: Authors: Keywords: DOI: Educational Exhibit M. Cristian; Turda/RO Education and training, Edema, Acute, Localisation, Education, Digital radiography,
Case 1: Question. 1.1 What is the main pattern of this HRCT? 1. Intralobular line 2. Groundglass opacity 3. Perilymphatic nodule
 HRCT WORK SHOP Case 1 Case 1: Question 1.1 What is the main pattern of this HRCT? 1. Intralobular line 2. Groundglass opacity 3. Perilymphatic nodule Case 1: Question 1.2 What is the diagnosis? 1. Hypersensitivity
Replacement of air with fluid, inflammatory. cells or cellular debris. Parenchymal, Interstitial (Restrictive) and Vascular Diseases.
 and Vascular Diseases.") Parenchymal, Interstitial (Restrictive) and Vascular Diseases Alain C. Borczuk, M.D. Dept of Pathology Replacement of air with fluid, inflammatory cells Pulmonary Edema Pneumonia Hemorrhage Diffuse alveolar
Parenchymal, Interstitial (Restrictive) and Vascular Diseases Alain C. Borczuk, M.D. Dept of Pathology Replacement of air with fluid, inflammatory cells Pulmonary Edema Pneumonia Hemorrhage Diffuse alveolar
Idiopathic interstitial pneumonias (IIPs) are a group of
 are a group of") SYMPOSIA C. Isabela S. Silva, MD, PhD and Nestor L. Müller, MD, PhD Abstract: The idiopathic interstitial pneumonias (IIPs) are a group of diffuse parenchymal lung diseases of unknown etiology characterized
SYMPOSIA C. Isabela S. Silva, MD, PhD and Nestor L. Müller, MD, PhD Abstract: The idiopathic interstitial pneumonias (IIPs) are a group of diffuse parenchymal lung diseases of unknown etiology characterized
Restrictive lung diseases
 Restrictive lung diseases Restrictive lung diseases are diseases that affect the interstitium of the lung. Interstitium of the lung is the very thin walls surrounding the alveoli, it s formed of epithelium
The Respiratory System. Dr. Ali Ebneshahidi
 The Respiratory System Dr. Ali Ebneshahidi Functions of The Respiratory System To allow gases from the environment to enter the bronchial tree through inspiration by expanding the thoracic volume. To allow
Systemic lupus erythematosus (SLE): Pleuropulmonary Manifestations
: Pleuropulmonary Manifestations") 08/30/10 09/26/10 Systemic lupus erythematosus (SLE): Pleuropulmonary Manifestations Camila Downey S. Universidad de Chile, School of Medicine, Year VII Harvard University, School of Medicine Sept 17,
08/30/10 09/26/10 Systemic lupus erythematosus (SLE): Pleuropulmonary Manifestations Camila Downey S. Universidad de Chile, School of Medicine, Year VII Harvard University, School of Medicine Sept 17,
Radiologists toolbox to differentiate alveolar versus interstitial lung diseases
 Radiologists toolbox to differentiate alveolar versus interstitial lung diseases Dr Sumer Shikhare, Dr Trishna Shimpi, Dr Ashish Chawla Khoo Teck Puat Hospital Singapore. Relevant financial disclosures
Pulmonary Sarcoidosis - Radiological Evaluation
 Original Research Article Pulmonary Sarcoidosis - Radiological Evaluation Jayesh Shah 1, Darshan Shah 2*, C. Raychaudhuri 3 1 Associate Professor, 2 1 st Year Resident, 3 Professor and HOD Radiology Department,
Diffuse Interstitial Lung Diseases: Is There Really Anything New?
 : Is There Really Anything New? Sujal R. Desai, MBBS, MD ESTI SPEAKER SUNDAY Society of Thoracic Radiology San Antonio, Texas March 2014 Diffuse Interstitial Lung Disease The State of Play DILDs Is There
Criteria for confident HRCT diagnosis of usual interstitial pneumonia (UIP)
") Criteria for confident HRCT diagnosis of usual interstitial pneumonia (UIP) Assem El Essawy (1) & Amr A. Nassef (٢) Abstract Identification of interstitial pneumonia (IP) was mainly based on histological
Criteria for confident HRCT diagnosis of usual interstitial pneumonia (UIP) Assem El Essawy (1) & Amr A. Nassef (٢) Abstract Identification of interstitial pneumonia (IP) was mainly based on histological
Lung CT: Part 2, The Interstitial Pneumonias Clinical, Histologic, and CT Manifestations
 Integrative Imaging Review Ferguson and Berkowitz CT of Interstitial Pneumonia Integrative Imaging Review CME SAM Lung CT FOCUS ON: Emma C. Ferguson 1 Eugene A. Berkowitz 2 Ferguson EC, Berkowitz EA Keywords:
Smoking-related Interstitial Lung Diseases: High-Resolution CT Findings
 Smoking-related Interstitial Lung Diseases: High-Resolution CT Findings Poster No.: C-2358 Congress: ECR 2013 Type: Educational Exhibit Authors: V. Cuartero Revilla, M. Nogueras Carrasco, P. Olmedilla
Cystic Lung Disease. Cristopher A. Meyer, MD
 Cystic Lung Disease Cristopher A. Meyer, MD Air filled structure with definable wall typically less than 1 mm thick Cris A. Meyer, M.D. Professor of Radiology University of Wisconsin School of Medicine
Epidemiology and classification of smoking related interstitial lung diseases
 Epidemiology and classification of smoking related interstitial lung diseases Šterclová M. Department of Respiratory Diseases, Thomayer Hospital, Prague, Czech Republic Supported by an IGA Grant No G 1207
Thoracic lung involvement in rheumatoid arthritis: Findings on HRCT
 Thoracic lung involvement in rheumatoid arthritis: Findings on HRCT Poster No.: C-2488 Congress: ECR 2015 Type: Educational Exhibit Authors: R. E. Correa Soto, M. J. Martín Sánchez, J. M. Fernandez 1 1
Radiological features of idiopathic interstitial pneumonia: a pictorial review
 Radiological features of idiopathic interstitial pneumonia: a pictorial review Poster No.: C-2012 Congress: ECR 2013 Type: Educational Exhibit Authors: M. Piccoli, F. Roccasalva, S. Palmucci, G. Cappello,
A Review of Interstitial Lung Diseases. Paul J. Wolters, MD Associate Professor Department of Medicine University of California San Francisco
 A Review of Interstitial Lung Diseases Paul J. Wolters, MD Associate Professor Department of Medicine University of California San Francisco Outline Overview of diagnosis in ILD Why it is important Definition/Classification
ARTICLE IN PRESS. Ahuva Grubstein a, Daniele Bendayan b, Ithak Schactman c, Maya Cohen a, David Shitrit b, Mordechai R. Kramer b,
 Respiratory Medicine (2005) 99, 948 954 Concomitant upper-lobe bullous emphysema, lower-lobe interstitial fibrosis and pulmonary hypertension in heavy smokers: report of eight cases and review of the literature
The radiological differential diagnosis of the UIP pattern
 5th International Conference on Idiopathic Pulmonary Fibrosis, Modena, 2015, June 12th The radiological differential diagnosis of the UIP pattern Simon Walsh King s College Hospital Foundation Trust London,
CT in Idiopathic Pulmonary Fibrosis: Diagnosis and Beyond
 Cardiopulmonary Imaging Review Gruden CT of Idiopathic Pulmonary Fibrosis Cardiopulmonary Imaging Review James F. Gruden 1 Gruden JF FOCUS ON: Keywords: CT, diagnosis, high-resolution CT, idiopathic pulmonary
Histopathology: pulmonary pathology
 Histopathology: pulmonary pathology These presentations are to help you identify basic histopathological features. They do not contain the additional factual information that you need to learn about these
PULMONARY TUBERCULOSIS RADIOLOGY
 PULMONARY TUBERCULOSIS RADIOLOGY RADIOLOGICAL MODALITIES Medical radiophotography Radiography Fluoroscopy Linear (conventional) tomography Computed tomography Pulmonary angiography, bronchography Ultrasonography,
Respiratory System. Organization of the Respiratory System
 Respiratory System In addition to the provision of oxygen and elimination of carbon dioxide, the respiratory system serves other functions, as listed in (Table 15 1). Respiration has two quite different
Imaging: how to recognise idiopathic pulmonary fibrosis
 REVIEW IDIOPATHIC PULMONARY FIBROSIS Imaging: how to recognise idiopathic pulmonary fibrosis Anand Devaraj Affiliations: Dept of Radiology, St George s Hospital, London, UK. Correspondence: Anand Devaraj,
A Review of Interstitial Lung Diseases
 Outline A Review of Interstitial Lung Diseases Paul J. Wolters, MD Associate Professor Department of Medicine University of California San Francisco Overview of diagnosis in ILD Why it is important Definition/Classification
HRCT Versus Volume Rendering (Three Colors, Three Densities Lung Images) in Diagnosis of Small Airway Disease: A Comparative Study
 in Diagnosis of Small Airway Disease: A Comparative Study") Med. J. Cairo Univ., Vol. 84, No. 1, March: 359-364, 2016 www.medicaljournalofcairouniversity.net HRCT Versus Volume Rendering (Three Colors, Three Densities Lung Images) in Diagnosis of Small Airway Disease:
Med. J. Cairo Univ., Vol. 84, No. 1, March: 359-364, 2016 www.medicaljournalofcairouniversity.net HRCT Versus Volume Rendering (Three Colors, Three Densities Lung Images) in Diagnosis of Small Airway Disease:
Chest and cardiovascular
 Module 1 Chest and cardiovascular A. Doss and M. J. Bull 1. Regarding the imaging modalities of the chest: High resolution computed tomography (HRCT) uses a slice thickness of 4 6 mm to identify mass lesions
Medical Policy An independent licensee of the Blue Cross Blue Shield Association
 Idiopathic Pulmonary Fibrosis Page 1 of 10 Medical Policy An independent licensee of the Blue Cross Blue Shield Association Title: Idiopathic Pulmonary Fibrosis (Esbriet /pirfenidone, Ofev /nintedanib)
Pediatric High-Resolution Chest CT
 Pediatric High-Resolution Chest CT Alan S. Brody, MD Professor of Radiology and Pediatrics Chief, Thoracic Imaging Cincinnati Children s s Hospital Cincinnati, Ohio, USA Pediatric High-Resolution CT Short
Radiologic-pathologic correlation of pulmonary diseases
 The 1578 th Chest Conference/ 3 rd Biennial Clinical- Radiologic-Pathologic Correlation Radiologic-pathologic correlation of pulmonary diseases Harumi Itoh, M.D. University of Fukui, Japan Centriacinar
Syllabus: 6 pages (Page 6 lists corresponding figures for Grant's Atlas 11 th & 12 th Eds.)
") PLEURAL CAVITY AND LUNGS Dr. Milton M. Sholley SELF STUDY RESOURCES Essential Clinical Anatomy 3 rd ed. (ECA): pp. 70 81 Syllabus: 6 pages (Page 6 lists corresponding figures for Grant's Atlas 11 th &
PLEURAL CAVITY AND LUNGS Dr. Milton M. Sholley SELF STUDY RESOURCES Essential Clinical Anatomy 3 rd ed. (ECA): pp. 70 81 Syllabus: 6 pages (Page 6 lists corresponding figures for Grant's Atlas 11 th &
THE RESPIRATORY SYSTEM
 THE RESPIRATORY SYSTEM Functions of the Respiratory System Provides extensive gas exchange surface area between air and circulating blood Moves air to and from exchange surfaces of lungs Protects respiratory
Case Presentations in ILD. Harold R. Collard, MD Department of Medicine University of California San Francisco
 Case Presentations in ILD Harold R. Collard, MD Department of Medicine University of California San Francisco Outline Overview of diagnosis in ILD Definition/Classification High-resolution CT scan Multidisciplinary
THE GOOFY ANATOMIST QUIZZES
 THE GOOFY ANATOMIST QUIZZES 7. LUNGS Q1. Fill in the blanks: the lung has lobes and fissures. A. Right, three, two. B. Right, two, one. C. Left, three, two. D. Left, two, three. Q2. The base of the lung
Parenchymal, Interstitial i (Restrictive) i and Vascular Diseases
 i and Vascular Diseases") Pulmonary Diseases: Structure-Function Correlation II Parenchymal, Interstitial i (Restrictive) i and Vascular Diseases Alain C. Borczuk, M.D. Dept of Pathology Pulmonary Diseases: Structure-Function Correlation
Pulmonary Diseases: Structure-Function Correlation II Parenchymal, Interstitial i (Restrictive) i and Vascular Diseases Alain C. Borczuk, M.D. Dept of Pathology Pulmonary Diseases: Structure-Function Correlation
OBJECTIVES. Solitary Solid Spiculated Nodule. What would you do next? Case Based Discussion: State of the Art Management of Lung Nodules.
 Organ Imaging : September 25 2015 OBJECTIVES Case Based Discussion: State of the Art Management of Lung Nodules Dr. Elsie T. Nguyen Dr. Kazuhiro Yasufuku 1. To review guidelines for follow up and management
Hypersensitivity Pneumonitis: Spectrum of High-Resolution CT and Pathologic Findings
 CT of Hypersensitivity Pneumonitis Chest Imaging Pictorial Essay C. Isabela S. Silva 1 ndrew Churg 2 Nestor L. Müller 1 Silva CIS, Churg, Müller NL Keywords: high-resolution CT, hypersensitivity pneumonitis,
IPF: Epidemiologia e stato dell arte
 IPF: Epidemiologia e stato dell arte Clinical Classification Diffuse parenchimal lung diseases Exposure-related: - occupational - environmental - medication Desquamative interstitial pneumonia Idiopathic
New Horizons in the Imaging of the Lung
 New Horizons in the Imaging of the Lung Postprocessing. How to do it and when do we need it? Peter M.A. van Ooijen, MSc, PhD Principal Investigator, Radiology, UMCG Discipline Leader Medical Imaging Informatics
Bronchial syndrome. Atelectasis Draining bronchus Bronchiectasis
 Bronchial syndrome Atelectasis Draining bronchus Bronchiectasis Etienne Leroy Terquem Pierre L Her SPI / ISP Soutien Pneumologique International / International Support for Pulmonology Atelectasis Consequence
Interstitial Lung Disease in Infants and Children
 Interstitial Lung Disease in Infants and Children David A. Mong, MD SUNDAY Andrew Mong MD Beyond the interstitium (path includes airways/airspace) Radiographic diffuse disease Adult Interstitial Lung Disease
The Imaging Analysis of Pulmonary Sarcodiosis
 www.cancercellresearch.org ISSN: 2161-2609 Article The Imaging Analysis of Pulmonary Sarcodiosis Xin He, Chuanyu Zhang* Department of Radiology, Affiliated Hospital of Qingdao University, Qingdao, China
Lecturer: Ms DS Pillay ROOM 2P24 25 February 2013
 Lecturer: Ms DS Pillay ROOM 2P24 25 February 2013 Thoracic Wall Consists of thoracic cage Muscle Fascia Thoracic Cavity 3 Compartments of the Thorax (Great Vessels) (Heart) Superior thoracic aperture
Idiopathic Pulmonary of Care
 Chapter 6.1 Living Medical etextbook A Digital Tool at the Point of Care From Projects In Knowledge Pulmonology Idiopathic Pulmonary Fibrosis @Point of Care IPF Case Study: Typical Presentation, Role of
October 2012 Imaging Case of the Month. Michael B. Gotway, MD Associate Editor Imaging. Department of Radiology Mayo Clinic Arizona Scottsdale, AZ
 October 2012 Imaging Case of the Month Michael B. Gotway, MD Associate Editor Imaging Department of Radiology Mayo Clinic Arizona Scottsdale, AZ Clinical History: A 65-year-old non-smoking woman presented
Mimics in chest disease: interstitial opacities
 Insights Imaging (2013) 4:9 27 DOI 10.1007/s13244-012-0207-7 PICTORIAL REVIEW Mimics in chest disease: interstitial opacities Anastasia Oikonomou & Panos Prassopoulos Received: 19 June 2012 / Revised:
International consensus statement on idiopathic pulmonary fibrosis
 Eur Respir J 2001; 17: 163 167 Printed in UK all rights reserved Copyright #ERS Journals Ltd 2001 European Respiratory Journal ISSN 0903-1936 PERSPECTIVE International consensus statement on idiopathic
September 2014 Imaging Case of the Month. Michael B. Gotway, MD. Department of Radiology Mayo Clinic Arizona Scottsdale, AZ
 September 2014 Imaging Case of the Month Michael B. Gotway, MD Department of Radiology Mayo Clinic Arizona Scottsdale, AZ Clinical History: A 57-year-old non-smoking woman presented to her physician as
Eun-Young Kang, M.D., Jae Wook Lee, M.D., Ji Yung Choo, M.D., Hwan Seok Yong, M.D., Ki Yeol Lee, M.D., Yu-Whan Oh, M.D.
 Eun-Young Kang, M.D., Jae Wook Lee, M.D., Ji Yung Choo, M.D., Hwan Seok Yong, M.D., Ki Yeol Lee, M.D., Yu-Whan Oh, M.D. Department of Radiology, Korea University Guro Hospital, College of Medicine, Korea
Bronchiectasis: An Imaging Approach
 Bronchiectasis: An Imaging Approach Travis S Henry, MD Associate Professor of Clinical Radiology Cardiac and Pulmonary Imaging Section University of California, San Francisco Large Middle Small 1 Bronchiectasis
Chest X-ray (CXR) Interpretation Brent Burbridge, MD, FRCPC
 Interpretation Brent Burbridge, MD, FRCPC") Chest X-ray (CXR) Interpretation Brent Burbridge, MD, FRCPC An approach to reviewing a chest x-ray will create a foundation that will facilitate the detection of abnormalities. You should create your own
Chest X-ray (CXR) Interpretation Brent Burbridge, MD, FRCPC An approach to reviewing a chest x-ray will create a foundation that will facilitate the detection of abnormalities. You should create your own
Bronchoalveolar Lavage and Histopathologic Diagnosis Based on Biopsy
 Idiopathic Pulmonary Fibrosis Bronchoalveolar Lavage and Histopathologic Diagnosis Based on Biopsy JMAJ 46(11): 469 474, 2003 Yukihiko SUGIYAMA Professor, Division of Pulmonary Medicine, Department of
Connective Tissue Disorder- Associated Interstitial Lung Disease (CTD-ILD) and Updates
 and Updates") Connective Tissue Disorder- Associated Interstitial Lung Disease (CTD-ILD) and Updates Maria Elena Vega, M.D Assistant Professor of Medicine Lewis Katz School of Medicine at Temple University Nothing to
Connective Tissue Disorder- Associated Interstitial Lung Disease (CTD-ILD) and Updates Maria Elena Vega, M.D Assistant Professor of Medicine Lewis Katz School of Medicine at Temple University Nothing to
HISTOLOGY OF THE RESPIRATORY SYSTEM I. Introduction A. The respiratory system provides for gas exchange between the environment and the blood. B.
 HISTOLOGY OF THE RESPIRATORY SYSTEM I. Introduction A. The respiratory system provides for gas exchange between the environment and the blood. B. The human respiratory system may be subdivided into two
SESSION IV: MECHANISMS OF HUMAN DISEASE: LABORATORY SESSIONS PULMONARY PATHOLOGY I. December 5, 2012
 SESSION IV: MECHANISMS OF HUMAN DISEASE: LABORATORY SESSIONS PULMONARY PATHOLOGY I December 5, 2012 FACULTY COPY GOAL: Describe the basic morphologic and pathophysiologic changes in various conditions
American Thoracic Society European Respiratory Society Classification of the Idiopathic Interstitial Pneumonias: Advances in Knowledge since 20021
 This copy is for personal use only. To order printed copies, contact reprints@rsna.org American Thoracic Society European Respiratory Society Classification of the Idiopathic Interstitial Pneumonias: Advances