Supplemental Information. Metabolic Maturation during Muscle Stem Cell. Differentiation Is Achieved by mir-1/133a-mediated
|
|
|
- Vivian Conley
- 6 years ago
- Views:
Transcription
1 Cell Metabolism, Volume 27 Supplemental Information Metabolic Maturation during Muscle Stem Cell Differentiation Is Achieved by mir-1/133a-mediated Inhibition of the Dlk1-Dio3 Mega Gene Cluster Stas Wüst, Stefan Dröse, Juliana Heidler, Ilka Wittig, Ina Klockner, Andras Franko, Erik Bonke, Stefan Günther, Ulrich Gärtner, Thomas Boettger, and Thomas Braun
2
3 Figure S1: Dlk1-Dio3 cluster mirnas are differentially expressed in freshly isolated MuSC and differentiated myotubes and induced by MEF2A Related to Figure 1. (A) RNA seq of males mice reveals strong and specific expression of Dlk1-Dio3 cluster genes in freshly isolated MuSCs (FI), which after massive reduction in proliferating MuSCs (P) are re-expressed at low levels in myotubes (M). (B-C) Affymetrix microarray-based GSEA (C2 gene sets) of proliferating versus freshly isolated MuSC (from male mice) (B); and myotubes versus freshly isolated MuSC (from male mice) (C). (D) GSEA (C3 gene sets) of myotubes versus freshly isolated MuSC. (E) RT-qPCR expression analysis of the Dlk1-Dio3 cluster lncrnas Rian and Mirg1 in freshly isolated MuSC and myotubes after 6 days in differentiation medium. (n=3/3 biological replicates (1 male, 2 females/1 male, 2 females); Mann- Whitney U test, one-tailed, *p=0.05) (F) Relative expression levels of mir-1 and mir-206 obtained by mirna seq in different tissues. (G-I) RT-qPCR expression analysis of Dlk1-Dio3 cluster components after forced expression of Mef2A (black bar) and Mef2A-dE4 (grey bars) in mouse embryonic fibroblasts (MEF) (G) C2C12 (H) and Sol8 (I) muscle cells (n=4/4/4 independent transfections; Mann- Whitney U test, one-tailed; *p<0.05).
4 Figure S2: mir-1/133a expression reduces MEF2a levels in vitro and maintains skeletal muscle mass in vivo Related to Figure 2. (A) Western blot analysis of MEF2A levels after transfection of mir-1, mir-133a or mir-1 and mir-133a into differentiating C2C12 cells. (RAL A serves as loading control; n=4/4 (males), Mann-Whitney U test; two-tailed; *p<0.05). (B) Scheme for conditional deletion of the mir-1-2/133a-1 gene. (C) RT-qPCR expression analysis of Mib1 (n=3/3/3 (males); Mann-Whitney U test, two-tailed) using primers located at the exons flanking the mirna cluster (mir-1/133a dko: mir-1-1/133a-2 -/- //mir-1-2/133a-1 fl/fl //Pax7-Cre + ) muscle compared to control muscle (Ctrl: mir-1-1/133a-2 +/+ //mir-1-2/133a-1 fl/fl //Pax7-Cre - ) and Pax7-Cre + control mice (Cre WT/tg = mir-1-1/133a-2 +/+ //mir-1-2/133a-1 wt/wt //Pax7-Cre + ) (D) Tibia length of mir-1/133a dko and ctrl mice at 12 weeks (n=7/8 (males); student s t-test; two-tailed).
5
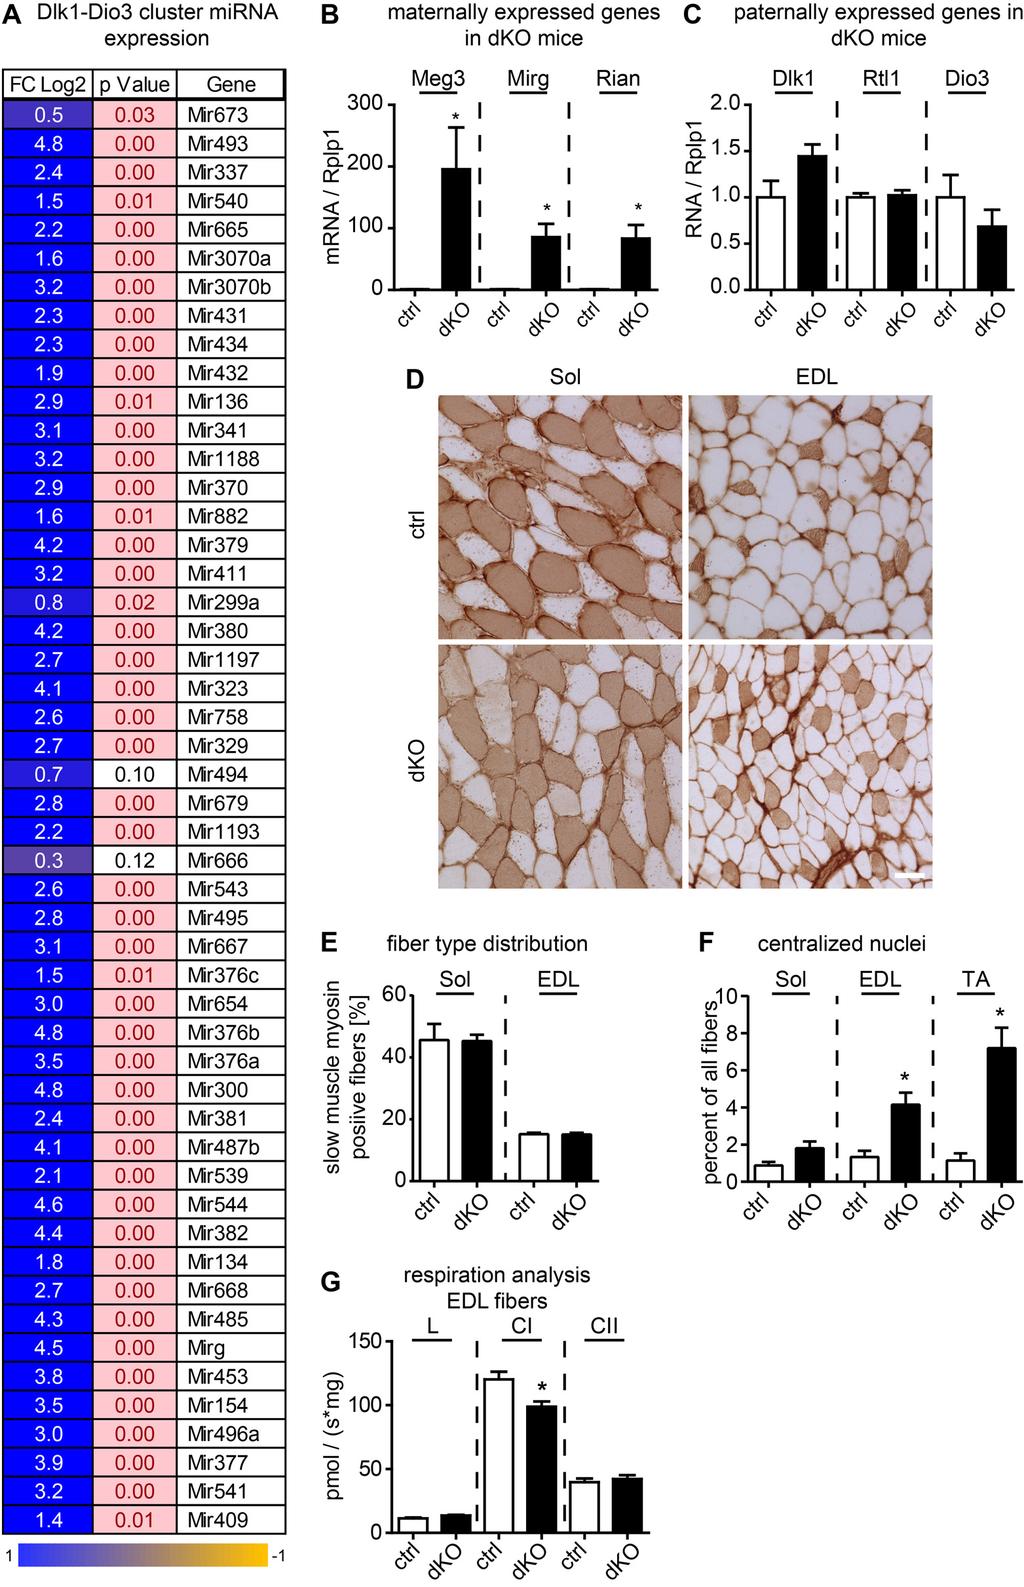
6 Figure S3: Inactivation of mir-1/133a in skeletal muscle increases expression of components of the Dlk1-Dio3 cluster Related to Figure 2 and Figure 3. (A) List of Dlk1-Dio3 cluster mirs upregulated in mir-1/133a dko compared to ctrl TA muscles (Affymetrix microarray analysis n = 3/3 (males); log 2 scale; students t-test, two-tailed, significant differences marked in red; p<0.05). (B) RTqPCR expression analysis of Meg3, Mirg and Rian relative to Rplp1 using RNA isolated from TA muscles of ctrl and mir-1/133a dko mice (n=3/3 (males); Mann-Whitney U test; one-tailed; *p=0.05). (C) RT-qPCR expression analysis of Dlk1, Rtl1 and Dio3 relative to Rplp1 using RNA isolated from TA muscles of ctrl and mir-1/133a dko mice (n=3/3 (males); Mann-Whitney U test; one-tailed, not significant). (D) Cross sections of soleus and EDL muscles from ctrl and mir-1/133a dko mice (females) immunostained for slow muscle myosin. Scale bar: 30 µm. (E) Quantification of slow muscle myosin positive muscle fibers in 12 weeks old control and mir-1/133a dko mice (> 350 fibres/animal were counted; n=3/5 (males); Mann-Whitney U test; two-tailed, not significant) (F) Quantification of fibers with central nuclei in male control and dko mice at 12 weeks (>350, 400 and 1500 fibers/animal were counted for soleus, EDL and TA muscles respectively; n=3/5 (1 male, 2 females/2 males, 3 females); Mann-Whitney U test; one-tailed; *p<0.05). (G) Statistical analysis of oxygraph measurements of isolated EDL fibers for CI (complex I), CII (complex II) and L (leakage respiration). Mean rates and standard error are shown (n=4/4 (males); Mann-Whitney U test; twotailed, *p<0.05).
 Immunofluorescence-based assessment of the number of Pax7 + -MuSC isolated from muscles of mir- 1/133a dko and ctrl mice 3d or 6d after induction of differentiation (n=3/3 (females), Mann-Whitney")
7 Figure S4: Loss of mir-1/133a in the skeletal muscle lineage disrupts the mitochondrial network but does not affect MuSC numbers and differentiation Related to Figure 4. (A) Immunofluorescence-based assessment of the number of Pax7 + -MuSC isolated from muscles of mir- 1/133a dko and ctrl mice 3d or 6d after induction of differentiation (n=3/3 (females), Mann-Whitney U test, two-tailed.). (B) Immunofluorescence-based assessment of the number of myogenin + -MuSC from mir-1/133a dko and ctrl muscles 3d and 6d after induction of differentiation (n=3/3 (females); Mann-Whitney U test; two-tailed). (C) RT-qPCR expression analysis of Meg3, Rian and Mirg in differentiating MuSC isolated from mir-1/133a dko and ctrl mice 6d after induction of differentiation (n=4/4 (females), Mann-Whitney U test; two-tailed; *p<0.05). (D) Immunofluorescence staining (MF20 antibody, green) of differentiating MuSC (from female mice), 3d and 6d after induction of differentiation. Nuclei were stained with DAPI (blue). Scale bar: 50 µm. (E) SDH staining of differentiating MuSC from female ctrl and mir-1/133a dko mice 3d and 6d after induction of differentiation The arrowhead points to mitochondrial aggregates in mir-1/133a dko-muscs. Scale bar: 25 µm. (F) SDH staining of WT female MuSCs transfected with mirnas mir-485, -493, and 543 or control mir 6 days after induction of differentiation. The arrowhead points to mitochondrial aggregates in transfected MuSCs. Scale bar: 25 µm. (G) RT-qPCR expression analysis of Opa1 and Mfn1 in WT MuSCs transfected with mirnas mir-485, -493, and 543 or control mir six days after induction of differentiation (n=3/3 (females); Mann-Whitney U test; one-tailed; *p=0.05).
8
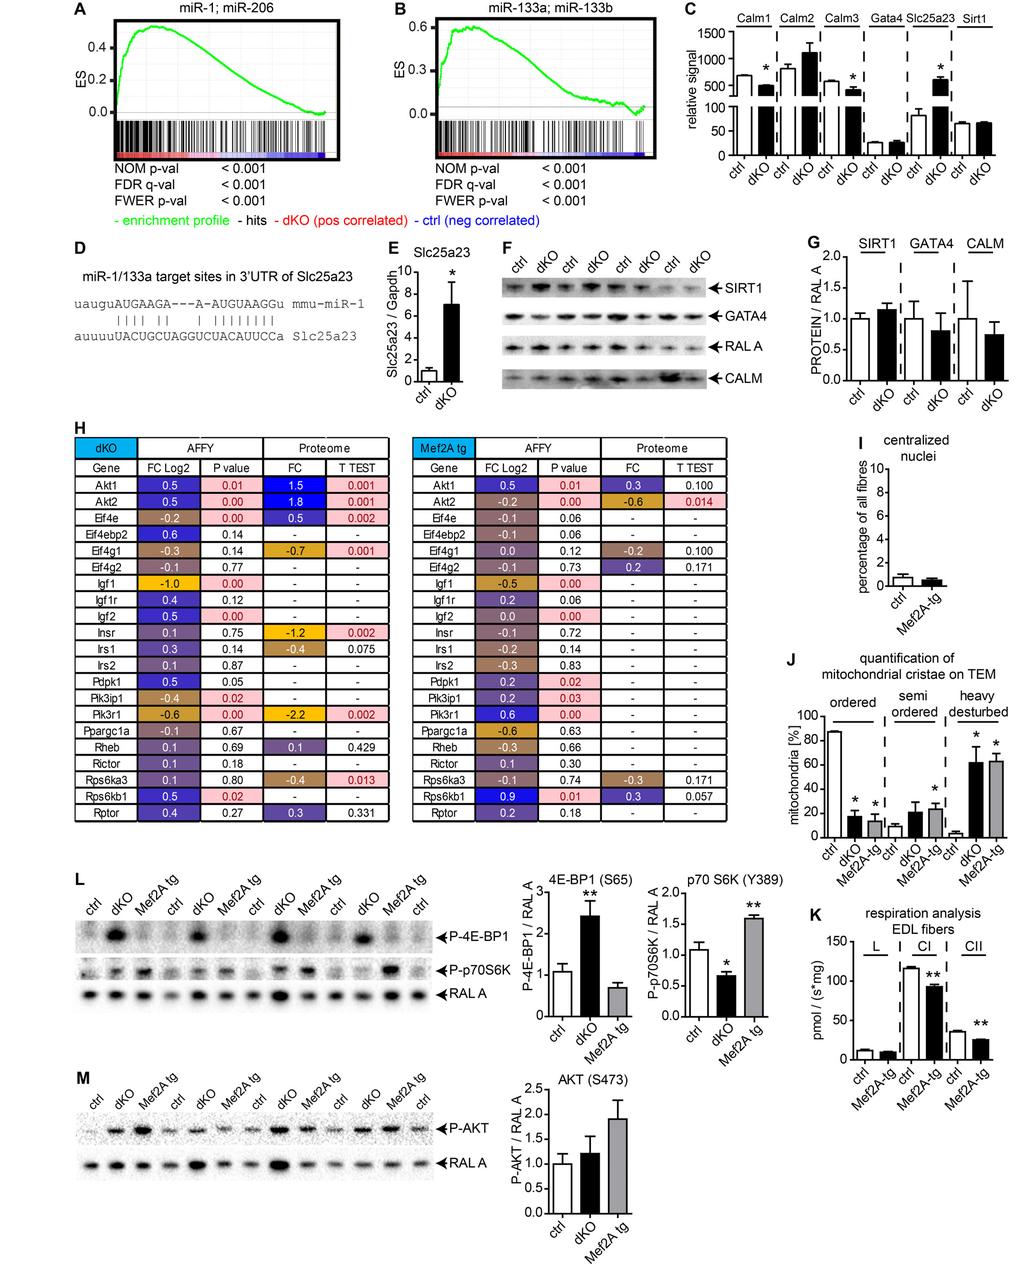
9 Figure S5: Loss of mir-1/133a and up-regulation of Dlk1-Dio3 cluster mirnas do not repress the mtor pathway in skeletal muscle cells Related to Figure 4. (A, B) GO-term enrichment analysis of predicted mir-1 (A) and mir-133a (B) target genes using microarray data obtained from control and mir-1/133a dko TA muscles (n=3/3 (males)). (C) Microarray based analysis (Affymetrix) of target genes and pathways described to be regulated by mir-1/133a or involved in mitochondrial activity (n=3/3 (males), Mann-Whitney U test; *p=0.05) (D) Depiction of a potential mir-1 target site within the 3 UTR of Slc25a23 mrna (microrna.org, release , mirsvr score: , PhastCons score: ). (E) RT-qPCR expression analysis of Slc25a23 mrna in dko and control TA muscles (n=3/3 (males); Mann-Whitney U test; one-tailed; *p=0.05). (F, G) Western blot analysis of target genes and pathways described to be regulated by mir-1/133a (n=3/3, Mann-Whitney U test, not significant). (H) Comparative analysis of changes in the expression of mtor pathway-components in mir-1/133a dko and Mef2A-tg muscles using transcriptome (Affymetrix microarrays) and proteome data (quantitative mass spectrometry), (Affy: n=3/3 (males) (dko/ctrl), n=3/4 (males) (Mef2A-tg/ctrl), Students t-test; Proteome: n=6/6 (males) (mir-1/133a dko/ctrl); n=4/4 (males) (Mef2A-tg/ctrl), Mann-Whitney U test, one-tailed; significant [p<0.05] differences marked in red). (I) Quantification of centralized nuclei (n=3/3 (males); 230 fibers per animal were counted). (J) Quantification of mitochondrial structure by TEM. (Mitochondria counted per animal: ctrl: 52, 62, 22; dko: 55, 66, 63; Mef2A-tg: 44, 40, 65; n=3/3/3 (males); *p=0.05; Mann- Whitney U test; one-tailed). (K) Statistical analysis of oxygraph measurements of isolated EDL fibers for CI (complex I), CII (complex II) and L (leakage respiration). Mean rates and standard deviations are shown (n=5/4 (males); Mann-Whitney U test, two-tailed; **p<0.01,). (L) Western blot analysis of 4E-BP1 (Ser65) and p70 S5K (Thr389) phosphorylation in ctrl, mir-1/133a dko and Mef2A-tg TA muscles using RAL A as loading control (n=5/4/4 (males); Mann-Whitney U test; one-tailed; *p<0.05, **p<0.01). (M) Western blot analysis of AKT phosphorylation in ctrl, mir-1/133a dko and Mef2A-tg TA muscles using RAL A as loading control (n=5/4/4 (males); Mann-Whitney U test).
 Western blot analysis of DNM2 levels in mir-1/133a dko and ctrl TA muscles (A) and in Mef2A-tg and ctrl TA muscles (B), (n=3/3 (males); Mann- Whitney U test; one-tailed; *p=0.05).")
10 Figure S6: Loss of mir-1/133a but not increased expression of Mef2A augments Dynamin-2 expression levels -Related to Figure 5. (A-B) Western blot analysis of DNM2 levels in mir-1/133a dko and ctrl TA muscles (A) and in Mef2A-tg and ctrl TA muscles (B), (n=3/3 (males); Mann- Whitney U test; one-tailed; *p=0.05). (C) Comparative analysis of changes in the expression of mitochondrial coded proteins in mir-1/133a dko and Mef2A-tg muscles using transcriptome (Affymetrix microarrays) and proteome data (quantitative mass spectrometry), (Affy mir-1/133a dko: n=3/3 (males), Mef2A-tg: n=3/4 (males), student s t-test; Proteome: mir-1/133a dko n=6/6, Mef2A-tg n=4/4 (males), Mann-Whitney U test, one-tailed). (D, E) Western blot analysis of cytochrome c oxidase (COX1) and ND1 (NADH dehydrogenase) levels in ctrl, mir-1/133a dko and Mef2A-tg TA muscles (n=5/4/4 (males); Mann-Whitney U test; one-tailed; *p<0.05, **p<0.01).
 Western blot analysis of MEF2A levels in isolated control and Mef2A-tg MuSCs 6d after induction of differentiation (n=4/4 (males); *p<0.05; student s t-test; two-tailed; *p<0.05).")
11 Figure S7: Forced expression of Mef2A increases expression of Dlk1-Dio3 cluster components and disturbs the mitochondrial network in differentiating MuSC -Related to Figure 7. (A, B) Western blot analysis of MEF2A levels in isolated control and Mef2A-tg MuSCs 6d after induction of differentiation (n=4/4 (males); *p<0.05; student s t-test; two-tailed; *p<0.05). (C) Succinate dehydrogenase (SDH) staining of isolated control and Mef2A-tg MuSCs (from male mice) 6d after induction of differentiation. Scale bar 25µm (D) RT-qPCR expression analysis of the Dlk1-Dio3 cluster lncrnas Meg3, Rian and Mirg in isolated control and Mef2A-tg MuSCs 6d after induction of differentiation (n=4/4 (males); Mann-Whitney U test; two-tailed; *p<0.05).
SUPPLEMENTARY INFORMATION
 DOI:.38/ncb3399 a b c d FSP DAPI 5mm mm 5mm 5mm e Correspond to melanoma in-situ Figure a DCT FSP- f MITF mm mm MlanaA melanoma in-situ DCT 5mm FSP- mm mm mm mm mm g melanoma in-situ MITF MlanaA mm mm
Supplementary Figure 1 IMQ-Induced Mouse Model of Psoriasis. IMQ cream was
 Supplementary Figure 1 IMQ-Induced Mouse Model of Psoriasis. IMQ cream was painted on the shaved back skin of CBL/J and BALB/c mice for consecutive days. (a, b) Phenotypic presentation of mouse back skin
SUPPLEMENTARY LEGENDS...
 TABLE OF CONTENTS SUPPLEMENTARY LEGENDS... 2 11 MOVIE S1... 2 FIGURE S1 LEGEND... 3 FIGURE S2 LEGEND... 4 FIGURE S3 LEGEND... 5 FIGURE S4 LEGEND... 6 FIGURE S5 LEGEND... 7 FIGURE S6 LEGEND... 8 FIGURE
Supplemental Figure S1. RANK expression on human lung cancer cells.
 Supplemental Figure S1. RANK expression on human lung cancer cells. (A) Incidence and H-Scores of RANK expression determined from IHC in the indicated primary lung cancer subgroups. The overall expression
Supplementary Figures
 Supplementary Figures Supplementary Figure 1 Characterization of stable expression of GlucB and sshbira in the CT26 cell line (a) Live cell imaging of stable CT26 cells expressing green fluorescent protein
SUPPLEMENTAL DATA AGING, July 2014, Vol. 6 No. 7
 SUPPLEMENTAL DATA Figure S1. Muscle mass changes in different anatomical regions with age. (A) The TA and gastrocnemius muscle showed a significant loss of weight in aged mice (24 month old) compared to
TRAF6 regulates satellite stem cell self-renewal and function during regenerative myogenesis
 The Journal of Clinical Investigation TRAF6 regulates satellite stem cell self-renewal and function during regenerative myogenesis Sajedah M. Hindi and Ashok Kumar Department of Anatomical Sciences and
T H E J O U R N A L O F C E L L B I O L O G Y
 T H E J O U R N A L O F C E L L B I O L O G Y Supplemental material Amelio et al., http://www.jcb.org/cgi/content/full/jcb.201203134/dc1 Figure S1. mir-24 regulates proliferation and by itself induces
SUPPLEMENTARY INFORMATION
 DOI: 10.1038/ncb2607 Figure S1 Elf5 loss promotes EMT in mammary epithelium while Elf5 overexpression inhibits TGFβ induced EMT. (a, c) Different confocal slices through the Z stack image. (b, d) 3D rendering
EPIGENETIC RE-EXPRESSION OF HIF-2α SUPPRESSES SOFT TISSUE SARCOMA GROWTH
 EPIGENETIC RE-EXPRESSION OF HIF-2α SUPPRESSES SOFT TISSUE SARCOMA GROWTH Supplementary Figure 1. Supplementary Figure 1. Characterization of KP and KPH2 autochthonous UPS tumors. a) Genotyping of KPH2
SUPPLEMENTARY FIGURES
 SUPPLEMENTARY FIGURES 1 Supplementary Figure 1, Adult hippocampal QNPs and TAPs uniformly express REST a-b) Confocal images of adult hippocampal mouse sections showing GFAP (green), Sox2 (red), and REST
Supplementary Materials for
 www.sciencesignaling.org/cgi/content/full/8/375/ra41/dc1 Supplementary Materials for Actin cytoskeletal remodeling with protrusion formation is essential for heart regeneration in Hippo-deficient mice
Supplemental Information. Increased 4E-BP1 Expression Protects. against Diet-Induced Obesity and Insulin. Resistance in Male Mice
 Cell Reports, Volume 16 Supplemental Information Increased 4E-BP1 Expression Protects against Diet-Induced Obesity and Insulin Resistance in Male Mice Shih-Yin Tsai, Ariana A. Rodriguez, Somasish G. Dastidar,
Supplementary Table 1 Gene clone ID for ShRNA-mediated gene silencing TNFα downstream signals in in vitro Symbol Gene ID RefSeqID Clone ID
 1 2 3 4 5 6 7 8 9 10 11 12 13 14 15 16 17 18 19 20 21 22 23 24 25 26 27 28 29 30 31 32 33 34 35 36 37 38 39 40 41 42 43 44 Supplementary Table 1 Gene clone ID for ShRNA-mediated gene silencing TNFα downstream
Dynamic Interaction of Stress Granule, DDX3X and IKK-α Mediates Multiple Functions in
 Dynamic Interaction of Stress Granule, and Mediates Multiple Functions in Hepatitis C Virus Infection Véronique Pène, Qisheng Li#, Catherine Sodroski, Ching-Sheng Hsu, T. Jake Liang# Liver Diseases Branch,
Supplementary Figure 1. DJ-1 modulates ROS concentration in mouse skeletal muscle.
 Supplementary Figure 1. DJ-1 modulates ROS concentration in mouse skeletal muscle. (a) mrna levels of Dj1 measured by quantitative RT-PCR in soleus, gastrocnemius (Gastroc.) and extensor digitorum longus
SUPPLEMENTARY FIGURE LEGENDS. atypical adenomatous hyperplasias (AAH); Grade II: adenomas; Grade III: adenocarcinomas;
; Grade II: adenomas; Grade III: adenocarcinomas;") SUPPLEMENTARY FIGURE LEGENDS Supplementary Figure S1: Tumor grades in Ras G12D ; p53 / lung tumors. Representative histology (H&E) of K-Ras G12D ; p53 / lung tumors 13 weeks after tumor initiation. Grade
SUPPLEMENTARY FIGURE LEGENDS Supplementary Figure S1: Tumor grades in Ras G12D ; p53 / lung tumors. Representative histology (H&E) of K-Ras G12D ; p53 / lung tumors 13 weeks after tumor initiation. Grade
SUPPLEMENTARY FIGURES AND TABLES
 SUPPLEMENTARY FIGURES AND TABLES Supplementary Figure S1: CaSR expression in neuroblastoma models. A. Proteins were isolated from three neuroblastoma cell lines and from the liver metastasis of a MYCN-non
Supplementary Figure 1. Efficiency of Mll4 deletion and its effect on T cell populations in the periphery. Nature Immunology: doi: /ni.
 Supplementary Figure 1 Efficiency of Mll4 deletion and its effect on T cell populations in the periphery. Expression of Mll4 floxed alleles (16-19) in naive CD4 + T cells isolated from lymph nodes and
SUPPLEMENTARY INFORMATION
 -. -. SUPPLEMENTARY INFORMATION DOI: 1.1/ncb86 a WAT-1 WAT- BAT-1 BAT- sk-muscle-1 sk-muscle- mir-133b mir-133a mir-6 mir-378 mir-1 mir-85 mir-378 mir-6a mir-18 mir-133a mir- mir- mir-341 mir-196a mir-17
GW(g)/BW(g) GW(g)/BW(g) Con Dex Con Dex. GW(g)/BW(g) Relative mrna levels. Atrogin-1 Murf-1. Atrogin-1 Murf-1. Soleus
/BW(g) GW(g)/BW(g) Con Dex Con Dex. GW(g)/BW(g) Relative mrna levels. Atrogin-1 Murf-1. Atrogin-1 Murf-1. Soleus") a b c GW(g) GW(g) GW(g) 0.20 0.15 0.10 0.05 0.00 0.20 0.15 0.10 0.05 Den * ** GW(g)/BW(g) Den Dex Dex GW(g)/BW(g) d 0.00 Fasting GW(g) e 0.15 Cancer Cachexia f GW(g) 0.10 0.05 0.00 Young ** Old g GW(g)/BW(g)
a b c GW(g) GW(g) GW(g) 0.20 0.15 0.10 0.05 0.00 0.20 0.15 0.10 0.05 Den * ** GW(g)/BW(g) Den Dex Dex GW(g)/BW(g) d 0.00 Fasting GW(g) e 0.15 Cancer Cachexia f GW(g) 0.10 0.05 0.00 Young ** Old g GW(g)/BW(g)
Soft Agar Assay. For each cell pool, 100,000 cells were resuspended in 0.35% (w/v)
") SUPPLEMENTARY MATERIAL AND METHODS Soft Agar Assay. For each cell pool, 100,000 cells were resuspended in 0.35% (w/v) top agar (LONZA, SeaKem LE Agarose cat.5004) and plated onto 0.5% (w/v) basal agar.
SUPPLEMENTARY MATERIAL AND METHODS Soft Agar Assay. For each cell pool, 100,000 cells were resuspended in 0.35% (w/v) top agar (LONZA, SeaKem LE Agarose cat.5004) and plated onto 0.5% (w/v) basal agar.
Supplementary Figure 1. AdipoR1 silencing and overexpression controls. (a) Representative blots (upper and lower panels) showing the AdipoR1 protein
 Representative blots (upper and lower panels) showing the AdipoR1 protein") Supplementary Figure 1. AdipoR1 silencing and overexpression controls. (a) Representative blots (upper and lower panels) showing the AdipoR1 protein content relative to GAPDH in two independent experiments.
Supplementary Figure 1. AdipoR1 silencing and overexpression controls. (a) Representative blots (upper and lower panels) showing the AdipoR1 protein content relative to GAPDH in two independent experiments.
Supplementary Table 1. The primers used for quantitative RT-PCR. Gene name Forward (5 > 3 ) Reverse (5 > 3 )
 Reverse (5 > 3 )") 770 771 Supplementary Table 1. The primers used for quantitative RT-PCR. Gene name Forward (5 > 3 ) Reverse (5 > 3 ) Human CXCL1 GCGCCCAAACCGAAGTCATA ATGGGGGATGCAGGATTGAG PF4 CCCCACTGCCCAACTGATAG TTCTTGTACAGCGGGGCTTG
770 771 Supplementary Table 1. The primers used for quantitative RT-PCR. Gene name Forward (5 > 3 ) Reverse (5 > 3 ) Human CXCL1 GCGCCCAAACCGAAGTCATA ATGGGGGATGCAGGATTGAG PF4 CCCCACTGCCCAACTGATAG TTCTTGTACAGCGGGGCTTG
a) Primary cultures derived from the pancreas of an 11-week-old Pdx1-Cre; K-MADM-p53
 Primary cultures derived from the pancreas of an 11-week-old Pdx1-Cre; K-MADM-p53") 1 2 3 4 5 6 7 8 9 10 Supplementary Figure 1. Induction of p53 LOH by MADM. a) Primary cultures derived from the pancreas of an 11-week-old Pdx1-Cre; K-MADM-p53 mouse revealed increased p53 KO/KO (green,
1 2 3 4 5 6 7 8 9 10 Supplementary Figure 1. Induction of p53 LOH by MADM. a) Primary cultures derived from the pancreas of an 11-week-old Pdx1-Cre; K-MADM-p53 mouse revealed increased p53 KO/KO (green,
SUPPLEMENTARY INFORMATION
 doi:10.1038/nature12652 Supplementary Figure 1. PRDM16 interacts with endogenous EHMT1 in brown adipocytes. Immunoprecipitation of PRDM16 complex by flag antibody (M2) followed by Western blot analysis
Supplementary Table 1.
 Supplementary Table 1. Expression of genes involved in brown fat differentiation in WAT of db/db mice treated with HDAC inhibitors. Data are expressed as fold change (FC) versus control. symbol FC SAHA
Nature Structural & Molecular Biology: doi: /nsmb Supplementary Figure 1. Generation and validation of mtef4-knockout mice.
 Supplementary Figure 1 Generation and validation of mtef4-knockout mice. (a) Alignment of EF4 (E. coli) with mouse, yeast and human EF4. (b) Domain structures of mouse mtef4 compared to those of EF4 (E.
Supplemental Figure S1. PLAG1 kidneys contain fewer glomeruli (A) Quantitative PCR for Igf2 and PLAG1 in whole kidneys taken from mice at E15.
 Quantitative PCR for Igf2 and PLAG1 in whole kidneys taken from mice at E15.") Supplemental Figure S1. PLAG1 kidneys contain fewer glomeruli (A) Quantitative PCR for Igf2 and PLAG1 in whole kidneys taken from mice at E15.5, E18.5, P4, and P8. Values shown are means from four technical
Supplemental Figure S1. PLAG1 kidneys contain fewer glomeruli (A) Quantitative PCR for Igf2 and PLAG1 in whole kidneys taken from mice at E15.5, E18.5, P4, and P8. Values shown are means from four technical
Supplementary Fig. S1. Schematic diagram of minigenome segments.
 open reading frame 1565 (segment 5) 47 (-) 3 5 (+) 76 101 125 149 173 197 221 246 287 open reading frame 890 (segment 8) 60 (-) 3 5 (+) 172 Supplementary Fig. S1. Schematic diagram of minigenome segments.
SUPPLEMENTARY INFORMATION
 doi:10.1038/nature12215 Supplementary Figure 1. The effects of full and dissociated GR agonists in supporting BFU-E self-renewal divisions. BFU-Es were cultured in self-renewal medium with indicated GR
Supplemental Materials. STK16 regulates actin dynamics to control Golgi organization and cell cycle
 Supplemental Materials STK16 regulates actin dynamics to control Golgi organization and cell cycle Juanjuan Liu 1,2,3, Xingxing Yang 1,3, Binhua Li 1, Junjun Wang 1,2, Wenchao Wang 1, Jing Liu 1, Qingsong
TEB. Id4 p63 DAPI Merge. Id4 CK8 DAPI Merge
 a Duct TEB b Id4 p63 DAPI Merge Id4 CK8 DAPI Merge c d e Supplementary Figure 1. Identification of Id4-positive MECs and characterization of the Comma-D model. (a) IHC analysis of ID4 expression in the
Supplementary Figure 1. EC-specific Deletion of Snail1 Does Not Affect EC Apoptosis. (a,b) Cryo-sections of WT (a) and Snail1 LOF (b) embryos at
 Cryo-sections of WT (a) and Snail1 LOF (b) embryos at") Supplementary Figure 1. EC-specific Deletion of Snail1 Does Not Affect EC Apoptosis. (a,b) Cryo-sections of WT (a) and Snail1 LOF (b) embryos at E10.5 were double-stained for TUNEL (red) and PECAM-1 (green).
Supplementary Figure 1. EC-specific Deletion of Snail1 Does Not Affect EC Apoptosis. (a,b) Cryo-sections of WT (a) and Snail1 LOF (b) embryos at E10.5 were double-stained for TUNEL (red) and PECAM-1 (green).
Nature Structural & Molecular Biology: doi: /nsmb Supplementary Figure 1. Differential expression of mirnas from the pri-mir-17-92a locus.
 Supplementary Figure 1 Differential expression of mirnas from the pri-mir-17-92a locus. (a) The mir-17-92a expression unit in the third intron of the host mir-17hg transcript. (b,c) Impact of knockdown
Supplementary Figure 1.TRIM33 binds β-catenin in the nucleus. a & b, Co-IP of endogenous TRIM33 with β-catenin in HT-29 cells (a) and HEK 293T cells
 and HEK 293T cells") Supplementary Figure 1.TRIM33 binds β-catenin in the nucleus. a & b, Co-IP of endogenous TRIM33 with β-catenin in HT-29 cells (a) and HEK 293T cells (b). TRIM33 was immunoprecipitated, and the amount of
Supplementary Figure 1.TRIM33 binds β-catenin in the nucleus. a & b, Co-IP of endogenous TRIM33 with β-catenin in HT-29 cells (a) and HEK 293T cells (b). TRIM33 was immunoprecipitated, and the amount of
Nature Medicine: doi: /nm.4322
 1 2 3 4 5 6 7 8 9 10 11 Supplementary Figure 1. Predicted RNA structure of 3 UTR and sequence alignment of deleted nucleotides. (a) Predicted RNA secondary structure of ZIKV 3 UTR. The stem-loop structure
Supplementary Fig. 1. GPRC5A post-transcriptionally down-regulates EGFR expression. (a) Plot of the changes in steady state mrna levels versus
 Plot of the changes in steady state mrna levels versus") Supplementary Fig. 1. GPRC5A post-transcriptionally down-regulates EGFR expression. (a) Plot of the changes in steady state mrna levels versus changes in corresponding proteins between wild type and Gprc5a-/-
Supplementary Fig. 1. GPRC5A post-transcriptionally down-regulates EGFR expression. (a) Plot of the changes in steady state mrna levels versus changes in corresponding proteins between wild type and Gprc5a-/-
Supplementary Figure 1
 VO (ml kg - min - ) VCO (ml kg - min - ) Respiratory exchange ratio Energy expenditure (cal kg - min - ) Locomotor activity (x count) Body temperature ( C) Relative mrna expression TA Sol EDL PT Heart
(A) RT-PCR for components of the Shh/Gli pathway in normal fetus cell (MRC-5) and a
 RT-PCR for components of the Shh/Gli pathway in normal fetus cell (MRC-5) and a") Supplementary figure legends Supplementary Figure 1. Expression of Shh signaling components in a panel of gastric cancer. (A) RT-PCR for components of the Shh/Gli pathway in normal fetus cell (MRC-5) and
Supplementary figure legends Supplementary Figure 1. Expression of Shh signaling components in a panel of gastric cancer. (A) RT-PCR for components of the Shh/Gli pathway in normal fetus cell (MRC-5) and
Figure S1. (A) Schematic diagram of dnrar transgene allele. (B) X-Gal staining of testis from
 Schematic diagram of dnrar transgene allele. (B) X-Gal staining of testis from") Figure S1. (A) Schematic diagram of dnrar transgene allele. (B) X-Gal staining of testis from germ cell mutants (dnrar flox/flox, Stra8-Cre +, RARElacZ) (A ), controls (dnrar flox/flox, RARElacZ) (B ),
Figure S1. (A) Schematic diagram of dnrar transgene allele. (B) X-Gal staining of testis from germ cell mutants (dnrar flox/flox, Stra8-Cre +, RARElacZ) (A ), controls (dnrar flox/flox, RARElacZ) (B ),
McWilliams et al., http :// /cgi /content /full /jcb /DC1
 Supplemental material JCB McWilliams et al., http ://www.jcb.org /cgi /content /full /jcb.201603039 /DC1 THE JOURNAL OF CELL BIOLOGY Figure S1. In vitro characterization of mito-qc. (A and B) Analysis
Supplementary Figure S1. Venn diagram analysis of mrna microarray data and mirna target analysis. (a) Western blot analysis of T lymphoblasts (CLS)
 Western blot analysis of T lymphoblasts (CLS)") Supplementary Figure S1. Venn diagram analysis of mrna microarray data and mirna target analysis. (a) Western blot analysis of T lymphoblasts (CLS) and their exosomes (EXO) in resting (REST) and activated
Supplementary Figure S1. Venn diagram analysis of mrna microarray data and mirna target analysis. (a) Western blot analysis of T lymphoblasts (CLS) and their exosomes (EXO) in resting (REST) and activated
Supplementary Figure 1: si-craf but not si-braf sensitizes tumor cells to radiation.
 Supplementary Figure 1: si-craf but not si-braf sensitizes tumor cells to radiation. (a) Embryonic fibroblasts isolated from wildtype (WT), BRAF -/-, or CRAF -/- mice were irradiated (6 Gy) and DNA damage
mir-7a regulation of Pax6 in neural stem cells controls the spatial origin of forebrain dopaminergic neurons
 Supplemental Material mir-7a regulation of Pax6 in neural stem cells controls the spatial origin of forebrain dopaminergic neurons Antoine de Chevigny, Nathalie Coré, Philipp Follert, Marion Gaudin, Pascal
Supplementary Table 1. List of primers used in this study
 Supplementary Table 1. List of primers used in this study Gene Forward primer Reverse primer Rat Met 5 -aggtcgcttcatgcaggt-3 5 -tccggagacacaggatgg-3 Rat Runx1 5 -cctccttgaaccactccact-3 5 -ctggatctgcctggcatc-3
E3 ligase TRIM72 negatively regulates myogenesis by IRS-1 ubiquitination
 E3 ligase negatively regulates myogenesis by IRS-1 ubiquitination Young-Gyu Ko College of Life Science and Biotechnology Korea University MyHC immunofluorescence Lipid rafts are plasma membrane compartments
Supplemental Figure 1. (A) The localization of Cre DNA recombinase in the testis of Cyp19a1-Cre mice was detected by immunohistchemical analyses
 The localization of Cre DNA recombinase in the testis of Cyp19a1-Cre mice was detected by immunohistchemical analyses") Supplemental Figure 1. (A) The localization of Cre DNA recombinase in the testis of Cyp19a1-Cre mice was detected by immunohistchemical analyses using an anti-cre antibody; testes at 1 week (left panel),
Supplemental Figure 1. (A) The localization of Cre DNA recombinase in the testis of Cyp19a1-Cre mice was detected by immunohistchemical analyses using an anti-cre antibody; testes at 1 week (left panel),
Supplementary Figure 1.
 Supplementary Figure 1. Increased β cell mass and islet diameter in βtsc2 -/- mice up to 35 weeks A: Reconstruction of multiple anti-insulin immunofluorescence images showing differences in β cell mass
A Normal Exencephaly Craniora- Spina bifida Microcephaly chischisis. Midbrain Forebrain/ Forebrain/ Hindbrain Spinal cord Hindbrain Hindbrain
 A Normal Exencephaly Craniora- Spina bifida Microcephaly chischisis NTD Number of embryos % among NTD Embryos Exencephaly 52 74.3% Craniorachischisis 6 8.6% Spina bifida 5 7.1% Microcephaly 7 1% B Normal
Scaffold function of long noncoding RNA HOTAIR in protein ubiquitination
 Yoon et al, page Scaffold function of long noncoding RNA HOTAIR in protein ubiquitination Je-Hyun Yoon,, Kotb Abdelmohsen, Jiyoung Kim, Xiaoling Yang, Jennifer L. Martindale, Kumiko Tominaga-Yamanaka,
Supplemental Figure 1. Intracranial transduction of a modified ptomo lentiviral vector in the mouse
 Supplemental figure legends Supplemental Figure 1. Intracranial transduction of a modified ptomo lentiviral vector in the mouse hippocampus targets GFAP-positive but not NeuN-positive cells. (A) Stereotaxic
SUPPLEMENTARY INFORMATION
 DOI: 10.1038/ncb3461 In the format provided by the authors and unedited. Supplementary Figure 1 (associated to Figure 1). Cpeb4 gene-targeted mice develop liver steatosis. a, Immunoblot displaying CPEB4
hexahistidine tagged GRP78 devoid of the KDEL motif (GRP78-His) on SDS-PAGE. This
 on SDS-PAGE. This") SUPPLEMENTAL FIGURE LEGEND Fig. S1. Generation and characterization of. (A) Coomassie staining of soluble hexahistidine tagged GRP78 devoid of the KDEL motif (GRP78-His) on SDS-PAGE. This protein was expressed
SUPPLEMENTAL FIGURE LEGEND Fig. S1. Generation and characterization of. (A) Coomassie staining of soluble hexahistidine tagged GRP78 devoid of the KDEL motif (GRP78-His) on SDS-PAGE. This protein was expressed
Supplementary Figure 1. Confocal immunofluorescence showing mitochondrial translocation of Drp1. Cardiomyocytes treated with H 2 O 2 were prestained
 Supplementary Figure 1. Confocal immunofluorescence showing mitochondrial translocation of Drp1. Cardiomyocytes treated with H 2 O 2 were prestained with MitoTracker (red), then were immunostained with
Supplemental Information. Aryl Hydrocarbon Receptor Controls. Monocyte Differentiation. into Dendritic Cells versus Macrophages
 Immunity, Volume 47 Supplemental Information Aryl Hydrocarbon Receptor Controls Monocyte Differentiation into Dendritic Cells versus Macrophages Christel Goudot, Alice Coillard, Alexandra-Chloé Villani,
Supplementary Figure 1
 Supplementary Figure 1 YAP negatively regulates IFN- signaling. (a) Immunoblot analysis of Yap knockdown efficiency with sh-yap (#1 to #4 independent constructs) in Raw264.7 cells. (b) IFN- -Luc and PRDs
Supplementary Table 3. 3 UTR primer sequences. Primer sequences used to amplify and clone the 3 UTR of each indicated gene are listed.
 Supplemental Figure 1. DLKI-DIO3 mirna/mrna complementarity. Complementarity between the indicated DLK1-DIO3 cluster mirnas and the UTR of SOX2, SOX9, HIF1A, ZEB1, ZEB2, STAT3 and CDH1with mirsvr and PhastCons
Supplementary Figures
 Supplementary Figures Supplementary Figure 1. Confirmation of Dnmt1 conditional knockout out mice. a, Representative images of sorted stem (Lin - CD49f high CD24 + ), luminal (Lin - CD49f low CD24 + )
AP VP DLP H&E. p-akt DLP
 A B AP VP DLP H&E AP AP VP DLP p-akt wild-type prostate PTEN-null prostate Supplementary Fig. 1. Targeted deletion of PTEN in prostate epithelium resulted in HG-PIN in all three lobes. (A) The anatomy
Supplemental Information
 Supplemental Information Tobacco-specific Carcinogen Induces DNA Methyltransferases 1 Accumulation through AKT/GSK3β/βTrCP/hnRNP-U in Mice and Lung Cancer patients Ruo-Kai Lin, 1 Yi-Shuan Hsieh, 2 Pinpin
Supplemental Information. Myocardial Polyploidization Creates a Barrier. to Heart Regeneration in Zebrafish
 Developmental Cell, Volume 44 Supplemental Information Myocardial Polyploidization Creates a Barrier to Heart Regeneration in Zebrafish Juan Manuel González-Rosa, Michka Sharpe, Dorothy Field, Mark H.
marker. DAPI labels nuclei. Flies were 20 days old. Scale bar is 5 µm. Ctrl is
 Supplementary Figure 1. (a) Nos is detected in glial cells in both control and GFAP R79H transgenic flies (arrows), but not in deletion mutant Nos Δ15 animals. Repo is a glial cell marker. DAPI labels
fl/+ KRas;Atg5 fl/+ KRas;Atg5 fl/fl KRas;Atg5 fl/fl KRas;Atg5 Supplementary Figure 1. Gene set enrichment analyses. (a) (b)
 (b)") KRas;At KRas;At KRas;At KRas;At a b Supplementary Figure 1. Gene set enrichment analyses. (a) GO gene sets (MSigDB v3. c5) enriched in KRas;Atg5 fl/+ as compared to KRas;Atg5 fl/fl tumors using gene set
KRas;At KRas;At KRas;At KRas;At a b Supplementary Figure 1. Gene set enrichment analyses. (a) GO gene sets (MSigDB v3. c5) enriched in KRas;Atg5 fl/+ as compared to KRas;Atg5 fl/fl tumors using gene set
Metabolic ER stress and inflammation in white adipose tissue (WAT) of mice with dietary obesity.
 of mice with dietary obesity.") Supplementary Figure 1 Metabolic ER stress and inflammation in white adipose tissue (WAT) of mice with dietary obesity. Male C57BL/6J mice were fed a normal chow (NC, 10% fat) or a high-fat diet (HFD,
Supplementary Figure 1 Metabolic ER stress and inflammation in white adipose tissue (WAT) of mice with dietary obesity. Male C57BL/6J mice were fed a normal chow (NC, 10% fat) or a high-fat diet (HFD,
Supplementary Fig. 1. Delivery of mirnas via Red Fluorescent Protein.
 prfp-vector RFP Exon1 Intron RFP Exon2 prfp-mir-124 mir-93/124 RFP Exon1 Intron RFP Exon2 Untransfected prfp-vector prfp-mir-93 prfp-mir-124 Supplementary Fig. 1. Delivery of mirnas via Red Fluorescent
PepT1 Expression Helps Maintain Intestinal Homeostasis by Mediating the Differential. Expression of mirnas along the Crypt-Villus Axis
 PepT Expression Helps Maintain Intestinal Homeostasis by Mediating the Differential Expression of mirnas along the Crypt-Villus Axis Yuchen Zhang,*, Emilie Viennois, Mingzhen Zhang, Bo Xiao, 3, Moon Kwon
Probe. Hind III Q,!?R'!! /0!!!!D1"?R'! vector. Homologous recombination
 Supple-Zhang Page 1 Wild-type locus Targeting construct Targeted allele Exon Exon3 Exon Probe P1 P P3 FRT FRT loxp loxp neo vector amh I Homologous recombination neo P1 P P3 FLPe recombination Q,!?R'!!
Profiles of gene expression & diagnosis/prognosis of cancer. MCs in Advanced Genetics Ainoa Planas Riverola
 Profiles of gene expression & diagnosis/prognosis of cancer MCs in Advanced Genetics Ainoa Planas Riverola Gene expression profiles Gene expression profiling Used in molecular biology, it measures the
Figure 1. Dnmt3b expression in murine and human knee joint cartilage. (A) Representative images
 Representative images") Figure Legends Figure. expression in murine and human knee joint cartilage. () Representative images showing that Dnmta is not expressed in chondrocytes from mo W articular cartilage [Dnmta expression
Figure Legends Figure. expression in murine and human knee joint cartilage. () Representative images showing that Dnmta is not expressed in chondrocytes from mo W articular cartilage [Dnmta expression
Protein SD Units (P-value) Cluster order
 Cluster order") SUPPLEMENTAL TABLE AND FIGURES Table S1. Signature Phosphoproteome of CD22 E12 Transgenic Mouse BPL Cells. T-test vs. Other Protein SD Units (P-value) Cluster order ATPase (Ab-16) 1.41 0.000880 1 mtor
SUPPLEMENTAL TABLE AND FIGURES Table S1. Signature Phosphoproteome of CD22 E12 Transgenic Mouse BPL Cells. T-test vs. Other Protein SD Units (P-value) Cluster order ATPase (Ab-16) 1.41 0.000880 1 mtor
Supplementary Figure 1 Induction of cellular senescence and isolation of exosome. a to c, Pre-senescent primary normal human diploid fibroblasts
 Supplementary Figure 1 Induction of cellular senescence and isolation of exosome. a to c, Pre-senescent primary normal human diploid fibroblasts (TIG-3 cells) were rendered senescent by either serial passage
Supplemental Figure 1. Western blot analysis indicated that MIF was detected in the fractions of
 Supplemental Figure Legends Supplemental Figure 1. Western blot analysis indicated that was detected in the fractions of plasma membrane and cytosol but not in nuclear fraction isolated from Pkd1 null
Supplementary Materials for
 www.sciencesignaling.org/cgi/content/full/7/308/ra4/dc1 Supplementary Materials for Antipsychotics Activate mtorc1-dependent Translation to Enhance Neuronal Morphological Complexity Heather Bowling, Guoan
Supplementary Materials for
 www.sciencesignaling.org/cgi/content/full/2/1/ra81/dc1 Supplementary Materials for Delivery of MicroRNA-126 by Apoptotic Bodies Induces CXCL12- Dependent Vascular Protection Alma Zernecke,* Kiril Bidzhekov,
SUPPLEMENTARY INFORMATION
 DOI:.38/ncb2822 a MTC02 FAO cells EEA1 b +/+ MEFs /DAPI -/- MEFs /DAPI -/- MEFs //DAPI c HEK 293 cells WCE N M C P AKT TBC1D7 Lamin A/C EEA1 VDAC d HeLa cells WCE N M C P AKT Lamin A/C EEA1 VDAC Figure
Fig. S1. Upregulation of K18 and K14 mrna levels during ectoderm specification of hescs. Quantitative real-time PCR analysis of mrna levels of OCT4
 Fig. S1. Upregulation of K18 and K14 mrna levels during ectoderm specification of hescs. Quantitative real-time PCR analysis of mrna levels of OCT4 (n=3 independent differentiation experiments for each
a) List of KMTs targeted in the shrna screen. The official symbol, KMT designation,
 List of KMTs targeted in the shrna screen. The official symbol, KMT designation,") Supplementary Information Supplementary Figures Supplementary Figure 1. a) List of KMTs targeted in the shrna screen. The official symbol, KMT designation, gene ID and specifities are provided. Those highlighted
Supplementary Information Supplementary Figures Supplementary Figure 1. a) List of KMTs targeted in the shrna screen. The official symbol, KMT designation, gene ID and specifities are provided. Those highlighted
Supplementary Figure 1. A. Bar graph representing the expression levels of the 19 indicated genes in the microarrays analyses comparing human lung
 Supplementary Figure 1. A. Bar graph representing the expression levels of the 19 indicated genes in the microarrays analyses comparing human lung immortalized broncho-epithelial cells (AALE cells) expressing
Supplementary Figure 1. The mir-182 binding site of SMAD7 3 UTR and the. mutated sequence.
 Supplementary Figure 1. The mir-182 binding site of SMAD7 3 UTR and the mutated sequence. 1 Supplementary Figure 2. Expression of mir-182 and SMAD7 in various cell lines. (A) Basal levels of mir-182 expression
Nature Immunology: doi: /ni Supplementary Figure 1. Gene expression profile of CD4 + T cells and CTL responses in Bcl6-deficient mice.
 Supplementary Figure 1 Gene expression profile of CD4 + T cells and CTL responses in Bcl6-deficient mice. (a) Gene expression profile in the resting CD4 + T cells were analyzed by an Affymetrix microarray
Nature Immunology doi: /ni.3268
 Supplementary Figure 1 Loss of Mst1 and Mst2 increases susceptibility to bacterial sepsis. (a) H&E staining of colon and kidney sections from wild type and Mst1 -/- Mst2 fl/fl Vav-Cre mice. Scale bar,
SUPPLEMENTARY INFORMATION
 SUPPLEMENTARY INFORMATION Supplementary Figure 1. Generation of a conditional allele of the Kindlin-2 gene. (A) A restriction map of the relevant genomic region of Kindlin-2 (top), the targeting construct
Supporting Information Table of Contents
 Supporting Information Table of Contents Supporting Information Figure 1 Page 2 Supporting Information Figure 2 Page 4 Supporting Information Figure 3 Page 5 Supporting Information Figure 4 Page 6 Supporting
Name Animal source Vendor Cat # Dilutions
 Supplementary data Table S1. Primary and Secondary antibody sources Devi et al, TXNIP in mitophagy A. Primary Antibodies Name Animal source Vendor Cat # Dilutions 1. TXNIP mouse MBL KO205-2 1:2000 (WB)
HSP72 HSP90. Quadriceps Muscle. MEF2c MyoD1 MyoG Myf5 Hsf1 Hsp GLUT4/GAPDH (AU)
") Supplementary Figure 1. Impaired insulin action in HSP72 deficient muscle and myotubes in culture cannot be explained by altered myogenesis or reduced total GLUT4 expression. Genes associated with myogenesis
Supplementary Figure 1. Impaired insulin action in HSP72 deficient muscle and myotubes in culture cannot be explained by altered myogenesis or reduced total GLUT4 expression. Genes associated with myogenesis
SUPPLEMENTARY DATA. Supplementary Table 1. Primer sequences for qrt-pcr
 Supplementary Table 1. Primer sequences for qrt-pcr Gene PRDM16 UCP1 PGC1α Dio2 Elovl3 Cidea Cox8b PPARγ AP2 mttfam CyCs Nampt NRF1 16s-rRNA Hexokinase 2, intron 9 β-actin Primer Sequences 5'-CCA CCA GCG
SUPPLEMENTARY INFORMATION
 DOI: 10.1038/ncb2638 Figure S1 Morphological characteristics of fetal testes and ovaries from 6.5-20 developmental weeks. Representative images of Hematoxylin and Eosin staining of testes and ovaries over
An HMGA2-IGF2BP2 Axis Regulates Myoblast Proliferation and Myogenesis
 Please cite this article in press as: Li et al., An HMGA2-IGF2BP2 Axis Regulates Myoblast Proliferation and Myogenesis, Developmental Cell (2012), http://dx.doi.org/10.1016/j.devcel.2012.10.019 Developmental
Supplementary Figure 1. DNA methylation of the adiponectin promoter R1, Pparg2, and Tnfa promoter in adipocytes is not affected by obesity.
 Supplementary Figure 1. DNA methylation of the adiponectin promoter R1, Pparg2, and Tnfa promoter in adipocytes is not affected by obesity. (a) Relative amounts of adiponectin, Ppar 2, C/ebp, and Tnf mrna
Supplementary Information
 Supplementary Information Supplementary Figure 1! a! b! Nfatc1!! Nfatc1"! P1! P2! pa1! pa2! ex1! ex2! exons 3-9! ex1! ex11!!" #" Nfatc1A!!" Nfatc1B! #"!" Nfatc1C! #" DN1! DN2! DN1!!A! #A!!B! #B!!C! #C!!A!
Supplementary Figure 1
 Combination index (CI) Supplementary Figure 1 2. 1.5 1. Ishikawa AN3CA Nou-1 Hec-18.5...2.4.6.8 1. Fraction affected (Fa) Supplementary Figure 1. The synergistic effect of PARP inhibitor and PI3K inhibitor
Supplementary Figure 1
 Supplementary Figure 1 a Percent of body weight! (%) 4! 3! 1! Epididymal fat Subcutaneous fat Liver SD Percent of body weight! (%) ** 3! 1! SD Percent of body weight! (%) 6! 4! SD ** b Blood glucose (mg/dl)!
Supplementary Figure S1 Expression of mir-181b in EOC (A) Kaplan-Meier
 Kaplan-Meier") Supplementary Figure S1 Expression of mir-181b in EOC (A) Kaplan-Meier curves for progression-free survival (PFS) and overall survival (OS) in a cohort of patients (N=52) with stage III primary ovarian
Supplementary Figure S1 Expression of mir-181b in EOC (A) Kaplan-Meier curves for progression-free survival (PFS) and overall survival (OS) in a cohort of patients (N=52) with stage III primary ovarian
Supplementary. limb. bars
 Figure 1. CD163 -/- mice exhibit a similar phenotype ass WT mice in the absence of ischemic injury. a, Laser Doppler analysiss with perfusion quantitation at baseline (n= =10 per group). b, Immunostaining
SUPPLEMENTARY INFORMATION
 DOI: 10.1038/ncb3200 Supplementary Figure 1 Expression analysis of stomach markers in gutlike structure. (a) Differentiation scheme of gut-like structure formation from embryonic stem cells. (b) RT-PCR
pplementary Figur Supplementary Figure 1. a.
 pplementary Figur Supplementary Figure 1. a. Quantification by RT-qPCR of YFV-17D and YFV-17D pol- (+) RNA in the supernatant of cultured Huh7.5 cells following viral RNA electroporation of respective
Supporting Information
 Supporting Information M1 macrophage-derived nanovesicles potentiate the anticancer efficacy of immune checkpoint inhibitors Yeon Woong Choo, 1, Mikyung Kang, 2, Han Young Kim, 1 Jin Han, 1 Seokyung Kang,
Supplemental Information. NRF2 Is a Major Target of ARF. in p53-independent Tumor Suppression
 Molecular Cell, Volume 68 Supplemental Information NRF2 Is a Major Target of ARF in p53-independent Tumor Suppression Delin Chen, Omid Tavana, Bo Chu, Luke Erber, Yue Chen, Richard Baer, and Wei Gu Figure
SUPPLEMENTARY INFORMATION
 DOI: 1.138/ncb3355 a S1A8 + cells/ total.1.8.6.4.2 b S1A8/?-Actin c % T-cell proliferation 3 25 2 15 1 5 T cells Supplementary Figure 1 Inter-tumoral heterogeneity of MDSC accumulation in mammary tumor