MOLECULAR CHARACTERIZATION OF HUMAN HOMOLOGS OF YEAST MOB
|
|
|
- Erica White
- 6 years ago
- Views:
Transcription
1 MOLECULAR CHARACTERIZATION OF HUMAN HOMOLOGS OF YEAST MOB by Annabelle Tsin Man Chow A thesis submitted to the Department of Pathology and Molecular Medicine in conformity with the requirements for the degree of Master of Science Queen s University Kingston, Ontario, Canada (September, 2008) Copyright Annabelle Tsin Man Chow, 2008
2 ABSTRACT MOB (Mps One Binder) is a conserved gene family found in all major kingdoms. The MOB genes are essential components acting in mitotic exit and cytokinesis in both budding and fission yeasts. They are further identified as tumor suppressors in Drosophila (D.) melanogaster. Recently, they are found to be involved in the emerging Drosophila Hippo-LATS tumor suppressor pathway. Seven human homologs of yeast MOB (hmob1a, 1B, 2A, 2B, 3, 4, 5) have been discovered. The hmob1b is the gene that has been extensively studied and is reported to be required for the activation of LATS (Large Tumor Suppressor)/NDR (Nuclear Dbf2-related) protein kinase family, however, the functional significance of the gene remains unknown. This study is the first to elucidate the biological and biochemical functions of all seven human MOBs. By examining hmob mrna expression in various human tissues, we found that the hmobs have exhibited different expression patterns. We also investigated the subcellular localization of hmobs during interphase through immunofluorescent analysis. While hmob2a is localized in the cytoplasm, hmob4 is exclusively found in the nucleus. All of the other hmobs are localized in both cytoplasm and nucleus. Furthermore, we identified hmob1a and hmob1b as the main binding partners of LATS and NDR in vitro. Additionally, we successfully identified a region on hmob1b for the interaction with LATS or NDR and determined the crucial residue that is responsible for the binding of LATS2 with hmob1b. Most significantly, we found that over-expression of hmob1b in human cancer cells inhibits cell proliferation and induces cell death. Moreover, hmob1b when targeted to the plasma membrane dramatically enhances the ii
3 phenotype. Conversely, small interfering (si) RNA-mediated suppression of either endogenous hmob1a or hmob1b causes increased cell proliferation, whereas suppression of both hmob1a and hmob1b demonstrates a more significant enhancement in tumor cell growth. Moreover, co-expression of both LATS and hmob1b targeted to the plasma membrane completely abolishes cell proliferation. Our findings provide convincing evidence that hmob1a and hmob1b function as negative regulators of cell proliferation and as pro-apoptotic proteins. Understanding hmobs functions in the cell and their possible role in tumorigenesis can provide important information for the diagnosis and treatment of human cancers. iii
4 ACKNOWLEDGEMENTS I would like to express my sincere gratitude to my supervisor Dr. Xiaolong Yang for his helpful guidance, support and encouragement over the past two years. Thanks to my supervisory committee members Dr. Lois Mulligan, Dr. Harriet Feilotter and Dr. Peter Greer for their helpful suggestions and advice. I would also like to thank everyone in the Yang Lab especially Yawei Hao, Stacy Visser, Dulcie Lai, and Polly Ho for their valuable technical expertise, friendship and moral support. Thank you as well to our lab past summer student, Babak Rashidi, and our two past PATH 499 students, Alex Chun and Kevin Cheung, who taught me so much while I was teaching them. Thank you to Matt Gordon for his technical support in FACS analysis. Finally, and most of all, I would like to thank my parents and my friends especially Alvin Cheung for their love, support, encouragement and faith in my abilities. iv
5 CONTRIBUTIONS I gratefully acknowledge Dr. Didier Trono (Ecole Polytechnique Fédérale de Lausanne, Switzerland) for providing the WPI lentivirus vectors, and our lab technician Yawei Hao for cloning of hmobs into HA (hemagglutinin)-pcdna3 and pgex4t1 vectors, and setting up conditions for hmob-gst-fusion protein purification of all different hmobs. v
6 TABLE OF CONTENTS ABSTRACT... ii ACKNOWLEDGEMENTS... iv TABLE OF CONTENTS... vi LIST OF FIGURES... ix LIST OF TABLES... xi LIST OF ABBREVIATIONS... xii CHAPTER 1 INTRODUCTION Cancer Tumor Suppressor Gene Concept of the Tumor Suppressor Gene Tumor Suppressor Genes in Cancer Function of Tumor Suppressor Genes Large Tumor Suppressor (LATS)/Nuclear Dbf2-related (NDR) Gene Family LATS NDR Mps One Binder (MOB) MOB in yeasts MOB in Drosophila melanogaster Mammalian homologs of MOB Hippo-LATS tumor suppressor pathway Rationale, Hypothesis and Objectives vi
7 CHAPTER 2 MATERIALS AND METHODS Polymerase chain reaction (PCR), plasmid construction and purification Site-directed mutagenesis Cell culture and transfection Extraction of total RNA Reverse transcriptase-polymerase chain reaction (RT-PCR) Fusion protein production and Glutathion-S-transferase (GST) pull-down assay Protein extraction and western blot Lentivirus production, purification, and titering sirna knockdown of hmob1a and hmob1b Quantitative reverse transcriptase real-time (qrt)-pcr Cell proliferation assay Cell death assay Indirect immunofluorescence assay Fluorescent activated cell sorting (FACS) analysis of cell cycle CHAPTER 3 RESULTS Examination of hmob mrnas expression in human tissues Subcellular localization of hmobs at interphase Interaction of hmobs with LATS/NDR family members in vitro Functional residue of LATS2 interacting with hmob1b Functional domains of hmobs interacting with LATS1 and NDR Effect of hmob1a/1b on cell proliferation vii
8 Over-expression of hmob1b suppresses cell proliferation Loss of hmob1 stimulates cell proliferation Over-expression of hmob1b enhances LATS-induced inhibition of cell proliferation Effect of hmob1b on cell death Examination of the effect of hmob1 on cell cycle progression through FACS analysis CHAPTER 4 DISCUSSION Molecular characterization of the human MOB family Interaction of hmobs with LATS/Ndr kinase family Regulation of cell proliferation by hmob Over-expression of hmob1 induces cell death Future Directions In Summary REFERENCES APPENDIX MATERIALS viii
9 LIST OF FIGURES Figure 1. LATS/NDR family of protein kinases... 5 Figure 2. Signaling pathways of mitotic exit and cytokinesis in yeast and mammalian cells Figure 3. Multiple alignments of human homologs of yeast MOBs sequences Figure 4. Three-dimensional crystal structure of human MOB1B Figure 5. Regulation of Hippo Signaling Figure 6. mrna expression of human MOBs in 20 different human tissues Figure 7. Western blot analysis on human homologs of yeast MOBs Figure 8. Localization of hmobs at interphase Figure 9. Interaction of hmobs with LATS/NDR family members in vitro Figure 10. Residue R657 of LATS2 is required for hmob1b binding Figure 11. Functional domain for hmob1b interaction with LATS1 or NDR Figure 12. Single mutation of residue P48 or Y114 of hmob1b is not sufficient to abolish the hmob1b interaction with LATS1 or NDR Figure 13. Efficiency of lentivirus expression into HeLa cells Figure 14. Effect of over-expression of hmob1b on cell proliferation Figure 15. Knockdown of hmob1a and hmob1b by sirna Figure 16. Loss of hmob1 on cell proliferation Figure 17. Effect of over-expression of LATS and hmob1b upon cell proliferation Figure 18. Effect of over-expression of hmob1b upon cell death Figure 19. Effect of hmob1 on cell cycle progression ix
10 Figure 20. A proposed model for the molecular mechanism of hmob1a and hmob1b for LATS phosphorylation in mammalian Hippo-LATS pathway x
11 LIST OF TABLES Table 1. Characterization of human MOBs Table 2. List of primers for hmob subcloning Table 3. List of primers for in vitro mutagenesis Table 4. List of primers for RT-PCR Table 5. List of sirna sequences specific for targeting hmob1a or hmob1b Table 6. List of oligonucleotide primers for qrt-pcr xi
12 LIST OF ABBREVIATIONS AGC Protein kinase A (PKA)/PKG/PKC BCP 1-bromo-3-chloropropane BHS Blocking and hybridization solution BrdU 5-bromo-2-deoxyuridine CKI Cyclin-dependent kinase inhibitor D. melanogaster Drosophila melanogaster DAB Diaminobenzidine DEPC Diethyl pyrocarbonate diap Drosophila inhibitor of apoptosis DMEM Dulbecco s modified Eagle medium ECL Enhanced chemiluminescence EST Expressed sequence tag FACS Fluorescent activated cell sorting FBS Fetal bovine serum GFP Green fluorescent protein GST Glutathione-S-transferase HA Hemagglutinin HRP Horseradish peroxidase IPTG Isopropyl-β-D-thiogalactoside LATS Large tumor suppressor LB Luria Bertani MATS Mob as tumor suppressor MEF Mouse embryonic fibroblast MEN Mitotic exit network MOB Mps one binder MOI Multiplicity of infection mp Myristoylation/palmitylation MST Mammalian sterile-20 like xii
13 NDR Nuclear Dbf2-related NP-40 Nonidet P-40 PBS Phosphate buffered saline PCR Polymerase chain reaction qrt-pcr Quantitative reverse transcriptase real-time polymerase chain reaction RNAi RNA interference RT-PCR Reverse transcriptase-polymerase chain reaction S. cerevisiae Saccharomyces cerevisiae S. pombe Saccharomyces pombe SDS-PAGE Sodium dodecyl sulfate polyacrylamide gel electrophoresis SIN Septation initiation network sirna Small-interference RNA SMA S100B-MOB association SPB Spindle pole body Trc Tricornered UTR Untranslated region YAP Yes-associated protein xiii
14 CHAPTER 1 INTRODUCTION 1.1. Cancer According to statistics from the Canadian Cancer Society, almost 40% of women and 45% of men in Canada will develop cancer during their lifetimes [1]. Cancer is a disease of chaos. It breaks down the existing biological order within the body and disrupts the controls that are normally responsible for determining when and where cells multiply throughout the body. Most cancers are caused by errors in the genetic material. Transformed cells have the ability to mimic normal growth signaling, resist growthinhibitory signals, evade apoptosis, deregulate replication, maintain angiogenesis near tumor sites, and promote tissue invasion and metastasis at a late stage of tumor development [2]. These hallmarks of cancer are the results of the alterations in oncogenes and tumor suppressor genes. Cancer-promoting oncogenes are mostly activated, while tumor suppressor genes are usually inactivated or mutated in cancer cells. Dysregulation of oncogenes or tumor suppressor genes can lead to malfunctioning of physiological processes including uncontrollable cell proliferation, defective apoptosis and inappropriate cell migration. 1
15 1.2. Tumor Suppressor Gene Concept of the Tumor Suppressor Gene Tumor suppressor genes are defined as genes in which loss of function by mutations or inactivation result in tumor formation [3]. A tumor suppressor gene often follows many important features. Most tumor suppressor genes are recessive genes. That is, mutation in both alleles is required before an effect is manifested, as described by Knudson s two-hit hypothesis. If one allele of the gene is inactivated, the second can still produce the correct protein. In fact, most tumor suppressor genes are haplosufficient as opposed to oncogenes, which are haploinsufficient. Secondly, inheriting a mutated allele will greatly increase the risk of tumor development due to the fact that only one additional mutation is necessary for the complete loss of gene function. In addition, tumor suppressor genes are frequently inactivated in sporadic cancers and have the ability to inhibit tumor cell growth in vitro. Moreover, mice with null mutations in the tumor suppressor gene show a predisposition to cancer that mimics a human cancer syndrome [4-6] Tumor Suppressor Genes in Cancer The primary function of tumor suppressor genes is to block the development of cancer through diverse mechanisms. Some of them function to directly suppress the proliferation of cells in response to a variety of growth-inhibitory and differentiationinducing signals while others are components of the cellular control circuitry that inhibits proliferation in response to metabolic imbalances and genomic damage. Mutation of 2
16 tumor suppressor genes have been found in various types of cancers [4,5]. For example, mutations of tumor suppressor gene p53 are frequently found in more than 50% of hereditary and sporadic cancers [4,7,8]. Homozygous loss of p53 has been implicated in colon, breast and lung cancers, whereas mutation of p53 has been reported in leukemias, lymphomas, sarcomas, and neurogenic tumors [4,9,10]. Moreover, malfunctioning of tumor suppressor genes also increases the difficulties in the radiation and chemotherapy treatments for cancer patients [4] Function of Tumor Suppressor Genes Tumor suppressor genes are perceived as our anti-cancer defenses. They operate in a variety of intracellular sites by controlling circuits that are responsible for governing cell proliferation and survival. Accumulating evidence suggests that tumor suppressor genes are cell cycle regulators. Some of the CKIs (Cyclin-dependent Kinase Inhibitors) such as p16 INK4 and p27 Kip1, and cell cycle checkpoint genes such as ATM, Chk1/2 and BUB1 are also tumor suppressor genes. Deletions, mutations or reduced expression of these genes have been reported in a variety of human cancers [4,11-14]. Additionally, loss of the tumor suppressor genes p53 or BRCA1/2 in mammalian cells negatively affects the cell cycle by creating polyploidy, genomic instability and defective cytokinesis [15-17]. Furthermore, tumor suppressors such as p53, ARF, BRCA1 can induce apoptosis by directly or indirectly affecting the components of the programmed cell death network. For example, over-expression of p53 can suppress tumor growth by inducing apoptosis 3
17 through transcriptional activation of many downstream genes such as BAX and PUMA [18], whereas BRCA1 can indirectly stimulate p73, a p53 family member, through c-abl to induce apoptosis upon receiving stress signals [19]. Additionally, they can also modulate cell differentiation, angiogenesis, DNA damage repair, and tumor cell migration and metastasis [2,4] Large Tumor Suppressor (LATS)/Nuclear Dbf2-related (NDR) Gene Family The LATS/NDR gene family is part of the serine/threonine AGC (protein kinase A (PKA)/PKG/PKC) class of protein kinases [20]. LATS/NDR family kinases are structurally similar, consisting of a highly conserved kinase domain (Figure 1). They also require phosphorylation at a conserved Ser/Thr residue for activation. The LATS/NDR family is evolutionarily conserved and they have homologs in major kingdoms including D. melanogaster [tricornered (trc) and lats/warts], Saccharomyces (S.) cerevisiae (Dbf2, Dbf20 and Cbk1), and S. pombe (Sid2 and Orb6). These kinases are important for cellular processes that regulate cell growth, metabolism, proliferation and survival [20]. 4
18 Figure 1. LATS/NDR family of protein kinases. The members of LATS/NDR family are highly conserved in evolution. This alignment illustrates the relationship of the different family members from mammalian (h), D. melanogaster (d), S. cerevisiae (sc), and S. pombe (sp). Schematic diagrams depict the kinase domains (black). On the right, the percentage of sequence identity and similarity between the kinase domains of LATS/NDR family members and the domain of D. melanogaster LATS is indicated. 5
19
20 LATS Molecular and Cellular Functions of LATS The Large Tumor Suppressor (lats), also called Warts, was originally discovered in Drosophila. The lats mutants have displayed developmental defects, uncontrollable proliferation and the formation of large tumors in many tissues [21,22]. In mammals, there are two homologues, LATS1 and LATS2. LATS1 shares 74% sequence homology with Drosophila lats. Though the overall sequence only has an approximately 52% homology, the C-terminal kinase domain is highly conserved between LATS1 and LATS2 (85% homology) [23]. Both LATS proteins participate in a wide variety of cellular processes. LATS1 suppresses cell growth through inducing cell cycle arrest at the G 2 /M phase by interrupting the Cdc2/Cyclin B complex thereby inhibiting cell proliferation [24,25]. Additionally, LATS1 negatively regulates cytoskeleton protein LIMK1. Activation of LATS1 during cytokinesis inhibits LIMK1, which in turn activates cofilin and enhances actin polymerization at the contractile ring to separate the mother and the daughter cells [26]. Over-expression of LATS1 also up-regulates the proapoptotic protein BAX in human mammary tumor cells and the activity of caspase-3 in human colorectal tumor cells to induce apoptosis [24,25]. Meanwhile, LATS2 has been demonstrated to regulate cell growth by inducing cell cycle arrest at the G 1 /S phase through the disruption of the CDK2/Cyclin E complex or at the G 2 /M phase by inhibiting Cdc2 kinase activity, by an as yet unknown mechanism [27,28]. Moreover, LATS2- deficient MEFs (Mouse Embryonic Fibroblasts) exhibit defects in growth control and 6
21 centrosome duplication, which results in misalignment of chromosomes and failure of cytokinesis [23]. Furthermore, LATS2 promotes apoptosis through downregulation of the anti-apoptotic proteins BCL-2 and BCL-X L, or stimulation of caspase cleavage [28,29]. Though the precise mechanism of LATS-mediated apoptosis is still unclear, LATS has been shown to be involved in the modulation of programmed cell death. Knockout of LATS2 in mice is lethal due to severe under-development of the nervous system, while LATS1-deficient mice were viable but developed tumors at multiple sites [23]. Evidently, LATS has a great impact on a variety of cellular processes LATS in Cancer LATS1 and LATS2 are not only regulators of cell cycle; they are also involved in tumorigenesis. It was first reported in Drosophila, in which flies deficient in lats displayed spontaneous tumor formation [21]. However, supplementation with human LATS1 completely suppressed tumor development in Drosophila, suggesting that Drosophila lats is conserved with mammalian LATS1 [30]. Inactivation of LATS1 has also been linked to genomic instability and polyploidy in the genome, a hallmark of tumorgenicity [24]. In fact, genomic instability leads to the impaired induction of p53- mediated apoptosis [31]. In addition, mice lacking LATS1 have been shown to develop soft-tissue sarcomas, ovarian tumors, and developmental defects, demonstrating that the LATS1 gene functions as a tumor suppressor [32,33]. Furthermore, mutations or reduced levels of LATS1 and/or LATS2 mrnas or proteins have been found in a variety of human cancers including breast and prostate cancers, astrocytomas, acute lymphoblastic 7
22 leukemia, and soft tissue sarcomas [33-37]. Recently, LATS1 levels are also used as a prognostic factor in predicting the outcome for node-positive breast cancer patients, while LATS2 levels have been used in predicting the response of breast cancer patients to selective chemotherapy [36,38] NDR NDR is a homolog of LATS and they shares a conserved kinase domain. In Drosophila, trc (a Drosophila homolog of NDR) regulates the development of neurons and cytoskeletal organization. Mutations in trc had been shown to increase dendritic branching and alter dendritic tiling [39]. Additionally, loss of trc functions had been demonstrated to alter the distribution of actin filaments and microtubules, which leads to splitting of hairs and bristles in flies [40,41]. These findings suggest that trc may be involved in the development of Drosophila. In mammals, there are two human homologues of dtrc, NDR1 and NDR2. The kinase domains of LATS1 and NDR1 are 52% identical, whereas LATS2 and NDR1 are 54% identical [42]. By over-expressing or suppressing human NDR1 by sirna, the kinase has been shown to regulate centrosome duplication during the cell cycle [43]. Though several proteins including hmob1 and S100B (a calcium binding protein) have been found to bind to and activate NDR, the significance of their interactions still remains unclear [44,45]. Moreover, there is no direct evidence that NDR is involved in human cancers. Additional research will hopefully shed light to the function of this protein kinase by characterizing the specific protein substrates targeted by NDR1 and NDR2. 8
23 1.4. Mps One Binder (MOB) MOB in yeast MOB was first discovered as an Mps1 protein kinase binding protein in the budding yeast S. cerevisiae by Luca and Wiley in 1998 [46]. Although MOB was identified as a binding partner of Mps1, which regulates spindle pole body (SPB) duplication and mitotic checkpoint, MOB has no apparent role in spindle assembly checkpoint. Two MOB genes were found in budding yeast (MOB1 and MOB2) and fission yeast S. pombe (mob1 and mob2). In budding yeast, MOB1 is localized at the SPB during most phases of the cell cycle, but it is distributed at the bud neck at late mitosis and cytokinesis [47]. MOB1 is involved in a signaling pathway, known as Mitotic Exit Network (MEN), which regulates exit from mitosis (Figure 2). MOB1 can bind to and activate the Dbf2 or Dbf20 protein kinases, two LATS/NDR homologs, which subsequently trigger downstream processes to exit mitosis and initiate cytokinesis [47-50]. Mutation in MOB1 has been shown to disrupt its interaction with Dbf2/Dbf20 kinases, resulting in impaired actomyosin ring contraction, which causes late mitotic arrest and cell separation defect, respectively [46,47,50]. In addition, the process of cytokinesis is also interrupted, resulting in polyploid cells [47]. Moreover, MOB1 has been demonstrated to be involved in the SPB duplication pathway and M-phase checkpoint function by interacting with numerous essential pathway players [46,47,51]. 9
24 Figure 2. Signaling pathways of mitotic exit and cytokinesis in yeast and mammalian cells. This model demonstrates the relationship between the pathways for mitotic exit and cytokinesis in yeasts and mammals. Mitotic exit network (MEN) and septation initiation network (SIN) signaling cascades in yeasts may be conserved. Mammalian homologs for all the components in MEN and SIN are found. GTPase RAB22A stimulates MST2 (mammalian ste20-like kinase) and plk1 (polo-kinase 1) to phosphorylate LATS (large tumor suppressor) and MOB (mps one binder) in order to stimulate hcdc14. Subsequently, activated hcdc14 phosphorylates APC (anaphase promoting complex) and Wee1 to inactivate Cdk1 and Cyclin B, resulting in mitotic exit and cytokinesis. Solid line, published; dashed line, unknown pathway; perpendicular line, inhibition pathway; question mark, unknown mechanism. 10
25 Budding Yeast Fission Yeast Mammals MEN SIN MEN/SIN Tem Spg RAB22A?? Cdc15 Cdc5 Cdc7 plo1 MST2 plk1? DBF2/MOB1 complex Sid2/mob1 complex LATS/MOB1 complex? Cdc14 CLP1/Flp1 hcdc14??? Sic1 APC Cdc25 Wee1 Cdc25 APC/Wee1 Cdk1/Clb Cdk1/Cdc13 Cdk1/CyclinB Mitotic Exit and Cytokinesis
26 MOB2, 33% identical and 43% similar in sequence to MOB1, is a non-essential gene for the growth of yeasts [46]. The MOB2 protein coordinates the separation of the mother and daughter cells after cytokinesis and polarized cell growth by activating Cbk1 protein kinase (a Dbf2-related protein kinase) [52,53]. The MOB2-Cbk1 complex also plays a role in the daughter-specific gene expression and septum degradation [52,53]. Furthermore, MOB2 and Cbk1 are localized to the bud neck and to the nucleus of the daughter cell at the end of mitosis interdependently [53]. By regulating cell separation and cell wall reorganization during cytokinesis, MOB2 seems to play a role in the degradation of the septum and cortical remodeling. In fission yeast, mob1 is involved in a similar signaling network to that in budding yeast, known as Septation Initiation Network (SIN), which activates actomyosin ring constriction and the formation of septum immediately after the separation of the homologous chromosomes (Figure 2) [48]. The mob1 protein is responsible for the activation of the protein kinase Sid2 (a Dbf2-related protein kinase). Prior to cytokinesis, the mob1-sid2 complex is accumulated at the division site and transmits the division signal from the SPB to the actomyosin ring [54,55]. Throughout the cell cycle, both Sid2 and mob1 are localized at SPB. However, during medial ring constriction, the proteins are distributed at the cell division site [54-56]. One study showed that cells deficient in mob1 lead to the failure of septum formation due to the absence of Sid2 kinase activities [56]. Hence, the interaction between Sid2 and mob1 is required for a functional SIN. The mob2 gene, with a sequence similar to mob1, activates Orb6 (a Dbf2-related protein kinase). The protein complex Orb6-mob2 is responsible for the maintenance of 11
27 the cell polarity within cell cycle and the onset of mitosis [57]. Over-expression of mob2 in cells increases cell length during division and also causes a G 2 phase delay [57]. Evidently, yeast MOB genes play important roles in cell cycle progression and cell division MOB in Drosophila melanogaster In 2005, four MOB genes, dmob1/mats (Mob as tumor suppressor), dmob2, dmob3, and dmob4, were identified in D. melanogaster. dmob1 is the only one that has been extensively studied and it has been further suggested to act as a tumor suppressor. dmob1 binds to and activates a Drosophila homolog of yeast Dbf2/Sid2/Cbk1/Orb6 protein kinase, Large Tumor Suppressor (lats)/warts, which has also been identified as a tumor suppressor [21,58]. Deficiency of dmob1 has been shown to increase cell proliferation and cause defective apoptosis in addition to the initiation of tumorigenesis due to an excessive amount of cell cycle activator Cyclin E and antiapoptotic protein diap (Drosophila inhibitor of apoptosis) [59]. Surprisingly, the supplementation of the human dmob homolog, hmob1b, into the dmob1-deficient cells rescued the phenotypes in the mutant flies [59]. Moreover, dmob1 also regulates the cytoskeletons by interacting with Drosophila trc, a member of the NDR family [58]. Reducing levels of dmob3 and dmob4 in cells has also led to the formation of spontaneous tumors in flies [21]. The most recent study showed that dmob4 fails to bind to Drosophila lats and trc but it is able to organize spindle poles, perhaps through interacting with an unknown binding partner [60]. 12
28 Mammalian homologs of MOB By doing a BLAST search using dmob1 sequence, seven human homologs of dmob1 are identified and each of them has a unique characterization (Table 1). Although different names have been used for the same MOB in the literatures, we assign the gene names according to the GenBank names used for MOBs with modifications. hmob1a (MOBKL1A/MOB4A/MATS2) shares 88%/93% of identity/homology with dmob1 while hmob5 (MOBKL3) only shares 19%/33% identity/homology with dmob1 (Figure 3). hmob1a and hmob1b (MOBKL1B/MOB1/MATS1/Mob4B) are also found to share a sequence of more than 97% identity/similarity, whereas hmob2a (MOBKL2A) and hmob2b (MOBKL2B) share 84% identity and 91% similarity [45,61]. Since hmob1 is able to rescue the mutant flies, it has led us to query whether the functions of human MOBs are conserved. The hmob1b (called hmob1a in the literature) structure is determined to be globular in shape through x-ray crystallography (Figure 4) [61]. Its core is made up of a four-helix bundle which is stabilized by a tetrahedrally-coordinated zinc atom [61]. However, the functional purpose of the helices and the zinc atom is still unclear. By revealing the hmob1b protein structure, it allows us to predict the potential binding partners of the MOB family. Stavridi et al. (2003) also found a conserved surface on the structure that is negatively charged [61]. Hence, hmob1b and its associated kinases may be interacting electrostatically through a positively charged region on the kinase and this conserved surface of hmob1b [61]. Additionally, hmob1 has been suggested to be involved 13
29 Table 1. Characterization of human MOBs. Comparison of human homologs of yeast MOBs in percentage of homology, location on chromosome, length (amino acid) and molecular weight (Kda). 14
30 I.D. Gene Bank Symbol % identity/ homology with dmob1 % identity/ homology with scmob1 Chromosome GenBank accession number Length (amino acids) Molecular Weight (Kda) 1. hmob1a MOBKL1A 88 / / 66 4q13.3 NM_ hmob1b MOBKL1B 86 / / 66 2p13.1 NM_ hmob2a MOBKL2A 51 / / 55 19p13.3 NM_ hmob2b MOBKL2B 54 / / 55 9p21.2 NM_ hmob3 MOBKL2C 47 / / 46 1p33 NM_ hmob4 HCCA2 41 / / 42 11p15.5 NM_ hmob5 MOBKL3 19 / / 28 2q33.1 NM_
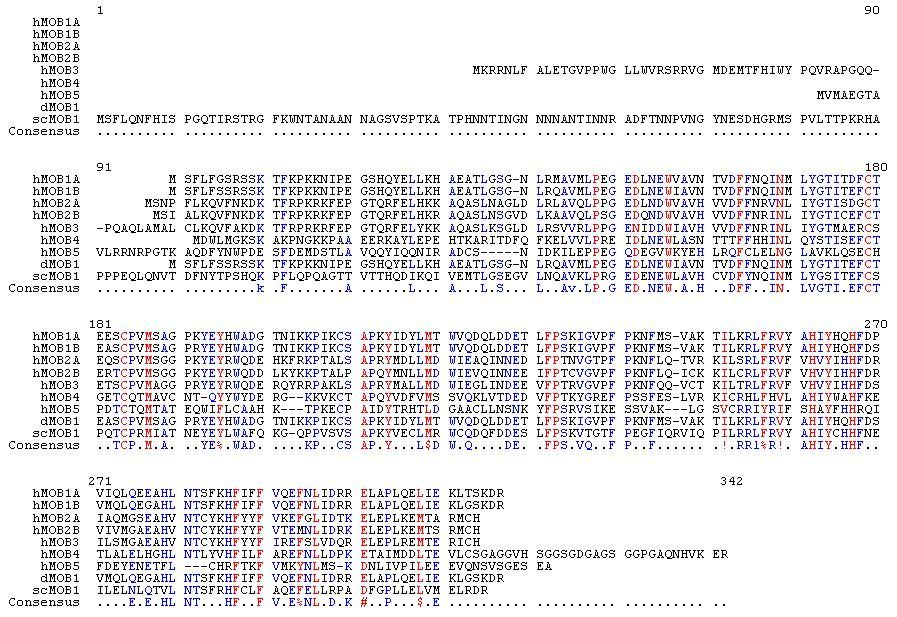
31 Figure 3. Multiple alignments of human homologs of yeast MOBs sequences. Alignment of human (h), Drosophila (d), and budding yeast (sc) MOB protein sequences. Identical residues are marked in red, similar residues in blue. The consensus sequence is indicated below.! is any one of IV; $ is any one of LM; % is any one of FY; # is any one of DE. 15
32
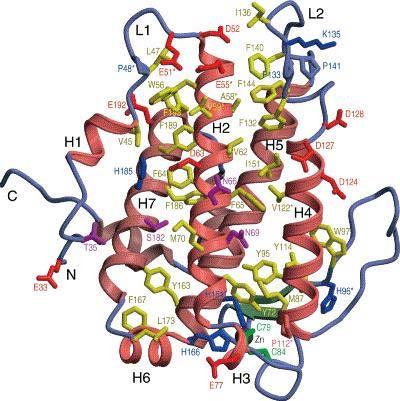
33 Figure 4. Three-dimensional crystal structure of human MOB1B. hmob1b is globular in shape and is comprised of seven α-helices, two 3, 10 helices and a β-hairpin. Four of the α-helices formed a helical bundle at the core of the structure and it is stabilized by a tetrahedrally coordinated zinc atom. Most of the conserved residues are spread over one of the helices in the bundle, two loops and the flat surface of the structure. H, α-helix; L, loop; N, N terminus; C, C terminus. Diagram adapted from [61]. Copyright 2003, with permission from Elsevier. 16
34
35 in a mammalian signaling pathway that is similar to MEN and SIN in yeasts since it is well-established that MOB proteins have the ability to act as kinase-activating subunits in both yeast and Drosophila systems. By identifying proteins that interact with hmob1b, it may provide great insights about the functions of the MOB family. hmob1b has been shown to bind to and activate the kinase activities of LATS1, LATS2, NDR1 and NDR2 at the plasma membrane upon phosphorylation by mammalian sterile-20 like (MST) kinases (Figure 5) [23,45,62-66]. hmob1b interacts with NDR protein kinases at their conserved N-terminal regulatory domain, also known as the S100B-MOB association (SMA) domain. The SMA domain consists of basic hydrophobic residues and S100B and MOB are the two known proteins that bind to the domain [45]. By suppressing either hmob1b or LATS1 by RNA interference (RNAi) in mammalian cells, it leads to prolonged mitotic exit [64], suggesting that the function of hmob1b in the MEN/SIN signaling cascade may be conserved in mammalian cells (Figure 2). Though hmob1b interacts with both LATS and NDR, the functional significance of this interaction is unknown. In addition, there is a lack of direct evidence that hmob1b plays a similar role like LATS/NDR in the regulation of cell cycle, cell proliferation and apoptosis. Less is known about the structure and functions of the other human MOBs. Though hmob5 has been reported to bind to Eps15 and a substrate of striatin familyprotein phosphatase 2A complexes, the significance of this interaction has not been determined [67]. In addition, clinical studies showed that hmob1 is down-regulated in colorectal and non-small-cell lung cancers in patients tumor samples [68,69]. Nothing is 17
36 Figure 5. Regulation of Hippo Signaling. A model that incorporates recently identified components that modulate growth in Drosophila melanogaster through the Hippo pathway and a proposed model that regulates growth in mammals in the similar fashion through the Hippo-LATS tumor suppressor pathway. Mammalian homologs for all the components of Hippo-LATS tumor suppressor pathway are conserved. MST2 (mammalian ste20-like kinase), LATS1/2 (large tumor suppressor), adaptor proteins hww45 and MOB form a complex together to fully activate LATS1/2 kinase activities. Activated LATS1/2 then inhibits downstream transcriptional co-activators, YAP (yes-associated protein) and TAZ (transcriptional coactivator with PDZ binding motif), from translocating into the nucleus to increase the transcription of FGF1 (fibroblast growth factor 1), PDGFβ (platelet derived growth factor β), p57 or RASSF4. Solid yellow arrows indicate reported relationships in activation, whereas perpendicular solid lines indicate reported relationships in inhibition. 18

37 Drosophila melanogaster Mammals
38 known about hmob2a, 2B, 3, 4 and 5, therefore, it is very important to elucidate the functions of all human MOB family to analyze their potential roles in tumorigenesis Hippo-LATS tumor suppressor pathway Recently, dlats together with dmob1 have been revealed to be a critical component and central player in the emerging tumor suppressor Hippo-LATS pathway in Drosophila, which regulates tissue and organ size by regulating cell proliferation and apoptosis (Figure 5) [70-72]. Upon receiving the tumor suppressing signals from upstream proteins, lats/warts inhibits downstream substrates from exerting their functions. Though Salvador and Mats are only adaptor proteins, they are required for full kinase activation of lats/warts. Interestingly, mammalian homologs for all the components of the Hippo-LATS pathway are conserved (MST1/2 for Hippo, LATS1/2 for lats/warts, hww45 for Salvador, and MOB for Mats). The central player of this pathway, LATS, has been well established as a tumor suppressor in human cancers. Forming a complex with MST kinase, adaptor proteins hww45 and MOB is important for the full kinase activation of LATS. Recently, two LATS kinase downstream substrates, yesassociated protein (YAP) and TAZ, have been identified [73,74]. The mammalian homolog of Drosophila Yorkie, YAP, is reported as an oncogene and is implicated in both breast and liver tumorigenesis [73,75,76]. TAZ is a transcription co-activator and it has been reported to bind with a variety of transcriptional factors including the RUNX family and Pax3 [77,78]. Recent studies showed that TAZ promotes cell proliferation and possibly epithelial-mesenchymal transition and it may have a role in breast tumorigenesis 19
39 [74,79]. LATS suppresses tumor growth by phosphorylating and inhibiting transcriptional transactivating activity of YAP or TAZ [73,74]. Although hmob1 has been confirmed as an upstream activator of the LATS kinase, whether it is also involved in the mammalian Hippo-LATS tumor suppressor pathway is still unknown. In addition, seven MOBs have been identified in humans (Table 1 and Figure 3), and which of the hmobs is the real activator of LATS has not been explored Rationale, Hypothesis and Objectives Evidently, the MOB family proteins are well conserved across species as demonstrated in S. cerevisiae, S. pombe, D. melanogaster, and mammalian cells. The findings in budding and fission yeasts illustrate the important role of MOB proteins in cell division and cytokinesis. The reports of Drosophila MOB1 as a tumor suppressor and its involvement in the emerging tumor suppressor Hippo-LATS pathway show the significance of MOB family in tumorigenesis. Although human MOB family members bind and activate kinase activities of tumor suppressors LATS1/2 and NDR1/2, there is not yet no direct evidence that hmobs function as tumor suppressors and play a role in tumor development. Elucidating the molecular and cellular functions of the seven human MOB gene not only extends our knowledge on the basic biology of the cell cycle, but also provides important information for diagnosis and treatments of human cancers. Accordingly, our hypothesis is that each member of hmobs will function differently and distinctively in the cells and some of the hmobs may function as tumor suppressors in humans. The overall aim of this study is to characterize the human MOBs 20
40 family and to demonstrate the involvement of hmob1a/1b in the regulation of tumor cell proliferation and death. To test this hypothesis, the following specific objectives will be carried out: 1. Examination of hmob mrnas expression in various human tissues. 2. Examination of the subcellular localization of hmobs at interphase. 3. Examination of the interaction of hmobs with LATS/NDR family members in vitro. 4. Effect of hmob1 on cell proliferation. 5. Effect of hmob1 on cell death. 6. Examination of the effect of hmob1 on the cell cycle. 21
41 CHAPTER 2 MATERIALS AND METHODS 2.1. Polymerase chain reaction (PCR), plasmid construction and purification Human MOBs (hmob1a, hmob1b, hmob2a, hmob2b, hmob3, hmob4 and hmob5) EST (expressed sequence tag) clones were purchased from Open Biosystems. Each MOB cdna was first amplified by PCR using specific primers with engineered BamHI or NotI sites (Table 2), digested by BamHI/NotI, and subsequently subcloned into BamHI/NotI sites of the pcdna3-ha or pgex4t1 vector. For membrane targeting, hmob1b was subcloned into pcdna3-ha vector containing the myristoylation/palmitylation (mp) motif of the Lck tyrosine kinase (MGCVCSSN) at the N-termini. For lentivirus production, hmob1b-ha or mp-hmob1b-ha cdna was first amplified by PCR using specific primers (Table 2), digested by PmeI, and subsequently cloned into the PmeI site of the WPI lentiviral vector. Upon ligation, plasmids were transformed into XL10-gold bacterial cells, grown on Luria Bertani (LB) agar plates supplemented with 50μg/ml ampicillin in an incubator at 37 C, then purified by using the Qiagen mini prep kit according to the manufacturers instructions. The DNA was then collected by using Buffer EB (ph 8.5) provided in the kit. Table 2. List of primers for hmobs subcloning Oligonucleotides BamHI-hMOB1A Forward NotI-hMOB1A Reverse Sequence 5 -CG GGA TCC ATG AGC TTC TTG TTT GGT AG-3 5 -CG GGA TCC TGC GGC CGC TTA TCT GTC TTT TGA GGT GAG-3 22
42 BamHI-hMOB1B Forward 5 -CG GGA TCC ACC ATG GAG ATG AGC TTC CTC TTC AGC-3 NotI-hMOB1B Reverse 5 -G TAA TCA TGC GGC CGC CAT TTA TCT GTC TTT TGA TCC AAG-3 BamHI-hMOB2A Forward 5 -CG GGA TCC ATG TCC AAC CCC TTC CTG-3 NotI-hMOB2A Reverse 5 -G TAA TCA TGC GGC CGC TCA GTG GCA CAT CCG GGC GGT-3 BamHI-hMOB2B Forward 5 -CG GGA TCC AAG ACC ATG TCC ATA GCC CTG- 3 NotI-hMOB2B Reverse 5 -G TAA TCA TGC GGC CGC TTA GTG ACA CAT CCT GCT-3 BamHI-hMOB3 Forward 5 -CG GGA TCC ATG GCC CTG TGC CTG AAG-3 NotI-hMOB3 Reverse 5 -G TAA TCA TGC GGC CGC TTAGTG ACA CAT CCT GCT-3 BamHI-hMOB4 Forward 5 -CG GGA TCC ATG GAC TGG CTC ATG GGG-3 NotI-hMOB4 Reverse 5 -G TAA TCA TGC GGC CGC TCA TCT CTC CTT CAC GTG-3 BamHI-hMOB5 Forward 5 -CG GGA TCC ATG GTC ATG GCG GAG GGG ACG-3 NotI-hMOB5 Reverse 5 -G TAA TCA TGC GGC CGC TCA TGC TTC ACT TTC CCC AGA-3 5 -AGC TTT GTT TAA ACC ATG TAC CCA TAC GAC PmeI-hMOB1B-HA GTC CCA GAC TAC GCG ATG GAG ATG AGC TTC Forward CTC TTC AGC-3 5 -AGC TTT GTT TAA ACC ATG GGA TGC GTC TGT PmeI-mp-hMOB1B-HA AGC AGT AAC TAC CCA TAC GAC GTC CCA GAC Forward TAC GCG ATG GAG ATG AGC TTC CTC TTC AGC-3 PmeI-hMOB1B Reverse 5 -AGC TTT GTT TAA ACC TTA TCT GTC TTT TGA TCC AAG-3 NotI-hMOB1B-100 Reverse 5 -G TAA TCA TGC GGC CGC TTA ACC ATC TGC CCA GTG ATA TTC-3 BamHI-hMOB1B-101 Forward 5 -CG GGA TCC ATG ACT AAT ATT AAA AAG CCA ATC-3 NotI-hMOB1B-142 Reverse 5 -G TAA TCA TGC GGC CGC TTA TTT GGG AAA TGG GAC ACC AAT C-3 BamI-hMOB1B-143 Forward 5 -CG GGA TCC ATG AAC TTT ATG TCT GTG GCA AAG-3 *Bolded letters denote the restriction enzymes sites. 23
43 2.2. Site-directed mutagenesis Site-directed mutagenesis for hmob1b mutations was done by using the QuikChange mutagenesis kit (Stratagene). The hmob1b-pgex4t1 plasmid was used as the template. The following primers were used: hmob1b-p48a and hmob1b-y114a (Table 3). DpnI was also used in the process to digest the parental supercoiled plasmid DNA. Site-directed mutagenesis for LATS2 mutations was done by overlapping PCR using specific primers: LATS2-R657A (Table 3). LATS2 EST clones were used as templates. The cdnas were then subcloned into pcdna3.1-hygro-3 FLAG vector. Table 3. List of primers for in vitro mutagenesis Oligonucleotides Sequence LATS2-R657A Forward 5 -CAG AAA GAG TCT AAT TAC AAC GCG TTA AAG AGG GCC AAG ATG-3 LATS2-R657A Reverse 5 -C CAT CTT GGC CCT CTT TAA CGC GTT GAT ATT AGA CTC TTT CTG-3 hmob1b-p48a Forward 5 -CAA GCT GTT ATG TTG GCT GAG GGA GAG GAT CTC-3 hmob1b-p48a Reverse 5 -GAG ATC CTC TCC CTC AGC CAA CAT AAC AGC TTG-3 hmob1b-y114a Forward 5 -C AAA TGT TCT GCA CCA AAA TTC ATT GAC TAT TTG ATG ACT TGG-3 hmob1b-y114a Reverse 5 -CCA AGT CAT CAA ATA GTC AAT GAA TTT TGG TGC AGA ACA TTT G-3 *Bolded letters denote the mutations Cell culture and transfection HeLa (human cervical cancer cell line), COS-7 (monkey kidney cells) and MCF7 (human tumorigenic mammary adenocarcinoma cell line) cells were maintained in Dulbecco s modified Eagle s medium (DMEM) (Sigma) containing 10% fetal bovine 24
44 serum (FBS), and 1% penicillin-streptomycin (Invitrogen) in a 37 C, 5% CO 2 incubator. HCT116 cells (human colorectal carcinoma cell line) were maintained in McCoy s 5A medium (Sigma) containing 10% FBS, and 1% penicillin-streptomycin (Invitrogen) in a 37 C, 5% CO 2 incubator. For cell transfection, cells were counted with a hemocytometer and seeded in tissue culture dishes with growth medium without any antibiotics one day before transfection. The appropriate plating density depends on the growth rate and the condition of the cell lines, and the size of the culture plate. Cells should be 50-80% confluent on the day of transfection. On the day of transfection, plasmid DNA was mixed with serum-free medium and FuGENE 6 (Roche) or Lipofectamine 2000 (Invitrogen) transfection reagent. The complex mixture was then added dropwise to the cells and the plate was swirled immediately after to ensure even dispersal. The cells were then incubated in a 37 C, 5% CO 2 incubator until they are ready for assay Extraction of total RNA Cells were grown in 6-well plate to 70-90% confluency prior to RNA extraction. Growth medium was completely aspirated from the plate and then 1ml of TRIzol reagent (Invitrogen) was added to the cells. Immediately, cells were scraped from the plate and transferred to a microfuge tube. 100μl of BCP (1-bromo-3-chloropropane) (Molecular Research Center) was added to the tube. The tube was shaken vigorously for 15secs and centrifuged at 12,000g for 15mins at 4 C. After centrifugation, the upper colorless aqueous phase was transferred to a new tube containing 500μl isopropanol and 25
45 subsequently centrifuged. Total RNA was further washed with 75% ethanol and then resuspended with diethyl pyrocarbonate (DEPC)-treated dh 2 O. The quality or integrity of RNA was examined by electrophoresis on 1.5% agarose gel Reverse transcriptase-polymerase chain reaction (RT-PCR) To determine the level of mrna expression of each MOB, primers specific for the 3 untranslated region (UTR) (not conserved in hmob sequence) of each MOB (Table 4) and RNAs from 20 human tissues (Human Total RNA Master Panel II, Clontech) were used to perform RT-PCR. About 5μg of RNA were reverse transcribed and 1/10 of cdnas were then used to amplify hmobs by PCR according to the SuperScript One-Step RT-PCR Systems with Platinum Taq DNA Polymerase (Invitrogen). Following is the PCR program used: 1 cycle of 95 C for 2mins, 35 cycles of 95 C for 45secs, 55 C for 30secs, 68 C for 1min, and 1 cycle 68 C for 7mins. The PCR products were then analyzed on a % agarose gel to visualize the target RT-PCR products. β-actin (0.1μl of cdna) was used as an internal control in each RT-PCR reaction. Table 4. List of primers for RT-PCR. Oligonucleotides hmob1a-3 UTR Forward hmob1a-3 UTR Reverse hmob1b-3 UTR Forward hmob1b-3 UTR Reverse hmob2a-3 UTR Forward hmob2a-3 UTR Reverse hmob2b-3 UTR Forward hmob2b-3 UTR Reverse Sequence 5 -AGG ATG CAG AGC TGT GCA AAT TG-3 5 -ATC ATA GAT ATG TTA CAA CAT GC-3 5 -ATG TTT CTT CTA GAA CAC AG-3 5 -CAA TCT GAT TGT GTT ATT AG-3 5 -CGT GAA CTC TGT AAT TCT ATG TG-3 5 -CCC TGG ATA CAG TCA GCT GAA TG-3 5 -TGC TCC ACC TCA CCC TTT GG-3 5 -CCT GAA AGG AAG GCT TAT TG-3 26
46 hmob3-3 UTR Forward hmob3-3 UTR Reverse hmob4-3 UTR Forward hmob4-3 UTR Reverse hmob5-3 UTR Forward hmob5-3 UTR Reverse 5 -GCC CAG GTC TGG ACT TTT TTG G-3 5 -CCA ACA TTT ATG GTA GGC CTA C-3 5 -GCC CCC CGG GCC GGA CAG GGG C-3 5 -CCC CAC CTC TGA GCT GCC AAC-3 5 -GGG AAT CAT AGG AAA AAT GT-3 5 -CTC AAT TGG GGA AAG TTA AC Fusion protein production and Glutathione-S-transferase (GST) pull-down assays To produce GST fusion proteins, each hmob cdna cloned in pgex4t1 vector was transformed into BL21 bacterial cells. The GST fusion proteins were then induced by incubating BL21 carrying the plasmid of interest in growth medium containing 0.4mM isopropyl-β-d-thiogalactoside (IPTG) at 37 0 C for 3 hours or 4 0 C overnight, and were subsequently purified with glutathione sepharose 4B beads. For the GST pull-down assay, 100μg of protein lysates expressing LATS1/2- FLAG or NDR1/2-FLAG were mixed with 10μg of GST (control) or hmobs GST fusion proteins on beads and incubated at 4 C with rotation for 2 hours. The beads were then washed several times with 1% Nonidet (N)P-40 lysis buffer with 1 Complete EDTAfree protease inhibitor cocktail tablet (Roche), resuspended in 2 SDS sample buffer, boiled, centrifuged, and the supernatants were subjected to SDS-PAGE and western blot analysis using M2 α-flag monoclonal antibody (Sigma). The proteins on membranes were also visualized by using 0.1% Ponceau S solution. 27
47 2.7. Protein extraction and western blotting For protein extraction, cells were grown to 80-90% confluence in tissue culture dishes. Prior to procedure, one Complete EDTA-free protease inhibitor cocktail tablet (Roche) was dissolved in either RIPA or NP40 lysis buffer and placed on ice. Tissue culture dishes with cells were placed on ice and the cells were washed twice with cold 1 PBS. Immediately, lysis buffer was added and cells were scraped with a cell scraper and transferred to a chilled microfuge tube. After 30mins of incubation on ice, cells were centrifuged at g at 4 C for 10mins and supernatant was transferred to a fresh chilled tube on ice. Protein concentration was measured using DC protein assay kit (Bio- Rad) and a spectrophotometer. Protein samples were then prepared for SDS-PAGE. 5 protein loading buffer with 4.2% β-mercaptoethaol was added to the protein lysates, which were then boiled at 100 C for 5mins. Protein lysates were then resolved by 10-12% sodium dodecyl sulfate polyacrylamide gel electrophoresis (SDS-PAGE) and transferred to a Hybond-ECL nitrocellular membrane (Amersham). The membranes were blocked with TBS-T containing 5% skimmed milk powder for 1 hour at room temperature, and probed with primary antibodies, [Y11 α-ha (Santa Cruz), MOB1B (Abcam), M2 α-flag (Sigma) or β-actin (Santa Cruz)] at 4 C overnight or for 1 hour at room temperature. The membranes were then washed with TBS-T buffer (2 10min) and probed with horseradish peroxidase (HRP)-conjugated goat anti-mouse or anti-rabbit IgG secondary antibodies (Jackson ImmunoResearch) for 1 hour at room temperature. Proteins were visualized on Hyperfilm-ECL (Amersham) using chemiluminescence reagent (Amersham). Some membranes were re-probed for other protein detection. 28
48 Membranes were blocked with diaminobenzidine (DAB) buffer for 20mins at room temperature and then washed with TBS-T buffer. Then the membranes were blocked and re-probed with primary and secondary antibodies as appropriate Lentivirus production, purification, and titering T cells were seeded in a 150-mm plate coated with 0.1mg/ml poly- L-lysine and incubated at 37 C overnight. Cells were transfected with Lipofectamine 2000 mixed with 7.5μg of WPI or hmob1b-ha-wpi or mp-hmob1b-ha-wpi transfer vector, 5.6μg of PAX (packing plasmid) and 1.9μg of MD2G (envelope plasmid). About hours post transfection, the growth medium was replaced with 9ml of OPTI-MEM I medium (serum free) (Sigma) containing 10mM sodium butyrate to enhance virus production. Two days after transfection, the media containing lentivirus were collected, passed through a 0.45μm filter, and concentrated using a Centricon-20 ultra-filtration column (Millipore Corp.). For virus titration, HeLa cells were seeded into each well of a 24-well plate. Cells were infected with a series of dilutions of lentivirus mixed with 8μg/ml polybrene. GFP-positive cells (cells containing lentivirus) and GFP-negative cells were counted under fluorescent and light microscope. The percentage of GFPpositive cells was calculated. The virus titer was calculated according to the following formula: transduction units/ml = (cell number at the time of infection) (percentage of GFP-positive cells) dilution factor. 29
49 2.9. sirna knockdown of hmob1a and hmob1b The ON-TARGETplus sirna duplexes targeting four different regions of endogenous human MOB1A or MOB1B mrna and a negative control sirna with scrambled sequence absent in the human genome were purchased from Dharmacon RNA Technologies (Table 5). For cell transfection, HeLa cells were seeded into each well of a 6-well plate and cells were transfected with a concentration of 25-50nM sirna mixed with Lipofectamine Two days post transfection, RNA was extracted, and knockdown of hmob1a and hmob1b was confirmed by qrt-pcr. Table 5. List of sirna sequences specific for targeting hmob1a or hmob1b. Oligonucleotides hmob1a-sense sequence1 hmob1a-antisense sequence1 hmob1a-sense sequence2 hmob1a-antisense sequence2 hmob1a-sense sequence3 hmob1a-antisense sequence3 hmob1a-sense sequence4 hmob1a-antisense sequence4 hmob1b-sense sequence1 hmob1b-antisense sequence1 hmob1b-sense sequence2 hmob1b-antisense sequence2 hmob1b-sense sequence3 hmob1b-antisense sequence3 hmob1b-sense sequence4 hmob1b-antisense sequence4 Sequence 5 -GGU UAA AUG UUG AUA CGA AUU 5 -P UUC GUA UCA ACA UUU AAC CUU 5 -GCA CCA AAG UAU AUU GAU UUU 5 -P AAU CAA UAU ACU UUG GUG CUU 5 -GCA GAU GGA ACG AAC AUA AUU 5 -P UUA UGU UCG UUC CAU CUG CUU 5 -AUG AAU GGG UUG CAG UUA AUU 5 -P UUA ACU GCA ACC CAU UCA UUU 5 -GAG ACA AGC UGU UAU GUU GUU 5 -P CAA CAU AAC AGC UUG UCU CUU 5 -UUA ACC AGA UCA ACA UGU UUU 5 -P AAC AUG UUG AUC UGG UUA AUU 5 -CAA AGA CUA UUC UAA AGC GUU 5 -P CGC UUU AGA AUA GUC UUU GUU 5 -GAA GCA AGC UGU CCA GUC AUU 5 -P UGA CUG GAC AGC UUG CUU CUU 30
50 2.10. Quantitative reverse transcriptase real-time (qrt)-pcr To examine the mrna expression of hmob1a or hmob1b, triplicates of 0.2μg of the extracted total RNAs were subject to qrt-pcr by using the SuperScript III Platinum SYBR Green One-step qrt-pcr kit (Invitrogen) and gene-specific forward and reverse primers (Table 6). qrt-pcr was run at 1 cycle of 50 C for 5mins, 95 C for 5mins, and 40 cycles of 95 C for 15s, 60 C for 30s, and 40 C for 1min using an ABI PRISM 7700 sequence detection system. 18S rrna was used as internal control in each sample. The mrna level of HeLa-hMOB1 relative to that in HeLa-control cells was calculated according to the following formula: 2 -(hmobs ΔCt-Control ΔCt), where ΔCt = cellular gene average Ct rrna average Ct. The mean and standard deviation were calculated from Ct values of triplicates real time RT-PCRs for each RNA sample. Table 6. List of oligonucleotide primers for qrt-pcr Oligonucleotides qmob1a-3 UTR Forward qmob1a-3 UTR Reverse qmob1b-3 UTR Forward qmob1b-3 UTR Reverse Sequence 5 -GTG ATC CAG CTT CAG GAG GAA GC-3 5 -CCT TTT ATC TGT CTT TTG AGG TG-3 5 -GAG GAG GCC CAC CTC AAC ACC TC GGT AAC TGT GTT CTA GAA GAA AC Cell proliferation assay To examine the effect of hmob1b over-expression on cell proliferation, triplicates of HeLa cells stably expressing WPI (vector), hmob1b or mphmob1b were seeded into each well of a 24-well plate. Cells were then counted beginning 2 days after seeding and continued for 5 consecutive days. To analyze the effect of hmob1 knockdown on cell proliferation, HeLa cells were seeded into 31
51 each well of a 24-well plate one day prior to transfection. Next day, 25-50nM sirnas against hmob1a, hmob1b alone or both were mixed with Lipofectamine 2000 and OPTI-MEM I medium (serum free) and then added into each well. Cells were counted everyday for 4 consecutive days post transfection. To investigate the effect of hmob1b together with LATS1 or LATS2 over-expression on cell proliferation, triplicates of HeLa cells were seeded into each well of a 12-well plate one day prior to infection. Next day before infection, cell numbers were counted. hmob1b, mp-hmob1b, LATS1, LATS2, LATS1 with hmob1b, LATS1 with mp-hmob1b, LATS2 with hmob1b or LATS2 and mp-hmob1b lentivirus at a multiplicity of infection (MOI) of 1 together with WPI lentivirus at a MOI of 2 was mixed with 8μg/ml of polybrene and OPTI-MEM I medium (serum free) and subsequently added into each well. Growth medium was added into each well after 24 hours. Cells were counted on day 5 after infection. All experiments were repeated at least twice Cell death assay Trypan blue exclusion method was used for measuring cell death caused by overexpression of hmob1. One day prior to lentiviral infection, MCF7 or HCT116 cells were seeded into each well of a 24-well plate. Before infection, cell numbers were counted. WPI, hmob1b or mp-hmob1b lentivirus at a MOI of 1 was mixed with 8μg/ml of polybrene and OPTI-MEM I medium (serum free) and subsequently added into each well. Growth medium was added into each well after 24 hours. Four days post infection, both detached and adherent cells were collected and centrifuged. Cell pellets 32
52 were resuspended in 100μl of DMEM, and subsequently mixed with 100μl of 0.4%- trypan blue solution (Sigma) for cell counting. Dead cells are usually stained by trypan blue. The percentage of blue cells was then calculated Indirect immunofluorescence assay One day prior to transfection, HeLa cells were seeded into each well of a 24-well plate containing coverslips coated with 1μg/ml of fibronectin (Sigma) and 0.01% poly-l-lysine (Sigma). About 0.2μg/ml of hmobs-ha plasmid DNA was mixed with 0.6μl of FuGENE 6 reagent, incubated for 15mins at room temperature, and subsequently added to cells in each well. Two days post transfection, cells were fixed with 3% formaldehyde in phosphate buffered saline (PBS), and permeabilized by incubation in 0.2% Triton X-100 in PBS for 2mins. After incubation in blocking and hybridization solution (BHS) for 40mins, the coverslips were subsequently incubated in rabbit anti-ha (Y11) polyclonal primary antibodies followed by Alex Fluor 488 anti-rabbit IgG (Molecular Probes) secondary antibody. Nuclear or chromosomal DNAs were then stained with 3μg/ml DAPI (Sigma). Images were obtained with a Nikon Eclipse TE 1000-U Inverted Fluorescent Microscope Fluorescent activated cell sorting (FACS) analysis of cell cycle HeLa cells stably expressing WPI (vector), hmob1b-ha or mp-hmob1b-ha or HeLa cells 4 days after transfection with hmob1a/b sirnas were trypsinized, resuspended in growth medium (DMEM), and counted with a hemocytometer. About Cells were centrifuged at 1000g for 5mins and washed twice with cold 1 PBS. 33
53 After the final wash, cells were resuspended gently with 2ml of cold 1 PBS. In a gradient fashion, 3 times 2ml of 95% cold ethanol was added to the cells and resuspended gently. The fixed samples were kept at 4 C for a minimum of 1 hour up to several weeks. Prior to FACS analysis, fixed samples were centrifuged at 1000g for 5mins and the fixative supernatant were aspirated. Cells were resuspended in 100μl of RNase A (Sigma) and incubated at 37 C for 30mins. Then 200μl of propidium iodide solution (Sigma) was added to the cells and kept at 4 C in the dark for 30mins before FACS analysis. 34
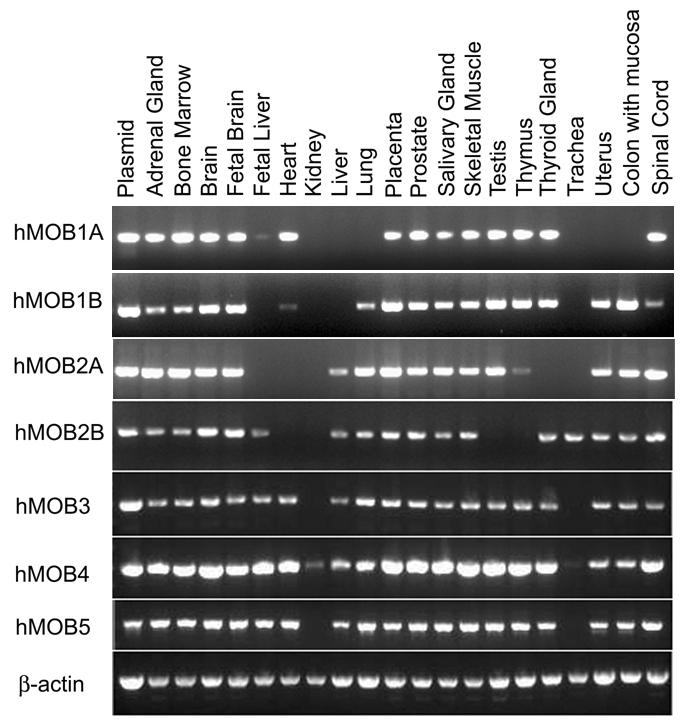
54 CHAPTER 3 RESULTS 3.1. Examination of hmob mrna expression in human tissues To date, there is no report on the expression of human MOB family in human tissues. It is possible that distinct MOB members may have the same function in different tissues. Therefore, identifying the expression patterns of hmobs allows us to have a better understanding of their functions. In this study, I have examined the mrna expression of all seven hmobs by RT- PCR using RNAs from 20 different human tissues and primers specific for the 3 untranslated regions of each hmob. The primer pairs were designed so that a PCR product of around 500bp can be amplified for all hmobs and β-actin. As predicted, different members of the hmob family are expressed in various tissues (Figure 6). All the hmobs are differently distributed in the tissues examined. Interestingly, hmob4 is expressed in all 20 of the tissues including kidney tissue which is not expressed in any of the other hmobs. hmob2b and hmob4 are the only two members expressed in trachea tissue. Except in kidney and trachea tissues, hmob3, hmob4, and hmob5 mrnas were highly expressed in the majority of the tissues tested (Figure 6). As a positive loading control, β-actin is similarly and abundantly expressed in all the tissues examined (Figure 6). 35
55 Figure 6. mrna expression of human MOBs in 20 different human tissues. RT-PCR analysis of human MOBs mrna expression in 20 human tissues. 5μg of total human RNA were used for the synthesis of cdna by RT. cdnas were then amplified with primers specific for human MOBs. β-actin was used as internal RNA loading control. Plasmid DNA for each hmob was used as a control for PCR. 36
56
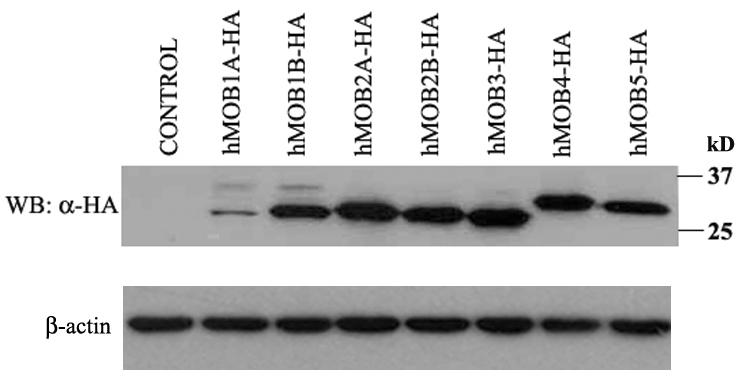
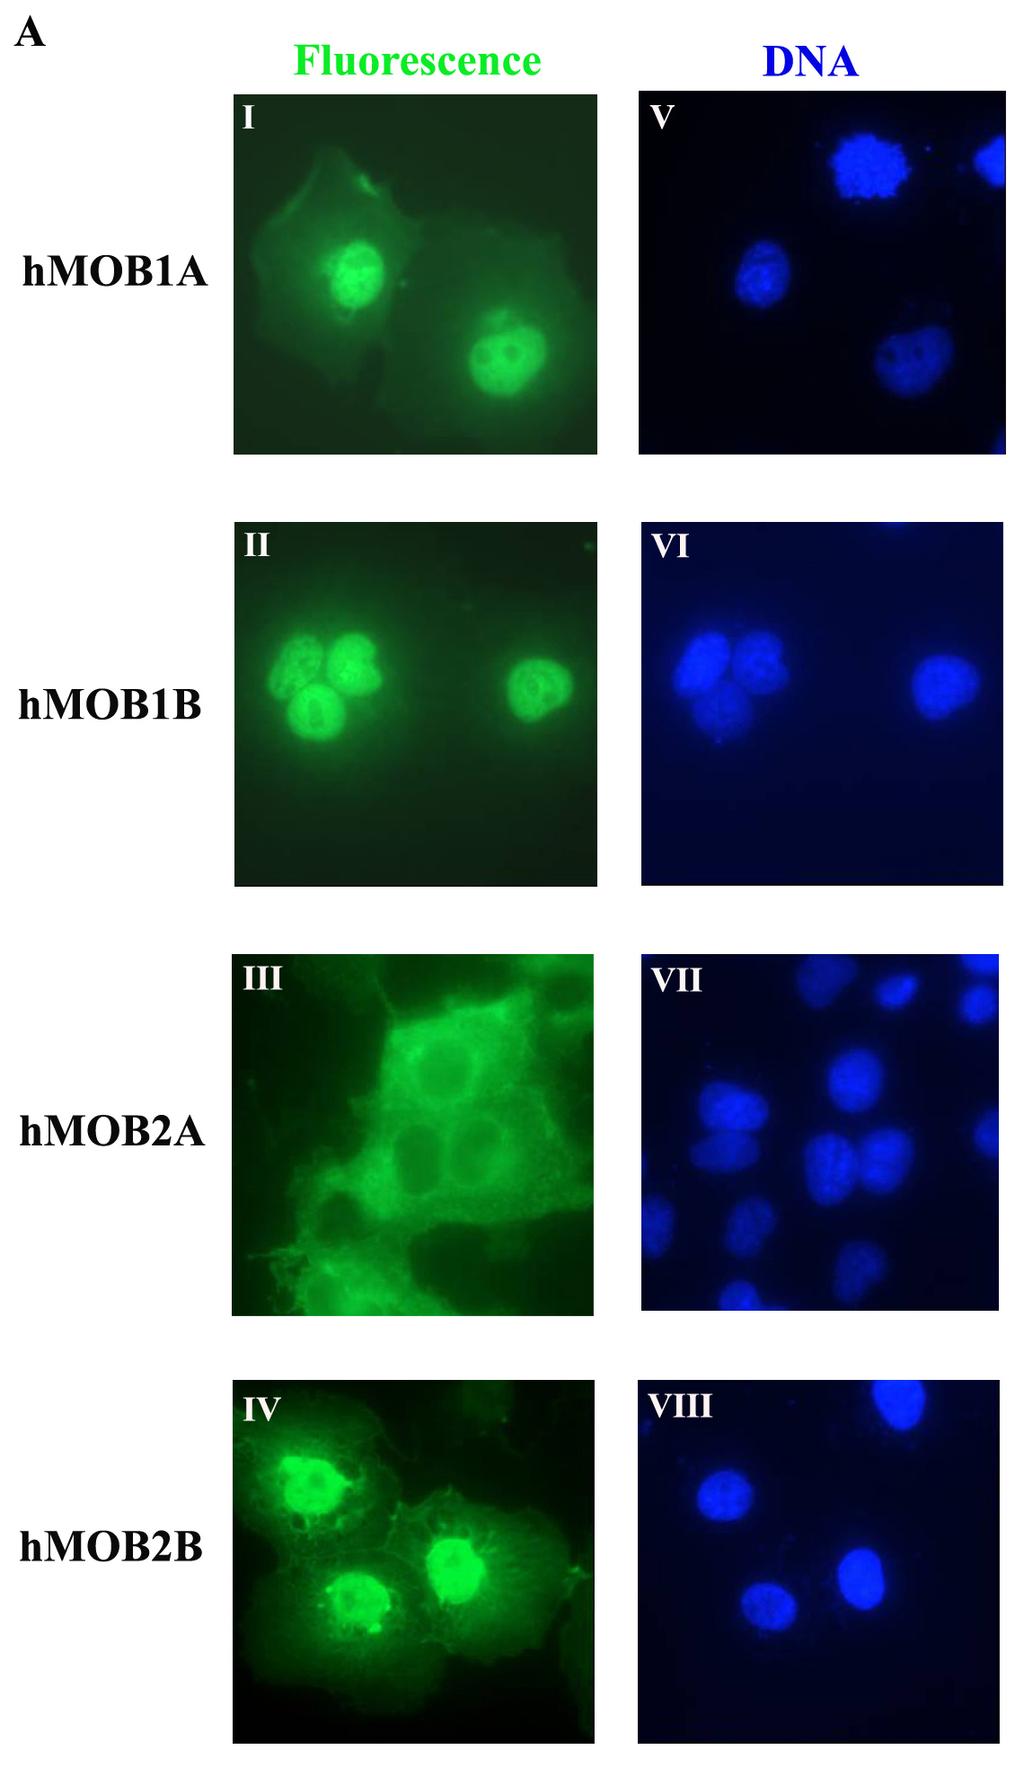
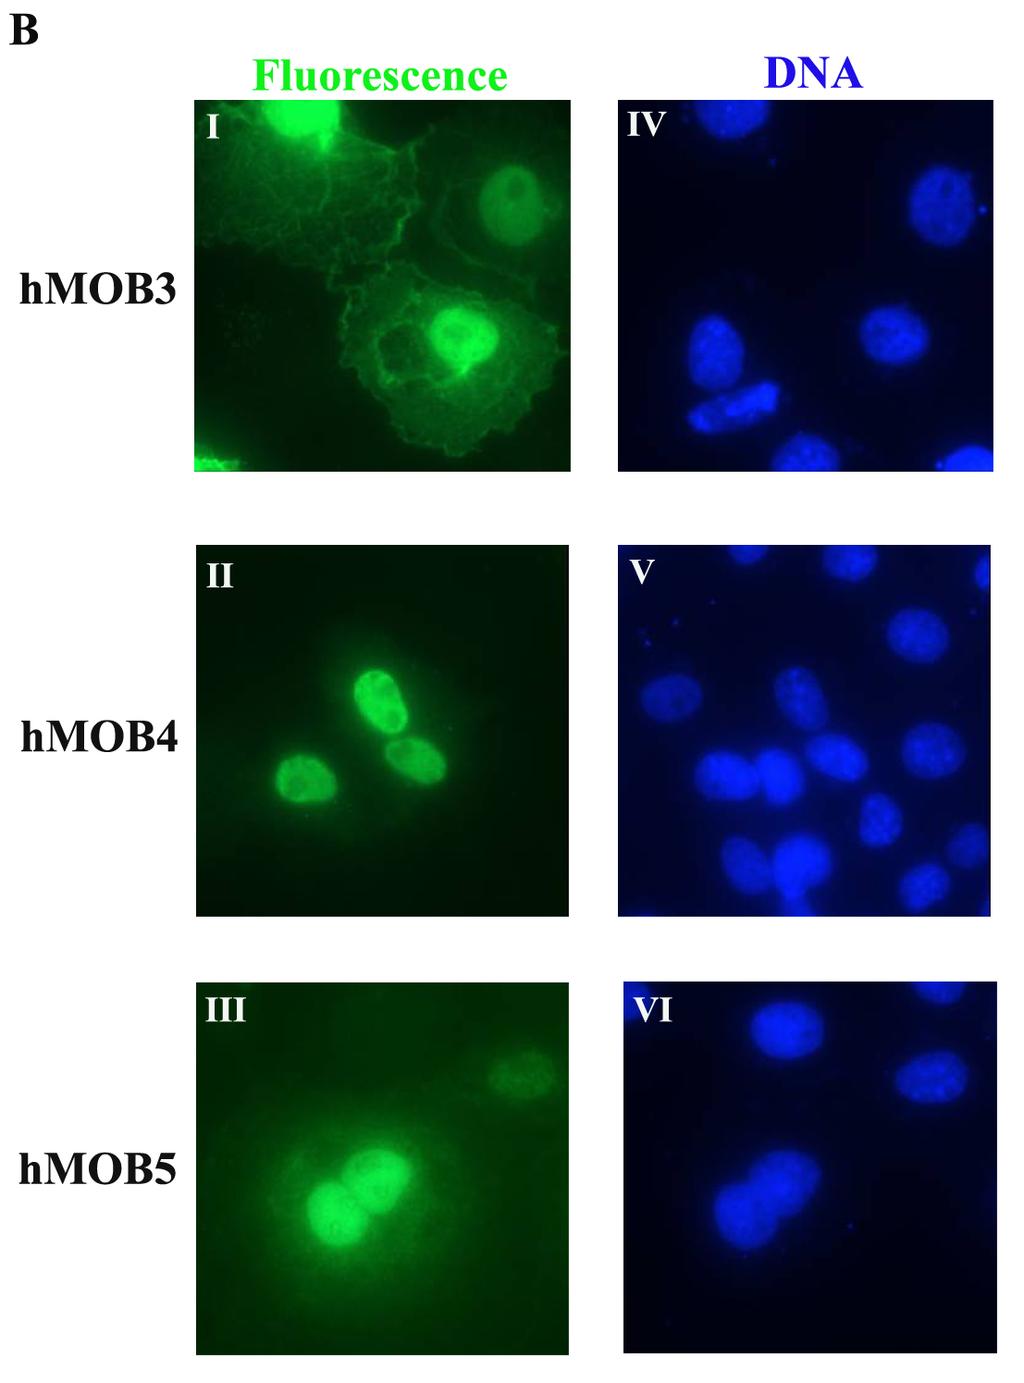
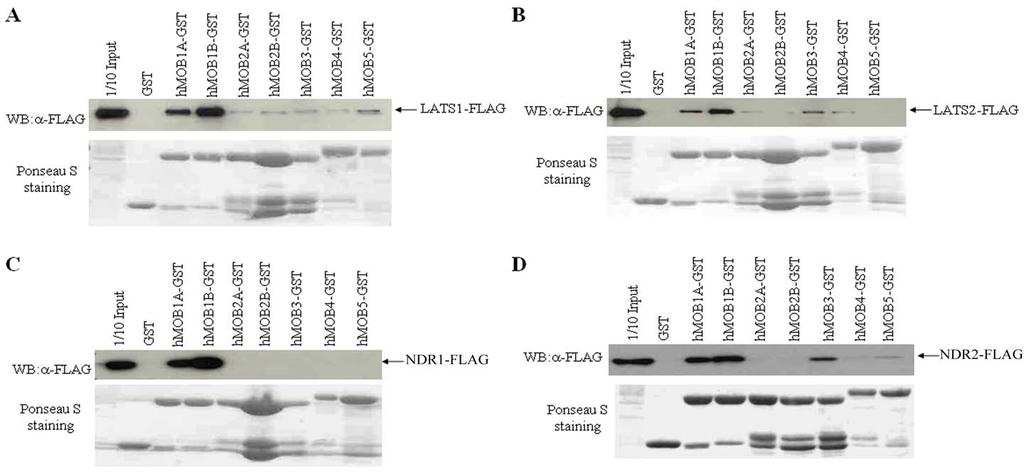
57 3.2. Subcellular localization of hmobs at interphase The function of a gene can often be inferred from the localization of the encoded protein within the cell. To better understand the function of each hmob, we examined their subcellular localization at interphase. Since antibodies for all members of hmob are not available, we cloned all the hmobs cdna into a vector that contained a N-terminal HA tag. All the constructs are sequenced before use. After transfection of hmobs into COS-7 cells, the protein expression of hmobs was confirmed by western blotting (Figure 7). The subcellular localization of hmob-ha was then examined through immunofluorescence staining (Figure 8). We found that most of the hmob proteins (hmob1a, 1B, 2B, 3 and 5) are detected in both the cytoplasm and nucleus (Figure 8A and B). Significantly, hmob2a is accumulated only in the cytoplasm (Figure 8A), whereas hmob4 is highly enriched in the nuclei of the cells (Figure 8B). The differences in localization of the members of hmob family indicate their distinctive nature and that they may possess different functions in the cell Interaction of hmobs with LATS/NDR family members in vitro Evidence has shown that hmob1a and hmob1b bind with LATS1/2 and NDR1/2 [45,62-70]. However, it is unclear whether other members of the human MOB family also interact with LATS and NDR kinases. To address this question, GST pulldown assays were carried out by incubation of FLAG tagged-lats1/2 or NDR1/2 overexpressing COS-7 cell lysate with various hmob-gst fusion proteins. Our findings 37
58 Figure 7. Western blot analysis of recombinant human homologs of yeast MOBs. 10μg of cell lysates extracted from COS-7 cells over-expressing the indicated HA-tagged hmobs were separated on 12% SDS-PAGE and subject to western blot using anti-ha monoclonal antibodies first antibody) and HRP-conjugated anti-rabbit IgG (second antibody). The blots were striped and re-probed with β-actin antibodies to confirm equal loading. 38
59
60 Figure 8. Localization of hmobs at interphase. Subcellular localization of hmobs at interphase. COS-7 cells transfected with DNA constructs expressing hmobs-ha (green) were fixed with 3% formaldehyde and stained with anti-rabbit HA antibody followed by Alex Fluor 488 anti-rabbit IgG (green) (A. I- IV., B. I-III.). DNA (blue) was counterstained with 1μM DAPI (A. V-VIII., B. IV-VI.). Images were obtained with a Nikon Eclipse TE 1000-U Inverted Fluorescent Microscope. 39
61
62
63 showed that hmob1a and hmob1b are the major binding partners for both LATS1/2 and NDR1/2 (Figure 9A-D). Interestingly, LATS1 also interacts weakly with other hmob proteins (hmob2a, 2B, 3, 4 and 5) (Figure 9A) and LATS2 binds to hmob3 and weakly binds to hmob2a and 4 (Figure 9B). Meanwhile, none of the other hmobs except hmob1a and 1B is associated with NDR1 (Figure 9C). However, NDR2 also interacts with hmob3 and weakly with hmob5 (Figure 9D). Both LATS1/2 and NDR1/2 belong to AGC group of kinases, and are major regulators of multiple cell physiology processes. The interactions observed between the LATS/NDR protein kinase family with members of hmob family lead us to wonder if the hmob family is also involved in those critical cell processes Functional residue of LATS2 interacting with hmob1b Though there are seven human MOB proteins, hmob1b is the only member that has been extensively researched in recent years and its structure has also been revealed by x-ray crystallography [61]. We have showed that hmob1a and 1B rather than other hmobs are the major binding partners of LATS and NDR families. Previous studies had also determined a conserved region on NDR and LATS that is responsible for the binding with hmob1b [45,66]. With the alignment of human, mouse and Drosophila LATS protein sequences, a critical residue, R694, that is responsible for the binding has also been identified on human LATS1 [64]. However, the residue that is required for the interaction between LATS2 and hmob1b has not been elucidated. According to 40
64 Figure 9. Interaction of hmobs with LATS/NDR family members in vitro. 10μg of GST (control) or hmobs-gst were incubated with 100μg of cell lysate from COS7 cells over-expressing LATS1/2 or NDR1/2. GST fusion proteins were precipitated with glutathione-sepharose beads and were separated on 10% SDS-PAGE along with one-tenth amounts of cell lysate (1/10 input) as positive control and then subsequently subject to western blot using α-flag antibody. The membrane was stained with 1% Ponceau S to visualize the GST fusion proteins used in the GST pull-down assays. A. LATS1. B. LATS2. C. NDR1. D. NDR2. 41
65
66 the sequences of NDR1/2 and LATS1, we attempted to determine the potential key residue on LATS2 that is needed for the binding with hmob1b by creating a LATS2 mutant construct. LATS2-R657A mutant construct was designed and purified as proteins for GST pull-down assay. Evidently, LATS2 mutant is deficient in binding the hmob1b- GST fusion protein (Figure 10B) whereas wild-type LATS2 is able to strongly bind to hmob1b-gst fusion protein (Figure 10A). Therefore, R657 on LATS2 is an essential residue for hmob1b binding Functional domains of hmobs interacting with LATS1 and NDR1 In addition to determining the binding domain on LATS and NDR for the hmob1b interaction, we attempted to identify the functional domain on hmob1b responsible for its binding to LATS/NDR. Different domains of hmob1b constructs (amino acids 1-100, , , 1-142, ) were designed and purified as GST fusion proteins. In vitro GST pull-down assays were carried out using GST fusion proteins containing different domains of hmob (amino acids 1-100, , , 1-142, and ). Our results showed that both LATS1 and NDR1 are only able to bind to GST-hMOB1B fusion proteins containing amino acids (Figure 11B and D). When these 142 amino acids were divided into two segments (amino acids and ), LATS1 and NDR1 kinases fail to interact with either of the segments (Figure 11A and C). Therefore, the first 142 amino acids of hmob1b are indispensable for LATS or NDR binding. To further map the conserved residues within the domain (amino acids 1-142) on hmob1b responsible for the interaction with the kinases, two mutant constructs were 42
67 Figure 10. Residue R657 of LATS2 is required for hmob1b binding. 100μg of lysates of cells over-expressing LATS2 wild type or LATS2 R657A mutant were incubated with 10μg of GST (control) or hmob1b-gst fusion proteins. GST fusion proteins were precipitated with glutathione-sepharose beads and were separated on 10% SDS-PAGE along with one-tenth amounts of cell lysate (1/10 input) and then subsequently subject to western blot using α-flag antibody. The membrane was stained with 1% Ponceau S to visualize the GST fusion proteins used in the GST pull-down assays. A. LATS2 wild type. B. LATS2 R657A mutant. 43
68
69 Figure 11. Functional domain for hmob1b interaction with LATS1 or NDR1. 10μg of GST (control) or different hmob1b domain constructs (amino acids 1-100, , , 1-142, ) were incubated with 100μg of lysates of cells overexpressing LATS1 or NDR1. GST fusion proteins were precipitated with glutathione- Sepharose beads and were separated on 10% SDS-PAGE along with one-tenth amounts of cell lysate (1/10 input) and then subsequently subject to western blot using α-flag antibody. The membrane was stained with 1% Ponceau S to visualize the GST fusion proteins used in the GST pull-down assays. A. Interaction of hmob1b domains (1-100, and ) with LATS1. B. Interaction of hmob1b domains (1-142 and ) with LATS1. C. Interaction of hmob1b domains (1-100, and ) with NDR1. D. Interaction of hmob1b domains (1-142 and ) with NDR1. 44
70
71 designed according to the sequence alignment of human, yeast, mouse and rat MOB1 [61]. Two conserved residues, P48 and Y114, of hmob1b were mutated into alanine (A). In vitro GST pull-down assays showed that both hmob1b-p48a and Y114A mutants retain the ability to interact with LATS1 or NDR1 (Figure 12A and B). Therefore, a single mutation on hmob1b does not seem to be sufficient enough to abolish the binding between hmob1b and LATS1 or NDR1 kinase Effect of hmob1a/1b on cell proliferation The LATS/NDR protein kinase family has been implicated in many cellular processes and LATS1/2 has been shown to suppress tumor growth [23,24,25,27,30,32]. In our in vitro binding assay, both hmob1a and hmob1b have demonstrated strong interactions with NDR and tumor suppressor LATS. Therefore, this suggests that hmobs may also play a crucial role in cell proliferation and tumor growth. However, no functional analysis has been done on hmobs. If the function of dmob1 is conserved with hmob1 as demonstrated by Lai et al. in Drosophila [59], over-expression or suppression of hmob1 may have an impact on cell proliferation Over-expression of hmob1b suppresses cell proliferation. Since hmob1a and hmob1b share 97% identity and hmob1b has been widely studied [45,61-66], hmob1b was used in our experiment to examine its effects on tumor cell growth in vivo. Additionally, membrane-targeting of hmob1 has been demonstrated to increase LATS1 kinase activity dramatically [66], therefore, we also examined 45
72 Figure 12. Single mutation of residue P48 or Y114 of hmob1b is not sufficient to abolish the hmob1b interaction with LATS1 or NDR1. 10μg of GST (control) or hmob1b P48A or Y114A mutant construct was incubated with 100μg of lysates of cells over-expressing LATS1 or NDR1. GST fusion proteins were precipitated with glutathione-sepharose beads and were separated on 10% SDS- PAGE along with one-tenth amounts of cell lysate (1/10 input) and then subsequently subject to western blot using α-flag antibody. The membrane was stained with 1% Ponceau S to visualize the GST fusion proteins used in the GST pull-down assays. A. Interaction of hmob1b mutants with LATS1. B. Interaction of hmob1b mutants with NDR1. 46
73
74 whether over-expressing hmob1b with myristoylation/palmitylation (mp) motif has an effect on cell proliferation. HeLa cervical carcinoma cells were used for cell proliferation assays because it has been previously shown that over-expression of LATS1 or LATS2 inhibits cell proliferation by inducing cell cycle arrest in HeLa cells [24,80]. First, HeLa cells were stably infected with a lentivirus expressing vector (WPI) or hmob1b or mphmob1b. The efficiency of the lentivirus infection into HeLa cells was monitored by microscopic examination of green fluorescent protein (GFP) which is expressed by the lentivirus (Figure 13). Approximately % of cells were expressing GFP. The HAhMOB1B or mp-ha-hmob1b protein expression was also analyzed by western blotting. Unfortunately, we were unable to detect mp-ha-hmob1b protein using anti-ha antibody by western blot or immunofluorescent staining (data not shown). It is possible that HA tag is masked by the myristoylation motif which is the sequence for directing the protein to the membrane. Therefore, we used a commercially available anti-mob1b antibody to detect mp-ha-hmob1b. Although we found that this supposedly antihmob1b antibody can detect hmob1a, hmob1b and other hmobs (data not shown), under low exposure, both over-expressed HA-hMOB1B and mp-ha-hmob1b can be readily detected using this anti-hmob1b antibody. The mp-ha-hmob1b protein migrates slightly slower than the HA-hMOB1B protein on the SDS-PAGE due to the additional myristoylation motif, suggesting the antibody did detect both HA-hMOB1B and mp-ha-hmob1b (Figure 14A). Cell proliferation was subsequently analyzed using the established stable cell lines. Compared to HeLa-WPI, a significantly slower growth rate is observed in HeLa cells 47
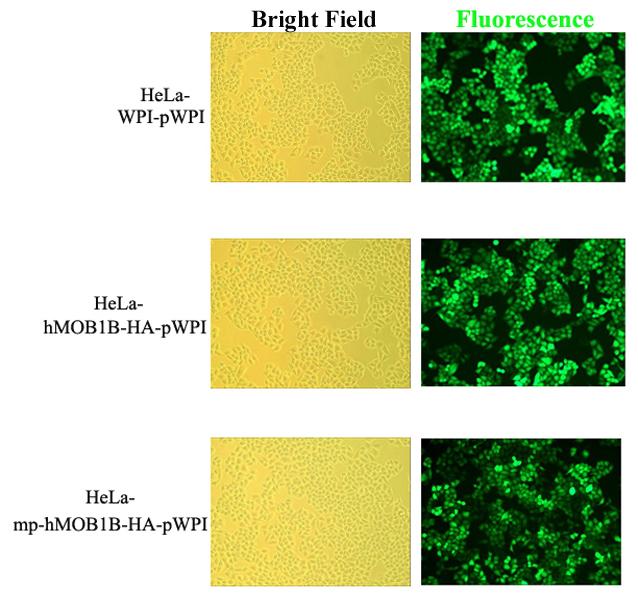
75 Figure 13. Efficiency of lentivirus expression into HeLa cells. HeLa cells were infected with lentivirus expressing WPI (vector), hmob1b, or mphmob1b. Images were obtained with a Nikon Eclipse TE 1000-U Inverted Fluorescent Microscope two days after infection. Approximately % of HeLa cells were expressing GFP. 48
76
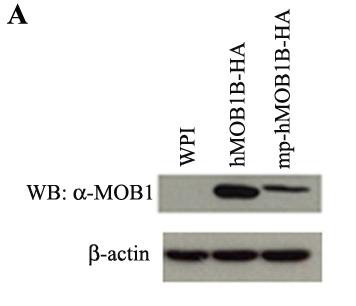
77 Figure 14. Effect of over-expression of hmob1b on cell proliferation. A. Expression of hmob1b. Cell lysates from HeLa cells expressing WPI (control), hmob1b or mp-hmob1b were subject to western blot using a commercial anti-mob1b antibody. B. Cell proliferation assay. Triplicates of HeLa cells stably expressing WPI (vector), hmob1b or mp-hmob1b were seeded into each well of a 24-well plate. Cells were counted two days after seeding for five consecutive days. The mean ± standard deviation (SD) of cell numbers from three independent samples for each day is shown. 49
78
79 over-expressing hmob1b (Figure 14B), suggesting that over-expression of hmob1b can inhibit tumor cell proliferation. As expected, compared to hmob1b over-expression, although the protein level of mp-hmob1b is lower than that of hmob1b in the cells (Figure 14A), mp-hmob1b caused a more dramatic suppression of cell proliferation Loss of hmob1 stimulates cell proliferation Since hmob1a and hmob1b are 97% identical and both strongly bind with LATS/NDR family proteins [45,61-66], we predict that they may have similar functions in the cell. To further verify the tumor suppression phenotype of hmob1b, we examined the loss of function of hmob1 on cell proliferation by suppressing endogenous hmob1a or hmob1b using sirna. hmob1a and hmob1b are highly identical and in fact, they are less than 10 amino acids different. Therefore, it is rather hard to distinguish these two proteins by hmob1b antibody. In addition, as stated above, the anti-hmob1b antibody recognizes multiple hmobs. Therefore, real time qrt-pcr was employed to confirm the knockdown of endogenous hmob1a and hmob1b to specifically amplify hmob1a or hmob1b. Two sets of primers specific for hmob1a or hmob1b mrna (see Table 5 for primer sequences) can amplify a region of about 100bp cdna after qrt-pcr. Transfection of sirna against either hmob1a or hmob1b significantly decreased their mrna levels. The mrna level of hmob1a was reduced by over 60% (Figure 15A) and hmob1b is reduced by 84% compared to control HeLa cells (Figure 15B). Moreover, the reduction of mrna levels was enhanced when both hmob1a and hmob1b were suppressed by sirna (Figure 15A and B). While 50
80 Figure 15. Knockdown of hmob1a and hmob1b by sirna. HeLa cells were transfected with sirna against endogenous hmob1a or hmob1b or hmob1a and hmob1b. RNA was extracted and quantified by real time-pcr. A. hmob1a expression. Endogenous hmob1a mrna level was reduced for at least 60%. B. hmob1b expression. Endogenous hmob1b mrna level was reduced for at least 80%. 51
81
82 knockdown of either hmob1a or hmob1b has led to a significant increase in cell proliferation, suppression of both hmob1a and hmob1b in HeLa cells caused an even more dramatic increase in cell proliferation (Figure 16). These findings suggest that both hmob1a and hmob1b may be tumor suppressors that can complement each other and that loss of hmob1 causes uncontrolled cell proliferation Over-expression of hmob1b enhances LATS-induced inhibition of cell proliferation It was previously shown that LATS requires hmob1 to activate its kinase activity to regulate cell proliferation [64,66]. However, there is no direct experimental evidence to show that human LATS and hmob1 functionally interact with each other in tumor suppression. To examine the relationship between LATS kinases and hmob1b, lentivirus expressing LATS [73] were co-infected together with hmob1b or mphmob1b into HeLa cells for cell proliferation assay. Compared to the HeLa cells that were infected with hmob1b, mp-hmob1b, LATS1 or LATS2 alone, over-expression of LATS1 or LATS2 with mp-hmob1b suppresses cell proliferation to a greater extent (Figure 17). In addition, over-expression of LATS2 with hmob1b reduces cell growth more than that of LATS1 with hmob1b. Our preliminary experiment suggests that hmob1b negatively regulates cell proliferation by interacting with LATS1 and LATS2 kinases. 52
83 Figure 16. Effect of loss of hmob1 on cell proliferation. HeLa cells were transfected with 25-50nM sirna against non-existing human genes (Control), hmob1a, hmob1b or hmob1a and hmob1b. Cells were counted everyday for four consecutive days post transfection. 53
84
85 Figure 17. Effect of over-expression of LATS and hmob1b upon cell proliferation. Cell proliferation assay. Triplicates of HeLa cells were seeded into each well of a 12-well plate and infected with WPI (vector) lentivirus as control or with individual or combination of LATS1 or LATS2 and/or hmob1b or mp-hmob1b lentivirus at a multiplicity of infection of 1.0. Cells were counted five days after infection. The mean ± standard deviation (SD) of cell numbers from three independent samples is shown. 54
86
87 3.5. Effect of hmob1b on cell death. Most of the tumor suppressors inhibit tumor cell growth by inducing either cell cycle arrest or apoptosis. Previous studies showed that over-expression of LATS1 or LATS2 stimulates apoptosis in both MCF7 and HCT116 tumor cells [24,27]. Since hmob1b binds to LATS kinases, we questioned whether hmob1b is able to induce apoptosis in MCF7 and HCT116 tumor cells as well. WPI vector or hmob1b or mphmob1b was transiently infected into MCF7 or HCT116 cells and cell death was analyzed 4 days after lentiviral infection by the trypan blue exclusion method. Compared to control cells without any virus infection, infection of the WPI lentivirus vector did not cause any significant cell death. However, over-expression of hmob1b stimulated cell death in both MCF7 (Figure 18A) and HCT116 cells (Figure 18B). Moreover, overexpression of membrane-targeting mp-hmob1b caused twice as much cell death of both MCF7 and HCT116 cells compared to that of hmob1b (Figure 18A and B). Our findings suggest that over-expression of hmob1b induces cell death in tumor cells Examination of the effect of hmob1 on cell cycle progression through FACS analysis It has been previously shown that LATS1 can inhibit cell proliferation by causing G 2 /M cell cycle arrest [24,27], whereas over-expression of LATS2 induces either G 1 /S or G 2 /M cell cycle arrest [27,80,81]. Therefore, in this experiment, we also investigated whether 55
88 Figure 18. Effect of over-expression of hmob1b upon cell death. MCF7 or HCT116 cells were infected with WPI (Control), hmob1b or mp-hmob1b lentivirus at a multiplicity of infection of 1.0. Four days post infection, infected cells along with non-infected cells (control) were counted for percentage of cells stained by trypan blue (dead cells). The mean ± standard deviation (S.D.) from three independent samples is shown. A. MCF7. B. HCT
89
90 hmob1 would affect cell cycle progression. HeLa cells infected with WPI lentiviral vector, hmob1b or mp-hmob1b and HeLa cells transfected with sirna against both hmob1a and hmob1b were subject to FACS-based cell cycle analysis. Surprisingly, our results indicated that there was no significant change in any phase of the cell cycle progression (Figure 19). 57
91 Figure 19. Effect of hmob1 on cell cycle progression. FACS analysis of cell cycle profile of HeLa cells infected with lentivirus expressing WPI (vector), hmob1b, mp-hmob1b or cells transfected with sirna against a non-existing gene in human genome (CON) or both hmob1a and hmob1b. Three days after transfection, cells were collected and fixed in 1 PBS and 95% cold ethanol. Prior to FACS analysis, cells were treated with RNase A and stained with a propidium iodide solution. The stained cells were subsequently analyzed with a flow cytometer. The percentage of each cell cycle phase (G 1, S, G 2 /M) was calculated. 58
92 59
93 CHAPTER 4 DISCUSSION This thesis has characterized all seven members of the human MOB family in terms of their mrna expression in various human tissues, their subcellular localization and their ability to interact with members of the LATS/NDR kinase family. The most significant results of this study are that hmob1a and 1B are the primary binding partners for both LATS and NDR kinases and they have been demonstrated to negatively regulate cell proliferation and induce cell death. These findings suggest that hmob1a and 1B may be novel tumor suppressors that regulate critical cellular events Molecular characterization of the human MOB family The MOB genes are well conserved across species. Their roles in maintaining cell division and cytokinesis are well-established in budding yeast and fission yeast. Their tumor suppression function is also evident in Drosophila. However, the functions of the seven hmobs are in mammalian systems including humans are still unclear. As a first step in this investigation, RT-PCR analysis was used to determine hmobs expression in 20 different human tissues (Figure 6). All seven hmobs are selectively expressed in the mammalian systems, indicating that each of them might have different functions in different tissues. Most interestingly, hmob2b is the only hmob predominantly expressed in trachea, whereas hmob4 is the only hmob expressed in 59
94 kidney (Figure 6). It is possible that hmobs may be expressed in other cells and tissues not tested in this experiment, such as neurons, breast, skin and pancreatic tissues. Further analysis of hmobs in other human tissues will expand our knowledge of the hmob family in mammals. In this study, we have found that hmob1a/b, 2B, 3, and 5 are localized in both the nucleus and cytoplasm, and hmob4 is predominantly distributed in the nucleus, whereas hmob2a is only apparent in the cytoplasmic compartment (Figure 8). Our study represents the first report on the subcellular localization of hmob2a, 2B, and 3. Most interestingly, different from all other hmobs, hmob2a is solely localized in the cytoplasm, suggesting that it may have unique functions in the cells. However, different from our results, previous studies found that hmob1a and hmob1b were exclusively found in the cytoplasm, and hmob4 (called hmob2 in their paper) was detected either predominantly in the nucleus or in both nucleus and cytoplasm [65]. The reason for these differences is currently unknown. We have confirmed our hmob cdna sequences by sequencing all the plasmids used and our immunostaining results have also been confirmed using three different anti-ha antibodies (12C5, Y11, and H6908). Since sequences and GenBank Accession number of hmob cdna used in their studies are unknown, it is possible that they used different variants of hmobs in their studies. Nevertheless, our studies on the subcellular localization of hmob family members provide very useful information for the further characterization of the functions of different hmobs in the cells. 60
95 4.2. Interaction of hmobs with the LATS/NDR kinase family Previous evidence has demonstrated that hmob1 binds to and activates members of the LATS/NDR kinase family [45,62-66]. However, there is no evidence whether other members of the hmob family also bind LATS/NDR. Our interaction data have demonstrated that only hmob1a and hmob1b were able to bind strongly with LATS1/2 and NDR1/2 in vitro (Figure 9). Although further in vivo coimmuniprecipitation assays will finally confirm our results from in vitro, it is generally observed that no interaction will be found in vivo if there is no direct interaction of two proteins in vitro. Therefore, it is most likely that hmob1a and hmob1b are the major binding partners of LATS and NDR. Additionally, we have also found that the first 142 amino acids on hmob1b are critical for its interaction with LATS1 and NDR1 (Figure 11). This domain includes most of the conserved residues and the N-terminus of the protein. According to the crystal structure of hmob1b, these 142 amino acids contain a negatively charged conserved surface, which is suggested to be the site for kinase interaction. However, mutation of a single conserved residue (P48A and Y114A) in this region of hmob1b did not abolish its interaction with LATS1 or NDR1, suggesting that the whole structure of the 142 amino acids at the N-terminal region of hmob1b may be important for its interaction with LATS/NDR. This may explain why other members of hmobs (hmob2a/b, hmob3-5), which may have distinct protein structures due to nonconserved residues (Figure 3), did not bind strongly to LATS/NDR. Coincidentally, the hmob1-binding motif on LATS and NDR is made up of basic and hydrophobic residues, and hence, is positively charged. Previous study showed that a single mutation of the 61
96 residue R694 on the positively charged region of LATS1 can completely abolish its interaction with hmob1 and dramatically reduces LATS1 kinase activity [64]. Upon comparing the sequences between LATS2 and LATS1, a single mutation of arginine at the residue 657 into alanine on LATS2 located on the hmob1-binding motif was constructed and it was shown that the LATS2 R657A mutation is sufficient to abolish the hmob1 interaction (Figure 10). Therefore, the intactness of the negatively charged domain is essential for the hmob1b interaction with positively charged domains of LATS1 and NDR1 kinases. Our results are therefore consistent with the crystal structure of hmob1b, and furthermore elucidate a crucial residue R657 of LATS2 for binding. By identifying other crucial residues that are important for hmob1 interaction or LATS2 activation by hmob1, this will allow us to have a closer look of the significance of hmob1b and LATS2 interaction and their roles in cellular processes. Though the other members of the hmob family are not major binding partners of LATS/NDR kinase family, they may bind with other cellular proteins to exert important functions in the cell. A previous study showed that hmob5 forms a complex with protein phosphatase 2A, which may be involved in the modulation of cytoskeleton and membrane structures [67]. Moreover, a most recent study in Drosophila demonstrated that dmob4, which fails to bind with LATS and NDR, is involved in the organization of spindle poles with an unknown cellular protein [60]. Therefore, identifying the binding partners for the other hmobs is necessary to determine the importance of hmob proteins in cellular functions. 62
97 4.3. Regulation of cell proliferation by hmob1 In this and previous studies, hmob1 was demonstrated to be the major binding partner of the LATS/NDR kinase family. The LATS/NDR kinase family is involved in critical cellular processes such as cell proliferation and apoptosis. Activation of these kinases requires the interaction with hmob1, as reported previously [45,62-66]. LATS, the governor of G 1 /S and G 2 /M cell cycle arrest, is a tumor suppressor and has recently been identified as the major player in the emerging Hippo-LATS tumor suppressor pathway. Though hmob1 is required for the activation of LATS, not enough research has been done to investigate the functions of hmob1. Our experimental results carried out so far indicate that hmob1 is also a novel negative regulator of cell proliferation. Over-expression of hmob1b inhibits tumor cell proliferation (Figure 14B), whereas loss of hmob1a or hmob1b increases cell proliferation (Figure 16). Interestingly, suppression of both hmob1a and hmob1b leads to a more dramatic phenotype in cell proliferation compared to that of a single gene down-regulation. This observation suggests that both hmob1a and hmob1b are potential tumor suppressors and they complement each other in the regulation of cell proliferation. Their high sequence similarity, the same binding affinity with LATS/NDR kinase family, their identical pattern in tissue expression and the similar effect they have on cellular processes may underlie their synergistic effect. Additionally, over-expression of either LATS1 or LATS2 with hmob1b suppresses cell proliferation tremendously (Figure 17). Since LATS requires hmob1 for full activation, hmob1a and hmob1b may conduct their tumor suppressing functions through the LATS kinases. 63
98 Surprisingly, over-expression of hmob1b targeted to the plasma membrane has dramatically suppressed cell proliferation. As reported earlier, interaction of LATS or NDR with hmob1 targeted to the plasma membrane dramatically increased the kinase activities of NDR and LATS [65,66]. It is proposed in the mammalian Hippo-LATS pathway model that prior to the activation of LATS by hmob1, LATS and hmob1 must be phosphorylated by MST1 or MST2 kinases near the plasma membrane (Figure 4). Our findings are consistent with the previous studies and the suggested model. Therefore, we propose that hmob1a and hmob1b are also critical components of the newly emerging tumor suppressor Hippo-LATS signaling pathway. Since both LATS1 and LATS2 monitor the progression of the cell cycle closely [27,65], over-expression or suppression of hmob1 would affect the activities of both LATS1 and LATS2 in the regulation of cell cycle (Figure 19). However, no significant differences were reflected in our FACS cell cycle profiles as compared to that of the control cells. To further investigate whether hmob1b affects cell proliferation, BrdU (5-bromo-2-deoxyuridine) labeling could be employed to detect and quantify DNA synthesis of the proliferating cells. BrdU can be incorporated into the DNA during replication and then detected by BrdU specific antibodies to measure the amount of the newly synthesized DNA. Measurements can be done at different time points and the results compared with the control cells. An intriguing question that arises from these results is what is the molecular mechanism behind the interaction of LATS with hmob1a and hmob1b. We have found that loss of either hmob1a or hmob1b can cause enhanced cell proliferation, 64
99 suggesting that they may form a dimer to activate LATS. Unfortunately, no investigation has been reported on whether the members of hmob family have the ability to form homodimers or heterodimers. Our findings showed that the expression pattern of hmob1a and hmob1b in the human tissues are very similar and both proteins possess identical subcellular localizations and bind strongly to LATS/NDR family protein with similar affinity (Figures 6 and 8). The fact that the sequences of hmob1a and hmob1b are highly similar raises the intriguing possibility that hmob1a may associate with hmob1b to form a hmob1 heterodimer to fully activate LATS. Disruption of either hmob1a or hmob1b may compromise their functions in LATS regulation. Further experiments are required to confirm this possibility. Here, we propose that hmob1a and hmob1b may form a hmob1 heterodimer and it is phosphorylated by MST1/2 near the plasma membrane and subsequently activates LATS kinase to trigger downstream events (Figure 20). Therefore, over-expression of both hmob1a and hmob1b will lead to synergistic effects, whereas suppression of hmob1a or hmob1b or both will compromise or completely abolish their ability to activate LATS, which causes enhanced cell proliferation or tumorigenesis Over-expression of hmob1 induces cell death Our results indicated that over-expression of hmob1b increases cell death in human mammary and colorectal cancer cell lines (Figure 18). It was previously showed that LATS is also able to induce apoptosis through p53 in both cell lines tested [24,27]. 65
100 Figure 20. Proposed model for the molecular mechanism of hmob1a and hmob1b for LATS phosphorylation in the mammalian Hippo-LATS pathway. The synergistic effect of hmob1a and hmob1b suggests that hmob1a and hmob1b may form a hmob1 heterodimer prior to LATS activation to trigger downstream events in the Hippo-LATS pathway. Solid yellow arrows indicate reported relationships in activation, whereas the dashed arrow and the question mark indicate speculative relationships with an unknown mechanism. Perpendicular solid lines indicate reported relationships in inhibition. 66
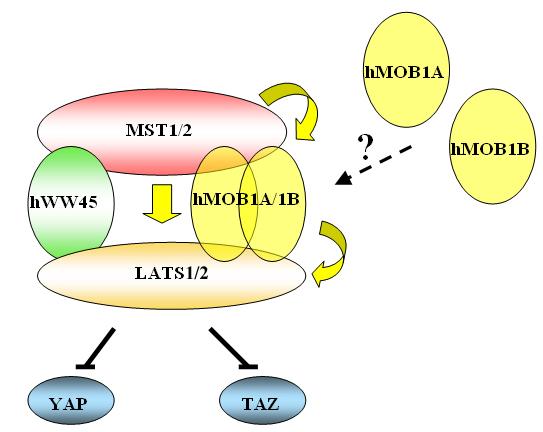
101
c Tuj1(-) apoptotic live 1 DIV 2 DIV 1 DIV 2 DIV Tuj1(+) Tuj1/GFP/DAPI Tuj1 DAPI GFP
 apoptotic live 1 DIV 2 DIV 1 DIV 2 DIV Tuj1(+) Tuj1/GFP/DAPI Tuj1 DAPI GFP") Supplementary Figure 1 Establishment of the gain- and loss-of-function experiments and cell survival assays. a Relative expression of mature mir-484 30 20 10 0 **** **** NCP mir- 484P NCP mir- 484P b Relative
Supplementary Figure 1 Establishment of the gain- and loss-of-function experiments and cell survival assays. a Relative expression of mature mir-484 30 20 10 0 **** **** NCP mir- 484P NCP mir- 484P b Relative
 www.lessonplansinc.com Topic: Protein Synthesis - Sentence Activity Summary: Students will simulate transcription and translation by building a sentence/polypeptide from words/amino acids. Goals & Objectives:
Supplementary Table 3. 3 UTR primer sequences. Primer sequences used to amplify and clone the 3 UTR of each indicated gene are listed.
 Supplemental Figure 1. DLKI-DIO3 mirna/mrna complementarity. Complementarity between the indicated DLK1-DIO3 cluster mirnas and the UTR of SOX2, SOX9, HIF1A, ZEB1, ZEB2, STAT3 and CDH1with mirsvr and PhastCons
Supplementary Figures
 Supplementary Figures Supplementary Figure 1. H3F3B expression in lung cancer. a. Comparison of H3F3B expression in relapsed and non-relapsed lung cancer patients. b. Prognosis of two groups of lung cancer
a) Primary cultures derived from the pancreas of an 11-week-old Pdx1-Cre; K-MADM-p53
 Primary cultures derived from the pancreas of an 11-week-old Pdx1-Cre; K-MADM-p53") 1 2 3 4 5 6 7 8 9 10 Supplementary Figure 1. Induction of p53 LOH by MADM. a) Primary cultures derived from the pancreas of an 11-week-old Pdx1-Cre; K-MADM-p53 mouse revealed increased p53 KO/KO (green,
1 2 3 4 5 6 7 8 9 10 Supplementary Figure 1. Induction of p53 LOH by MADM. a) Primary cultures derived from the pancreas of an 11-week-old Pdx1-Cre; K-MADM-p53 mouse revealed increased p53 KO/KO (green,
Figure S1. Analysis of genomic and cdna sequences of the targeted regions in WT-KI and
 Figure S1. Analysis of genomic and sequences of the targeted regions in and indicated mutant KI cells, with WT and corresponding mutant sequences underlined. (A) cells; (B) K21E-KI cells; (C) D33A-KI cells;
Supplemental Data. Shin et al. Plant Cell. (2012) /tpc YFP N
 /tpc YFP N") MYC YFP N PIF5 YFP C N-TIC TIC Supplemental Data. Shin et al. Plant Cell. ()..5/tpc..95 Supplemental Figure. TIC interacts with MYC in the nucleus. Bimolecular fluorescence complementation assay using
MYC YFP N PIF5 YFP C N-TIC TIC Supplemental Data. Shin et al. Plant Cell. ()..5/tpc..95 Supplemental Figure. TIC interacts with MYC in the nucleus. Bimolecular fluorescence complementation assay using
Supplementary Appendix
 Supplementary Appendix This appendix has been provided by the authors to give readers additional information about their work. Supplement to: Sherman SI, Wirth LJ, Droz J-P, et al. Motesanib diphosphate
The Cell T H E C E L L C Y C L E C A N C E R
 The Cell T H E C E L L C Y C L E C A N C E R Nuclear envelope Transcription DNA RNA Processing Pre-mRNA Translation mrna Nuclear pores Ribosome Polypeptide Transcription RNA is synthesized from DNA in
Supplementary Figure 1. ROS induces rapid Sod1 nuclear localization in a dosagedependent manner. WT yeast cells (SZy1051) were treated with 4NQO at
 were treated with 4NQO at") Supplementary Figure 1. ROS induces rapid Sod1 nuclear localization in a dosagedependent manner. WT yeast cells (SZy1051) were treated with 4NQO at different concentrations for 30 min and analyzed for
Supplementary Figure 1. ROS induces rapid Sod1 nuclear localization in a dosagedependent manner. WT yeast cells (SZy1051) were treated with 4NQO at different concentrations for 30 min and analyzed for
Nature Structural & Molecular Biology: doi: /nsmb Supplementary Figure 1
 Supplementary Figure 1 U1 inhibition causes a shift of RNA-seq reads from exons to introns. (a) Evidence for the high purity of 4-shU-labeled RNAs used for RNA-seq. HeLa cells transfected with control
Supplementary Document
 Supplementary Document 1. Supplementary Table legends 2. Supplementary Figure legends 3. Supplementary Tables 4. Supplementary Figures 5. Supplementary References 1. Supplementary Table legends Suppl.
CD31 5'-AGA GAC GGT CTT GTC GCA GT-3' 5 ' -TAC TGG GCT TCG AGA GCA GT-3'
 Table S1. The primer sets used for real-time RT-PCR analysis. Gene Forward Reverse VEGF PDGFB TGF-β MCP-1 5'-GTT GCA GCA TGA ATC TGA GG-3' 5'-GGA GAC TCT TCG AGG AGC ACT T-3' 5'-GAA TCA GGC ATC GAG AGA
Supplementary Materials
 Supplementary Materials 1 Supplementary Table 1. List of primers used for quantitative PCR analysis. Gene name Gene symbol Accession IDs Sequence range Product Primer sequences size (bp) β-actin Actb gi
A smart acid nanosystem for ultrasensitive. live cell mrna imaging by the target-triggered intracellular self-assembly
 Electronic Supplementary Material (ESI) for Chemical Science. This journal is The Royal Society of Chemistry 2017 A smart ZnO@polydopamine-nucleic acid nanosystem for ultrasensitive live cell mrna imaging
Bacterial Gene Finding CMSC 423
 Bacterial Gene Finding CMSC 423 Finding Signals in DNA We just have a long string of A, C, G, Ts. How can we find the signals encoded in it? Suppose you encountered a language you didn t know. How would
Supplementary Figure 1 a
 Supplementary Figure a Normalized expression/tbp (A.U.).6... Trip-br transcripts Trans Trans Trans b..5. Trip-br Ctrl LPS Normalized expression/tbp (A.U.) c Trip-br transcripts. adipocytes.... Trans Trans
Table S1. Oligonucleotides used for the in-house RT-PCR assays targeting the M, H7 or N9. Assay (s) Target Name Sequence (5 3 ) Comments
 Target Name Sequence (5 3 ) Comments") SUPPLEMENTAL INFORMATION 2 3 Table S. Oligonucleotides used for the in-house RT-PCR assays targeting the M, H7 or N9 genes. Assay (s) Target Name Sequence (5 3 ) Comments CDC M InfA Forward (NS), CDC M
SUPPLEMENTAL INFORMATION 2 3 Table S. Oligonucleotides used for the in-house RT-PCR assays targeting the M, H7 or N9 genes. Assay (s) Target Name Sequence (5 3 ) Comments CDC M InfA Forward (NS), CDC M
Plasmids Western blot analysis and immunostaining Flow Cytometry Cell surface biotinylation RNA isolation and cdna synthesis
 Plasmids psuper-retro-s100a10 shrna1 was constructed by cloning the dsdna oligo 5 -GAT CCC CGT GGG CTT CCA GAG CTT CTT TCA AGA GAA GAA GCT CTG GAA GCC CAC TTT TTA-3 and 5 -AGC TTA AAA AGT GGG CTT CCA GAG
Protein sequence alignment using binary string
 Available online at www.scholarsresearchlibrary.com Scholars Research Library Der Pharmacia Lettre, 2015, 7 (5):220-225 (http://scholarsresearchlibrary.com/archive.html) ISSN 0975-5071 USA CODEN: DPLEB4
Toluidin-Staining of mast cells Ear tissue was fixed with Carnoy (60% ethanol, 30% chloroform, 10% acetic acid) overnight at 4 C, afterwards
 overnight at 4 C, afterwards") Toluidin-Staining of mast cells Ear tissue was fixed with Carnoy (60% ethanol, 30% chloroform, 10% acetic acid) overnight at 4 C, afterwards incubated in 100 % ethanol overnight at 4 C and embedded in
Toluidin-Staining of mast cells Ear tissue was fixed with Carnoy (60% ethanol, 30% chloroform, 10% acetic acid) overnight at 4 C, afterwards incubated in 100 % ethanol overnight at 4 C and embedded in
Abbreviations: P- paraffin-embedded section; C, cryosection; Bio-SA, biotin-streptavidin-conjugated fluorescein amplification.
 Supplementary Table 1. Sequence of primers for real time PCR. Gene Forward primer Reverse primer S25 5 -GTG GTC CAC ACT ACT CTC TGA GTT TC-3 5 - GAC TTT CCG GCA TCC TTC TTC-3 Mafa cds 5 -CTT CAG CAA GGA
Supplementary Figure 1 MicroRNA expression in human synovial fibroblasts from different locations. MicroRNA, which were identified by RNAseq as most
 Supplementary Figure 1 MicroRNA expression in human synovial fibroblasts from different locations. MicroRNA, which were identified by RNAseq as most differentially expressed between human synovial fibroblasts
BIOLOGY 621 Identification of the Snorks
 Name: Date: Block: BIOLOGY 621 Identification of the Snorks INTRODUCTION: In this simulation activity, you will examine the DNA sequence of a fictitious organism - the Snork. Snorks were discovered on
Nature Immunology: doi: /ni.3836
 Supplementary Figure 1 Recombinant LIGHT-VTP induces pericyte contractility and endothelial cell activation. (a) Western blot showing purification steps for full length murine LIGHT-VTP (CGKRK) protein:
Biology 12 January 2004 Provincial Examination
 Biology 12 January 2004 Provincial Examination ANSWER KEY / SCORING GUIDE CURRICULUM: Organizers 1. Cell Biology 2. Cell Processes and Applications 3. Human Biology Sub-Organizers A, B, C, D E, F, G, H
Phylogenetic analysis of human and chicken importins. Only five of six importins were studied because
 Supplementary Figure S1 Phylogenetic analysis of human and chicken importins. Only five of six importins were studied because importin-α6 was shown to be testis-specific. Human and chicken importin protein
SUPPLEMENTARY INFORMATION
 doi: 10.1038/nature05883 SUPPLEMENTARY INFORMATION Supplemental Figure 1 Prostaglandin agonists and antagonists alter runx1/cmyb expression. a-e, Embryos were exposed to (b) PGE2 and (c) PGI2 (20μM) and
BHP 2-7 and Nthy-ori 3-1 cells were grown in RPMI1640 medium (Hyclone) supplemented with 10% fetal bovine serum (Gibco), 2mM L-glutamine, and 100 U/mL
 supplemented with 10% fetal bovine serum (Gibco), 2mM L-glutamine, and 100 U/mL") 1 2 3 4 Materials and Methods Cell culture BHP 2-7 and Nthy-ori 3-1 cells were grown in RPMI1640 medium (Hyclone) 5 supplemented with 10% fetal bovine serum (Gibco), 2mM L-glutamine, and 100 U/mL 6 penicillin-streptomycin.
1 2 3 4 Materials and Methods Cell culture BHP 2-7 and Nthy-ori 3-1 cells were grown in RPMI1640 medium (Hyclone) 5 supplemented with 10% fetal bovine serum (Gibco), 2mM L-glutamine, and 100 U/mL 6 penicillin-streptomycin.
Citation for published version (APA): Oosterveer, M. H. (2009). Control of metabolic flux by nutrient sensors Groningen: s.n.
: Oosterveer, M. H. (2009). Control of metabolic flux by nutrient sensors Groningen: s.n.") University of Groningen Control of metabolic flux by nutrient sensors Oosterveer, Maaike IMPORTANT NOTE: You are advised to consult the publisher's version (publisher's PDF) if you wish to cite from it.
University of Groningen Control of metabolic flux by nutrient sensors Oosterveer, Maaike IMPORTANT NOTE: You are advised to consult the publisher's version (publisher's PDF) if you wish to cite from it.
Supplementary Figure 1
 Supplementary Figure 1 Supplementary Figure 1. Lats1/2 deleted ihbs and ihps showed decreased transcripts of hepatocyte related genes (a and b) Western blots (a) and recombination PCR (b) of control and
Supplementary Figure 1
 Supplementary Figure 1 3 3 3 1 1 Bregma -1.6mm 3 : Bregma Ref) Http://www.mbl.org/atlas165/atlas165_start.html Bregma -.18mm Supplementary Figure 1 Schematic representation of the utilized brain slice
Supplementary Table 2. Conserved regulatory elements in the promoters of CD36.
 Supplementary Table 1. RT-qPCR primers for CD3, PPARg and CEBP. Assay Forward Primer Reverse Primer 1A CAT TTG TGG CCT TGT GCT CTT TGA TGA GTC ACA GAA AGA ATC AAT TC 1B AGG AAA TGA ACT GAT GAG TCA CAG
L I F E S C I E N C E S
 1a L I F E S C I E N C E S 5 -UUA AUA UUC GAA AGC UGC AUC GAA AAC UGU GAA UCA-3 5 -TTA ATA TTC GAA AGC TGC ATC GAA AAC TGT GAA TCA-3 3 -AAT TAT AAG CTT TCG ACG TAG CTT TTG ACA CTT AGT-5 OCTOBER 31, 2006
SUPPLEMENTARY DATA. Supplementary Table 1. Primer sequences for qrt-pcr
 Supplementary Table 1. Primer sequences for qrt-pcr Gene PRDM16 UCP1 PGC1α Dio2 Elovl3 Cidea Cox8b PPARγ AP2 mttfam CyCs Nampt NRF1 16s-rRNA Hexokinase 2, intron 9 β-actin Primer Sequences 5'-CCA CCA GCG
Supplementary Materials and Methods
 DD2 suppresses tumorigenicity of ovarian cancer cells by limiting cancer stem cell population Chunhua Han et al. Supplementary Materials and Methods Analysis of publicly available datasets: To analyze
Culture Density (OD600) 0.1. Culture Density (OD600) Culture Density (OD600) Culture Density (OD600) Culture Density (OD600)
 0.1. Culture Density (OD600) Culture Density (OD600) Culture Density (OD600) Culture Density (OD600)") A. B. C. D. E. PA JSRI JSRI 2 PA DSAM DSAM 2 DSAM 3 PA LNAP LNAP 2 LNAP 3 PAO Fcor Fcor 2 Fcor 3 PAO Wtho Wtho 2 Wtho 3 Wtho 4 DTSB Low Iron 2 4 6 8 2 4 6 8 2 22 DTSB Low Iron 2 4 6 8 2 4 6 8 2 22 DTSB
A. B. C. D. E. PA JSRI JSRI 2 PA DSAM DSAM 2 DSAM 3 PA LNAP LNAP 2 LNAP 3 PAO Fcor Fcor 2 Fcor 3 PAO Wtho Wtho 2 Wtho 3 Wtho 4 DTSB Low Iron 2 4 6 8 2 4 6 8 2 22 DTSB Low Iron 2 4 6 8 2 4 6 8 2 22 DTSB
Supplementary Figure 1
 Supplementary Figure 1 Supplementary Figure 1: Cryopreservation alters CD62L expression by CD4 T cells. Freshly isolated (left) or cryopreserved PBMCs (right) were stained with the mix of antibodies described
Supplementary Figure 1a
 Supplementary Figure 1a Hours: E-cadherin TGF-β On TGF-β Off 0 12 24 36 48 24 48 72 Vimentin βactin Fig. S1a. Treatment of AML12 cells with TGF-β induces EMT. Treatment of AML12 cells with TGF-β results
Chapt 15: Molecular Genetics of Cell Cycle and Cancer
 Chapt 15: Molecular Genetics of Cell Cycle and Cancer Student Learning Outcomes: Describe the cell cycle: steps taken by a cell to duplicate itself = cell division; Interphase (G1, S and G2), Mitosis.
*To whom correspondence should be addressed. This PDF file includes:
 www.sciencemag.org/cgi/content/full/science.1212182/dc1 Supporting Online Material for Partial Retraction to Detection of an Infectious Retrovirus, XMRV, in Blood Cells of Patients with Chronic Fatigue
Cross-talk between mineralocorticoid and angiotensin II signaling for cardiac
 ONLINE SUPPLEMENT TO Crosstalk between mineralocorticoid and angiotensin II signaling for cardiac remodeling An Di ZHANG,,3, Aurelie NGUYEN DINH CAT*,,3, Christelle SOUKASEUM *,,3, Brigitte ESCOUBET, 4,
Beta Thalassemia Case Study Introduction to Bioinformatics
 Beta Thalassemia Case Study Sami Khuri Department of Computer Science San José State University San José, California, USA sami.khuri@sjsu.edu www.cs.sjsu.edu/faculty/khuri Outline v Hemoglobin v Alpha
A basic helix loop helix transcription factor controls cell growth
 A basic helix loop helix transcription factor controls cell growth and size in root hairs Keke Yi 1,2, Benoît Menand 1,3, Elizabeth Bell 1, Liam Dolan 1,4 Supplementary note Low soil phosphate availability
Journal of Cell Science Supplementary information. Arl8b +/- Arl8b -/- Inset B. electron density. genotype
 J. Cell Sci. : doi:.4/jcs.59: Supplementary information E9. A Arl8b /- Arl8b -/- Arl8b Arl8b non-specific band Gapdh Tbp E7.5 HE Inset B D Control al am hf C E Arl8b -/- al am hf E8.5 F low middle high
Beta Thalassemia Sami Khuri Department of Computer Science San José State University Spring 2015
 Bioinformatics in Medical Product Development SMPD 287 Three Beta Thalassemia Sami Khuri Department of Computer Science San José State University Hemoglobin Outline Anatomy of a gene Hemoglobinopathies
Astaxanthin prevents and reverses diet-induced insulin resistance and. steatohepatitis in mice: A comparison with vitamin E
 Supplementary Information Astaxanthin prevents and reverses diet-induced insulin resistance and steatohepatitis in mice: A comparison with vitamin E Yinhua Ni, 1,2 Mayumi Nagashimada, 1 Fen Zhuge, 1 Lili
Protocol for Gene Transfection & Western Blotting
 The schedule and the manual of basic techniques for cell culture Advanced Protocol for Gene Transfection & Western Blotting Schedule Day 1 26/07/2008 Transfection Day 3 28/07/2008 Cell lysis Immunoprecipitation
Supplemental Information. Cancer-Associated Fibroblasts Neutralize. the Anti-tumor Effect of CSF1 Receptor Blockade
 Cancer Cell, Volume 32 Supplemental Information Cancer-Associated Fibroblasts Neutralize the Anti-tumor Effect of CSF1 Receptor Blockade by Inducing PMN-MDSC Infiltration of Tumors Vinit Kumar, Laxminarasimha
TetR repressor-based bioreporters for the detection of doxycycline using Escherichia
 Supplementary materials TetR repressor-based bioreporters for the detection of doxycycline using Escherichia coli and Acinetobacter oleivorans Hyerim Hong and Woojun Park * Department of Environmental
Supplementary Figure 1
 Metastatic melanoma Primary melanoma Healthy human skin Supplementary Figure 1 CD22 IgG4 Supplementary Figure 1: Immunohisochemical analysis of CD22+ (left) and IgG4 (right), cells (shown in red and indicated
Formylpeptide receptor2 contributes to colon epithelial homeostasis, inflammation, and tumorigenesis
 Supplementary Data Formylpeptide receptor2 contributes to colon epithelial homeostasis, inflammation, and tumorigenesis Keqiang Chen, Mingyong Liu, Ying Liu, Teizo Yoshimura, Wei Shen, Yingying Le, Scott
Description of Supplementary Files. File Name: Supplementary Information Description: Supplementary Figures and Supplementary Tables
 Description of Supplementary Files File Name: Supplementary Information Description: Supplementary Figures and Supplementary Tables Supplementary Figure 1: (A), HCT116 IDH1-WT and IDH1-R132H cells were
The Schedule and the Manual of Basic Techniques for Cell Culture
 The Schedule and the Manual of Basic Techniques for Cell Culture 1 Materials Calcium Phosphate Transfection Kit: Invitrogen Cat.No.K2780-01 Falcon tube (Cat No.35-2054:12 x 75 mm, 5 ml tube) Cell: 293
Supplemental Information. Th17 Lymphocytes Induce Neuronal. Cell Death in a Human ipsc-based. Model of Parkinson's Disease
 Cell Stem Cell, Volume 23 Supplemental Information Th17 Lymphocytes Induce Neuronal Cell Death in a Human ipsc-based Model of Parkinson's Disease Annika Sommer, Franz Maxreiter, Florian Krach, Tanja Fadler,
Regulators of Cell Cycle Progression
 Regulators of Cell Cycle Progression Studies of Cdk s and cyclins in genetically modified mice reveal a high level of plasticity, allowing different cyclins and Cdk s to compensate for the loss of one
SUPPORTING INFORMATION
 SUPPORTING INFORMATION Biology is different in small volumes: endogenous signals shape phenotype of primary hepatocytes cultured in microfluidic channels Amranul Haque, Pantea Gheibi, Yandong Gao, Elena
Single-Molecule Analysis of Gene Expression Using Two-Color RNA- Labeling in Live Yeast
 Supplemental Figures, Tables and Results Single-Molecule Analysis of Gene Expression Using Two-Color RNA- Labeling in Live Yeast Sami Hocine 1, Pascal Raymond 2, Daniel Zenklusen 2, Jeffrey A. Chao 1 &
Supporting Information
 Supporting Information Malapeira et al. 10.1073/pnas.1217022110 SI Materials and Methods Plant Material and Growth Conditions. A. thaliana seedlings were stratified at 4 C in the dark for 3 d on Murashige
Integration Solutions
 Integration Solutions (1) a) With no active glycosyltransferase of either type, an ii individual would not be able to add any sugars to the O form of the lipopolysaccharide. Thus, the only lipopolysaccharide
without LOI phenotype by breeding female wild-type C57BL/6J and male H19 +/.
 Sakatani et al. 1 Supporting Online Material Materials and methods Mice and genotyping: H19 mutant mice with C57BL/6J background carrying a deletion in the structural H19 gene (3 kb) and 10 kb of 5 flanking
Supplemental Figures: Supplemental Figure 1
 Supplemental Figures: Supplemental Figure 1 Suppl. Figure 1. BM-DC infection with H. pylori does not induce cytotoxicity and treatment of BM-DCs with H. pylori sonicate, but not heat-inactivated bacteria,
Isolate Sexual Idiomorph Species
 SUPLEMENTARY TABLE 1. Isolate identification, sexual idiomorph and species of each isolate used for MAT locus distribution in Paracoccidioides species. Isolate Sexual Idiomorph Species Pb01 MAT1-1 P. lutzii
Nucleotide Sequence of the Australian Bluetongue Virus Serotype 1 RNA Segment 10
 J. gen. Virol. (1988), 69, 945-949. Printed in Great Britain 945 Key words: BTV/genome segment lo/nucleotide sequence Nucleotide Sequence of the Australian Bluetongue Virus Serotype 1 RNA Segment 10 By
The transfer RNA genes in Oryza sativa L. ssp. indica
 Vol. 45 No. 5 SCIENCE IN CHINA (Series C) October 2002 The transfer RNA genes in Oryza sativa L. ssp. indica WANG Xiyin ( ) 1,2,3*, SHI Xiaoli ( ) 1,2* & HAO Bailin ( ) 2,4 1. College of Life Science,
What do you think of when you here the word genome?
 What do you think of when you here the word genome? What do you think of when you here the word genome? Personal Genomics Outline Review of pre-lab work Genomics and Medicine Case Overview & Assignment
Supplementary Information
 Supplementary Information Remodeling of heterochromatin structure slows neuropathological progression and prolongs survival in an animal model of Huntington s disease Junghee Lee, Yu Jin Hwang, Yunha Kim,
Supplementary data Supplementary Figure 1 Supplementary Figure 2
 Supplementary data Supplementary Figure 1 SPHK1 sirna increases RANKL-induced osteoclastogenesis in RAW264.7 cell culture. (A) RAW264.7 cells were transfected with oligocassettes containing SPHK1 sirna
ice-cold 70% ethanol with gentle vortexing, incubated at -20 C for 4 hours, and washed with PBS.
 Cell cycle analysis For cell cycle analysis, single cell suspensions of E12.5 fetal liver cells were suspended in 4 ml ice-cold 7% ethanol with gentle vortexing, incubated at -2 C for 4 hours, and washed
Lezione 10. Sommario. Bioinformatica. Lezione 10: Sintesi proteica Synthesis of proteins Central dogma: DNA makes RNA makes proteins Genetic code
 Lezione 10 Bioinformatica Mauro Ceccanti e Alberto Paoluzzi Lezione 10: Sintesi proteica Synthesis of proteins Dip. Informatica e Automazione Università Roma Tre Dip. Medicina Clinica Università La Sapienza
Baseline clinical characteristics for the 81 CMML patients Routine diagnostic testing and statistical analyses... 3
 Next-Generation Sequencing Technology Reveals a Characteristic Pattern of Molecular Mutations in 72.8% of Chronic Myelomonocytic Leukemia (CMML) by Detecting Frequent Alterations in TET2, CBL, RAS, and
McAlpine PERK-GSK3 regulates foam cell formation. Supplemental Material. Supplementary Table I. Sequences of real time PCR primers.
 Mclpine PERK-GSK3 regulates foam cell formation Supplemental Material Supplementary Table I. Sequences of real time PCR primers. Primer Name Primer Sequences (5-3 ) Product Size (bp) GRP78 (human) Fwd:
CIRCRESAHA/2004/098145/R1 - ONLINE 1. Validation by Semi-quantitative Real-Time Reverse Transcription PCR
 CIRCRESAHA/2004/098145/R1 - ONLINE 1 Expanded Materials and Methods Validation by Semi-quantitative Real-Time Reverse Transcription PCR Expression patterns of 13 genes (Online Table 2), selected with respect
Development of RT-qPCR-based molecular diagnostic assays for therapeutic target selection of breast cancer patients
 Development of RT-qPCR-based molecular diagnostic assays for therapeutic target selection of breast cancer patients Sangjung Park The Graduate School Yonsei University Department of Biomedical Laboratory
The functional investigation of the interaction between TATA-associated factor 3 (TAF3) and p53 protein
 and p53 protein") THESIS BOOK The functional investigation of the interaction between TATA-associated factor 3 (TAF3) and p53 protein Orsolya Buzás-Bereczki Supervisors: Dr. Éva Bálint Dr. Imre Miklós Boros University of
THESIS BOOK The functional investigation of the interaction between TATA-associated factor 3 (TAF3) and p53 protein Orsolya Buzás-Bereczki Supervisors: Dr. Éva Bálint Dr. Imre Miklós Boros University of
General aspects of bacteriology, bacterial structure and growth. Che-Hsin Lee, Ph.D. Department of Biological Sciences National Sun Yat-senUniversity
 General aspects of bacteriology, bacterial structure and growth Che-Hsin Lee, Ph.D. Department of Biological Sciences National Sun Yat-senUniversity 1 Human Microbiome Project Providing metabolic function
Lecture 10. G1/S Regulation and Cell Cycle Checkpoints. G1/S regulation and growth control G2 repair checkpoint Spindle assembly or mitotic checkpoint
 Lecture 10 G1/S Regulation and Cell Cycle Checkpoints Outline: G1/S regulation and growth control G2 repair checkpoint Spindle assembly or mitotic checkpoint Paper: The roles of Fzy/Cdc20 and Fzr/Cdh1
Expression of Selected Inflammatory Cytokine Genes in Bladder Biopsies
 Borneo Journal of Resource Science and Technology (2013) 3(2): 15-20 Expression of Selected Inflammatory Cytokine Genes in Bladder Biopsies EDMUND UI-HANG SIM *1, NUR DIANA ANUAR 2, TENG-AIK ONG 3, GUAN-
Supplementary information
 Supplementary information Unique polypharmacology nuclear receptor modulator blocks inflammatory signaling pathways Mi Ra Chang 1, Anthony Ciesla 1, Timothy S. Strutzenberg 1, Scott J. Novick 1, Yuanjun
Supporting Information
 Supporting Information Molecular Recognition Based DNA Nanoassemblies on the Surfaces of Nanosized Exosomes Shuo Wan,, Liqin Zhang,,, Sai Wang, Yuan Liu,, Cuichen Wu, Cheng Cui, Hao Sun, Muling Shi, Ying
Supplementary Information. Bamboo shoot fiber prevents obesity in mice by. modulating the gut microbiota
 Supplementary Information Bamboo shoot fiber prevents obesity in mice by modulating the gut microbiota Xiufen Li 1,2, Juan Guo 1, Kailong Ji 1,2, and Ping Zhang 1,* 1 Key Laboratory of Tropical Plant Resources
CHAPTER 4 RESULTS. showed that all three replicates had similar growth trends (Figure 4.1) (p<0.05; p=0.0000)
 (p<0.05; p=0.0000)") CHAPTER 4 RESULTS 4.1 Growth Characterization of C. vulgaris 4.1.1 Optical Density Growth study of Chlorella vulgaris based on optical density at 620 nm (OD 620 ) showed that all three replicates had similar
CHAPTER 4 RESULTS 4.1 Growth Characterization of C. vulgaris 4.1.1 Optical Density Growth study of Chlorella vulgaris based on optical density at 620 nm (OD 620 ) showed that all three replicates had similar
Recommended laboratory tests to identify influenza A/H5 virus in specimens from patients with an influenza-like illness
 World Health Organization Recommended laboratory tests to identify influenza A/H5 virus in specimens from patients with an influenza-like illness General information Highly pathogenic avian influenza (HPAI)
Resistance to Tetracycline Antibiotics by Wangrong Yang, Ian F. Moore, Kalinka P. Koteva, Donald W. Hughes, David C. Bareich and Gerard D. Wright.
 Supplementary Data for TetX is a Flavin-Dependent Monooxygenase Conferring Resistance to Tetracycline Antibiotics by Wangrong Yang, Ian F. Moore, Kalinka P. Koteva, Donald W. Hughes, David C. Bareich and
UNC-Duke Biology Course for Residents Fall Cell Cycle Effects of Radiation
 UNC-Duke Biology Course for Residents Fall 2018 1 Cell Cycle: Sequence of changes in a cell starting with the moment the cell is created by cell division, continuing through the doubling of the DNA and
Loyer, et al. microrna-21 contributes to NASH Suppl 1/15
 Loyer, et al. microrna-21 contributes to NASH Suppl 1/15 SUPPLEMENTARY MATERIAL: Liver MicroRNA-21 is Overexpressed in Non Alcoholic Steatohepatitis and Contributes to the Disease in Experimental Models
MicroRNA sponges: competitive inhibitors of small RNAs in mammalian cells
 MicroRNA sponges: competitive inhibitors of small RNAs in mammalian cells Margaret S Ebert, Joel R Neilson & Phillip A Sharp Supplementary figures and text: Supplementary Figure 1. Effect of sponges on
Early Embryonic Development
 Early Embryonic Development Maternal effect gene products set the stage by controlling the expression of the first embryonic genes. 1. Transcription factors 2. Receptors 3. Regulatory proteins Maternal
Chapter 12. living /non-living? growth repair renew. Reproduction. Reproduction. living /non-living. fertilized egg (zygote) next chapter
 next chapter") Chapter 12 How cells divide Reproduction living /non-living? growth repair renew based on cell division first mitosis - distributes identical sets of chromosomes cell cycle (life) Cell Division in Bacteria
Chapter 12 How cells divide Reproduction living /non-living? growth repair renew based on cell division first mitosis - distributes identical sets of chromosomes cell cycle (life) Cell Division in Bacteria
Mitosis and the Cell Cycle
 Mitosis and the Cell Cycle Chapter 12 The Cell Cycle: Cell Growth & Cell Division Where it all began You started as a cell smaller than a period at the end of a sentence Getting from there to here Cell
Cell Cycle, Mitosis, and Microtubules. LS1A Final Exam Review Friday 1/12/07. Processes occurring during cell cycle
 Cell Cycle, Mitosis, and Microtubules LS1A Final Exam Review Friday 1/12/07 Processes occurring during cell cycle Replicate chromosomes Segregate chromosomes Cell divides Cell grows Cell Growth 1 The standard
SUPPLEMENTAL METHODS Cell culture RNA extraction and analysis Immunohistochemical analysis and laser capture microdissection (LCM)
") SUPPLEMENTAL METHODS Cell culture Human peripheral blood mononuclear cells were isolated from healthy donors by Ficoll density gradient centrifugation. Monocyte differentiation to resting macrophages ()
SUPPLEMENTAL METHODS Cell culture Human peripheral blood mononuclear cells were isolated from healthy donors by Ficoll density gradient centrifugation. Monocyte differentiation to resting macrophages ()
Cell Cycle. Trends in Cell Biology
 Cell Cycle Trends in Cell Biology Cell Cycle The orderly sequence of events by which a cell duplicates its contents and divides into two Daughter Cells Activities of a cell from one cell division to the
L I F E S C I E N C E S
 1a L I F E S C I E N C E S 5 -UUA AUA UUC GAA AGC UGC AUC GAA AAC UGU GAA UCA-3 5 -TTA ATA TTC GAA AGC TGC ATC GAA AAC TGT GAA TCA-3 3 -AAT TAT AAG CTT TCG ACG TAG CTT TTG ACA CTT AGT-5 NOVEMBER 2, 2006
Supplementary Information POLO-LIKE KINASE 1 FACILITATES LOSS OF PTEN-INDUCED PROSTATE CANCER FORMATION
 Supplementary Information POLO-LIKE KINASE 1 FACILITATES LOSS OF PTEN-INDUCED PROSTATE CANCER FORMATION X. Shawn Liu 1, 3, Bing Song 2, 3, Bennett D. Elzey 3, 4, Timothy L. Ratliff 3, 4, Stephen F. Konieczny
Oligo Sequence* bp %GC Tm Hair Hm Ht Position Size Ref. HIVrt-F 5 -CTA-gAA-CTT-TRA-ATg-CAT-ggg-TAA-AAg-TA
 Human immunodeficiency virus (HIV) detection & quantitation by qrt-pcr (Taqman). Created on: Oct 26, 2010; Last modified by: Jul 17, 2017; Version: 3.0 This protocol describes the qrt-pcr taqman based
Cancer. The fundamental defect is. unregulated cell division. Properties of Cancerous Cells. Causes of Cancer. Altered growth and proliferation
 Cancer The fundamental defect is unregulated cell division. Properties of Cancerous Cells Altered growth and proliferation Loss of growth factor dependence Loss of contact inhibition Immortalization Alterated
SUPPLEMENTARY INFORMATION
 BASELINE ISCHAEMIA a b Phd2 +/- c d Collateral growth and maintenance SMC recruitment SMC proliferation Phd2 +/- NF- B off NF- B on NF- B on NF- B on Endothelial cell Smooth muscle cell Pro-arteriogenic
PATIENTS AND METHODS. Subjects
 PATIENTS AND METHODS Subjects Twenty-nine morbidly obese subjects involved in a gastric surgery program were enrolled in the study between October 25 and March 21. Bariatric surgery was performed in patients
Bacterial Gene Finding CMSC 423
 Bacterial Gene Finding CMSC 423 Is it O.K. to be a Luddite? The New York Times Book Review 28 October 1984, pp. 1, 40-41. As if being 1984 weren't enough, it's also the 25th anniversary this year of C.