TigerPrints. Clemson University. Erin Vegter Clemson University,
|
|
|
- Berniece Gibbs
- 6 years ago
- Views:
Transcription

1 Clemson University TigerPrints All Theses Theses THE EFFECT OF CELL CULTURE ENVIRONMENT ON EXPRESSION OF CD44+, KI67, AND FOXO3A AND ITS IMPLICATIONS ON THE ROLE OF FOXO3A IN TRIPLE NEGATIVE BREAST CANCER Erin Vegter Clemson University, Follow this and additional works at: Part of the Oncology Commons Recommended Citation Vegter, Erin, "THE EFFECT OF CELL CULTURE ENVIRONMENT ON EXPRESSION OF CD44+, KI67, AND FOXO3A AND ITS IMPLICATIONS ON THE ROLE OF FOXO3A IN TRIPLE NEGATIVE BREAST CANCER" (2013). All Theses. Paper This Thesis is brought to you for free and open access by the Theses at TigerPrints. It has been accepted for inclusion in All Theses by an authorized administrator of TigerPrints. For more information, please contact
2 THE EFFECT OF CELL CULTURE ENVIRONMENT ON EXPRESSION OF CD44 +, KI67, AND FOXO3A AND ITS IMPLICATIONS ON THE ROLE OF FOXO3A IN TRIPLE NEGATIVE BREAST CANCER A Thesis Presented to the Graduate School of Clemson University In Partial Fulfillment of the Requirements for the Degree Master of Science Animal and Veterinary Science by Erin Lindsey Vegter December 2013 Accepted by: Dr. Heather W. Dunn, Committee Co-Chair Dr. Ashby B. Bodine, Committee Co-Chair Dr. Yanzhang Wei
3 ABSTRACT Triple negative breast cancer (TNBC) is a highly aggressive cancer, which is known for a high rate of metastasis and poor prognosis. TNBC cells are hypothesized to undergo the cellular processes epithelial-to-mesenchymal transition (EMT) and mesenchymal-to-epithelial transition (MET). The known prognostic markers CD44 + and Ki67 as well as the transcription factor and proposed tumor suppressor FoxO3a are thought to be indicators of EMT and MET activity in cancer cells. In order to better understand these processes an effective cell culture technique to mimic the tumor environment needs to be established. The purpose of this study was to determine if changing the cell culture environment would impact the expression of CD44 +, Ki67 and FoxO3a in TNBC cells. The three TNBC cell lines BT-549, MDA-MB-157, and MDA-MB-231 were cultured in either a monolayer (2D) environment or in Matrigel (3D). FoxO3a was knocked down using sirna to in MDA-MB-231 cells. The cells were immunofluorescently stained to measure the intensity of CD44 +, KI67, and FoxO3a expression in both the 2D and 3D cell culture environment. Proliferation and wound healing assays were performed to determine the proliferation and migration of MDA- MB-231 cells. The results indicate the expression of FoxO3a had significantly increased (P<0.050) in cells cultured in a 3D environment. In the sirna treated cells there was not a significant difference in the expression of FoxO3a between cell culture environments. The proliferation assay demonstrated cell culture environment does not have an effect on ii
4 the proliferation of MDA-MB-231 cells. The migration assay proved MDA-MB-231 will fill in a wound area over time. The results suggest culturing cells in a 3D environment could have an impact on cellular activity. Further studies need to be conducted to determine if this type of culture environment could impact the EMT and MET activity of cancer cells and if FoxO3a plays a role in these cellular processes as well. iii
5 DEDICATION I would like to dedicate this thesis to my family. Their constant love and support has played an integral role in making this project possible. iv
6 ACKNOWLEDGMENTS I would like to express the deepest appreciation to my advisor, Dr. Heather Dunn, for all the assistance and support with all aspects of my graduate school experience. I would also like to thank my other committee members Dr. Ashby B. Bodine and Dr. Yanzhang Wei. Additionally, I would like to thank Dr. William Bridges for his assistance on all of my statistical analysis. I would like to thank Nancy Korn for the microscope assistance and being available to answer my question. I would also like to thank the Clemson Light Imaging Facility for allowing my to use the CRI Nuance Imaging System. Finally, I would like to thank my friends and family both here in Clemson, SC and back in Michigan for their constant support and encouragement. v
7 TABLE OF CONTENTS TITLE PAGE... i ABSTRACT... ii DEDICATION... iv ACKNOWLEDGMENTS... v LIST OF FIGURES... viii CHAPTER I. INTRODUCTION... 1 II. LITERATURE REVIEW... 4 Cancer Overview... 4 Breast Cancer... 5 Triple Negative Breast Cancer... 6 EMT/MET and their Role in Cancer... 9 CD44 + and Ki CD Ki FoxO3a: Tumor Suppressor or Tumor Promoter D Cell Culture Summary III. MATERIALS AND METHODS Cell Culture, Cell Resuspension, and Matrigel Handling D and 3D Culture Assays D Assays D Assays sirna and Western Blot Western Blot D Assays D Assays Wound Healing Assay Page vi
8 Page Immunofluorescence Untreated, sirna Treated, and Wound Healing Assay Imaging and Image Analysis Imaging CellProfiler ImageJ Proliferation Assay D Proliferation Assay D Proliferation Assay Statistical Analysis IV. RESULTS Environment vs. Protein Expression in Three Cell Lines BT-549 Cell Line MDA-MB-157 Cell Line MDA-MB-231 Cell Line sirna Western Blot Environment Effects and Protein Expression in sirna Treated and Untreated MDA-MB-231 cells Environment Treatment Proliferation Assay Wound Healing Assay V. DISCUSSION APPENDICES A: Compilation of the Three Cell Line Figures with CD44 + and FoxO3a B: Compilation of the Three Cell Line Figures with Ki67 and FoxO3a REFERENCES vii
9 LIST OF FIGURES Figure Page 1 Figure 1: Images BT-549 cells stained for either CD44 +, FoxO3a and DAPI or Ki67, FoxO3a and Dapi in 2D or 3D cell culture environment Figure 2: The effect of cell culture environment on the expression of CD44 + and FoxO3a in BT-549 cells Figure 3: The effect of cell culture environment on the expression of Ki67 and FoxO3a in BT-549 cells Figure 4: Images of MDA-MB-157 cells stained for either CD44 +, FoxO3a, and DAPI or Ki67, FoxO3a, and DAPI in 2D or 3D cell culture environment Figure 5: The effect of cell culture environment on the expression of CD44 + and FoxO3a in MDA-MB-157 cells Figure 6: The effect of cell culture environment on the expression of Ki67 and FoxO3a in MDA-MB-157 cells Figure 7: Images of MDA-MB-231 cells stained for either CD44 +, FoxO3a, and DAPI or Ki67, FoxO3a, and DAPI in 2D or 3D cell culture environment Figure 8: The effect of cell culture environment on the expression of CD44 + and FoxO3a in MDA-MB-231 cells Figure 9: The effect of cell culture environment on the expression of Ki67 and FoxO3a in MDA-MB-231 cells Figure 10:Western blot of untreated (control) versus FoxO3a targeting sirna treated MDA-MB-231 cells viii
10 List of Figures (Continued) Figure Page 11 Figure 11: Images of untreated and FoxO3a targeting sirna treated MDA-MB-231 cells stained for CD44 +, FoxO3a and DAPI in 2D or 3D cell culture environment Figure 12: Images of untreated and FoxO3a targeting sirna treated MDA-MB-231 cells stained for Ki67, FoxO3a and DAPI in 2D or 3D cell culture environment Figure 13: The effect of cell culture environment on the expression of CD44 + and FoxO3a in MDA-MB-231 cells that are either untreated or treated with FoxO3a targeting sirna Figure 14: The effect of cell culture environment on the expression of Ki67 and FoxO3a in MDA-MB-231 cells that are either untreated or treated with FoxO3a targeting sirna Figure 15: The effect of treatment with or without FoxO3a targeted sirna on the expression of CD44 + and FoxO3a in MDA-MB-231 cells grown in either 2D or 3D cell culture Figure 16: The effect of treatment with or without FoxO3a targeted sirna on the expression Ki67 and FoxO3a in MDA-MB-231 cells grown in either 2D or 3D cell culture Figure 17: The effect of cell culture environment of the proliferation of MDA-MB-231 cells at various incubation times : Figure 18: The effect of time on the % wound area that is covered by migrating MDA-MB-231 cells ix
11 CHAPTER ONE INTRODUCTION Breast cancer is the second leading cause of death in women and accounts for nearly 1 in 3 cancers diagnosed in women in the US. (DeSantis, et al., 2011). Of the breast cancers cases being diagnosed, about 10-20% are the highly aggressive triple negative breast cancer (TNBC). This particular type of breast cancer is associated with poor prognosis and a high occurrence of metastasis. TNBC lacks the three receptors estrogen, progesterone, and human epidermal growth factor receptor 2 (HER2) that are often used in identification and treatment of other breast cancers. Traditionally, the cell lines that lacked these receptors and that were grouped into the TNBC classification were thought to share similar characteristics. However, recent evidence depicts this group of cancer cells as exhibiting high heterogeneity, thus creating a varying number of subtypes within the TNBC family. Some of these cell lines, for example MDA-MB-231, exhibit stem-like activity, which is often linked to the cellular process EMT or epithelial-mesenchymal transition. EMT is often associated with a poor prognosis in women with breast cancer (Dvorak, et al., 2011). The mesenchymal-epithelial transition or MET is the reverse of EMT and is hypothesized to occur in metastatic cells in order for the cells to rapidly proliferate and produce tumors at secondary sites (Foroni, et al., 2012). The known cancer prognostic markers CD44 + and Ki67 are hypothesized to be biomarkers for EMT and MET respectively. CD44 + is a cell surface protein that when expressed in cancer cells is implicated in tumor progression and migration (Zhang,
12 Chang, & Liu, 2013). Ki67 is a nuclear protein that when expressed in cancer is associated with high proliferation and is used to determine a short-term prognosis and to predict the relapse rate in women with TNBC (Zurrida, et al., 2013). Another protein that has the potential to be used as a prognostic marker and EMT/MET biomarker is the transcription factor FoxO3a. The role of FoxO3a in cancer cells is still unknown. Active FoxO3a is thought to be a tumor suppressor because it targets pro-apoptotic proteins and prevent growth of unhealthy cells. However, there is new evidence that in invasive cancers reactivating FoxO3a actually induces of tumor progression. In order to better understand the above information and the respective roles in TNBC, a reliable cell culture method must be available. There is an increasing amount of evidence demonstrating that using a 3D cell culture method to mimic the in vivo tumor environment may be more reflective of the true in vivo conditions than the traditional monolayer or 2D method. The 3D cell culture method could better represent the behavior of cells and mechanisms involved in tumor progression seen in vivo and therefore make transitioning research from in vitro to in vivo studies attainable with less complications. The aim of this research was to investigate the effects of growing TNBC cell lines in a 2D or a 3D cell culture environment. The expression of CD44 +, Ki67 and FoxO3a were investigated to determine if cell culture environment affected the expression of these proteins in TNBC cell lines. To better understand the role of FoxO3a in TNBC, sirna knockdown of FoxO3a was performed to determine if silencing FoxO3a could affect the expression levels of CD44 + and Ki67 along with the effect of cell culture 2
13 environment. The proliferation of TNBC cell was investigated to determine if cells cultured in either a 2D or 3D cell had different proliferation rates over time. The migration of TNBC cells over time also was investigated. The results of this research could provide insight into the impact of using a cell culture method to mimic the tumor microevironment and its impact on the expression of certain proteins. These results could assist in determining the role of FoxO3a in TNBC. Furthermore, along with the impact of cell culture environment, the results from the proliferation and migration studies could provide insight into devising further studies for investigating the mechanisms of EMT and MET. 3
14 CHAPTER TWO LITERATURE REVIEW Cancer Overview Cancer is one of the leading causes of death not only in the United States, but worldwide, and rates continue to rise as life expectancy increases. Cancer is a broad term that encompasses diseases characterized by unregulated cell growth and the ability to evade the programmed cell death known as apoptosis. Mutations, alterations in pathways, genes, and transcription factors, contribute to unregulated cell growth and development. Certain individuals may be predisposed to different types of cancer due to genetic mutations while others are put at risk due to various external factors including diet, environment, infections and diseases. When cells begin to grow uncontrollably they develop a mass referred to as a tumor categorized as benign or malignant. Whether a tumor is malignant or not is determined by its ability to invade other parts of the body outside of its area of origin. Accumulation of genetic alteration in proto-oncogenes, tumor suppressor genes and DNA repair genes will push pre-malignant to malignant initiating primary tumor formation (Voulgari & Pintzas, 2009) at the site of origin. These rapidly growing cells utilize the lymphatic system and blood stream to migrate to other parts of the body to form secondary tumors. This process is referred to as metastasis. Metastatic tumor cells acquire the ability to evade anchorage-dependent apoptosis, known as anoikis, in order to survive as they migrate throughout the body (Voulgari & Pintzas, 2009). 4
15 The different forms of cancers are named based on the particular type of tissue cells from which they originate. These tissue cells include epithelial, connective, blood, lymphatic, and in rare cases nervous tissue. Epithelial tissue lines all of the organs and cavities of the body, the most prevalent form of cancer is of epithelial origin (Muranen, et al., 2012). One particular cancer of epithelial origin is breast cancer. Breast Cancer Breast cancer is one of the more common malignant cancers among women worldwide (DeSantis, et al., 2011; Ho-Yen, et al., 2012), with over 1 million new cases per year (Ho-Yen, et al., 2012; Francken, et al., 2013). In the U.S. breast cancer accounts for nearly 1 in 3 cancers diagnosed among women (DeSantis, et al., 2011). As a whole, breast cancer is the second leading cause of death in women (DeSantis, et al., 2011) with an estimated 120,000 deaths occurring annually in the U.S. and Europe combined (Prat & Perou, 2011). Breast cancer occurrence and mortality rates are not uniform, but vary among different ages, race, ethnicity, geographical location, and genetic predisposition. For example, African American women have a lower incidence of breast cancer, but a much higher mortality rate than other races (Swede, et al., 2011). Various factors contribute to this high mortality rate including socioeconomics, clinical factors, and biological behaviors (Swede, et al., 2011). Healthy breast tissue consists of multiple types of cells and tissue including epithelial cells, stromal cells, and lymphatic and blood vessels (Bosch, et al., 2010). Myoepithelial, ductal epithelial, and alveolar epithelial cells are three of the types of epithelial cells found in adult mammary glands, each with its own unique function at 5
16 various stages of mammary development and function (Hwang-Verslues, et al., 2008). These different types of epithelium are one of the many factors that may contribute to the heterogeneity of breast cancer. This heterogeneity not only affects the type of treatment to be used but the classification of the numerous subtypes that make up the breast cancer family. Classification of breast cancer began by observing the presence or absence of three hormone receptors in the cancer cells. The three hormone receptors that are used to diagnose the different types of breast cancer are the estrogen receptor (ER), progesterone receptor (PR), and human epidermal growth factor receptor 2 (HER2). These receptors in healthy breast cells are essential for growth and function, but when over-expressed in cancer their function becomes essential in growth, motility and maintenance of the tumor. Breast cancer with an over-expression of one or more of the receptors is referred to as receptor positive, while breast cancer cells that lack one or all of these receptors are referred to as negative or receptor negative. Cells that lack the expression of all three of these receptors are referred to as triple negative breast cancer (TNBC). This phenomenon is why treatment for TNBC is more difficult because a majority of treatments for breast cancer target the hormone receptors. About 60% of breast cancers are positive for receptors while only about 15% are triple negative (Chen & Russo, 2009). Triple Negative Breast Cancer Triple negative breast cancers are biologically more aggressive than other forms of breast cancer. TNBC tumors tend to be larger in size, have a higher diagnostic grade and have lymph node involvement at diagnosis (Lehmann, et al., 2011). The demographic TNBC usually affects is younger women, particularly African Americans 6
17 and Latinos. The type of therapies and outcomes of patients with TNBC are variable despite the stage and time of diagnosis (Bosch, et al., 2010). Due to the aggressive nature of this class of breast cancer, patients with TNBC have a higher rate of metastasis, distant recurrence and poorer prognosis (Lehmann, et al., 2011). The percentage of women with metastatic TNBC who survive 5 years is less than 30%, and almost all will eventually die from their disease despite treatment (Lehmann, et al., 2011). It is thought that about 80% of TNBC arise from BRCA1 mutation (Chen & Russo, 2009). Normally BRCA1 is involved in double stranded DNA repair for DNA stability (Lehmann, et al., 2011) and is one of the genetic mutations that is often screened in women diagnosed with breast cancer. Those with this genetic mutation have a higher risk of developing breast cancer and the mutation can be heritable (Francken, et al., 2013), however, not all TNBC cases are caused by BRCA1 mutations, and not all BRCA1 mutations are triple negative. Until recently tumors with TNBC characteristics were categorized into one large group, and all cell lines were treated in the same manner. Recently, researchers began to realize, through gene expression studies that there are various subtypes within the TNBC group, a fact which caused a re-examination of the breast cancer classification as a whole (Ho-Yen, Bowen, & Jones, 2012; Lehmann, et al., 2011). It was determined that there is an overlap between TNBC and other types of breast cancer. One particular subgroup found in TNBC is referred to as basal-like. The basal-like subgroup is characterized by over-expression of genes in basal epithelium. This classification is different from the TNBC term because of molecular observations rather than the clinical observation of the lack of hormone receptor staining (Bosch, et al., 7
18 2010). Terms share overlap, for example not all TNBC are basal-like and not all basallike are TNBC. It is estimated there is about a 30% discordance (Bosch, et al., 2010). There is more of a histoclinical and molecular difference between basal-like and non basal-like TNBC than between TNBC and non-tnbc. This suggests TNBC is more heterogeneous than originally thought (Ho-Yen, Bowen, & Jones, 2012). Other subgroups that have been identified thus far include luminal, basoluminal, immunomodulatory, mesenchymal, and mesenchymal stem-like (Elsawaf, et al., 2013; Lehmann, et al., 2011). Researchers have used various techniques including gene expression profiling and cluster analysis to group the various cell lines. Some of these groups share similar characteristics, but have features that make them distinct. For example, a number of cell lines in the mesenchymal and mesemchymal stem like are considered part of the basal subtype but have other characteristics that make them unique (Lehmann, et al., 2011). The mesenchymal and mesenchymal stem like group express both epithelial and mesenchymal components, and they share similar gene ontologies and gene expression profiles involving signaling pathways that are often found in the epithelial-mesenchymal transition (EMT), which play a role in cell motility and cancer metastasis (Lehmann, et al., 2011). Some of these cell lines, mostly in the mesenchymal stem like, express stem-like cancer cell characteristics (Lehmann, et al., 2011), but this concept of stem cell activity in cancer cells is still very new and controversial (Hwang- Verslues, Chang, Lee, & Lee, 2008). Some examples of cell lines that are found in these two subgroups include BT-549, MDA-MB-157, and one of the more frequently used TNBC cell lines in breast cancer research MDA-MB-231. These cell lines are also 8
19 grouped in the basal B subtype and in another recently discovered subtype referred to as claudin-low (Prat & Perou, 2011). The claudin-low subtype shows stem-like features and EMT signatures, but is currently being identified as to whether it is a true subtype or just a characteristic (Prat & Perou, 2011) of a subgroup. These various subgroups allow for a better understanding of the behavior of these different cell lines and bring researchers closer to developing individualized treatments. Regardless of these new subtypes and identification techniques, current diagnosis continues to rely on the traditional hormone receptor based identification. Currently, hormone receptors are the simplest, fastest method and are still a useful diagnostic tool. EMT/MET and their Role in Cancer Breast cancer cells that are metastatic are thought to go through a cellular process referred to as the epithelial-mesenchymal transition (EMT) to make the cells highly motile allowing for invasion into other tissue. The reverse of this process is referred to as the mesenchymal-epithelial transition (MET) where cells lose motility and increase proliferation. These processes are thought to be what drives the development of secondary tumors. EMT is often associated with poor prognosis in women with breast cancer (Dvorak, et al., 2011). EMT was first recognized in the late 1970s as a distinct process (Tiwari, et al., 2012). There are three known subtypes of EMT that occur at various stages of life and each type has a distinct function. Type 1 is involved in embryonic implantation, gastrulation, and neural crest motility during fetal development (Tiwari, et al., 2012). Type 2 is involved in tissue regeneration, wound healing, inflammation and fibrosis 9
20 (Tiwari, et al., 2012; Anwar & Kleer, 2013) while type 3 is involved in cancer progression and metastasis (Anwar & Kleer, 2013). Knowledge about type 3 EMT is still very limited (Tiwari, et al., 2012), but there is new evidence that breast cancer cells may undergo a reactivation of the embryonic or type 1 EMT program to acquire traits for invasion and metastasis (Foroni, et al., 2012). EMT is highly inducible in in vitro studies with breast cancer cell lines, but EMT in vivo results are limited (Foroni, et al., 2012). Researchers are skeptical about the existence of EMT and therefore current therapeutics specifically targeting EMT do not yet exist (Tiwari, et al., 2012). Epithelial cells are well-organized and display apico-basal polarity (Foroni, et al., 2012). These cells are closely attached to a basement membrane and other cells with tight junctions, cadherins and other adhesion molecules (Foroni, et al., 2012; Tiwari, et al., 2012). The epithelial cells have a more uniform shape and have the ability to rapidly proliferate (Tiwari, et al., 2012). EMT affects these epithelial characteristics in order to transition the cells into mesenchymal cells. One of the more important occurrences during EMT is that cells must detach from both the basement membrane and the neighboring cells. One important adhesion molecule that is affected by EMT is E- cadherin. In healthy epithelial cells, E-cadherin acts as a repressor of tumor progression by maintaining cell-cell contacts and preventing motility (Tiwari, et al., 2012). In epithelial cancers, including breast cancer, E-cadherin is found to be inactive allowing cells to migrate through tissues (Voulgari & Pintzas, 2009). Decreased E-cadherin has been associated with cells expressing high levels of the cancer motility biomarker CD44 +. When E-cadherin activity decreases there is a switch to N-cadherin, which lacks the cell 10
21 adhesion features necessary for cell-cell contacts (Voulgari & Pintzas, 2009). EMT results in the reorganization of the extracellular matrix (ECM) by up-regulation of the expression of various ECM proteins, proteases and other remodeling enzymes (Foroni, et al., 2012). The reorganization allows for mesenchymal cancer cells to migrate through the matrix and invade other tissues. Matrix metalloproteinases (MMP) are one of the more studied mechanisms of ECM degradation and have been seen to promote tumorigenesis (Voulgari & Pintzas, 2009). In healthy tissue, as the interactions between the ECM and the epithelial cells are disrupted the anchorage dependent programmed cell death, anoikis, is induced (Voulgari & Pintzas, 2009). Yet, a resistance to anoikis has been shown to promote metastasis. One factor that promotes metastasis by inducing anoikis resistance is the loss of E-cadherin in the beginning steps of EMT (Voulgari & Pintzas, 2009). This resistance to anoikis is important to tumor cells during migration because once these cells separate from the tumor mass it is necessary to survive without the signaling cues from the tumor microenvironment (Tiwari, et al., 2012). The initiation and maintenance of EMT is very complex and not completely understood but several factors have been seen as essential to EMT. Some of these include growth factors, PI3K signaling, transcription factors including snail 1 and 2, Twist, and a large number of mirnas (Tiwari, et al., 2012). Once the epithelial cells become mesenchymal through EMT they exhibit different characteristics such as reduced apico-basal polarity, high motility, differentiation and low proliferation. Loss of apico-basal polarity allows for the cells to acquire front-back polarity to allow for motility (Voulgari & Pintzas, 2009). Most of the 11
22 available energy in these cells is used on motility and therefore proliferation activity and other cellular processes are low. In distance metastasis EMT markers are often not apparent (Foroni, et al., 2012). Distance metastasis occurs when tumor cells migrate from the primary tumor site into the blood stream; the blood stream then carries them to the secondary tumor location. It is believed at the secondary tumor site, that the cells promptly undergo MET to shed their mesenchymal phenotype in order to be able to proliferate and rapidly produce the secondary tumor (Foroni, et al., 2012). Not as much is known about MET, but one factor may influence the microenvironment to which the cells migrate (Foroni, et al., 2012). During MET the genes involved are being expressed while at the same time the EMT genes are being suppressed (Ferrari, Nicolini, & Carpi, 2013). It is hypothesized that MET may induce cell death and make cancer cells more sensitive to therapy, indicating that this process could be a beneficial target for the development of new drugs for treating highly metastatic breast cancer including TNBC (Foroni, et al., 2012). The existence of MET has received recent criticism, which may be one of the reasons researchers have had difficulty proving the existence of EMT (Voulgari & Pintzas, 2009). CD44 + and Ki67 There are two known proteins, CD44 + and Ki67 that are used as prognostic markers in TNBC and other cancers. They are hypothesized to be biomarkers of EMT and MET. CD
23 CD44 + is a single chain glycoprotein that is located on the cell surface and is a major receptor for hyaluronan (Zhang, Chang, & Liu, 2013). It mediates cell adhesion in epithelial cells through interactions between cells as well as cell and matrix interactions (Zhang, Chang, & Liu, 2013). In breast cancer, expression of isoforms of CD44 + have prognostic value due to their implication in tumor progression and migration (Zhang, Chang, & Liu, 2013). CD44 + has been proposed as a possible biomarker for putative cancer stem cells (Zhang, Chang, & Liu, 2013). The expression of CD44 + in cancer cells is often associated with high-grade tumors and a poor prognosis. Zang et al. investigated the CD44 + expression in ovarian carcinoma and found in this particular cancer CD44 + is not a prognostic predictor, but an identifier of advanced stage ovarian carcinoma. Often times in cancer studies, expression of CD44 + is examined in correlation with CD24 -/low. Invasive breast cancer cell lines that exhibit a basal/mesenchymal phenotype have been found to have a high proportion of CD44 + /CD24 -/low (Choi, et al., 2013). This goes along with the idea that during EMT CD44 + is high. An article by Anwar et al discussed that cells exhibiting CD44 + /CD24 -/low exhibited EMT markers including decreased E-cadherin and up-regulation of EMT associated transcription factors (Anwar & Kleer, 2013). TNBC, especially the basal-like arising from BRCA1 mutations, is often associated with high CD44 + /CD24 -/low. This is a good indication of high metastatic potential in these cell types (Anwar & Kleer, 2013). Metastasized breast cancer cells found in the bone marrow have exhibited an increase in CD44 + /CD24 -/low, which helps in supporting the relationship between metastasis and EMT (Chang & Mani, 2013). CD44 + /CD24 -/low cells are considered to have stem/progenitor cell phenotype because not only do they express 13
24 CD44 +, but they have the ability to self-renew, differentiate, and proliferate (Idowu, et al., 2012). In a study by Idowu et al., in 2011, demonstrated that the CD44 + /CD24 -/low stem/progenitor cell phenotype is significantly associated with TNBC and exhibits an increased risk of recurrence and metastasis (Idowu, et al., 2012). Ki67 The second prognostic marker, Ki67, is a nuclear protein that is associated with cell proliferation and transcription of ribosomal RNA (rrna) (Tadbir, et al., 2012). Inhibition of rrna synthesis occurs when Ki67 is inactivated. Ki67 is present in all active phases of the cell cycle except the resting cell stage, G 0 (Tadbir, et al., 2012). During mitosis Ki67 travels to the cell surface of the chromosomes but during interphase it is exclusively in the nucleus of the cell (Tadbir, et al., 2012). Ki67 levels are used as a method to determine short-term prognosis, and as a predictor for relapse rate in women with TNBC (Zurrida, et al., 2013). Patients with high Ki67 have a low rate of distant free survival (DFS) (Zurrida, et al., 2013). This was observed in a study by Zurrida et al., who examined Ki67 in early breast cancer patients with clinically clear axillary lymph nodes and the subsequent effects of axillary radiotherapy. They found patients who did not undergo axillary radiotherapy had significantly worse DFS and high Ki67, than in those who received radiotherapy. No other protein shows an expression pattern that is equally tightly regulated in dependence to proliferative status of the cell (Scholzen & Gerdes, 2000). It has been presented there is a higher rate of proliferation in malignant than benign tumor cells, which may explain why tumors with high expression of Ki67 have a high rate of recurrence (Tadbir, et al., 2012). Ki67 expression could be used as a 14
25 marker for MET activity, due to the fact that Ki67 is a marker for cell proliferation. As previously discussed, mesenchymal cells have low to no proliferation activity whereas epithelial cells rapidly proliferate (Voulgari & Pintzas, 2009). Theoretically, as tumor cells are going through MET the levels of Ki67 should be increasing. This not only makes Ki67 a good prognostic marker, but a good marker for EMT/MET activity in cancer cells. FoxO3a Tumor Suppressor or Tumor Promoter FoxO3a is one protein in particular that may have prognostic implications in cancer cells, but has been shown to have conflicting roles in tumor progression. FoxO3a is thought to be a tumor suppressor, but also has exhibited characteristics to drive proliferation and migration in invasive cancers. It may play a role in the EMT/MET cellular processes. Foxo3a is part of the large Forkhead box (Fox) family of transcription factors (Reagan-Shaw & Ahmad, 2007). Of the 19 subgroups identified A to S in the Fox family, FoxO3a belongs to the O subgroup and is one of four FoxOs currently identified. Of the four, FoxO1, FoxO3 and FoxO4 are all ubiquitously expressed in mammals (Zhang, et al., 2011). Also these three were found initially at chromosomal translocation in tumors, which suggests they may play a role in tumor development (Reagan-Shaw & Ahmad, 2007). FoxO3 can be referred to as FoxO3 or FoxO3a depending on the species. In mice it is known as FoxO3, while in humans it is known as FoxO3a. FoxO3b is referred to as a pseudogene meaning it is no longer present or active in the cells, while FoxO3a is an active gene (Arden, 2006). The FoxO group, including FoxO3a, functions to induce the transcription of pro-apoptotic genes (Tiwari, et al., 2012) that induce 15
26 apoptosis during various times when needed (Dansen & Burgering, 2008). There are two modes of cellular signaling that regulate the function of the FoxO group: insulin signaling through the phosphotide-3-kinase (PI3K)/Akt pathway and cellular stress signaling, especially oxygen stress (Dansen & Burgering, 2008). The insulin signaling and kinase pathways inactivate FoxOs, whereas the stress signaling initially activates the FoxO protein before inactivation (Dansen & Burgering, 2008). The initial activation during stress is most likely to mediate stress resistance and to prevent premature cell death (Dansen & Burgering, 2008). FoxO3a is inactivated by phosphorylation by kinases of the Akt family, along with various growth factors (Dansen & Burgering, 2008). Phosphorylation is not the only way for FoxO3a to lose its function; acetylation and ubiquitination can also cause inactivation (Reagan-Shaw & Ahmad, 2007). FoxO3a s location within the cell depends primarily on this phosphorylation. When PI3K and Akt pathways are inactive and growth factors are absent, FoxO3a is found in the nucleus actively transcribing for cell cycle arrest and apoptosis (Reagan-Shaw & Ahmad, 2007). When FoxO3a becomes phosphorylated it is translocated from the nucleus to the cytoplasm (Reagan-Shaw & Ahmad, 2007). When in the cytoplasm, FoxO3a is inactive, but this is not the end point of FoxO3a. Dephosphorylation of FoxO3a allows it to move back into the nucleus and actively transcribe again (Zhang, et al., 2011). In cancer, phosphorylation of FoxO3a is a crucial step in order for the cells to evade apoptosis during tumorigenesis, which is why it is thought to be a tumor suppressor. The disruption of normal Akt signaling is one of the more frequent occurrences in a majority of cancers, including breast cancer. The PI3K pathway is 16
27 activated by genetic abnormalities causing hyperactivation, which results in the hyperactive downstream effect on Akt (Brugge, Hung, & Mills, 2007). Journal articles discussing cancer and cell survival, identify the pathway as the PI3K/Akt pathway. PI3K regulates cell survival, cell growth, proliferation, and migration (Brugge, Hung, & Mills, 2007). Akt promotes cell survival and phosphorylation of pro-apoptotic proteins and drives proliferation. Due to the increase in PI3K/Akt activity, FoxO3a is commonly phosphorylated and inactivated, which is one reason why FoxO3a activity could be a prognostic and therapeutic target. A study conducted in breast cancer cells that knocked down PI3K/Akt revealed that FoxO3a was significantly activated. The induction of apoptosis and a decrease in cell viability (Reagan-Shaw & Ahmad, 2007) could have resulted from the activation of FoxO3a. Another study investigated the possibility of targeting FoxO3a as a possible treatment pathway because of its tumor suppressor properties in paclitaxel-sensitive breast cancer. In breast cancer, FoxO3a has been shown to upregulate the pro-apoptotic protein, BIM, which was effective at inducing apoptosis. In certain types of breast cancer treated with the chemotherapy drug paclitaxel it appeared FoxO3a was upregulated, subsequently increasing BIM expression and decreasing cell survival (Arden, 2006). Studies with over-expression of FoxO3a have supported the tumor suppressive capabilities as well. In in vitro studies, over-expression of FoxO has shown inhibition of tumor growth (Zhang, et al., 2011). Breast cancer in vivo studies revealed that based on tumor size and the localization of FoxO3a into the cytoplasm indicated a correlation to poor survival (Zhang, et al., 2011). Cytoplasmic FoxO3a is associated with poor survival in breast cancer, and Akt has been shown to be 17
28 positively correlated with worse outcomes in patients, including distance metastasis in endocrine treated breast cancer (Tokunaga, et al., 2006). FoxO3a and another tumor suppressor p53 may coordinate to signal tumor suppression. There is data demonstrating that both p53 and FoxO3a function together to mediate the effects of cellular stress, and by overlapping modes of target gene regulation, both can suppress tumorigenesis (Zhang, et al., 2011). This relationship between the two tumor suppressors may explain why over half of cancers develop because of a mutation in p53. PTEN is another tumor suppressor that is commonly mutated in cancer with FoxO3a. In healthy tissue, FoxO3a targets PTEN and enhances transcription of PTEN to positively reinforce the function of tumor suppression (Zhang, et al., 2011). When mutated in cancer, PTEN loses it s function allowing for hyperactivated PI3K/Akt to take over and drive tumor survival (Zhang, et al., 2011). The tumor suppressive properties of Foxo3a could potentially be beneficial in developing new therapeutics, most of which could ultimately induce apoptosis of tumor cells and improve survival in cancer patients. FoxO3a may not always act as a tumor suppressor as there is new evidence to suggest it may even play a role in tumor promotion. It has been noted that about 70% of invasive ductal breast carcinomas have nucleated FoxO3a while benign tumors express 90% cytosolic FoxO3a meaning active FoxO3a may promote invasion among other tumor promoting features (Storz, et al., 2009). A study by Jin et al., in 2004 observed activated FoxO3a in clinical breast cancer was associated with lymph node metastasis and poor prognosis (Zhang, et al., 2011). Storz et al. conducted an investigation on how FoxO3a promotes tumor invasion through the induction of MMPs. MMPs are critical 18
29 mediators of ECM degradation in tumor progression and have been indicators of poor prognosis in colorectal cancer. It s possible that FoxO3a could regulate the expression of MMPs to promote tumor expansion. In order to determine the role of FoxO3a during tumor expansion, the researchers injected MDA-MB-231 cells both normal and depleted of FoxO3a in nude mice. They observed that the knockdown of FoxO3a in MDA-MB- 231 cells did not have a significant effect on the proliferation rate and apoptosis, but the tumors were small in volume and weight. Storz and colleagues investigated FoxO3a and MMPs, specifically MMP-9 and MMP-13 both of which are detected in tumor cells and tissue, but low in healthy tissue. They found active FoxO3a significantly enhanced the MMP-9 and MMP-13 expression. As solid tumors grew they began to lose serum factors and the restrictions in the cell induced FoxO3a to mediate MMP expression and an increased invasion potential of the tumor cells. Overall their data pointed to the fact that active FoxO3a could have a role in promoting tumor expansion and metastasis by regulating MMP-9 and MMP-13 expression instead of promoting apoptosis (Storz, et al., 2009). A few publications support the pro-oncogenic function of FoxO3a, the most recent of which, by Marlow et al., was published in This group looked at FoxO3a driving proliferation in anaplastic thyroid carcinoma calling the change in FoxO3a function a paradigm shift. In anaplastic thyroid carcinoma (ATC), they hypothesized that by silencing Akt through shrna or inhibitors would lead to high nuclear FoxO3a and therefore increasing antitumor activity. They found that the high nuclear activity of FoxO3a transcriptionally upregulated the cyclin A1 gene expression, leading to enhanced 19
30 cell cycle progression and proliferation (Marlow, et al., 2012). ATC is a highly invasive and aggressive form of cancer indicating the shift in the role of FoxO3a could occur in other aggressive cancers including TNBC. Marlow et al were able to demonstrate that over-expression of Akt is not entirely sufficient to inactivate FoxO3a by studying immunohistochemistry (ICC) expression of FoxO3a in several ATC cell lines. They exposed several ATC to exogenous AKT and found minimal difference in the amount of FoxO3a relocalized in the cells before and after exposure. This data could indicate a trend to the FoxO3a shuttling mechanism using pathways other than Akt. It is speculated that there is a shift in the role of FoxO3a during tumor progression from benign to metastatic, but the mechanism for this is yet to be discovered (Marlow, et al., 2012). Along with the two studies previously discussed there are a few that indicate nuclear FoxO3a in some forms of breast cancers is associated with lymph node metastasis and overall poor survival (Chen, et al., 2010). This information could change the role of FoxO3a as a therapeutic target for highly aggressive cancers. Therapeutics that activate FoxO3a in early forms or less invasive cancers could be beneficial, but this new information about highly invasive or later stage cancers could cause the FoxO3a therapeutics may promote tumor growth and metastasis. Nuclear FoxO3a in invasive cancers, such as TNBC could be a potential new prognostic marker. 3D Cell Culture All of the information previously discussed would not exist if there weren t a reliable cell culture model to study the many aspects of cancer growth and development. In vivo studies in mice or other living organisms are ideal for representatives of the 20
31 human body in cancer research, but in vitro studies are essential when understanding the mechanisms involved in cancer progression. There are advantages to in vitro studies including cost effective, a more detailed analysis about what is occurring in the cells and consistency that can be difficult to replicate in living organisms. Traditionally, cell culture was conducted in what is referred to as monolayer or 2D where cells are grown directly on a plastic or glass surface, but researchers found that this method was not always beneficial. Some advantages to 2D cell culture methods include convenience and being inexpensive compared to other methods (Kim, 2005). Cell culture using 2D allows for excessive cell growth that is similar to malignancy (Weaver, et al., 1995). In cancer research, however, it is problematic to study the physiology and tumorigenesis of the cancer cells in 2D cell culture (Kim, 2005). Other disadvantages to 2D culture especially in breast cancer research, include poor adherence and growth in an artificial environment, the cells lack structural architecture limiting transport studies, and there is poor viability with organ cultures (Kim, 2005). One of the biggest disadvantages in using 2D culture in breast cancer is the lack of stroma (Kim, 2005), which is made up of cells, connective tissue, blood and lymph vessels, fibroblasts and inflammatory cells (Weaver, et al., 1995). The stroma makes up about 80% of resting breast volume (Weaver, et al., 1995). The 2D cell culture does not mimic the glandular environment of the breast so investigating cellular events including proliferation, apoptosis, polarity of the cells, and differentiation for both normal and tumorigenic breast epithelial cells does not provide an accurate depiction (Debnath, 21
32 Muthuswamy, & Brugge, 2003). This data leads to the need to develop a 3D cell culture model to mimic the breast tumor environment. The stromal-epithelial interactions help to regulate mammary epithelial cell growth and differentiation and adapt to changes in development (Kass, et al., 2007). During a woman s life the breast is a tissue that goes through various changes, sometimes in short periods of time. Breast tissue changes during its initial development during puberty, menstrual cycles, pregnancy to prepare for milk production, lactation, remodeling after lactation, and menopause (Kass, et al., 2007). Interactions between the stroma components and epithelial cells as well as the ECM are important in tumorigenesis (Weaver, et al., 1995). Tumor cells and stroma communicate with each other throughout growth and differentiation (Dvorak, et al., 2011), and tumor cells must interact with the stroma during metastasis in order to reach the blood stream and at the secondary site to develop secondary tumors. Most tumors require stroma but the amount of stroma does not dictate the malignancy of the cancer (Dvorak, et al., 2011). 3D cell culture allows for many advantages over 2D culture and in some cases even in vivo studies. The 3D cell culture method allows researchers to look at multiple cells with different phenotypes at one time, which is similar to that of a traditional tumor environment (Kim, 2005). The 3D cell culture mimics avascular conditions, which is often the case in real tumor development before angiogenesis occurs (Kim, 2005). 3D allows for a better resemblance of cell shape, cell adherence, migration, interaction between epithelial and stromal cell, and other cell-cell interactions (Kim, 2005). Cells in 3D culture often demonstrate similar responses to therapies in vivo for example, MDA- 22
33 MB-231 cells in 2D culture showed a much lower sensitivities to certain drugs compared to in vivo and 3D culture (Kim, 2005). There are many different types of 3D cell culture methods that are in use and each has specific advantages to different areas of interests and different cell types. Each has its own disadvantages as well, but these vary based on the mechanism being studied. These techniques are constantly developing and improving the various 3D techniques. One particular technique is liquid overlay culture, more specifically a reconstituted membrane referred to as Matrigel. This is likely one of the more common and consistent techniques for growing cells with adhesion forces between cells (Debnath, Muthuswamy, & Brugge, 2003). In a 2003 article by Debnath, Muthuswamy and Brugge used the liquid overlay technique with Matrigel to study morphogenesis and oncogensis of mammary epithelial cells. Debnath and colleagues used the MCF-10A cell line, an immortalized normal mammary epithelial cell lines. MCF-10A when passaged for a long length of time can begin to form fibroblastic or spindle-shaped cells characteristic of cancer cells. Debnath et al were interested in using 3D cell culture to determine if the MCF-10A cells would form acinar structures with low proliferation, normally seen in actual mammary tissue. In 2D cultures the cells fail to form acini, but did in vivo, which was why a 3D culture technique needed investigation. The results they obtained concluded, that when plated on Matrigel, the MCF-10A cells formed acini with a hollow lumen and a low proliferation. The lumen was a very important result because it exhibited cells that did not come in contact with the basement membrane, underwent anoikis. This discovery mimics normal cell behavior, previously discussed in the EMT section comparing normal 23
34 and malignant cells and the importance of the attachment to the ECM and E-cadherin. The methods from this article have allowed for further research to be conducted and provide insight into understanding mechanisms that could be involved in tumor progression of breast cancer (Debnath, Muthuswamy, & Brugge, 2003). This article was crucial in the research conducted for this study with the highly invasive TNBC cell lines BT-549, MDA-MB-157 and MDA-MB-231. This study was able to follow the same 3D culture protocol from this article to compare the effects of culture environments on the expression of CD44, Ki67, and FoxO3a. Summary Triple negative breast cancer is a highly invasive cancer that does not behave like other forms of breast cancer. The ability to evade traditional treatments has led researchers to investigate other targets such as the cellular processes of EMT and MET. Using the known prognostic markers CD44 + and Ki67 could help to further understand the mechanism when cancer cells are undergoing EMT and MET. FoxO3a may play a role in these cellular processes. Whether FoxO3a is a tumor suppressor or tumor promoter in TNBC this could serve as a prognostic tool and a possible therapeutic target. Furthermore, the use of 3D cell culture techniques could have an impact on better understanding these mechanisms in not only TNBC but other cancers as well. 24
35 CHAPTER THREE MATERIALS AND METHODS Cell Culture, Cell Resuspension, and Matrigel Handling Human triple negative breast cancer cell lines BT-549, MDA-MB-157, and MDA-MB-231 were purchased from ATCC (Manasses, VA, USA). BT-549 cells were maintained in ATCC RPMI 1640 media (ATCC #302001) supplemented with 10% fetal bovine serum (Atlanta Biologicals #S12450) and IU/mL bovine insulin (Sigma #I0516) and incubated in a Forma Scientific 3130 CO 2 water jacketed incubator at 37 C with 5% CO 2. MDA-MB-157 cells were maintained in ATCC L-15 media (ATCC #302008) supplemented with 10% fetal bovine serum and incubated in a Napco 6500 CO 2 water jacketed incubator at 37 C with 0% CO 2. MDA-MB-231 cells were maintained in Hyclone DMEM/high glucose media (Thermo #SH300222) supplemented with 10% fetal bovine serum, 1% Penicillin-Streptomycin solution (Cellgro # CI), and 1% sodium pyruvate (Cellgro # CI) and incubated in a Forma Scientific 3130 CO 2 water jacketed incubator at 37 C with 5% CO 2. All cell lines were grown in 250 ml polystyrene BD Falcon culture flasks (#353136). All cell culture methods were performed in a biological safety class II type A hood. The three cell lines were allowed to grow in culture flasks until they reached between 50% and 95% confluency before being resuspended and counted for use in the assays. The respective media was removed from the culture flasks and approximately 7 ml of Corning Cellgro Cellstripper (# CI) was added to the flask and incubated at 37 C with 5% CO 2 for 5 minutes. Cellstripper was pipetted up and down 25
36 to wash the flask in order to remove adhered cells from the walls of the flask. The Cellstripper solution containing detached cells was removed from the flask and added to a 15 ml VWR sterile centrifuge tube (# ). The resuspended cells were centrifuged at 125 g with a JS-7.5 rotor for 5 minutes at 23 C in a Beckman J2-21M/E centrifuge. The supernatant was discarded and phosphate buffered saline (PBS) (Sigma #P TAB) was added to wash and resuspend the cell pellet. The cells were centrifuged again following the same settings as the initial centrifuge protocol. The PBS supernatant was discarded and the cell pellet was resuspended with 1 ml of the respective media depending on the cell line. The cells were counted using a solution of trypan blue solution (Cellgro # CI) with 10% of the resuspended cell solution. The Trypan blue solution containing resuspended cells was pipetted onto a Bright-Line Hemacytometer with two counting platforms. The cell concentration was calculated using the equation of cells needed divided by the amount of cells counted. The plating amount of cells was dependent on the assay being performed. Growth Factor Reduced Matrigel from BD Biosciences (# San Jose, CA, USA) was obtained and thawed on ice for a several hours in order for the gel to become a liquid. Matrigel remains liquid on ice but solidifies at room temperature, therefore it was kept on ice at all times. Matrigel was added in 1 ml aliquots to labeled 1.5 ml microcentrifuge tubes and stored at -20 C until needed for assays. 2D and 3D Culture Assays 2D Assays 26
37 Cells were plated at a density of 5.6 x 10 4 cells in each well of the Lab-Tek 4 well Permanox Chamber Slides (# ) in a final volume of 400 µl of the appropriate media for the cell line being used. Slides containing BT-549 and MDA-MB- 231 cells were incubated at 37 C with 5% CO 2 overnight to allow cell adhesion before assays were performed. Slides containing MDA-MB-157 cells were incubated at 37 C with 0% CO 2 for 36 hours before assays were performed. Following incubation for cell adherence the slides were immunofluorescent stained and imaged for analysis. 3D Assays Aliquots of Matrigel were thawed on ice for about 3 hours. Beveled graduated µl pipet tips and 4 well Chamber Slide were also stored on ice to prevent premature solidifying of the Matrigel. A volume of 95 µl of Matrigel was pipetted into each well of the 4 well chamber slides and spread to cover the surface of the wells with the µl pipet tips being careful to not produce bubbles in the Matrigel. The slides were incubated at 37 C with 5% CO 2 for 20 minutes to allow for Matrigel to fully solidify. Cells were plated at a density of 5.6 x 10 4 cells in each well of the 4 well chamber slides in a final volume 800 µl of the appropriate media containing 2% Matrigel. The slides containing BT-549 and MDA-MB-231 cells were incubated at 37 C with 5% CO 2 for 36 hours to allow cell adhesion before the assays were performed. The slides containing MDA-MB-157 cells were incubated at 37 C with 0% CO 2 for 36 hours before the assays were performed. Following incubation for cell adherence, the slides were immunofluorescent stained and imaged for analysis. sirna and Western Blot 27
38 FOXO3 Silencer Select Pre-designed sirna (# ) and Lipofectamine RNAiMAX reagent (# ) were purchased from Invitrogen (Grand Island, NY, USA). A stock solution of 5 µm of sirna using the FoxO3a sirna and water provided in the Silencer Select sirna kit from Invitrogen was stored at -20 C in between assays. A western blot was performed to confirm FoxO3a expression was knocked down in MDA-MB-231 cells. Western Blot MDA-MB-231 cells were plated at a density of 2.9 x 10 5 cells in a final volume of 2.9 ml supplemented DMEM/high glucose media in two 3.5 mm x 10 mm cell culture dishes. The plated cells were incubated at 37 C with 5% CO 2 overnight to allow for cell adhesion. The following day the media was discarded and replaced with serum and penstrep free media. The cells were incubated at 37 C with 5% CO 2 overnight. A 0.1 µm sirna solution was prepared from the 5 µm stock solution in 250 µl of DMEM/high glucose media. The lipofectamine solution was prepared by mixing 6 µl of the lipofectamine in 250 µl of DMEM/high glucose media. The 0.1 µm sirna solution and lipofectamine solutions were combined and incubated at room temperature for 20 minutes before addition to the cells. The entire volume of the combined sirna/lipofectamine solution was added to one of the culture dishes while the other dish served as a control receiving 500 µl of the DMEM/high glucose media. The dishes were incubated for 48 hours at 37 C with 5% CO 2. Cells were lysed in order to detect proteins in western blot. The lysis solution consisted of 50 µl of a 10X lysis solution in 445 µl and 5 µl of 100mM phenylmethanesulfonyl fluoride (PMSF) solution (Fluka Analytical 28
39 #93482). The media was discarded from the cell culture dishes and the cells were incubated with 100 µl each of the lysis solution for 5 minutes on ice. The cell culture dishes were vigorously scraped to remove the lysed cells adhered to the bottom of the dishes. The lysed cell solution from the culture dishes was pipetted into labeled 1.5 ml microcentrifuge tubes. Lysed cell solutions were centrifuged at 14,000 g for 10 minutes in a microcentrifuge to remove the non-protein cell components and the supernatant was collected. A Mini-Protean TGX Gel and kd from BioRad (# , Hercules, CA, USA) was placed in the BioRad electrophoresis apparatus for electrophoresis of the samples. The electrophoresis apparatus was filled with 700 ml of 1X running buffer before the samples were added to the gel. The cell samples were prepared by adding 15 µl of each of the sample each to a solution of 15 ml of BioRad Laemmli Sample Buffer (# ) containing 5% 2-mercaptoethanol and vortexed briefly to thoroughly mix the samples. A volume of 8 µl of Precision Plus Protein Kaleidoscope Standard from BioRad (# ) was standard. The gel was electrophoresed at 200 V until the standards and samples reached the bottom of the gel. Following electrophoresis the gel was washed with transfer buffer. The gel was transferred to a BioRad PVDF Immunoblot Membrane ( ) for protein blotting in a BioRad transfer apparatus with transfer buffer at 100 V for 60 minutes. Following transfer, the membrane was blocked in a blotto solution consisting of 5% Carnation Instant Nonfat Dry Milk in nanopure water for 1 hour at room temperature on a shaker at low to medium speed. The membrane was washed three times with Tris-Buffered Saline (TBS) solution before the primary antibodies were added. The primary antibodies, FoxO3a rabbit monoclonal 29
40 (#3280-1) from Epitomics (Burlingame, CA, USA) and β-actin (13E5) rabbit monoclonal (# 4970) from Cell Signaling Technology (Danvers, MA, USA) were used. Both of the primary antibodies were incubated together with the membrane each at a 1:1000 dilution in TBS for 1 hour at room temperature on a shaker at low to medium speed. The primary antibodies were removed and the membrane was washed three times with TBS before the secondary antibodies were added. The secondary antibody, antirabbit IgG, HRP-linked (#7074) from Cell Signaling Technology (Danvers, MA, USA) was added to the membrane at a 1:1000 dilution in TBS for 1 hour at room temperature on a shaker at low to medium speed. The membrane was washed three times with TBS. The proteins on the membrane were detected using the Peroxidase Substrate Kit Vector VIP (#SK-4600) Vector Laboratories, Inc. (Burlingame, CA, USA) mixed in PBS and incubated with the membrane for minutes or until the protein bands were completely visible. The membrane was briefly washed with water and left to dry at room temperature overnight before analysis. 2D Assays MDA-MB-231 cells were plated at a density of 5.6 x 10 4 cells in a final volume of 400 µl of DMEM/high glucose supplemented media in each well of the 4 well chamber slides. The cells were incubated at 37 C with 5% CO 2 overnight. The media was discarded and replaced with serum and pen-strep free DMEM/high glucose media and incubated again at 37 C with 5% CO 2 overnight. A 0.1 µm sirna solution was made from the 5 µm stock solution in 49 µl of DMEM/high glucose media for each well of the chamber slide. A lipofectamine solution was made by mixing 1 µl of the lipofectamine 30
41 in 49 µl of DMEM/high glucose media for each well of the chamber slide. The 0.1 µm sirna solution and lipofectamine solutions were combined and incubated at room temperature for 20 minutes before addition to the cells. The entire volume of the combined sirna/lipofectamine solution was added to each well of the chamber slide and incubated for 48 hours at 37 C with 5% CO 2. The slides were stained with immunofluorescence and imaged for analysis. 3D Assays Aliquots of Matrigel were thawed on ice for about 3 hours. Beveled, graduated µl pipet tips and 4 well chamber slide were also stored on ice to prevent premature solidifying of the Matrigel. A volume of 95 µl of Matrigel was pipetted into each well of the 4 well chamber slides and spread to cover the surface of the wells with the µl pipet tips, being careful to not produce bubbles in the Matrigel. The slides were incubated at 37 C with 5% CO 2 for 20 minutes to allow for Matrigel to fully solidify. MDA-MB-231 cells were plated at a density of 5.6 x 10 4 cells in each well of the 4 well chamber slides in a final volume of 800 µl of the supplemented DMEM/high glucose media containing 2% Matrigel. The cells were incubated at 37 C with 5% CO 2 for about 36 hours. The media was discarded and replaced with serum and pen-strep free DMEM/high glucose media and incubated at 37 C with 5% CO 2 overnight. The 0.1 µm sirna solution was made from the 5 µm stock solution in 49 µl of DMEM/high glucose media for each well of the chamber slides. The lipofectamine solution was made with 1 µl of the lipofectamine in 49 µl of DMEM/high glucose media for each well of the chamber slides. The 0.1 µm sirna solution and lipofectamine solutions were combined 31
42 and incubated at room temperature for 20 minutes before being added to the cells. The entire volume of the combined sirna/lipofectamine solution was added to each well of the chamber slide and was incubated for 48 hours at 37 C with 5% CO 2. The slides were stained with immunofluorescence and imaged for analysis. Wound Healing Assay MDA-MB-231 cells were plated at a density of 5.6 x 10 4 cells in a final volume of 400 µl of DMEM/high glucose supplemented media in each well of the 4 well chamber slides. The cells were incubated at 37 C with 5% CO 2 overnight. Using a µl beveled graduated tips, approximately 1 mm cell free area was scraped across each well and the slides were incubated for 0, 1, 24, 48, and 72 hours at 37 C with 5% CO 2 before being immunofluorescence stained and imaged for analysis. Immunofluorescence Untreated, sirna Treated and Wound Healing Assay Following the incubations the media was discarded and the cells were washed briefly with sterile PBS. The cells were fixed to the slides with 4% paraformaldehyde (USB Corporation #19943) and incubated for 15 minutes at room temperature. The 4% paraformaldehyde was discarded and the cells were washed briefly with sterile PBS. Cells were permabilized with 0.5% v/v Triton X (Sigma #T-6878) in PBS for 15 minutes at room temperature. The triton X solution was discarded and the cells were washed three times in PBS. The cells were blocked with 10% goat serum blocking solution and incubated for 1 hour at room temperature. The blocking solution was discarded and 200 µl of primary antibodies was added to the wells. One slide received the primary 32
43 antibodies anti-cd44 rat monoclonal (#217594) from Calbiochem (Darmstadt, Germany) at a 1:200 dilution and anti-foxo3a, clone EP1949Y rabbit monoclonal (#041007) from Millipore (Billerica, MA, USA) at a 1:50 both in 10% goat serum blocking solution. A second slide received the primary antibodies mouse anti-human Ki- 67 antibody (#550609) from BD Pharmingen (San Jose, CA, USA) at a 1:50 dilution and anti-foxo3a at a 1:50 both in 10% goat serum blocking solution. The primary antibodies were added to only 3 of the 4 wells on the untreated and sirna treated slides. The 4 th well was the control and received 200 µl of 10% goat serum blocking solution. In the wound healing assay, each slide contained one well with CD44 + and FOXO3a primary antibodies and a second well with Ki67 and FOXO3a primary antibodies. Two wells were controls receiving only 10% goat serum blocking solution. The slides were incubated for 1 hour in a humid box at room temperature. The primary antibodies were removed and the cells were washed with 10% goat serum blocking solution three times. Secondary antibodies in a total volume of 200 µl were added to each well of the chamber slides. The slide incubated with the CD44 + and FOXO3a primary antibodies received the secondary antibodies Alexa Fluor 488 goat anti-rat IgG (H+L) (#A11006) from Life Technologies (Carlsbad, CA, USA) and Alexa Fluor 594 goat anti-rabbit IgG (H+L) (#A11037) from Life Technologies (Carlsbad, CA, USA) both at a dilution of 1:400 in 10% goat serum blocking solution. The second slide incubated with the Ki67 and FOXO3a primary antibodies received the secondary antibodies Alexa Fluor 488 goat anti-mouse IgG (H+L) (#A11029) from Life Technologies (Carlsbad, CA, USA) and Alexa Fluor 594 goat anti-rabbit IgG (H+L) both at a dilution of 1:400 in 10% goat 33
44 serum blocking solution. The slides were incubated with the designated secondary antibodies for 1 hour in a humid box at room temperature. The secondary antibodies were removed and the wells were washed three in PBS. The cells were incubated with the nuclear stain DAPI at a 1:2000 dilution in PBS for 15 minutes in a humid box at room temperature. DAPI was discarded and the plastic wells and gel separator on the chamber slides were removed. Each slide was washed briefly with PBS and a micro cover glass 24 X 50 mm No.1.5 was placed on the slides. The slides were imaged for further analysis. Imaging and Image Analysis Imaging Images were collected using a CRI Nuance Multispectral Imaging System (Lincolnshire, UK). Nine images per slide plus one control image were photographed for all the untreated and sirna slides. The analyzed images for untreated and sirna slides were collected at 20x magnification with a 10x magnification eyepiece. Four images plus one control image were collected for the wound healing assays. All of the analyzed images for wound healing assays used a 5x magnification with 10x magnification eyepiece. CellProfiler The CellProfiler cell image analysis software from the Broad Institute (Cambridge, MA, USA) was used to analyze the images obtained with the CRI imaging system. A CellProfiler pipeline was constructed for the CD44 + and FOXO3a images, and a separate pipeline was constructed for the Ki67 and FOXO3a images. Each pipeline 34
45 measured the fluorescence intensities of the labeled antibodies and DAPI as primary objects. The data output was saved in Microsoft Excel for statistical analysis. ImageJ ImageJ was obtained from the Research Services Branch of the National Institute of Health website. Images from the wound healing assay were opened in ImageJ. Each image was analyzed to determine the percentage of the wound area covered by cells for each incubation time period. The data output was saved in Microsoft Excel for statistical analysis. Proliferation Assay A CellTiter 96 AQueous Non-Radioactive Cell Proliferation 1000 Assays kit (#G5421) was purchased from Promega (Madison, WI, USA). The 20 ml of MTS solution and the 1 ml PMS solution included in the kit were mixed together. Aliquots of 1 ml were pipetted into 1.5mL microcentrifuge tubes and stored in a dark box to reduce the amount of light exposure at -20 C until needed for the assays. A MICROTEST Tissue Culture 96 well, flat bottom with low evaporation lid plate (#353072) from Becton Dickinson Labware was used for proliferation assays. 2D Proliferation Assay MDA-MB-231 cells were plated at a density of 1 x 10 4 cells in a final volume of 100 µl of supplemented DMEM/high glucose media in triplicate in a 96 well plates. The cells were incubated for either 0, 1, 2, 4, 6, 8, 24, 48, or 72 hours at 37 C with 5% CO 2. A 1 ml aliquot of MTS/PMS solution for the assay was thawed and wrapped in aluminum foil to reduce light exposure. A 20 µl volume of the thawed MTS/PMS 35
46 solution under low light conditions was added to each well containing cells, and the control wells contained media. The plate was incubated for 2 hours at 37 C with 5% CO 2 and analyzed with PowerWaveX microplate reader and KC4 program. The data output was saved in Microsoft Excel for statistical analysis. 3D Proliferation Assay Aliquots of Matrigel were thawed on ice for 3 hours. Beveled graduated µl pipet tips and 4 well Chamber Slide were stored on ice to prevent premature solidifying of the Matrigel. A volume of 25 µl of Matrigel was pipetted into each well of the 96 well plate needed for the assay and spread out to cover the surface of the wells with the µl pipet tip being careful to not produce bubbles in the Matrigel. The plate was incubated at 37 C with 5% CO 2 for 20 minutes to allow for Matrigel to fully solidify. MDA-MB-231 cells were plated at a density of 1 x 10 4 cells in a final volume of 100 µl of supplemented DMEM/high glucose media in triplicate in a 96 well plates. The cells were incubated for 0, 1, 2, 4, 6, 8, 24, 48, or 72 hours at 37 C with 5% CO 2. A 1 ml aliquot of MTS/PMS solution for the assay was thawed and wrapped in aluminum foil to reduce light exposure. A 20 µl volume of the thawed MTS/PMS solution under low light conditions was added to each well containing cells and control wells contained media. The plate was incubated for 2 hours at 37 C with 5% CO 2. The plate was read using a PowerWaveX microplate reader and KC4 program. The data output was saved in Microsoft Excel for statistical analysis. Statistical Analysis 36
47 CellProfiler data for each of the three untreated cell lines were analyzed based on a two factor treatment structure, with factor 1 being the 2D and 3D cell culture environments, and factor 2 being the two staining regimens. The experiment structure was a randomized complete block split plot with the slides as the blocks and the images as the split plot. ANOVA was used to test for the main effect of the 2D and 3D environments, the main effect of staining regimen, and the interaction effect of environment and staining. When significant effects were found; then Fisher s protected least significant difference test was used to compare means. CellProfiler data for the sirna treated and untreated MDA-MB-231 cell line in 2D and 3D environments were analyzed based on a three factor treatment structure, with factor 1 being sirna supplementation, factor 2 being the 2D and 3D cell culture environments, and factor 3 being the two staining regimens. The experiment structure was a randomized complete block split plot with the slides as the blocks and the images as the split plot. ANOVA was used to test for the main effect of the 2D and 3D environments, the main effect of staining regimen, the main effect of sirna supplementation, and the interaction effects of environment, staining, and supplementation. When significant effects were found; then Fisher s protected least significant difference test was used to compare means. Proliferation assay data for the MDA-MB-231 were analyzed based on a twofactor treatment structure, with factor 1 being the 2D and 3D cell culture environments, and factor 2 being the incubation times. The experiment structure was completely randomized. ANOVA was used to test for the main effect of the 2D and 3D 37
48 environments, the main effect of incubation times, and the interaction effect of environment and incubation times. When significant effects were found; then Fisher s protected least significant difference test was used to compare means. Wound healing assay data for the MDA-MB-231 cell line were analyzed based on a 1-factor treatment structure with the incubation times being the one factor. The experiment structure was completely randomized. ANOVA was used to test for the effect of the incubation time. When significant effects were found; then the F- distribution of the null hypothesis was used to compare means. All results were analyzed using JMP software from SAS Institute (Cary, NC, USA). All statistical tests were performed with α =
49 CHAPTER FOUR RESULTS Environment vs. Protein Expression in Three Cell Lines BT-549 Cell Line Figure 1 is a representation of the images that were used for analysis of the BT- 549 cells stained for either CD44 + and FoxO3a or Ki67 and FoxO3a. CD44 + was stained green in the top two images while Ki67 was stained green in the bottom two images. FoxO3a was stained red in the images and the nuclei were stained blue with DAPI. The cells in the 3D images appeared to grow closer together than the cells grown in 2D. The image of cells grown in 3D and stained for Ki67 and FoxO3a appeared to have more FoxO3a and most of it appeared to be in the cytoplasm than that of the Ki67 and FoxO3a cells in the 2D culture environment. The images of the cells stained for CD44 + and FoxO3a in both 2D and 3D culture environments did not appear to show a difference in the amount or location of FoxO3a. 39

50 The effect of cell culture environment on the expression of CD44 +, Ki67, and FoxO3a was investigated in the triple negative breast cancer cell line BT-549. Cells stained for CD44 + and FoxO3a in both 2D and 3D culture environments showed a difference between the mean intensity of CD44 + and the mean intensity of FoxO3a. There was no significant difference in the mean intensity of FoxO3a between cells grown in either 2D or 3D culture environment, nor was there a significant difference in the mean intensity of CD44 + between the cells grown in either 2D or 3D culture environment. Cells stained for Ki67 and FoxO3a in 2D did not show a significant difference in the mean intensities between Ki67 and FoxO3a, but a significant difference between the 40

51 mean intensity of Ki67 and the mean intensity of FoxO3a in 3D culture environment was observed. The FoxO3a mean intensities showed a significant difference between 2D and 3D culture environment, but there was not a significant difference in the mean intensity of Ki67 in cells grown in either 2D and 3D culture environments (Figure 3). 41

52 MDA-MB-157 Cell Line Figure 4 is a representation of the images that were used for analysis of the MDA- MB-157 cells stained for either CD44 + and FoxO3a or Ki67 and FoxO3a. CD44 + was stained green in the top two images while Ki67 was stained green in the bottom two images. FoxO3a was stained red in the images and the nuclei were stained blue with DAPI. The cells in the 3D images appeared to grow closer together than the cells grown in 2D. The morphology of the cells in the image for those stained for CD44 + and FoxO3a grown in the 3D culture environment appeared to be slightly different than that of the cells in the 2D culture environment. In both of the 3D images there appeared to be more FoxO3a staining, predominantly found in the nuclei of the cells. 42
53 The effect of cell culture environment on the expression of CD44 +, Ki67, and FoxO3a was investigated in the triple negative breast cancer cell line MDA-MB-157. Cells stained for CD44 + and FoxO3a showed a significant difference between the mean intensity of CD44 + and the mean intensity of FoxO3a in both the 2D and 3D cell culture environments. There was a significant difference in the mean intensities of FoxO3a between the 2D and 3D cell culture environments but there was no significant difference observed in the mean intensities of CD44 + between the 2D and 3D cell culture environments (Figure 5). 43

54 Cells stained for Ki67 and FoxO3a in the 2D culture environment did not show a significant difference between the mean intensity of Ki67 and the mean intensity of FoxO3a, but a significant difference was observed between the mean intensity Ki67 and the mean intensity of FoxO3a in the 3D culture environment. The mean intensities of FoxO3a showed a significant difference between the 2D and 3D cell culture environment. There was not a significant difference in the mean intensities of Ki67 between the 2D and 3D cell culture environments (Figure 6). 44

55 MDA-MB-231 Cell Line Figure 7 is a representation of the images that were used for analysis of the MDA- MB-231 cells stained for either CD44 + and FoxO3a or Ki67 and FoxO3a. CD44 + was stained green in the top two images while Ki67 was stained green in the bottom two images. FoxO3a was stained in the images and the nuclei were stained blue with DAPI. In both of the 3D cell culture images there appeared to be an increase in the amount of FoxO3a being stained. It appeared that the 3D images show more FoxO3a located in the cytoplasm than in the 2D images. 45
56 The effect of cell culture environment on the expression of CD44 +, Ki67, and FoxO3a was investigated in the triple negative breast cancer cell line MDA-MB-231. Cells stained for CD44 + and FoxO3a did not show a significant difference between the mean intensity of CD44 + and the mean intensity of FoxO3a in either 2D or 3D culture environment. Environment did not have a significant effect on the mean intensities of FoxO3a between the 2D and 3D cell culture. The same was observed in the mean intensities of CD44 + between the 2D and 3D cell culture environments (Figure 8). Cells stained for Ki67 and FoxO3a did not show a significant difference between the mean intensity of Ki67 and the mean intensity of FoxO3a in either 2D or 3D culture environment. A significant difference in the mean intensities of FoxO3a was seen 46

57 between the 2D and 3D cell culture environments, but a significant difference was not observed in the mean intensities of Ki67 between the 2D and 3D cell culture environment (Figure 9). 47

58 sirna Western Blot A western blot was performed to determine if the pre-designed FoxO3a sirna could knockdown expression of FoxO3a in MDA-MB-231 cells with β-actin as a control to demonstrate there was no change in the amount of protein in each sample. FoxO3a was detected in both the control and sirna treated cells around its molecular weight of 90 kd. β-actin was detected in both the control and sirna treated cells around its molecular weight of 45 kd. Figure 10 shows that there was a knockdown of FoxO3a, but it was not a complete knockdown. A significant change in expression of β-actin was not observed in either the control or in the sirna treated cells. 48

59 Environment Effects and Protein Expression in sirna Treated and Untreated MDA-MB-231 cells Figure 11 and figure 12 are representations of the images that were used for analysis of the MDA-MB-231 cells untreated and treated with the pre-designed FoxO3a sirna. CD44 + was stained green in the images in figure 11 while Ki67 was stained green in the images in figure 12. FoxO3a was stained red in the images and the nuclei were stained blue with DAPI. Figure 11 represents cells stained for CD44 + and FoxO3a and depicts images of the untreated MDA-MB-231 cells that were discussed in the previous section and MDA-MB-231 cells treated with sirna in both the 2D and 3D cell culture environments. In both the 2D and 3D cell culture environments it appeared that 49
60 the untreated MDA-MB-231 cells were expressing more FoxO3a than the treated cells. From the sirna treated cell images there did not appear to be a significant difference in the location and expression of FoxO3a. Figure 12 represents cells stained for Ki67 and FoxO3a and depicts images of the untreated MDA-MB-231 cells that were discussed in the previous section and MDA-MB-231 cells treated with sirna in both the 2D and 3D cell culture environments. In both the 2D and 3D cell culture environments it appeared the untreated MDA-MB-231 cells were expressing more FoxO3a than the treated cells. There appeared to be a slightly higher expression of FoxO3a in the sirna treated cells grown in the 3D cell culture environment than in the sirna treated cells grown in the 2D cell culture environment. 50
61 Environment The effects of environment on the expression of CD44 +, Ki67 and FoxO3a in predesigned FoxO3a sirna treated MDA-MB-231 cells or that of untreated MDA-MB-231 cells were investigated. Figure 13 depicts the effects of environment on either sirna treated or untreated cells stained for CD44 + and FoxO3a. For untreated cells there was no significant difference between the mean intensity of CD44 + and the mean intensity of FoxO3a in cells grown in 2D. There was a significant difference between the mean intensity of CD44 and the mean intensity of FoxO3a in cells grown in a 3D environment. The mean intensities of CD44 + between the untreated cells grown in either 2D or 3D environments did not show a significant difference. The mean intensities of FoxO3a between the 51
62 untreated cells grown in either 2D or 3D environments did not show a significant difference. For sirna treated cells there was no significant difference between the mean intensity of CD44 + and the mean intensity of FoxO3a in cells grown in 2D. There was a significant difference between the mean intensity of CD44 + and the mean intensity of FoxO3a in cells grown in a 3D environment. The mean intensities of CD44 + between the sirna treated cells grown in either 2D or 3D environments did not show a significant difference. The mean intensities of FoxO3a between the sirna treated cells grown in either 2D or 3D environments did not show a significant difference. Figure 14 depicts the effects of environment on either sirna treated or untreated cells stained for Ki67 and FoxO3a. For untreated cells there was not a significant difference between the mean intensity of Ki67 and the mean intensity of FoxO3a in cells grown in 2D culture, but there was a significant difference between the mean intensity of Ki67 and the mean intensity of FoxO3a in cells grown in 3D culture. There was no significant difference in the mean intensities of Ki67 in untreated cells between 2D and 3D cell culture. There was a significant difference in the mean intensities of FoxO3a in untreated cells between 2D and 3D cell culture. For treated cells there was not a significant difference between the mean intensity of Ki67 and the mean intensity of FoxO3a in cells grown in 2D culture. There was a significant difference between the mean intensity of Ki67 and the mean intensity of FoxO3a in treated cells grown in 3D culture. There was not a significant difference in the mean intensities of Ki67 in treated cells grown in either 2D or 3D cell culture nor was there a significant difference in the mean intensities of FoxO3a in treated cells grown in either 2D or 3D cell culture. 52
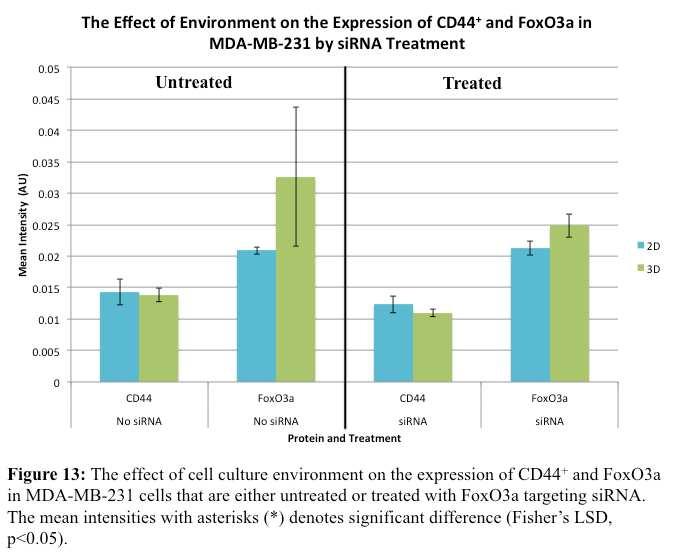
63 53

64 Treatment The effects of sirna treatment on the expression of CD44 +, Ki67, and FoxO3a in MDA-MB-231 cells grown in either 2D or 3D cell culture were investigated. Figure 15 depicts the effects of treatment on the stained CD44 + and FoxO3a cells grow in either 2D or 3D cell culture. For cells grown in 2D culture there was no significant difference between the mean intensity of CD44 + and the mean intensity of FoxO3a in either the sirna treated or untreated cells. There was no significant difference in the mean intensities of CD44 + in sirna treated and untreated cells or in the mean intensities of FoxO3a in sirna treated and untreated cells. For cells grown in 3D culture there was a significant difference between the mean intensity of CD44 + and the 54
65 mean intensity of FoxO3a in both cells untreated and treated with sirna. There was not a significant difference in the mean intensities of CD44 + between the treated and untreated cells nor was there a significant difference in the mean intensities of FoxO3a between the treated and untreated cells. Figure 16 depicts the effects of treatment on the stained Ki67 and FoxO3a cells grow in either 2D or 3D cell culture. For cells grown in 2D cell culture there was no significant difference between the mean intensity of Ki67 and the mean intensity of FoxO3a in either cells untreated or treated with sirna. There were no significant differences in the mean intensities of Ki67 between the treated or untreated cells. There was no significant difference in the mean intensities of FoxO3a between the treated and untreated cells. For cells grown in 3D cell culture there was a significant difference between the mean intensity of Ki67 and the mean intensity of FoxO3a in both the treated and untreated cells. The mean intensities of CD44 + between treated and untreated cells were not significantly different. There was not a significant difference in the mean intensities of FoxO3a between the treated and untreated cells. 55
66 56

67 Proliferation Assay The effects of cell culture environment on the proliferation of MDA-MB-231 cells at different incubation times was investigated. Figure 17 depicts the proliferation over time of the cells in either 2D or 3D cell culture with controls taken into account. Overall there was no significant difference of proliferation between 2D and 3D cell culture environments over time (P=0.5508). 57
68 Wound Healing Assay A set of wound healing assays were performed to investigate the motility of MDA-MB-231 cells over time. Figure 18 depicts the percentage of the wound area taken up by migrating cells over time. The p-value from the ANOVA of the one-way analysis of the percent area covered over time (P<0.0001) demonstrated that the average percent area was not equal at the different incubation times upholding that there was a change in percent area over time, which was to be expected. 58
69 59
70 CHAPTER FIVE DISCUSSION The results demonstrate changes in the cell culture environment can have an effect on the expression of certain proteins in TNBC cells. The results from the first set of experiments regarding the expression of CD44 +, Ki67, and FoxO3a in three types of TNBC cell lines demonstrate FoxO3a expressions varied between the 2D and 3D cell culture environments. Among the three cell lines there was a common trend in cells stained with Ki67 and FoxO3a. As indicated in figure B there was an increase of FoxO3a expression in the 3D cell culture environment verses the 2D environment. Figure B demonstrates these increases in FoxO3a expression were significantly different indicating environment does have an effect on the expression of FoxO3a in cultured TNBC cells. The MDA-MB-157 cells stained for CD44 + and FoxO3a demonstrated a significant increase of FoxO3a expression in 3D cultured cells versus the 2D cultured cells as displayed in figure A. The BT-549 and MDA-MB-231 cells did indicate an increase of FoxO3a expression in the cells cultured in 3D versus 2D as demonstrated in figure A, but these were not significant enough to conclude if environment had an effect on expression of FoxO3a with these staining regimens. The images used for analysis demonstrated a difference in the appearance of FoxO3a expression between the 2D and 3D cell culture environments. Figure 1 demonstrated this change in appearance in BT-549 cells. There was a difference in appearance of FoxO3a expression in the images of the cells stained for Ki67 and FoxO3a. Compared to the image of the BT-549 cells cultured in the 2D environment, the cells cultured in the 3D cell culture indicated a higher amount of red 60
71 immunofluorescence, which represented the FoxO3a expression, in the cells. This difference in FoxO3a appearance in the analyzed images could be observed in the MDA- MB-231 cells represented in figure 7. The cells stained for Ki67 and FoxO3a and the cells stained for CD44 + and FoxO3a indicated an increased red immunofluorescence in the images of the 3D cultured cells. The images in figure 4 representing the analyzed images of the MDA-MB-157 cell line there did not appear to be much of a difference in the appearance of FoxO3a between any of the images. As demonstrated in figures A and B there was a significant difference in the expression of FoxO3a between the 2D and 3D cell culture environments with both of the staining regimens. There may be a number of factors could influence the outcome; one being the program CellProfiler detected more color intensity compared to that perceived with the naked eye. Another observation determined from the images of the BT-549 and MDA-MB-231 cells was the increase of FoxO3a expression in the 3D cell culture environment was primarily located in the cytoplasm of the cells. This increase of cytoplasmic FoxO3a could be due to a change in the shape of the cells cultured in the 3D environment. Another speculation is the increase in cytoplasmic FoxO3a could be a result of the 3D cell culture environment having an effect on the Akt activity of the cells. As previously discussed, the increase of Akt activity in cells led to an increase in FoxO3a phosphorylation, which led to inactivation of FoxO3a and an increase of inactive FoxO3a being shuttled out into the cytoplasm (Zhang, et al., 2011). Since the 3D cell culture environment was used to mimic the tumor environment cancer cells would encounter in tissue and since Akt is highly active in most 61
72 cancers, these results could indicate the cells were demonstrating activities closer to in vivo studies. Another observation from the first set of experiments was the expression of CD44 + or Ki67 did not vary between the cell culture environments in all three cell lines. It was hypothesized expression levels would change because of the change in shape of the cells between the 2D and 3D cell culture environment. It was presented that cells cultured in a 3D environment would exhibit a better resemblance of cell shape observed in tissue (Kim, 2005). As stated previously, this change in shape could explain the increase of FoxO3a expression in 3D cultured cells. An increase of the cell surface protein CD44 + in the cells cultured in the 3D environment was not observed as demonstrated in figures A. As demonstrated in figures B there was not a significant difference in the expression of Ki67 between the cell culture environments. At this point in time it is unclear whether cell shape changes between a 2D and 3D cell culture environment do affect the expression of proteins in TNBC cells. An observation in regards to shape of cells and growth behavior realized in the analyzed images in figure 1 was BT-549 cells grew closer together forming masses of cells in the 3D cell culture environment. This growth behavior was not observed in the 2D cell culture of BT-549 cells. This observation could be compared to the results from the experiments done by Debnath et al. in They discovered when growing the noncancerous breast cells MCF-10A in 3D cell culture the cells formed acini with hollow lumens, a common characteristic of healthy breast cells in tissue. They did not observe this same behavior in the traditional 2D cell culture environment (Debnath, 62
73 Muthuswamy, & Brugge, 2003). This observation could help to understand the growth behavior of TNBC cells and the importance of cell contact to an extracellular matrix during tumor progression. The results for both the BT-549 and MDA-MB-157 cell lines demonstrated a significant difference of expression between CD44 + and FoxO3a in 3D cultured cells. This same observation was detected in all three cell lines stained for Ki67 and FoxO3a in the 3D cell culture environment. This was to be expected because CD44 +, Ki67 and FoxO3a are three different proteins and sharing similar expression levels was not the primary focus of the study. The results from the FoxO3a targeting sirna treated MDA-MB-231 cell experiments did not demonstrate as many conclusive results as the ones discussed above. It was hypothesized a knockdown of FoxO3a would demonstrate a significant difference in expression levels of FoxO3a between treated and untreated cells and similar to the results from the first set of experiments the cell culture environment would have an effect on FoxO3a expression. From the image of the western blot in figure 10 it was observed the sirna was able to knockdown FoxO3a, but only partially. The images in figures 11 and 12 illustrate a slight decrease in the amount of red immunofluorescence being expressed in the cells in both culture environments and staining regimens, but again it was not a complete knockdown of expression. This partial knockdown may explain the absence of significant differences in the expression of FoxO3a between the treated and untreated MDA-MB-231 cells. The partial knockdown could possibly even the lack of significant difference between the cell culture environments. The data for the untreated 63
74 cells were from the previous experiments so those results were not expected to change. The only difference was due to a change in statistical analysis parameters, the expression of FoxO3a was significantly different from CD44 + in the cells cultured in the 3D environment for the sirna analysis but not for the previous analysis. This change did not affect the results previously stated cells under the CD44 + and FoxO3a staining regimen did not indicate a significant difference in the expression of FoxO3a between cell culture environments. This was one of the primary focuses of both the previous set of experiments and the sirna experiments. The results for the sirna treated cells stained for Ki67 and FoxO3a did not indicate a difference in the expression of FoxO3a between the 2D and 3D cell culture environments as demonstrated in figure 14. These results vary from the untreated cells presented in figure 14, which exhibited a significant difference in the FoxO3a expression between the cell culture environments. There was not a significant difference in the expression of FoxO3a between the 2D and 3D cell culture environments in treated cells stained for CD44 + and FoxO3a, which was observed in the untreated cells. Figure 15 and 16 demonstrated there was not a significant difference between the treated and untreated in either cell culture environments and in both staining regimens, which could be correlated with the partial knockdown of FoxO3a in the cells. As previously discussed, in the first set of experiments there was not a significant difference in the expression of CD44 + in the untreated cells in both cell culture environments as demonstrated in figure 13, nor was there a significant difference in CD44 + expression between the treated and untreated cells as demonstrated if figures 15. This absence of change between the CD
75 expressions could imply along with cell culture environment, FoxO3a does not have an effect on the expression of CD44 + or possibly the motility of cancer cells during EMT. Further studies would need to be conducted to make more definitive conclusions. A decrease in the expression of Ki67 in sirna treated cells grown in the 3D cell culture environments was observed. This change in expression was not significant between either the sirna treated cells in the different cell culture environments, or between the treated and untreated cells. The change in expression was most likely due to the cells being treated with the sirna had to be incubated with serum free media thus decreasing proliferation activity and Ki67 activity whereas the untreated cells were always incubated with supplemented media containing serum. There could be a decrease in FoxO3a expression that affects Ki67 expression as well. The study by Marlow et al. demonstrated the overexpression of FoxO3a led to an increase in proliferation rates by inducing cyclin A in the highly invasive anaplastic thyroid cancer. Further studies would need to be conducted in order to conclude whether or not FoxO3a has a role in cell proliferation in TNBC cells. The proliferation assays of MDA-MB-231 cells demonstrated changing the cell culture did not affect the proliferation rate of cells over time. These results can be correlated with the results from the first set of experiments comparing expression levels of Ki67 between the three cell lines cultured in both of the cell culture environments. As previously discussed, the proliferation marker did not change expression levels between the 2D and 3D cell culture environments in any of the three cell lines. This could lead to 65
76 the hypothesis that the proliferation activity in TNBC cells should not change between cells grown in different cell culture environments. The wound healing assays demonstrated percentage of the wound area covered by MDA-MB-231 cells increases over time as was hypothesized. This assay could only be performed in a 2D cell culture environment because when scraping a wound area in the 3D cell culture membrane would not only result in removing cells, but the membrane as well, leaving a 2D wound area, but the cells left on the slides would be in a 3D environment. Performing a wound healing assay like the one used in this experiment is cost effective and straightforward, but there was a large margin of error and replicating the results in a 3D environment was not very feasible. The wounds were individually created with a pipet tip and they were not always uniform, which could have led to errors between each slide. The scraping method was not always a clean method because pieces of cells were sometimes left in the wound area, which could have altered some results. The wounds were large and a lower magnification had to be used to capture both the wound area and surrounding cells. Analyzing the images for the expression of CD44 +, Ki67, and FoxO3a similar to the first experiments was difficult because there were more cells to measure and increase background noise from the cell debris left by the scraping of the cells. Further studies with a more uniform wound producing method such as wound healing kits or other migration techniques would need to be used to obtain more definitive results, especially for studies incorporating a 3D cell culture environment. Conclusion 66
77 For this research, it was hypothesized a change in the cell culture environment would affect the expression of one or all of the proteins, CD44 +, Ki67, and FoxO3a in TNBC. The results of the protein expression in the three TNBC cells indicated of all the proteins FoxO3a was the only one to demonstrate a cell culture environment effect on the expression levels. These results could assist in future studies of TNBC cells and their behavior in a 3D cell culture environment and in determining the role of FoxO3a in TNBC cells. Future studies investigating the high amount of FoxO3a expression in the cytoplasm in cells cultured in a 3D environment could be performed. One study in particular could be done to investigate the activity of Akt in TNBC cells in both a 2D and 3D cell culture environment to determine if this has an effect on the FoxO3a expression. The results from the FoxO3a targeting sirna treated MDA-MB-231 cells were inconclusive due the incomplete knocked down of FoxO3a. Future studies using either a custom made sirna sequence or another type of FoxO3a inhibitor could be used to determine if FoxO3a could affect CD44 + and Ki67 expression. Studies investigating the affect of knocking down FoxO3a in TNBC could be performed to determine if FoxO3a has a role in proliferation and migration of cancer cells. The proliferation and the wound healing assay results are only preliminary; nevertheless these results can serve as a platform for future proliferation and migration studies in TNBC cells. These studies could be optimized to determine the role of FoxO3a and the EMT and MET activity of TNBC cells. All of these results can assist in future cell culture studies and have the potential to assist in the transition of TNBC studies in FoxO3a and EMT/MET to tissue and 67
78 perhaps even in vivo studies. Being able to demonstrate EMT and MET activity in cell culture and repeating in vivo could further strengthen the evidence proving these cellular processes occur in cancer cells. Furthermore, these types of studies could assist in reaching the ultimate goal of developing improved therapies for those types of cancers such as TNBC that are difficult to treat with traditional therapies. 68

79 Appendix A Compilation of the Three Cell Line Figures with CD44 + and FoxO3a 69

80 Appendix B Compilation of the Three Cell Lines Figures with Ki67 and FoxO3a 70
Claudin-4 Expression in Triple Negative Breast Cancer: Correlation with Androgen Receptors and Ki-67 Expression
 Claudin-4 Expression in Triple Negative Breast Cancer: Correlation with Androgen Receptors and Ki-67 Expression Mona A. Abd-Elazeem, Marwa A. Abd- Elazeem Pathology department, Faculty of Medicine, Tanta
Maram Abdaljaleel, MD Dermatopathologist and Neuropathologist University of Jordan, School of Medicine
 Maram Abdaljaleel, MD Dermatopathologist and Neuropathologist University of Jordan, School of Medicine The most common non-skin malignancy of women 2 nd most common cause of cancer deaths in women, following
Functional Limitations
 Regulation of the Cell Cycle Chapter 12 Pg. 228 245 Functional Limitations Various factors determine whether and when a cell divides. Two functional limitations for cell size limit growth or influence
Contents 1 The Windows of Susceptibility to Breast Cancer 2 The So Called Pre-Neoplastic Lesions and Carcinoma In Situ
 Contents 1 The Windows of Susceptibility to Breast Cancer... 1 1.1 Introduction... 1 1.2 Risk Factor and Etiological Agents... 2 1.3 The Concept of the Windows of Susceptibility to Carcinogenesis... 5
Basement membrane in lobule.
 Bahram Memar, MD Basement membrane in lobule. Normal lobule-luteal phase Normal lobule-follicular phase Lactating breast Greater than 95% are adenocarcinomas in situ carcinomas and invasive carcinomas.
Triple Negative Breast Cancer
 Triple Negative Breast Cancer Prof. Dr. Pornchai O-charoenrat Division of Head-Neck & Breast Surgery Department of Surgery Faculty of Medicine Siriraj Hospital Breast Cancer Classification Traditional
Chapter 12. Regulation of Cell Division. AP Biology
 Chapter 12. Regulation of Cell Division Coordination of cell division! Multicellular organism " need to coordinate across different parts of organism! timing of cell division! rates of cell division "
Regulation of Cell Division. AP Biology
 Regulation of Cell Division 2006-2007 Coordination of cell division A multicellular organism needs to coordinate cell division across different tissues & organs critical for normal growth, development
Regulation of Cell Division (Ch. 12)
") Regulation of Cell Division (Ch. 12) Coordination of cell division A multicellular organism needs to coordinate cell division across different tissues & organs critical for normal growth, development &
Regulation of Cell Division (Ch. 12) Coordination of cell division A multicellular organism needs to coordinate cell division across different tissues & organs critical for normal growth, development &
Recent advances in breast cancers
 Recent advances in breast cancers Breast cancer is a hetrogenous disease due to distinct genetic alterations. Similar morphological subtypes show variation in clinical behaviour especially in response
Biochemistry of Carcinogenesis. Lecture # 35 Alexander N. Koval
 Biochemistry of Carcinogenesis Lecture # 35 Alexander N. Koval What is Cancer? The term "cancer" refers to a group of diseases in which cells grow and spread unrestrained throughout the body. It is difficult
In vitro scratch assay: method for analysis of cell migration in vitro labeled fluorodeoxyglucose (FDG)
") In vitro scratch assay: method for analysis of cell migration in vitro labeled fluorodeoxyglucose (FDG) 1 Dr Saeb Aliwaini 13/11/2015 Migration in vivo Primary tumors are responsible for only about 10%
In vitro scratch assay: method for analysis of cell migration in vitro labeled fluorodeoxyglucose (FDG) 1 Dr Saeb Aliwaini 13/11/2015 Migration in vivo Primary tumors are responsible for only about 10%
Division Ave. High School AP Biology
 Regulation of Cell Division 2008-2009 Coordination of cell division A multicellular organism needs to coordinate cell division across different tissues & organs u critical for normal growth, development
10/15/2012. Biologic Subtypes of TNBC. Topics. Topics. Histopathology Molecular pathology Clinical relevance
 Biologic Subtypes of TNBC Andrea L. Richardson M.D. Ph.D. Brigham and Women s Hospital Dana-Farber Cancer Institute Harvard Medical School Boston, MA Topics Histopathology Molecular pathology Clinical
Regulation of Cell Division
 Regulation of Cell Division Two HeLa cancer cells are just completing cytokinesis. Explain how the cell division of cancer cells like these is misregulated. Identify genetic and other changes that might
Neoplasia 18 lecture 8. Dr Heyam Awad MD, FRCPath
 Neoplasia 18 lecture 8 Dr Heyam Awad MD, FRCPath ILOS 1. understand the angiogenic switch in tumors and factors that stimulate and inhibit angiogenesis. 2. list the steps important for tumor metastasis
Tumor microenvironment Interactions and Lung Cancer Invasiveness. Pulmonary Grand Rounds Philippe Montgrain, M.D.
 Tumor microenvironment Interactions and Lung Cancer Invasiveness Pulmonary Grand Rounds Philippe Montgrain, M.D. February 26, 2009 Objectives Review epithelial mesenchymal transition (EMT), and its implications
CHAPTER VII CONCLUDING REMARKS AND FUTURE DIRECTION. Androgen deprivation therapy is the most used treatment of de novo or recurrent
 CHAPTER VII CONCLUDING REMARKS AND FUTURE DIRECTION Stathmin in Prostate Cancer Development and Progression Androgen deprivation therapy is the most used treatment of de novo or recurrent metastatic PCa.
Cancer and Oncogenes Bioscience in the 21 st Century. Linda Lowe-Krentz
 Cancer and Oncogenes Bioscience in the 21 st Century Linda Lowe-Krentz December 1, 2010 Just a Few Numbers Becoming Cancer Genetic Defects Drugs Our friends and family 25 More mutations as 20 you get older
Fundamental research on breast cancer in Belgium. Rosita Winkler
 Fundamental research on breast cancer in Belgium Rosita Winkler Medline search for «breast cancer» and Belgium limits: english, posted in the last 5 years. Result: 484 papers - fundamental / clinical -
Crosstalk between Adiponectin and IGF-IR in breast cancer. Prof. Young Jin Suh Department of Surgery The Catholic University of Korea
 Crosstalk between Adiponectin and IGF-IR in breast cancer Prof. Young Jin Suh Department of Surgery The Catholic University of Korea Obesity Chronic, multifactorial disorder Hypertrophy and hyperplasia
Diseases of the breast (2 of 2) Breast cancer
 Breast cancer") Diseases of the breast (2 of 2) Breast cancer Epidemiology & etiology The most common type of cancer & the 2 nd most common cause of cancer death in women 1 of 8 women in USA Affects 7% of women Peak at
Diseases of the breast (2 of 2) Breast cancer Epidemiology & etiology The most common type of cancer & the 2 nd most common cause of cancer death in women 1 of 8 women in USA Affects 7% of women Peak at
Negative Regulation of c-myc Oncogenic Activity Through the Tumor Suppressor PP2A-B56α
 Negative Regulation of c-myc Oncogenic Activity Through the Tumor Suppressor PP2A-B56α Mahnaz Janghorban, PhD Dr. Rosalie Sears lab 2/8/2015 Zanjan University Content 1. Background (keywords: c-myc, PP2A,
- is a common disease - 1 person in 3 can expect to contract cancer at some stage in their life -1 person in 5 can expect to die from it
 MBB157 Dr D Mangnall The Molecular Basis of Disease CANCER Lecture 1 One of the simpler (and better) definitions of cancer comes from the American Cancer Society, who define cancer as; 'Cancer is a group
Disclosure of Relevant Financial Relationships. Breast Pathology Evening Specialty Conference Case #4. Clinical Case: Pathologic Features
 Breast Pathology Evening Specialty Conference Case #4 K.P. Siziopikou, MD, PhD Professor of Pathology Director of Breast Pathology and Breast Pathology Fellowship Program Northwestern University Feinberg
CELL BIOLOGY - CLUTCH CH CANCER.
 !! www.clutchprep.com CONCEPT: OVERVIEW OF CANCER Cancer is a disease which is primarily caused from misregulated cell division, which form There are two types of tumors - Benign tumors remain confined
Lecture 1: Carcinogenesis
 Lecture 1: Carcinogenesis Anti-cancer (oncology agents): These are perhaps the most dangerous of drugs, other than the narcotic analgesics. This is due to their toxicities. Killing or inhibiting cancer
Understanding and Optimizing Treatment of Triple Negative Breast Cancer
 Understanding and Optimizing Treatment of Triple Negative Breast Cancer Edith Peterson Mitchell, MD, FACP Clinical Professor of Medicine and Medical Oncology Program Leader, Gastrointestinal Oncology Department
Clinico- Pathological Features And Out Come Of Triple Negative Breast Cancer
 Clinico- Pathological Features And Out Come Of Triple Negative Breast Cancer Dr. HassanAli Al-Khirsani, MBChB, CABM, F.I.C.M.S AL-Sadder teaching hospital, oncology unit Dr. Nasser Ghaly Yousif, MBChB,G.P.
Section D: The Molecular Biology of Cancer
 CHAPTER 19 THE ORGANIZATION AND CONTROL OF EUKARYOTIC GENOMES Section D: The Molecular Biology of Cancer 1. Cancer results from genetic changes that affect the cell cycle 2. Oncogene proteins and faulty
VIII Curso Internacional del PIRRECV. Some molecular mechanisms of cancer
 VIII Curso Internacional del PIRRECV Some molecular mechanisms of cancer Laboratorio de Comunicaciones Celulares, Centro FONDAP Estudios Moleculares de la Celula (CEMC), ICBM, Facultad de Medicina, Universidad
Control of Cell Cycle. Unit 2 Part f III
 Control of Cell Cycle Unit 2 Part f III How often do cells divide and why? The timing and rate of cell division in different parts of the plant or animals are crucial to normal growth, development and
Mousa. Israa Ayed. Abdullah AlZibdeh. 0 P a g e
 1 Mousa Israa Ayed Abdullah AlZibdeh 0 P a g e Breast pathology The basic histological units of the breast are called lobules, which are composed of glandular epithelial cells (luminal cells) resting on
Does EMT Contribute to Radiation Resistance in Human Breast Cancer?
 AD Award Number: W81XWH-10-1-0592 TITLE: Does EMT Contribute to Radiation Resistance in Human Breast Cancer? PRINCIPAL INVESTIGATOR: Anupama Munshi, Ph.D CONTRACTING ORGANIZATION: University of Oklahoma
Award Number: W81XWH TITLE: Characterizing an EMT Signature in Breast Cancer. PRINCIPAL INVESTIGATOR: Melanie C.
 AD Award Number: W81XWH-08-1-0306 TITLE: Characterizing an EMT Signature in Breast Cancer PRINCIPAL INVESTIGATOR: Melanie C. Bocanegra CONTRACTING ORGANIZATION: Leland Stanford Junior University Stanford,
BREAST PATHOLOGY. Fibrocystic Changes
 BREAST PATHOLOGY Lesions of the breast are very common, and they present as palpable, sometimes painful, nodules or masses. Most of these lesions are benign. Breast cancer is the 2 nd most common cause
Dr Rodney Itaki Lecturer Anatomical Pathology Discipline. University of Papua New Guinea School of Medicine & Health Sciences Division of Pathology
 Neoplasia Dr Rodney Itaki Lecturer Anatomical Pathology Discipline University of Papua New Guinea School of Medicine & Health Sciences Division of Pathology General Considerations Overview: Neoplasia uncontrolled,
Question 1 A. ER-, PR-, HER+ B. ER+, PR+, HER2- C. ER-, PR+, HER2- D. ER-, PR-, HER2- E. ER-, PR+, HER2+
 Triple Negative Breast Cancer Laura C. Collins, M.D. Department of Pathology Beth Israel Deaconess Medical Center and Harvard Medical School, Boston, MA Question 1 The tumor depicted on the next slide
Cells & Tissues. Chapter 3
 Cells & Tissues Chapter 3 Cell Theory Cell is structural and functional unit of life Activity of an organism is dependent upon its cells Principle of Complementarity functions of cells are dependent upon
Molecular Characterization of Breast Cancer: The Clinical Significance
 Molecular Characterization of : The Clinical Significance Shahla Masood, M.D. Professor and Chair Department of Pathology and Laboratory Medicine University of Florida College of Medicine-Jacksonville
Aberrant cell Growth. Younas Masih New Life College of Nursing Karachi. 3/4/2016 Younas Masih ( NLCON)
") Aberrant cell Growth Younas Masih New Life College of Nursing Karachi 1 Objectives By the end of this session the learners will be able to, Define the characteristics of the normal cell Describe the characteristics
Aberrant cell Growth Younas Masih New Life College of Nursing Karachi 1 Objectives By the end of this session the learners will be able to, Define the characteristics of the normal cell Describe the characteristics
Biochemistry of Cancer and Tumor Markers
 Biochemistry of Cancer and Tumor Markers The term cancer applies to a group of diseases in which cells grow abnormally and form a malignant tumor. It is a long term multistage genetic process. The first
The clinical relevance of circulating, cell-free and exosomal micrornas as biomarkers for gynecological tumors
 Department of Tumor Biology The clinical relevance of circulating, cell-free and exosomal micrornas as biomarkers for gynecological tumors cfdna Copenhagen April 6-7, 2017 Heidi Schwarzenbach, PhD Tumor
MIT Student EMT variations in cancer
 MIT Student EMT variations in cancer Epithelial mesenchymal transition is a transformative process that normal cells, as well as cancer cells, undertake, Throughout the life cycle of a tumor, the environmental
Overview: Conducting the Genetic Orchestra Prokaryotes and eukaryotes alter gene expression in response to their changing environment
 Overview: Conducting the Genetic Orchestra Prokaryotes and eukaryotes alter gene expression in response to their changing environment In multicellular eukaryotes, gene expression regulates development
Prokaryotes and eukaryotes alter gene expression in response to their changing environment
 Chapter 18 Prokaryotes and eukaryotes alter gene expression in response to their changing environment In multicellular eukaryotes, gene expression regulates development and is responsible for differences
Cancer and Oncogenes Bioscience in the 21 st Century. Linda Lowe-Krentz October 11, 2013
 Cancer and Oncogenes Bioscience in the 21 st Century Linda Lowe-Krentz October 11, 2013 Just a Few Numbers Becoming Cancer Genetic Defects Drugs Our friends and family 200 180 160 140 120 100 80 60 40
Early Embryonic Development
 Early Embryonic Development Maternal effect gene products set the stage by controlling the expression of the first embryonic genes. 1. Transcription factors 2. Receptors 3. Regulatory proteins Maternal
number Done by Corrected by Doctor Maha Shomaf
 number 19 Done by Waseem Abo-Obeida Corrected by Abdullah Zreiqat Doctor Maha Shomaf Carcinogenesis: the molecular basis of cancer. Non-lethal genetic damage lies at the heart of carcinogenesis and leads
Immunohistochemical classification of breast tumours
 Immunohistochemical classification of breast tumours Workshop in Diagnostic Immunohistochemistry September 19 th - 21 th 2018 Anne-Vibeke Lænkholm Department of Surgical Pathology, Zealand University Hospital,
Mitosis and the Cell Cycle
 Mitosis and the Cell Cycle Chapter 12 The Cell Cycle: Cell Growth & Cell Division Where it all began You started as a cell smaller than a period at the end of a sentence Getting from there to here Cell
Biology is the only subject in which multiplication is the same thing as division
 The Cell Cycle Biology is the only subject in which multiplication is the same thing as division Why do cells divide? For reproduction asexual reproduction For growth one-celled organisms from fertilized
Part II The Cell Cell Division, Chapter 2 Outline of class notes
 Part II The Cell Cell Division, Chapter 2 Outline of class notes 1 Cellular Division Overview Types of Cell Division Chromosomal Number The Cell Cycle Mitoses Cancer Cells In Vitro Fertilization Infertility
Cancer Biology Course. Invasion and Metastasis
 Cancer Biology Course Invasion and Metastasis 2016 Lu-Hai Wang NHRI Cancer metastasis Major problem: main reason for killing cancer patients, without it cancer can be cured or controlled. Challenging questions:
1.The metastatic cascade. 2.Pathologic features of metastasis. 3.Therapeutic ramifications
 Metastasis 1.The metastatic cascade 2.Pathologic features of metastasis 3.Therapeutic ramifications Sir James Paget (1814-1899) British Surgeon/ Pathologist Paget s disease of bone Paget s disease of the
Regulation of the Cell Cycle CHAPTER 12
 Regulation of the Cell Cycle CHAPTER 12 Regulation of the Cell Cycle Timing and rates of cell division in different parts of an animal or plant are crucial for normal growth, development, and maintenance.
Intro to Cancer Therapeutics
 An Intro to Cancer Therapeutics Christopher R. Chitambar, MD Professor of Medicine Division of Hematology & Oncology Froedtert and Medical College of Wisconsin Clinical Cancer Center cchitamb@mcw.edu Intro
Ch. 18 Regulation of Gene Expression
 Ch. 18 Regulation of Gene Expression 1 Human genome has around 23,688 genes (Scientific American 2/2006) Essential Questions: How is transcription regulated? How are genes expressed? 2 Bacteria regulate
Cell Death and Cancer. SNC 2D Ms. Papaiconomou
 Cell Death and Cancer SNC 2D Ms. Papaiconomou How do cells die? Necrosis Death due to unexpected and accidental cell damage. This is an unregulated cell death. Causes: toxins, radiation, trauma, lack of
Cancer. October is National Breast Cancer Awareness Month
 Cancer October is National Breast Cancer Awareness Month Objectives 1: Gene regulation Explain how cells in all the different parts of your body develop such different characteristics and functions. Contrast
Test Bank for Robbins and Cotran Pathologic Basis of Disease 9th Edition by Kumar
 Link full download:https://getbooksolutions.com/download/test-bank-for-robbinsand-cotran-pathologic-basis-of-disease-9th-edition-by-kumar Test Bank for Robbins and Cotran Pathologic Basis of Disease 9th
Introduction. Cancer Biology. Tumor-suppressor genes. Proto-oncogenes. DNA stability genes. Mechanisms of carcinogenesis.
 Cancer Biology Chapter 18 Eric J. Hall., Amato Giaccia, Radiobiology for the Radiologist Introduction Tissue homeostasis depends on the regulated cell division and self-elimination (programmed cell death)
Chapt 15: Molecular Genetics of Cell Cycle and Cancer
 Chapt 15: Molecular Genetics of Cell Cycle and Cancer Student Learning Outcomes: Describe the cell cycle: steps taken by a cell to duplicate itself = cell division; Interphase (G1, S and G2), Mitosis.
Genetics and Cancer Ch 20
 Genetics and Cancer Ch 20 Cancer is genetic Hereditary cancers Predisposition genes Ex. some forms of colon cancer Sporadic cancers ~90% of cancers Descendants of cancerous cells all cancerous (clonal)
BIT 120. Copy of Cancer/HIV Lecture
 BIT 120 Copy of Cancer/HIV Lecture Cancer DEFINITION Any abnormal growth of cells that has malignant potential i.e.. Leukemia Uncontrolled mitosis in WBC Genetic disease caused by an accumulation of mutations
Overview of Cancer. Mylene Freires Advanced Nurse Practitioner, Haematology
 Overview of Cancer Mylene Freires Advanced Nurse Practitioner, Haematology Aim of the Presentation Review basic concepts of cancer Gain some understanding of the socio-economic impact of cancer Order of
The Hallmarks of Cancer
 The Hallmarks of Cancer Theresa L. Hodin, Ph.D. Clinical Research Services Theresa.Hodin@RoswellPark.org Hippocrates Cancer surgery, circa 1689 Cancer Surgery Today 1971: Nixon declares War on Cancer
CELL CYCLE REGULATION AND CANCER. Cellular Reproduction II
 CELL CYCLE REGULATION AND CANCER Cellular Reproduction II THE CELL CYCLE Interphase G1- gap phase 1- cell grows and develops S- DNA synthesis phase- cell replicates each chromosome G2- gap phase 2- cell
Neoplasia 18 lecture 6. Dr Heyam Awad MD, FRCPath
 Neoplasia 18 lecture 6 Dr Heyam Awad MD, FRCPath ILOS 1. understand the role of TGF beta, contact inhibition and APC in tumorigenesis. 2. implement the above knowledge in understanding histopathology reports.
2015 AP Biology Unit #4 Quiz 1 Cell Communication, Cancer and The Cell Cycle Week of November
 Name: Class: Date: 2015 AP Biology Unit #4 Quiz 1 Cell Communication, Cancer and The Cell Cycle Week of 16-20 November Multiple Choice Identify the choice that best completes the statement or answers the
A Genetic Program for Embryonic Development
 Concept 18.4: A program of differential gene expression leads to the different cell types in a multicellular organism During embryonic development, a fertilized egg gives rise to many different cell types
Transformation of Normal HMECs (Human Mammary Epithelial Cells) into Metastatic Breast Cancer Cells: Introduction - The Broad Picture:
 into Metastatic Breast Cancer Cells: Introduction - The Broad Picture:") Transformation of Normal HMECs (Human Mammary Epithelial Cells) into Metastatic Breast Cancer Cells: Introduction - The Broad Picture: Spandana Baruah December, 2016 Cancer is defined as: «A disease caused
Transformation of Normal HMECs (Human Mammary Epithelial Cells) into Metastatic Breast Cancer Cells: Introduction - The Broad Picture: Spandana Baruah December, 2016 Cancer is defined as: «A disease caused
mirna Dr. S Hosseini-Asl
 mirna Dr. S Hosseini-Asl 1 2 MicroRNAs (mirnas) are small noncoding RNAs which enhance the cleavage or translational repression of specific mrna with recognition site(s) in the 3 - untranslated region
Regulators of Cell Cycle Progression
 Regulators of Cell Cycle Progression Studies of Cdk s and cyclins in genetically modified mice reveal a high level of plasticity, allowing different cyclins and Cdk s to compensate for the loss of one
UNIVERSITY TEKNOLOGI MARA THE ANTI PROLIFERATIVE PROPERTIES OF TINOSPORA CRISPA ON TRIPLE NEGATIVE BREAST CANCER CELL LINES
 UNIVERSITY TEKNOLOGI MARA THE ANTI PROLIFERATIVE PROPERTIES OF TINOSPORA CRISPA ON TRIPLE NEGATIVE BREAST CANCER CELL LINES REYADH RADHI AL-RASHIDI Thesis submitted in fulfillment of the requirements for
Type of file: PDF Size of file: 0 KB Title of file for HTML: Supplementary Information Description: Supplementary Figures
 Type of file: PDF Size of file: 0 KB Title of file for HTML: Supplementary Information Description: Supplementary Figures Supplementary Figure 1 mir-128-3p is highly expressed in chemoresistant, metastatic
Animal Tissue Culture SQG 3242 Biology of Cultured Cells. Dr. Siti Pauliena Mohd Bohari
 Animal Tissue Culture SQG 3242 Biology of Cultured Cells Dr. Siti Pauliena Mohd Bohari The Culture Environment Changes of Cell s microenvironment needed that favor the spreading, migration, and proliferation
number Done by Corrected by Doctor Maha Shomaf
 number 21 Done by Ahmad Rawajbeh Corrected by Omar Sami Doctor Maha Shomaf Ability to Invade and Metastasize The metastatic cascade can be subdivided into two phases: 1-invasion of ECM and vascular dissemination:
Cell Polarity and Cancer
 Cell Polarity and Cancer Pr Jean-Paul Borg Email: jean-paul.borg@inserm.fr Features of malignant cells Steps in Malignant Progression Cell polarity, cell adhesion, morphogenesis and tumorigenesis pathways
SIBLINGs, cancer's multifunctional weapons
 SIBLINGs, cancer's multifunctional weapons 6/18/08 Akeila Bellahcène and Vincent Castronovo of the Metastasis Research laboratory of the University of Liège are among the first researchers to have discovered
Regulation of Gene Expression in Eukaryotes
 Ch. 19 Regulation of Gene Expression in Eukaryotes BIOL 222 Differential Gene Expression in Eukaryotes Signal Cells in a multicellular eukaryotic organism genetically identical differential gene expression
Chapter 9. Cells Grow and Reproduce
 Chapter 9 Cells Grow and Reproduce DNA Replication DNA polymerase Addition of a nucleotide to the 3 end of a growing strand Use dntps as substrate Release of pyrophosphate Initiation of Replication Replication
Part I. An Introduction to Cancer
 Part I An Introduction to Cancer 2 Chapter 1 Cancer: Descriptive Overview Cancer is a disease in which cells propagate uncontrollably. These cells can come from many different parts of the body and the
BY Mrs. K.SHAILAJA., M. PHARM., LECTURER DEPT OF PHARMACY PRACTICE, SRM COLLEGE OF PHARMACY
 BY Mrs. K.SHAILAJA., M. PHARM., LECTURER DEPT OF PHARMACY PRACTICE, SRM COLLEGE OF PHARMACY Cancer is a group of more than 100 different diseases that are characterized by uncontrolled cellular growth,
Current Status of Biomarkers (including DNA Tumor Markers and Immunohistochemistry in the Laboratory Diagnosis of Tumors)
") Current Status of Biomarkers (including DNA Tumor Markers and Immunohistochemistry in the Laboratory Diagnosis of Tumors) Kael Mikesell, DO McKay-Dee Hospital May 14, 2015 Outline Update to DNA Testing
Current Status of Biomarkers (including DNA Tumor Markers and Immunohistochemistry in the Laboratory Diagnosis of Tumors) Kael Mikesell, DO McKay-Dee Hospital May 14, 2015 Outline Update to DNA Testing
MULTIPLE CHOICE. Choose the one alternative that best completes the statement or answers the question.
 Exam Name MULTIPLE CHOICE. Choose the one alternative that best completes the statement or answers the question. 1) All of the following are synthesized along various sites of the endoplasmic reticulum
The Biology and Genetics of Cells and Organisms The Biology of Cancer
 The Biology and Genetics of Cells and Organisms The Biology of Cancer Mendel and Genetics How many distinct genes are present in the genomes of mammals? - 21,000 for human. - Genetic information is carried
Development of Carcinoma Pathways
 The Construction of Genetic Pathway to Colorectal Cancer Moriah Wright, MD Clinical Fellow in Colorectal Surgery Creighton University School of Medicine Management of Colon and Diseases February 23, 2019
Dr. Heba Kalbouneh. Dr. Heba Kalbouneh. Dr. Heba Kalbouneh
 Dr. Heba Kalbouneh Dr. Heba Kalbouneh Dr. Heba Kalbouneh Basement membrane: What is the basement membrane? - It is a layer of ECM separating the epithelial cells from the underlying connective tissue Basement
OMICS Journals are welcoming Submissions
 OMICS Journals are welcoming Submissions OMICS International welcomes submissions that are original and technically so as to serve both the developing world and developed countries in the best possible
UNIVERSITY OF MEDICINE AND PHARMACY CRAIOVA PhD SCHOOL. PhD THESIS
 UNIVERSITY OF MEDICINE AND PHARMACY CRAIOVA PhD SCHOOL PhD THESIS THE IMPORTANCE OF TUMOR ANGIOGENESIS IN CEREBRAL TUMOR DIAGNOSIS AND THERAPY ABSTRACT PhD COORDINATOR: Prof. univ. dr. DRICU Anica PhD
Neoplasia 2018 Lecture 2. Dr Heyam Awad MD, FRCPath
 Neoplasia 2018 Lecture 2 Dr Heyam Awad MD, FRCPath ILOS 1. List the differences between benign and malignant tumors. 2. Recognize the histological features of malignancy. 3. Define dysplasia and understand
Cancer Genetics. What is Cancer? Cancer Classification. Medical Genetics. Uncontrolled growth of cells. Not all tumors are cancerous
 Session8 Medical Genetics Cancer Genetics J avad Jamshidi F a s a U n i v e r s i t y o f M e d i c a l S c i e n c e s, N o v e m b e r 2 0 1 7 What is Cancer? Uncontrolled growth of cells Not all tumors
Omnis cellula e cellula
 Chapter 12 The Cell Cycle Omnis cellula e cellula 1855- Rudolf Virchow German scientist all cells arise from a previous cell Every cell from a cell In order for this to be true, cells must have the ability
GENERAL SUMMARY Corpus luteum is a transient endocrine structure formed from the ruptured ovarian follicle. Its main function is to secrete P 4, a pro
 Corpus luteum is a transient endocrine structure formed from the ruptured ovarian follicle. Its main function is to secrete P 4, a pro-gestational hormone, essential for establishment and maintenance of
Chapter 9, Part 1: Biology of Cancer and Tumor Spread
 PATHOPHYSIOLOGY Name Chapter 9, Part 1: Biology of Cancer and Tumor Spread I. Cancer Characteristics and Terminology Neoplasm new growth, involves the overgrowth of tissue to form a neoplastic mass (tumor).
PATHOBIOLOGY OF NEOPLASIA
 PATHOBIOLOGY OF NEOPLASIA Department of Pathology Gadjah Mada University School of Medicine dr. Harijadi Blok Biomedis, 6 Maret 2009 [12] 3/17/2009 1 The pathobiology of neoplasia Normal cells Malignant
1. The metastatic cascade. 3. Pathologic features of metastasis. 4. Therapeutic ramifications. Which malignant cells will metastasize?
 1. The metastatic cascade 3. Pathologic features of metastasis 4. Therapeutic ramifications Sir James Paget (1814-1899) British Surgeon/ Pathologist Paget s disease of Paget s disease of the nipple (intraductal
Disorders of Cell Growth & Neoplasia
 General Pathology VPM 152 Disorders of Cell Growth & Neoplasia Lecture 3 Rate of growth, local invasion, and metastasis. Molecular basis of cancer (normal cell-cycle and cellular proliferation). Enrique
Deregulation of signal transduction and cell cycle in Cancer
 Deregulation of signal transduction and cell cycle in Cancer Tuangporn Suthiphongchai, Ph.D. Department of Biochemistry Faculty of Science, Mahidol University Email: tuangporn.sut@mahidol.ac.th Room Pr324