Ductal pancreatic cancer modeling and drug screening using human pluripotent stem cell and patient-derived tumor organoids
|
|
|
- Stella Harper
- 6 years ago
- Views:
Transcription
1 Ductal pancreatic cancer modeling and drug screening using human pluripotent stem cell and patient-derived tumor organoids Ling Huang 1, Audrey Holtzinger 1,2,11, Ishaan Jagan 1,11, Michael BeGora 1, Ines Lohse 1, Nicholas Ngai 1, Cristina Nostro 1,2, Rennian Wang 3, Lakshmi B. Muthuswamy 1, Howard C. Crawford 4, David W. Hedley 1, Cheryl Arrowsmith 1, Steve E. Kalloger 5,6,7 Daniel J. Renouf 6,7,8, Ashton A Connor 9, Sean Cleary 9, David F. Schaeffer 5,6,7, Michael Roehrl 1, Ming-Sound Tsao 1,10, Steven Gallinger 9, Gordon Keller 1,2 and Senthil K. Muthuswamy 1,12 1 Princess Margaret Cancer Center, University Health Network (UHN), University of Toronto, Toronto, ON, Canada 2 McEwen Center for Regenerative Medicine, University Health Network, Toronto, ON, Canada 3 Departments of Physiology & Pharmacology, Western University, London, ON, Canada 4 Mayo Clinic Cancer Center, Mayo Clinic, Jacksonville, FL, USA 5 Division of Anatomic Pathology, Vancouver General Hospital, Vancouver, BC, Canada 6 The University of British Columbia, Vancouver, BC, Canada 7 Pancreas Centre BC, Vancouver, BC, Canada 8 Division of Medical Oncology, BC Cancer Agency, Vancouver, BC, Canada 9 Dvision of General Surgery, University of Toronto, Toronto, ON, Canada 10 Department of Pathology, University Health Network, Toronto, ON, Canada 11 These authors contributed equally 12 Corresponding author: s.muthuswamy@utoronto.ca 1
 Flow cytometric validation of efficient definitive endoderm induction from MEL1-derived PDX1-GFP hesc by co-expression of CXCR4 and CD117 (T3, left panel).")
2 Supplemental Figures Supplemental Figure 1 Differentiation and morphogenesis of polarized organoids from induced progenitors. (a) Induction of pancreatic lineage cells. i) Flow cytometric validation of efficient definitive endoderm induction from MEL1-derived PDX1-GFP hesc by co-expression of CXCR4 and CD117 (T3, left panel). Flow cytometric analysis of PDX1-GFP and NKX6.1 expression in day 9 multipotent pancreatic progenitors (T9, right panel). ii) Real time PCR analysis for SOX17, FOXA2, PTF1A and PDX1 expression in hescs (T0), definitive endoderm 2
3 (T3), and multipotent pancreatic progenitors (T9, day 0 for 3D culture), (n=3, data represent mean +/- S.E.M). (b) Time sequence of organoid morphogenesis. Images were taken every 2 days with a phase contrast microscope. Scale bar, 50 µm. (c) Karyotype of cells in Day 16 Pancreatic Progenitor Organoids. All metaphase cells karyotyped (5/5) showed 46 chromosomes with normal diploid male human karyotype. (d) Quantification of Ki67 positive organoids during 3D morphogenesis. An organoid was counted as proliferative when more than 5% of cells in the organoid were positive for Ki67 staining. Graph summarizes results from three independent sets of experiments with over 100 structures counted in each experiment. (e) Changes in organoid size during morphogenesis as depicted in areas (left chart) or diameters (right chart). Data are presented as box plots. The box represents the interquartile range between first and third quartile and the median value represented by a solid line. The whiskers, 5% and 95% percentiles of the measurements; box top, third quartiles of measurements; box bottom, first quartile of the measurements; center line, median measurements. (f) Quantification of apoptotic organoids at different days in 3D culture. An organoid was counted as apoptotic when at least one apoptotic cell was present. Graph summarizes results from three independent sets of experiments with over 100 structures counted in each experiment. (g) Morphology of organoids from passage 2 and passage 3 as observed by a phase contrast microscope. Scale bar, 50 µm. 3
4 Supplemental Figure 2 Formation 3d organoids by pancreatic exocrine epithelial cells (a) Global gene expression in progenitor organoids. Gene expressions in pancreatic progenitor organoids, human adult pancreas, mammary epithelial cells line MCF-10A and definitive endoderm cells were detected by Illumina HT12 V4 Expression BeadChip. Dendrogram showed unsupervised clustering of pancreatic progenitor organoids close to human adult pancreas. (b) Expression of cytokeratin 19 (KRT19) in pancreatic progenitor organoid. All progenitororganoids expressed pancreatic ductal epithelial cytokeratin KRT19. Insert, high resolution image of one organoid. DAPI, blue; KRT19, green. Scale bar, 50 µm. (c) Expression of markers associated with progenitor cells during 3D morphogenesis. The chart summarizes experiments from three independent experiments (data represent mean +/- S.E.M). 4
 Human transplants outgrowths in mouse mammary glands, from progenitor-organoids expressing transgenes.")
5 Supplemental Figure 3 Expression of KRAS and TP53 in progenitor-organoids. (a) Expression of KRAS in progenitor-organoids. KRAS, red; DAPI, blue. (b) Expression of P53 in progenitor-organoids. P53, green; DAPI, blue. Scale bars, 50 µm. (c) Human transplants outgrowths in mouse mammary glands, from progenitor-organoids expressing transgenes. Group I, progenitors transduced with mcherry: DAPI, blue; Keratin 19, green; KI67, yellow. Group II, progenitors transduced with KRASG12V: DAPI, blue; KRAS, green; KI67, yellow. Group III, progenitors transduced with TP53R175H: DAPI, blue; P53, green; KI67, yellow. (d) Outgrowth derived from transplantation of progenitor-organoids expressing transgenes. Image (i) shows H&E images of outgrowths in addition to those in Fig. 4f. Outgrowths in K-2, K-3, P-2 and P-3 mice did not express the transgene and had normal morphology. Image (ii) shows lesions identified in transgene expressing transplants, in addition to those shown in Fig. 4f. Table summarizes the transplantation experiment. Among the 8-10 mammary glands transplanted with cells from each group, three established outgrowths. Of the three, one transplant expressed 5
6 transgene whereas two were negative. The transgene-expressing transplant had two lesions for KRAS and two lesions for TP53. All four lesions showed abnormal histopathology, whereas all transgene-negative, but HLA-positive, outgrowths showed normal ductal morphology. All mcherry positive structures had normal duct morphology. 6

7 Supplemental Figure 4 Tumor organoid culture from fresh resections (a) Imaging sequence of UHN17 organogenesis. (b) Expression of NKX6.1 and GATA4 were undetectable in cell nuclei of primary tumors and corresponding tumor-organoids. DAPI, blue; NKX6.1, green; GATA4, yellow. (c) Percent tumor-organoid forming efficiency across three different passages (left panel) and MTT readings across multiple days for tumor-organoids used in top panel (right panels). (d) H&E and phase images of tumor-organoids frozen and thawed across multiple passages. (e) Propagation of tumor organoids in vivo and in vitro. Day 16 tumor organoids were dissociated and injected subcutaneously into flanks of NSG mice. Xenograft tumors were observed after 4-7 weeks. Xenograft tumors were then isolated and dissociated to re-seed in 3D. Tumor organoids grew from xenografts showed morphology consistent to original tumor organoids. The lower panel shows the histology of primary tumors from resection (left) and xenograft tumors (right). All scale bars equal to 50 µm. 7
. For MTT and oxygen consumptions experiments, data represent mean +/- S.D. P value (t-test, two tailed): N.S-, not significant; * P = 0.01-0.05; ** P = 0.001-0.01; *** P= < 0.001 (n=3).")
8 Supplemental Figure 5 Tumor organoids responses to therapeutic treatments (a) Normalized MTT assay readings of organoid cultures with gemcitabine and epigenetic inhibitors of the H3K9me2 writer G9a (A366). For MTT and oxygen consumptions experiments, data represent mean +/- S.D. P value (t-test, two tailed): N.S-, not significant; * P = ; ** P = ; *** P= < (n=3). (b) Immunostaining for H3K27me3 in control (DMSO) or UNC 1999-treated tumor-organoids. DAPI, blue. Scale bars, 50μm. (c) Primary tumors (top panel) and tumor-organoids (bottom panel) derived from tumor UHN3, UHN 5 and UHN15, show consistent patient-specific variation in staining for Histone 3 (red) and H3K27me3 (green). Scale bars, 50μm. 8
9 9

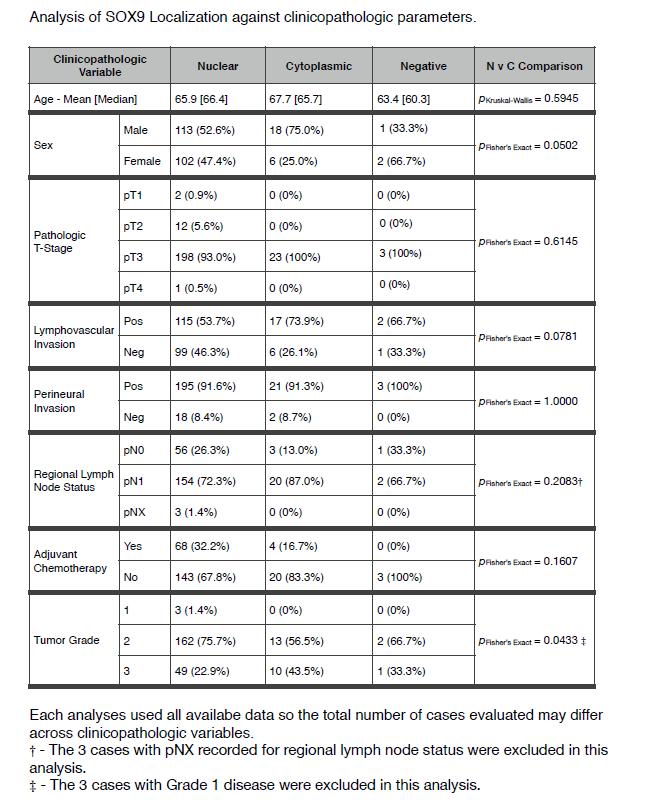
10 Supplemental Table 1 Clinical significance of sox9 subcellular localizations The two tables show analysis of SOX9 localizations against clincopathologic parameters and the significance of multivariable disease specific survival for SOX localization in PDACs in cohort II. Patients who underwent curative surgical resection of histologically confirmed pancreatic adenocarcinoma who provided consent to tissue and molecular research were included in the studies. Patients were excluded if they had been lost to follow-up or died within 90 days of their surgical resection. 10

11 Supplemental Table 2 Information of patients The table describes clinical information of patients whose tumor tissues were used in tumor organoid generation. 11
12 Epigenetic Modifiers JQ1 LAQ824 SGC0946 A366 UNC1999 Targets BET histone deacetylase DOT1L G9a EZH2 Supplemental Table 3 Epigenetic modifiers tested in progenitor-organoids and their targets 12
13 Supplemental Movies Supplemental Movie 1 Time-lapse imaging of UHN6 tumor-organoid Images were taken every 45 minutes for 10 days (See Supplemental Methods for details) 13
SUPPLEMENTARY DATA. Supplementary Table 2. Antibodies used for Immunofluoresence. Supplementary Table 3. Real-time PCR primer sequences.
 Supplementary Table 2. Antibodies used for Immunofluoresence. Antibody Dilution Source Goat anti-pdx1 1:100 R&D Systems Rabbit anti-hnf6 1:100 Santa Cruz Biotechnology Mouse anti-nkx6.1 1:200 Developmental
Fig. S1. Upregulation of K18 and K14 mrna levels during ectoderm specification of hescs. Quantitative real-time PCR analysis of mrna levels of OCT4
 Fig. S1. Upregulation of K18 and K14 mrna levels during ectoderm specification of hescs. Quantitative real-time PCR analysis of mrna levels of OCT4 (n=3 independent differentiation experiments for each
TEB. Id4 p63 DAPI Merge. Id4 CK8 DAPI Merge
 a Duct TEB b Id4 p63 DAPI Merge Id4 CK8 DAPI Merge c d e Supplementary Figure 1. Identification of Id4-positive MECs and characterization of the Comma-D model. (a) IHC analysis of ID4 expression in the
Diabetic pdx1-mutant zebrafish show conserved responses to nutrient overload and anti-glycemic treatment
 Supplementary Information Diabetic pdx1-mutant zebrafish show conserved responses to nutrient overload and anti-glycemic treatment Robin A. Kimmel, Stefan Dobler, Nicole Schmitner, Tanja Walsen, Julia
Supplementary Figure 1: GFAP positive nerves in patients with adenocarcinoma of
 SUPPLEMENTARY FIGURES AND MOVIE LEGENDS Supplementary Figure 1: GFAP positive nerves in patients with adenocarcinoma of the pancreas. (A) Images of nerves stained for GFAP (green), S100 (red) and DAPI
Supplemental Figure S1. RANK expression on human lung cancer cells.
 Supplemental Figure S1. RANK expression on human lung cancer cells. (A) Incidence and H-Scores of RANK expression determined from IHC in the indicated primary lung cancer subgroups. The overall expression
SUPPLEMENTARY INFORMATION
 b 350 300 250 200 150 100 50 0 E0 E10 E50 E0 E10 E50 E0 E10 E50 E0 E10 E50 Number of organoids per well 350 300 250 200 150 100 50 0 R0 R50 R100 R500 1st 2nd 3rd Noggin 100 ng/ml Noggin 10 ng/ml Noggin
Supplementary Figures
 Supplementary Figures Supplementary Figure 1. Confirmation of Dnmt1 conditional knockout out mice. a, Representative images of sorted stem (Lin - CD49f high CD24 + ), luminal (Lin - CD49f low CD24 + )
Supplemental Table S1
 Supplemental Table S. Tumorigenicity and metastatic potential of 44SQ cell subpopulations a Tumorigenicity b Average tumor volume (mm ) c Lung metastasis d CD high /4 8. 8/ CD low /4 6./ a Mice were injected
a) Primary cultures derived from the pancreas of an 11-week-old Pdx1-Cre; K-MADM-p53
 Primary cultures derived from the pancreas of an 11-week-old Pdx1-Cre; K-MADM-p53") 1 2 3 4 5 6 7 8 9 10 Supplementary Figure 1. Induction of p53 LOH by MADM. a) Primary cultures derived from the pancreas of an 11-week-old Pdx1-Cre; K-MADM-p53 mouse revealed increased p53 KO/KO (green,
1 2 3 4 5 6 7 8 9 10 Supplementary Figure 1. Induction of p53 LOH by MADM. a) Primary cultures derived from the pancreas of an 11-week-old Pdx1-Cre; K-MADM-p53 mouse revealed increased p53 KO/KO (green,
(A) Cells grown in monolayer were fixed and stained for surfactant protein-c (SPC,
 Cells grown in monolayer were fixed and stained for surfactant protein-c (SPC,") Supplemental Figure Legends Figure S1. Cell line characterization (A) Cells grown in monolayer were fixed and stained for surfactant protein-c (SPC, green) and co-stained with DAPI to visualize the nuclei.
Supplemental Figure Legends Figure S1. Cell line characterization (A) Cells grown in monolayer were fixed and stained for surfactant protein-c (SPC, green) and co-stained with DAPI to visualize the nuclei.
Expanded View Figures
 PEX13 functions in selective autophagy Ming Y Lee et al Expanded View Figures Figure EV1. PEX13 is required for Sindbis virophagy. A, B Quantification of mcherry-capsid puncta per cell (A) and GFP-LC3
Supplementary Figure 1. Identification of tumorous sphere-forming CSCs and CAF feeder cells. The LEAP (Laser-Enabled Analysis and Processing)
") Supplementary Figure 1. Identification of tumorous sphere-forming CSCs and CAF feeder cells. The LEAP (Laser-Enabled Analysis and Processing) platform with laser manipulation to efficiently purify lung
Supplementary Figure 1. Identification of tumorous sphere-forming CSCs and CAF feeder cells. The LEAP (Laser-Enabled Analysis and Processing) platform with laser manipulation to efficiently purify lung
Supplementary Table 1. The primers used for quantitative RT-PCR. Gene name Forward (5 > 3 ) Reverse (5 > 3 )
 Reverse (5 > 3 )") 770 771 Supplementary Table 1. The primers used for quantitative RT-PCR. Gene name Forward (5 > 3 ) Reverse (5 > 3 ) Human CXCL1 GCGCCCAAACCGAAGTCATA ATGGGGGATGCAGGATTGAG PF4 CCCCACTGCCCAACTGATAG TTCTTGTACAGCGGGGCTTG
770 771 Supplementary Table 1. The primers used for quantitative RT-PCR. Gene name Forward (5 > 3 ) Reverse (5 > 3 ) Human CXCL1 GCGCCCAAACCGAAGTCATA ATGGGGGATGCAGGATTGAG PF4 CCCCACTGCCCAACTGATAG TTCTTGTACAGCGGGGCTTG
SUPPLEMENTARY INFORMATION
 DOI: 10.1038/ncb2566 Figure S1 CDKL5 protein expression pattern and localization in mouse brain. (a) Multiple-tissue western blot from a postnatal day (P) 21 mouse probed with an antibody against CDKL5.
SUPPLEMENTARY INFORMATION
 SUPPLEMENTARY INFORMATION doi:1.138/nature11463 %Sox17(+) 9 8 7 6 5 4 3 2 1 %Sox17(+) #Sox17(+) d2 d4 d6 d8 d1 d12 d14 d18 25 2 15 1 5 Number of Sox17(+) cells X 1 Supplementary Figure 1: Expression of
EPIGENETIC RE-EXPRESSION OF HIF-2α SUPPRESSES SOFT TISSUE SARCOMA GROWTH
 EPIGENETIC RE-EXPRESSION OF HIF-2α SUPPRESSES SOFT TISSUE SARCOMA GROWTH Supplementary Figure 1. Supplementary Figure 1. Characterization of KP and KPH2 autochthonous UPS tumors. a) Genotyping of KPH2
Supplementary Figure S1 Expression of mir-181b in EOC (A) Kaplan-Meier
 Kaplan-Meier") Supplementary Figure S1 Expression of mir-181b in EOC (A) Kaplan-Meier curves for progression-free survival (PFS) and overall survival (OS) in a cohort of patients (N=52) with stage III primary ovarian
Supplementary Figure S1 Expression of mir-181b in EOC (A) Kaplan-Meier curves for progression-free survival (PFS) and overall survival (OS) in a cohort of patients (N=52) with stage III primary ovarian
Supplementary Figure 1. Nature Neuroscience: doi: /nn.4547
 Supplementary Figure 1 Characterization of the Microfetti mouse model. (a) Gating strategy for 8-color flow analysis of peripheral Ly-6C + monocytes from Microfetti mice 5-7 days after TAM treatment. Living
Supplementary Figure 1. A. Bar graph representing the expression levels of the 19 indicated genes in the microarrays analyses comparing human lung
 Supplementary Figure 1. A. Bar graph representing the expression levels of the 19 indicated genes in the microarrays analyses comparing human lung immortalized broncho-epithelial cells (AALE cells) expressing
MPB333:Molecular Endocrinology of Obesity and Diabetes
 MPB333:Molecular Endocrinology of Obesity and Diabetes The Use of Stem Cells as a Cure for Type 1 Diabetes January 15, 2010 Trish Labosky 9415C MRBIV trish.labosky@vanderbilt.edu In theory. 2. ~Easy and
Type of file: PDF Size of file: 0 KB Title of file for HTML: Supplementary Information Description: Supplementary Figures
 Type of file: PDF Size of file: 0 KB Title of file for HTML: Supplementary Information Description: Supplementary Figures Supplementary Figure 1 mir-128-3p is highly expressed in chemoresistant, metastatic
Supplementary Figure S1. Monolayer differentiation of mouse ESCs into telencephalic neural precursors. (a) Schematic representation of the protocols
 Schematic representation of the protocols") Supplementary Figure S1. Monolayer differentiation of mouse ESCs into telencephalic neural precursors. (a) Schematic representation of the protocols used to differentiate mouse ESCs. (b) Representative
Supplementary Figure S1. Monolayer differentiation of mouse ESCs into telencephalic neural precursors. (a) Schematic representation of the protocols used to differentiate mouse ESCs. (b) Representative
* * * * Supplementary Figure 1. DS Lv CK HSA CK HSA. CK Col-3. CK Col-3. See overleaf for figure legend. Cancer cells
 Supplementary Figure 1 Cancer cells Desmoplastic stroma Hepatocytes Pre-existing sinusoidal blood vessel New blood vessel a Normal liver b Desmoplastic HGP c Pushing HGP d Replacement HGP e f g h i DS
Supplementary information. The Light Intermediate Chain 2 Subpopulation of Dynein Regulates Mitotic. Spindle Orientation
 Supplementary information The Light Intermediate Chain 2 Subpopulation of Dynein Regulates Mitotic Spindle Orientation Running title: Dynein LICs distribute mitotic functions. Sagar Mahale a, d, *, Megha
Impact of Sox9 Dosage and Hes1-mediated Notch Signaling in Controlling the Plasticity of Adult Pancreatic Duct Cells in Mice
 Impact of Sox9 Dosage and Hes1-mediated Notch Signaling in Controlling the Plasticity of Adult Pancreatic Duct Cells in Mice Shinichi Hosokawa 1,3,Kenichiro Furuyama 1,3, Masashi Horiguchi 1,3,Yoshiki
Making Mature Human Islet Cells from Stem Cells to Model Disease and Treat Diabetes
 University of British Columbia Departments of Surgery and Cellular & Physiological Sciences Making Mature Human Islet Cells from Stem Cells to Model Disease and Treat Diabetes 2016 International Conference
Supplementary Table 1
 Supplementary Table 1 Flow Cytometry Antibodies Antibody Fluorochrome Clone Vendor CD45 PE-cyanine 7 30-F11 D ioscience CD3 Pacific lue 17A2 iolegend (San Diego, CA) CD11b APC M1/70 iolegend (San Diego,
Supplementary Information
 Supplementary Information Title Degeneration and impaired regeneration of gray matter oligodendrocytes in amyotrophic lateral sclerosis Authors Shin H. Kang, Ying Li, Masahiro Fukaya, Ileana Lorenzini,
Nature Medicine doi: /nm.3957
 Supplementary Fig. 1. p38 alternative activation, IL-21 expression, and T helper cell transcription factors in PDAC tissue. (a) Tissue microarrays of pancreatic tissue from 192 patients with pancreatic
Supplementary Materials. for Garmy-Susini, et al, Integrin 4 1 signaling is required for lymphangiogenesis and tumor metastasis
 Supplementary Materials for Garmy-Susini, et al, Integrin 4 1 signaling is required for lymphangiogenesis and tumor metastasis 1 Supplementary Figure Legends Supplementary Figure 1: Integrin expression
mm Distance (mm)
") b a Magnet Illumination Coverslips MPs Objective 2575 µm 1875 µm 1575 µm 1075 µm 875 µm 545 µm 20µm 2 3 0.5 0.3mm 1 1000 100 10 1 0.1 1000 100 10 1 0.1 Field Induction (Gauss) 1.5 0 5 10 15 20 Distance
b a Magnet Illumination Coverslips MPs Objective 2575 µm 1875 µm 1575 µm 1075 µm 875 µm 545 µm 20µm 2 3 0.5 0.3mm 1 1000 100 10 1 0.1 1000 100 10 1 0.1 Field Induction (Gauss) 1.5 0 5 10 15 20 Distance
Supplementary Information. Induction of human pancreatic beta cell replication by inhibitors of dual specificity tyrosine regulated kinase
 Journal: Nature Medicine Supplementary Information Induction of human pancreatic beta cell replication by inhibitors of dual specificity tyrosine regulated kinase 1,2 Peng Wang PhD, 1,2 Juan-Carlos Alvarez-Perez
Inhibition of DYRK1A stimulates human beta-cell proliferation
 Inhibition of DYRK1A stimulates human beta-cell proliferation Ercument Dirice 1,, Deepika Walpita 2,, Amedeo Vetere 2, Bennett C. Meier 2,5, Sevim Kahraman 1, Jiang Hu 1, Vlado Dančík 2, Sean M. Burns
Supplemental Figure 1. Quantification of proliferation in thyroid of WT, Ctns -/- and grafted
 Supplemental Figure 1. Quantification of proliferation in thyroid of WT, Ctns -/- and grafted Ctns -/- mice. Cells immunolabeled for the proliferation marker (Ki-67) were counted in sections (n=3 WT, n=4
Supplementary Materials for
 www.sciencetranslationalmedicine.org/cgi/content/full/4/117/117ra8/dc1 Supplementary Materials for Notch4 Normalization Reduces Blood Vessel Size in Arteriovenous Malformations Patrick A. Murphy, Tyson
Single-cell RNA-Seq profiling of human pre-implantation embryos and embryonic stem cells
 Single-cell RNA-Seq profiling of human pre-implantation embryos and embryonic stem cells Liying Yan,2,5, Mingyu Yang,5, Hongshan Guo, Lu Yang, Jun Wu, Rong Li,2, Ping Liu, Ying Lian, Xiaoying Zheng, Jie
Supplementary Figures
 Supplementary Figures Supplementary Figure 1 DOT1L regulates the expression of epithelial and mesenchymal markers. (a) The expression levels and cellular localizations of EMT markers were confirmed by
2017 CST-Astellas Canadian Transplant Fellows Symposium
 2017 CST-Astellas Canadian Transplant Fellows Symposium The Future of Transplantation Atul Humar, MD Atul Humar is a Professor in the Department of Medicine, University of Toronto. Dr. Humar received his
F-actin VWF Vinculin. F-actin. Vinculin VWF
 a F-actin VWF Vinculin b F-actin VWF Vinculin Supplementary Fig. 1. WPBs in HUVECs are located along stress fibers and at focal adhesions. (a) Immunofluorescence images of f-actin (cyan), VWF (yellow),
Nature Immunology: doi: /ni.3412
 Supplementary Figure 1 Gata1 expression in heamatopoietic stem and progenitor populations. (a) Unsupervised clustering according to 100 top variable genes across single pre-gm cells. The two main cell
Supplementary Figure 1: Neuregulin 1 increases the growth of mammary organoids compared to EGF. (a) Mammary epithelial cells were freshly isolated,
 Mammary epithelial cells were freshly isolated,") 1 2 3 4 5 6 7 8 9 10 Supplementary Figure 1: Neuregulin 1 increases the growth of mammary organoids compared to EGF. (a) Mammary epithelial cells were freshly isolated, embedded in matrigel and exposed
1 2 3 4 5 6 7 8 9 10 Supplementary Figure 1: Neuregulin 1 increases the growth of mammary organoids compared to EGF. (a) Mammary epithelial cells were freshly isolated, embedded in matrigel and exposed
Figure legends Supplemental Fig.1. Glucose-induced insulin secretion and insulin content of islets. Supplemental Fig. 2.
 Figure legends Supplemental Fig.. Glucose-induced insulin secretion and insulin content of islets. Insulin secretory responses to.,., and. mm glucose (A) (n = 7-), and the insulin content in the islets
Supplementary Figure 1. Genotyping strategies for Mcm3 +/+, Mcm3 +/Lox and Mcm3 +/- mice and luciferase activity in Mcm3 +/Lox mice. A.
 Supplementary Figure 1. Genotyping strategies for Mcm3 +/+, Mcm3 +/Lox and Mcm3 +/- mice and luciferase activity in Mcm3 +/Lox mice. A. Upper part, three-primer PCR strategy at the Mcm3 locus yielding
Supplementary Figure 1 Expression of Crb3 in mouse sciatic nerve: biochemical analysis (a) Schematic of Crb3 isoforms, ERLI and CLPI, indicating the
 Schematic of Crb3 isoforms, ERLI and CLPI, indicating the") Supplementary Figure 1 Expression of Crb3 in mouse sciatic nerve: biochemical analysis (a) Schematic of Crb3 isoforms, ERLI and CLPI, indicating the location of the transmembrane (TM), FRM binding (FB)
Supplementary Figure 1 Expression of Crb3 in mouse sciatic nerve: biochemical analysis (a) Schematic of Crb3 isoforms, ERLI and CLPI, indicating the location of the transmembrane (TM), FRM binding (FB)
SUPPLEMENTARY INFORMATION
 Suppl. Fig. 1 in vivo expression of ISL1 in the human fetal heart. a, Hematoxylin eosin staining showing structures of left atrium and left atrium appendage (*) of a human fetal heart at 11 weeks of gestation.
(a) Schematic diagram of the FS mutation of UVRAG in exon 8 containing the highly instable
 Schematic diagram of the FS mutation of UVRAG in exon 8 containing the highly instable") Supplementary Figure 1. Frameshift (FS) mutation in UVRAG. (a) Schematic diagram of the FS mutation of UVRAG in exon 8 containing the highly instable A 10 DNA repeat, generating a premature stop codon
Supplementary Figure 1. Frameshift (FS) mutation in UVRAG. (a) Schematic diagram of the FS mutation of UVRAG in exon 8 containing the highly instable A 10 DNA repeat, generating a premature stop codon
Nature Immunology: doi: /ni Supplementary Figure 1
 Supplementary Figure 1 NLRP12 is downregulated in biopsy samples from patients with active ulcerative colitis (UC). (a-g) NLRP12 expression in 7 UC mrna profiling studies deposited in NCBI GEO database.
Quantification of early stage lesions for loss of p53 should be shown in the main figures.
 Reviewer #1 (Remarks to the Author): Expert in prostate cancer The manuscript "Clonal dynamics following p53 loss of heterozygosity in Kras-driven cancers" uses a number of novel genetically engineered
Pharmacologic inhibition of histone demethylation as a therapy for pediatric brainstem glioma
 Supplementary information for: Pharmacologic inhibition of histone demethylation as a therapy for pediatric brainstem glioma Rintaro Hashizume 1, Noemi Andor 2, Yuichiro Ihara 2, Robin Lerner 2, Haiyun
supplementary information
 DOI: 10.1038/ncb2133 Figure S1 Actomyosin organisation in human squamous cell carcinoma. (a) Three examples of actomyosin organisation around the edges of squamous cell carcinoma biopsies are shown. Myosin
MII. Supplement Figure 1. CapZ β2. Merge. 250ng. 500ng DIC. Merge. Journal of Cell Science Supplementary Material. GFP-CapZ β2 DNA
 A GV GVBD MI DNA CapZ β2 CapZ β2 Merge B DIC GFP-CapZ β2 Merge CapZ β2-gfp 250ng 500ng Supplement Figure 1. MII A early MI late MI Control RNAi CapZαβ DNA Actin Tubulin B Phalloidin Intensity(A.U.) n=10
Columbia College of P&S Sarah Huang Hans Snoeck biorxiv ; doi: https://doi.org/ /261461
 Generation of pulmonary neuroendocrine cells and tumors resembling small cell lung cancers from human embryonic stem cells Weill Cornell Medicine Joyce Chen Arun Unni Harold Varmus Asaf Poran Olivier Elemento
Supplementary Figure 1. SA-β-Gal positive senescent cells in various cancer tissues. Representative frozen sections of breast, thyroid, colon and
 Supplementary Figure 1. SA-β-Gal positive senescent cells in various cancer tissues. Representative frozen sections of breast, thyroid, colon and stomach cancer were stained with SA-β-Gal and nuclear fast
Cluster Dendrogram. dist(cor(na.omit(tss.exprs.chip[, c(1:10, 24, 27, 30, 48:50, dist(cor(na.omit(tss.exprs.chip[, c(1:99, 103, 104, 109, 110,
 A Transcriptome (RNA-seq) Transcriptome (RNA-seq) 3. 2.5 2..5..5...5..5 2. 2.5 3. 2.5 2..5..5...5..5 2. 2.5 Cluster Dendrogram RS_ES3.2 RS_ES3. RS_SHS5.2 RS_SHS5. PS_SHS5.2 PS_SHS5. RS_LJ3 PS_LJ3..4 _SHS5.2
Supplementary Figure 1: Expression of NFAT proteins in Nfat2-deleted B cells (a+b) Protein expression of NFAT2 (a) and NFAT1 (b) in isolated splenic
 Protein expression of NFAT2 (a) and NFAT1 (b) in isolated splenic") Supplementary Figure 1: Expression of NFAT proteins in Nfat2-deleted B cells (a+b) Protein expression of NFAT2 (a) and NFAT1 (b) in isolated splenic B cells from WT Nfat2 +/+, TCL1 Nfat2 +/+ and TCL1 Nfat2
Supplementary Figure 1: Expression of NFAT proteins in Nfat2-deleted B cells (a+b) Protein expression of NFAT2 (a) and NFAT1 (b) in isolated splenic B cells from WT Nfat2 +/+, TCL1 Nfat2 +/+ and TCL1 Nfat2
Supplementary Fig. 1: ATM is phosphorylated in HER2 breast cancer cell lines. (A) ATM is phosphorylated in SKBR3 cells depending on ATM and HER2
 ATM is phosphorylated in SKBR3 cells depending on ATM and HER2") Supplementary Fig. 1: ATM is phosphorylated in HER2 breast cancer cell lines. (A) ATM is phosphorylated in SKBR3 cells depending on ATM and HER2 activity. Upper panel: Representative histograms for FACS
Supplementary Fig. 1: ATM is phosphorylated in HER2 breast cancer cell lines. (A) ATM is phosphorylated in SKBR3 cells depending on ATM and HER2 activity. Upper panel: Representative histograms for FACS
Nature Immunology: doi: /ni Supplementary Figure 1. Characteristics of SEs in T reg and T conv cells.
 Supplementary Figure 1 Characteristics of SEs in T reg and T conv cells. (a) Patterns of indicated transcription factor-binding at SEs and surrounding regions in T reg and T conv cells. Average normalized
T H E J O U R N A L O F C E L L B I O L O G Y
 T H E J O U R N A L O F C E L L B I O L O G Y Supplemental material Dunsch et al., http://www.jcb.org/cgi/content/full/jcb.201202112/dc1 Figure S1. Characterization of HMMR and CHICA antibodies. (A) HeLa
T H E J O U R N A L O F C E L L B I O L O G Y
 T H E J O U R N A L O F C E L L B I O L O G Y Supplemental material Amelio et al., http://www.jcb.org/cgi/content/full/jcb.201203134/dc1 Figure S1. mir-24 regulates proliferation and by itself induces
Cell Therapy for Diabetes: Generating Functional Islets from Human Exocrine Tissue
 Cell Therapy for Diabetes: Generating Functional Islets from Human Exocrine Tissue Kevin Docherty University of Aberdeen ELRIG Drug Discovery 2016 ACC Liverpool 14 th October 2016 Autoimmune destruction
SUPPLEMENTARY INFORMATION
 doi:10.1038/nature12652 Supplementary Figure 1. PRDM16 interacts with endogenous EHMT1 in brown adipocytes. Immunoprecipitation of PRDM16 complex by flag antibody (M2) followed by Western blot analysis
Supplemental Information. Myocardial Polyploidization Creates a Barrier. to Heart Regeneration in Zebrafish
 Developmental Cell, Volume 44 Supplemental Information Myocardial Polyploidization Creates a Barrier to Heart Regeneration in Zebrafish Juan Manuel González-Rosa, Michka Sharpe, Dorothy Field, Mark H.
Supporting Information
 Supporting Information Vaira et al. 10.1073/pnas.0907676107 0h 24h 48h PTEN pathway Expression 0h 24h 48h Time MAP Kinase Signaling Pathway Expression 0h 24h 48h Time Collagen Expression Fig. S1. Differential
GATA4 and GATA6 control mouse pancreas organogenesis
 GATA4 and GATA6 control mouse pancreas organogenesis Manuel Carrasco,, Francisco Martín, Anabel Rojas J Clin Invest. 2012;122(10):3504-3515. https://doi.org/10.1172/jci63240. Research Article Development
Boram Kim and Sanghoon Lee Department of Obstetrics and Gynecology, Korea University College of Medicine, Seoul, Korea
 Comparison of slow freezing versus vitrification for human ovarian tissue cryopreservation and xenotransplantation Boram Kim and Sanghoon Lee Department of Obstetrics and Gynecology, Korea University College
SUPPLEMENTARY INFORMATION
 DOI:.38/ncb3399 a b c d FSP DAPI 5mm mm 5mm 5mm e Correspond to melanoma in-situ Figure a DCT FSP- f MITF mm mm MlanaA melanoma in-situ DCT 5mm FSP- mm mm mm mm mm g melanoma in-situ MITF MlanaA mm mm
Nature Genetics: doi: /ng Supplementary Figure 1. Phenotypic characterization of MES- and ADRN-type cells.
 Supplementary Figure 1 Phenotypic characterization of MES- and ADRN-type cells. (a) Bright-field images showing cellular morphology of MES-type (691-MES, 700-MES, 717-MES) and ADRN-type (691-ADRN, 700-
Supplementary figures
 Supplementary figures Supplementary Figure 1. B cells stimulated with pokeweed mitogen display normal mitotic figures but not cells infected with B95-8. The figures show cells stimulated with pokeweed
stability and tumor suppression
 Supplementary information The stress kinase MKK7 couples oncogenic stress to p53 stability and tumor suppression Daniel Schramek 1, Athanassios Kotsinas 2, Arabella Meixner 1, Teiji Wada 1, Ulrich Elling
Supplementary Figure S1. Generation of LSL-EZH2 conditional transgenic mice.
 Downstream Col1A locus S P P P EP Genotyping with P1, P2 frt PGKneopA + frt hygro-pa Targeting vector Genotyping with P3, P4 P1 pcag-flpe P2 P3 P4 frt SApA CAG LSL PGKATG frt hygro-pa C. D. E. ormal KRAS
Lung Met 1 Lung Met 2 Lung Met Lung Met H3K4me1. Lung Met H3K27ac Primary H3K4me1
 a Gained Met-VELs 1.5 1.5 -.5 Lung Met 1 Lung Met Lung Met 3 1. Lung Met H3K4me1 Lung Met H3K4me1 1 Lung Met H3K4me1 Lung Met H3K7ac 1.5 Lung Met H3K7ac Lung Met H3K7ac.8 Primary H3K4me1 Primary H3K7ac
Supplementary Figure 1. Expression of phospho-sik3 in normal and osteoarthritic articular cartilage in the knee. (a) Semiserial histological sections
 Semiserial histological sections") Supplementary Figure 1. Expression of phospho-sik3 in normal and osteoarthritic articular cartilage in the knee. (a) Semiserial histological sections of normal cartilage were stained with safranin O-fast
Supplementary Figure 1. Expression of phospho-sik3 in normal and osteoarthritic articular cartilage in the knee. (a) Semiserial histological sections of normal cartilage were stained with safranin O-fast
Figure S1, related to Figure 1. Escaper p38a-expressing cancer cells repopulate the tumors (A) Scheme of the mt/mg reporter that expresses a
 Scheme of the mt/mg reporter that expresses a") Cancer Cell, Volume 33 Supplemental Information Targeting p38a Increases DNA Damage, Chromosome Instability, and the Anti-tumoral Response to Taxanes in Breast Cancer Cells Begoña Cánovas, Ana Igea, Alessandro
Cancer Cell, Volume 33 Supplemental Information Targeting p38a Increases DNA Damage, Chromosome Instability, and the Anti-tumoral Response to Taxanes in Breast Cancer Cells Begoña Cánovas, Ana Igea, Alessandro
Supplementary Information
 Supplementary Information Supplementary Figure 1. EBV-gB 23-431 mainly exists as trimer in HEK 293FT cells. (a) Western blotting analysis for DSS crosslinked FLAG-gB 23-431. HEK 293FT cells transfected
Supplementary Figure 1. BMS enhances human T cell activation in vitro in a
 Supplementary Figure 1. BMS98662 enhances human T cell activation in vitro in a concentration-dependent manner. Jurkat T cells were activated with anti-cd3 and anti-cd28 antibody in the presence of titrated
Effective Targeting of Quiescent Chronic Myelogenous
 Cancer Cell, Volume 7 Supplemental Information Effective Targeting of Quiescent Chronic Myelogenous Leukemia Stem Cells by Histone Deacetylase Inhibitors in Combination with Imatinib Mesylate Bin Zhang,
(a) Significant biological processes (upper panel) and disease biomarkers (lower panel)
 Significant biological processes (upper panel) and disease biomarkers (lower panel)") Supplementary Figure 1. Functional enrichment analyses of secretomic proteins. (a) Significant biological processes (upper panel) and disease biomarkers (lower panel) 2 involved by hrab37-mediated secretory
Supplementary Figure 1. Functional enrichment analyses of secretomic proteins. (a) Significant biological processes (upper panel) and disease biomarkers (lower panel) 2 involved by hrab37-mediated secretory
Supplementary Figure 1. Lkb1-deficient lung ADC progressively transdifferentiates into SCC. (a) A scheme showing the progression pattern of atypical
 A scheme showing the progression pattern of atypical") Supplementary Figure 1. Lkb1-deficient lung ADC progressively transdifferentiates into SCC. (a) A scheme showing the progression pattern of atypical adenomatous hyperplasia/epithelial hyperplasia (AAH/EH),
Supplementary Figure 1. Lkb1-deficient lung ADC progressively transdifferentiates into SCC. (a) A scheme showing the progression pattern of atypical adenomatous hyperplasia/epithelial hyperplasia (AAH/EH),
SUPPLEMENTARY LEGENDS...
 TABLE OF CONTENTS SUPPLEMENTARY LEGENDS... 2 11 MOVIE S1... 2 FIGURE S1 LEGEND... 3 FIGURE S2 LEGEND... 4 FIGURE S3 LEGEND... 5 FIGURE S4 LEGEND... 6 FIGURE S5 LEGEND... 7 FIGURE S6 LEGEND... 8 FIGURE
202002, India Author affiliations
 Copy number variation and microdeletions of the Y chromosome linked genes and loci across different categories of Indian infertile males Anju Kumari 1, Sandeep Kumar Yadav 1, M.M. Misro 2, Jamal Ahmad
Supplementary Figure 1 Induction of cellular senescence and isolation of exosome. a to c, Pre-senescent primary normal human diploid fibroblasts
 Supplementary Figure 1 Induction of cellular senescence and isolation of exosome. a to c, Pre-senescent primary normal human diploid fibroblasts (TIG-3 cells) were rendered senescent by either serial passage
Supplementary Figures
 Supplementary Figures Supplementary Fig. 1. Galectin-3 is present within tumors. (A) mrna expression levels of Lgals3 (galectin-3) and Lgals8 (galectin-8) in the four classes of cell lines as determined
Protein tyrosine phosphatase 1B targets PITX1/p120RasGAP. thus showing therapeutic potential in colorectal carcinoma
 Protein tyrosine phosphatase 1B targets PITX1/p120RasGAP thus showing therapeutic potential in colorectal carcinoma Hao-Wei Teng, Man-Hsin Hung, Li-Ju Chen, Mao-Ju Chang, Feng-Shu Hsieh, Ming-Hsien Tsai,
Supplementary Figure 1.
 Supplementary Figure 1. Transduction of adipocytes after intra-ewat administration of AAV vectors. A: Immunostaining against GFP (green) in sections of ewat two weeks after the intra-ewat administration
Inhibition of Cdk5 Promotes β-cell Differentiation from Ductal Progenitors
 Inhibition of Cdk5 Promotes β-cell Differentiation from Ductal Progenitors Ka-Cheuk Liu, Gunter Leuckx, Daisuke Sakano, Philip A. Seymour, Charlotte L. Mattsson, Linn Rautio, Willem Staels, Yannick Verdonck,
SUPPLEMENTARY INFORMATION
 SUPPLEMENTARY INFORMATION Human cerebral cortex development from pluripotent stem cells to functional excitatory synapses Yichen Shi 1,2, Peter Kirwan 1,2, James Smith 1,2, Hugh P.C. Robinson 3 and Frederick
Title page. Title: MicroRNA-155 Controls Exosome Synthesis and Promotes Gemcitabine Resistance in
 Title page Title: MicroRNA- Controls Synthesis and Promotes Gemcitabine Resistance in Pancreatic Ductal Adenocarcinoma Authors Manabu Mikamori, Daisaku Yamada, Hidetoshi Eguchi, Shinichiro Hasegawa, Tomoya
Mohamed Bentires-Alj
 San Antonio Breast Cancer Symposium, December 6-10, 2016 Mohamed Bentires-Alj Professor of experimental surgical oncology Department of Biomedicine University of Basel University Hospital Basel m.bentires-alj@unibas.ch
7SK ChIRP-seq is specifically RNA dependent and conserved between mice and humans.
 Supplementary Figure 1 7SK ChIRP-seq is specifically RNA dependent and conserved between mice and humans. Regions targeted by the Even and Odd ChIRP probes mapped to a secondary structure model 56 of the
Supplemental Figure 1. Intracranial transduction of a modified ptomo lentiviral vector in the mouse
 Supplemental figure legends Supplemental Figure 1. Intracranial transduction of a modified ptomo lentiviral vector in the mouse hippocampus targets GFAP-positive but not NeuN-positive cells. (A) Stereotaxic
Supplementary Table 1. Characterization of HNSCC PDX models established at MSKCC
 Supplementary Table 1. Characterization of HNSCC PDX models established at MSKCC Supplementary Table 2. Drug content and loading efficiency estimated with F-NMR and UV- Vis Supplementary Table 3. Complete
Supplementary Figure 1. Double-staining immunofluorescence analysis of invasive colon and breast cancers. Specimens from invasive ductal breast
 Supplementary Figure 1. Double-staining immunofluorescence analysis of invasive colon and breast cancers. Specimens from invasive ductal breast carcinoma (a) and colon adenocarcinoma (b) were staining
Polycomb protein Ezh2 regulates pancreatic β-cell Ink4a/Arf expression and regeneration in streptozotocin-induced diabetes mellitus
 Chen et al. 1 Polycomb protein Ezh2 regulates pancreatic β-cell Ink4a/Arf expression and regeneration in streptozotocin-induced diabetes mellitus Hainan Chen 1, Xueying Gu 1, I-hsin Su 2, Rita Bottino
The Terry Fox Pan-Canadian Enhanced Pancreatic Cancer Profiling for Individualized Care (EPPIC) Project 19 Sep :00am-5:30pm
 Project 19 Sep :00am-5:30pm") TFRI Pancreatic Cancer Workshop Project Name: Date: The Terry Fox Pan-Canadian Enhanced Pancreatic Cancer Profiling for Individualized Care (EPPIC) Project 19 Sep 2015 9:00am-5:30pm Location: Sheraton
TFRI Pancreatic Cancer Workshop Project Name: Date: The Terry Fox Pan-Canadian Enhanced Pancreatic Cancer Profiling for Individualized Care (EPPIC) Project 19 Sep 2015 9:00am-5:30pm Location: Sheraton
Promoting Innovative Practice
 Promoting Innovative Practice Development of centralised care in advanced pancreatic cancer 1 Dr Olosula O Faluyi, Consultant in Medical Oncology and Dr Daniel H Palmer, Chair in Medical Oncology, Clatterbridge
Nature Neuroscience: doi: /nn Supplementary Figure 1. MADM labeling of thalamic clones.
 Supplementary Figure 1 MADM labeling of thalamic clones. (a) Confocal images of an E12 Nestin-CreERT2;Ai9-tdTomato brain treated with TM at E10 and stained for BLBP (green), a radial glial progenitor-specific
Nature Medicine: doi: /nm.2109
 HIV 1 Infects Multipotent Progenitor Cells Causing Cell Death and Establishing Latent Cellular Reservoirs Christoph C. Carter, Adewunmi Onafuwa Nuga, Lucy A. M c Namara, James Riddell IV, Dale Bixby, Michael
Supplementary Information Titles Journal: Nature Medicine
 Supplementary Information Titles Journal: Nature Medicine Article Title: Corresponding Author: Supplementary Item & Number Supplementary Fig.1 Fig.2 Fig.3 Fig.4 Fig.5 Fig.6 Fig.7 Fig.8 Fig.9 Fig. Fig.11
SUPPLEMENTARY INFORMATION
 DOI: 10.1038/ncb2535 Figure S1 SOX10 is expressed in human giant congenital nevi and its expression in human melanoma samples suggests that SOX10 functions in a MITF-independent manner. a, b, Representative