TFEB-mediated increase in peripheral lysosomes regulates. Store Operated Calcium Entry
|
|
|
- Briana Hutchinson
- 6 years ago
- Views:
Transcription
1 TFEB-mediated increase in peripheral lysosomes regulates Store Operated Calcium Entry Luigi Sbano, Massimo Bonora, Saverio Marchi, Federica Baldassari, Diego L. Medina, Andrea Ballabio, Carlotta Giorgi and Paolo Pinton
2 Supplementary information Methods Immunoblotting For immunoblotting, cells were scraped into ice-cold, phosphate buffered saline (PBS) and lysed in a buffer containing 50 mm Tris HCl ph 7.4, 150 mm NaCl, 1% Triton X-100, 0.2% SDS, protease and phosphatase inhibitor cocktail. After 30 min of incubation on ice and centrifugation at 2,500 rpm at 4 C for 5 min, proteins were quantified by the Lowry method, and 10 µg of each sample was loaded onto a Novex NuPage Bis-Tris 4 12% precast gel (Life Technologies). The separated proteins were transferred to nitrocellulose membranes. After incubation with TBS Tween-20 (0.05%) supplemented with 5% non-fat powdered milk for 1 h to saturate unspecific binding sites, the membranes were incubated overnight with primary antibodies. Detection was achieved using appropriate horseradish peroxidase-labeled secondary antibodies (Santa Cruz Biotechnology), followed by biochemiluminescence (ThermoScientific) using an ImageQuant LAS4000 (GE Healthcare). Antibodies The following primary antibodies were used for Western blotting: rabbit anti-flag [F7425] (1:2,000) and mouse anti-b-actin [A1978] (1:10,000) from Sigma-Aldrich; rabbit anti-gapdh [#2118] (1:5,000) and rabbit anti-tfeb [#4240] (1:1000) from Cell Signaling; rabbit anti-stim1 [sc-68897] (1:1,000) and rabbit anti-orai1 [sc-68895] (1:1,000) from Santa Cruz Biotechnology. Analysis of lysosomal morphology HeLa cells expressing a lysosomal-targeted variant of GFP (LAMP1-GFP) were imaged using an IX-81 automated epifluorescence microscope (Olympus) equipped with a 60 oil-immersion objective (N.A. 1.35, from Olympus) and an ORCA-R2 CCD camera (Hamamatsu Photonics K.K.).
3 Selected cells were followed over time, and z-stacks were subjected to digital deconvolution using a Wiener deconvolution filter and a theoretical point-spread function provided by Xcellence software (Olympus). GFP-positive objects were quantified using BITPLANE Imaris 4. Cell treatment in the starvation experiment For starvation experiments, cells were cultured in the following media for 6 h: (normal) DMEM high glucose supplemented with 10% FBS; (starvation) HBSS with Ca 2+ and Mg 2+ supplemented with 10 mm HEPES. During starvation, cells were treated with CsA (10 μm) or DMSO (vehicle) to inhibit the phosphatase calcineurin. Immunofluorescence Cells, transfected or treated as described, were washed with PBS and fixed with 4% formaldehyde for 10 min at room temperature. After washing three times with PBS, the cells were permeabilized with 0.1% Triton X-100 in PBS (PBST) at room temperature for 10 min and blocked with PBST containing 5% BSA at room temperature for 1 h. The cells were incubated with an anti-flag primary antibody (Sigma-Aldrich, dilution 1:100) in PBST containing 5% BSA overnight at 4 C, washed three times with PBS, and then incubated with appropriate isotype-matched, AlexaFluor 488-conjugated secondary antibodies (Life Technologies, dilution 1:1000) at room temperature for 1 h. Digital images were acquired using a confocal microscope (Zeiss LSM510) with a NA Plan-Apochromat oil-immersion objective and analyzed using Fiji open-source software.
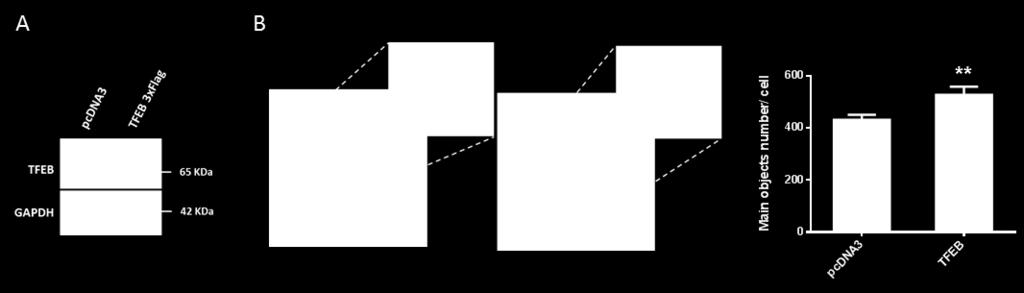
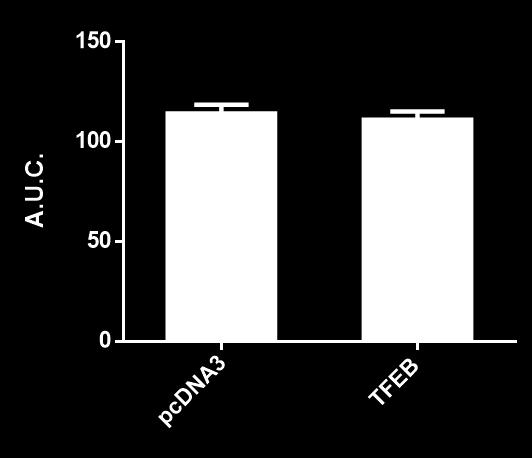
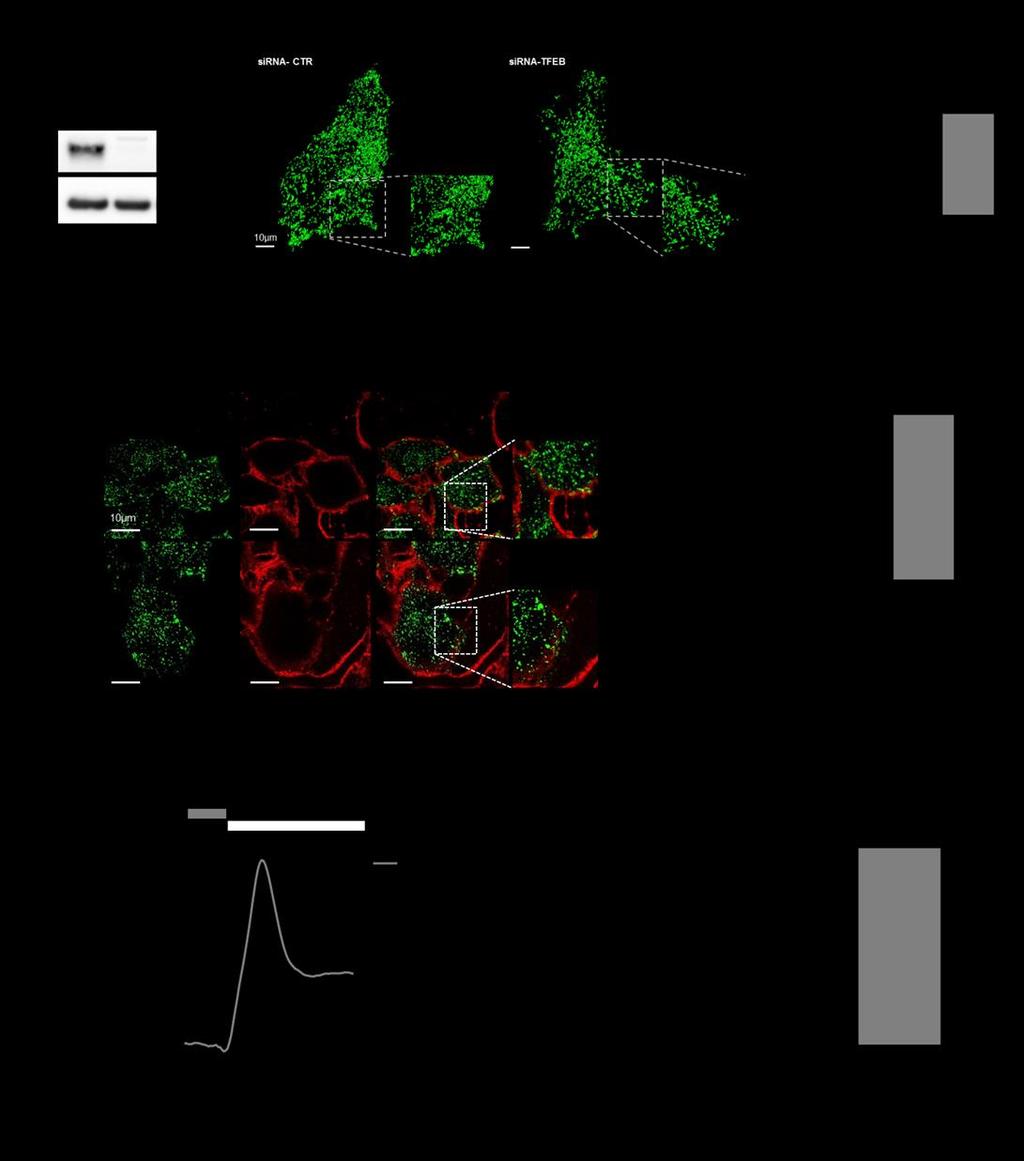
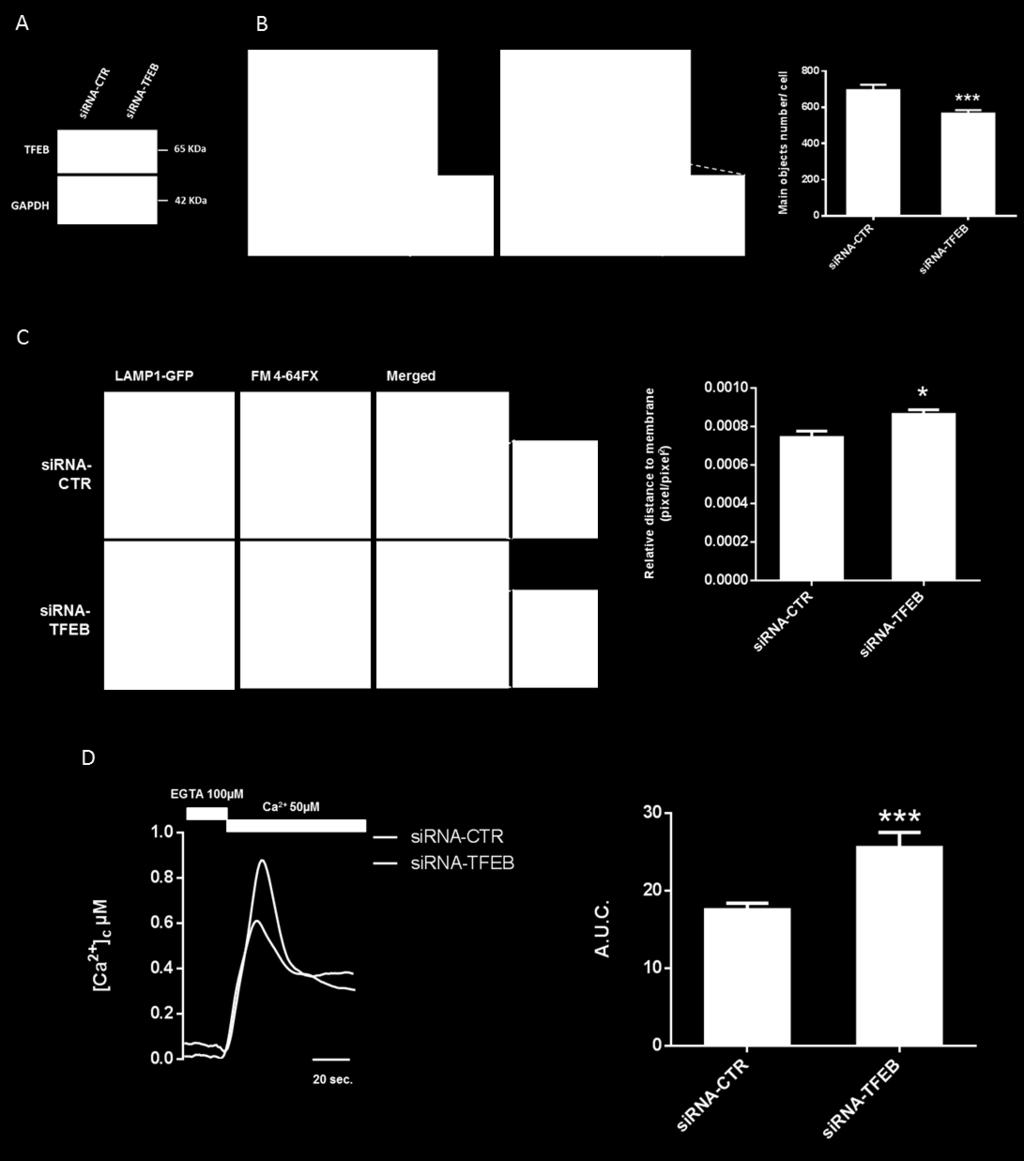
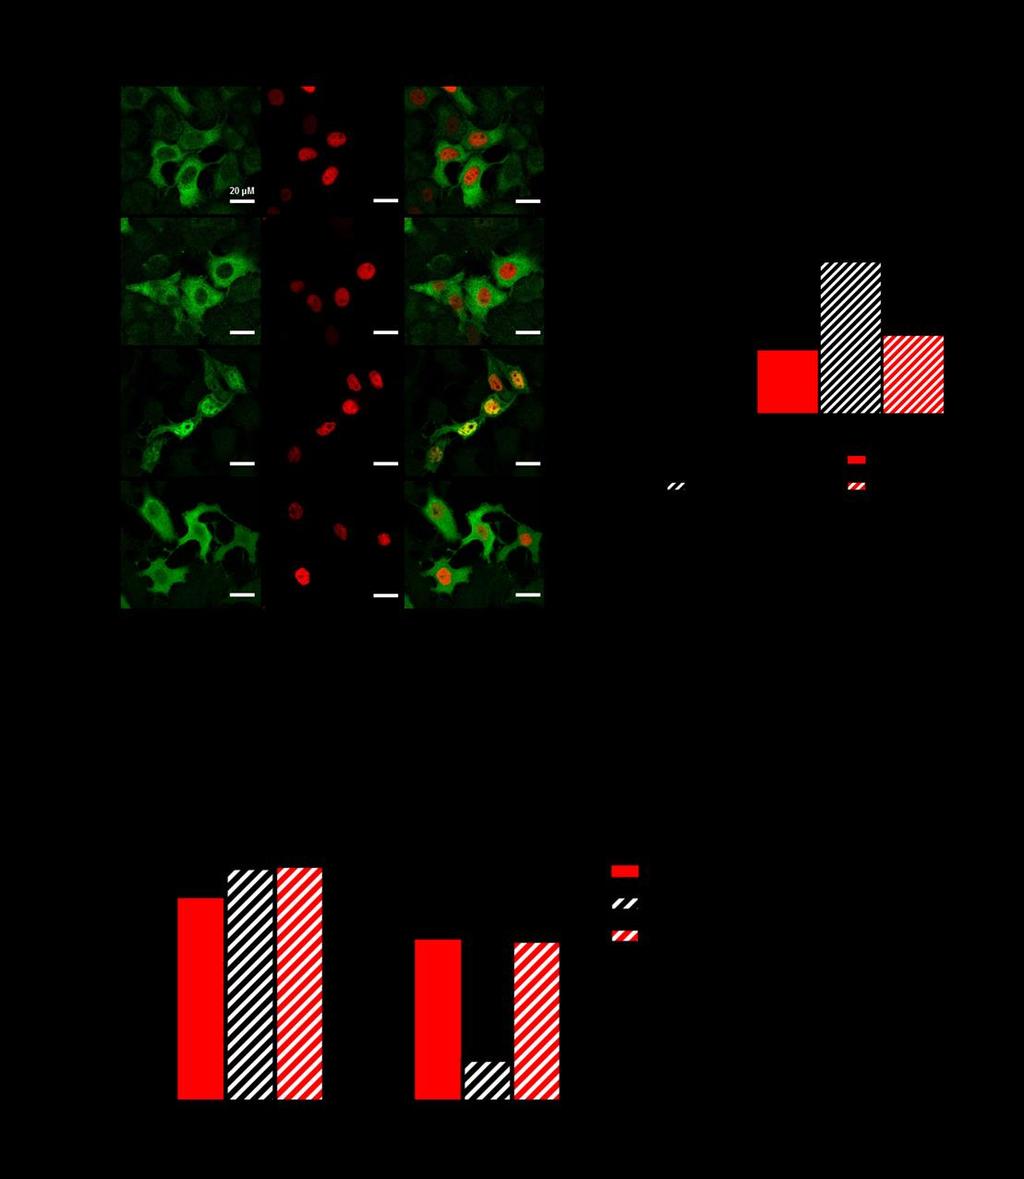
4 Figure legends Fig. S1. Transient overexpression of TFEB increased the lysosomal network in HeLa cells. (A) Representative immunoblot images of TFEB protein abundance in HeLa cells transfected for 48 h with the empty vector (pcdna3) or plasmid encoding TFEB 3xflag (TFEB). (B) Representative images of lysosomal morphology and quantification of lysosomal number in HeLa cells cotransfected for 48 h with LAMP1-GFP (green) and pcdna3 (Control) or TFEB 3xflag (TFEB) (pcdna3 n = 27, TFEB n = 28). Data are presented as the means ± SEM, **p<0.01. Fig. S2. TFEB overexpression modulated capacitative Ca 2+ entry at low extracellular Ca 2+ concentrations. Cytosolic Ca 2+ measurements of capacitative Ca 2+ entry measured by cytosolic aequorin in HeLa cells transfected with pcdna3 or TFEB 3xflag (TFEB). After intracellular Ca 2+ store depletion, 1 mm Ca 2+ was perfused in solution (n = 12 for each experiment). Data are presented as the means ± SEM. a.u.c. = area under the curve. Fig. S3. Downregulation of TFEB decreased the lysosomal network and lysosomal localization to the PM, thereby increasing capacitative Ca 2+ entry in HeLa cells. (A) Representative immunoblot images of TFEB protein abundance in HeLa cells transfected for 72 h with control sirna (sirna-ctr) or sirna for TFEB (sirna-tfeb). (B) Representative images of lysosomal morphology and quantification of lysosomal number in HeLa cells transfected for 48 h with LAMP1-GFP (green) and silenced for 72 h with control sirna (sirna-ctr) or sirna for TFEB (sirna-tfeb) (n = 34 for each condition). (C) Representative images and quantification of lysosomal distance to the plasma membrane normalized on the cellular area in HeLa cells transfected for 48 h with LAMP1-GFP (green) and silenced for 72 h with sirna control (sirna-ctr) or sirna for TFEB (sirna-tfeb); the plasma membrane is stained with FM4-64fx
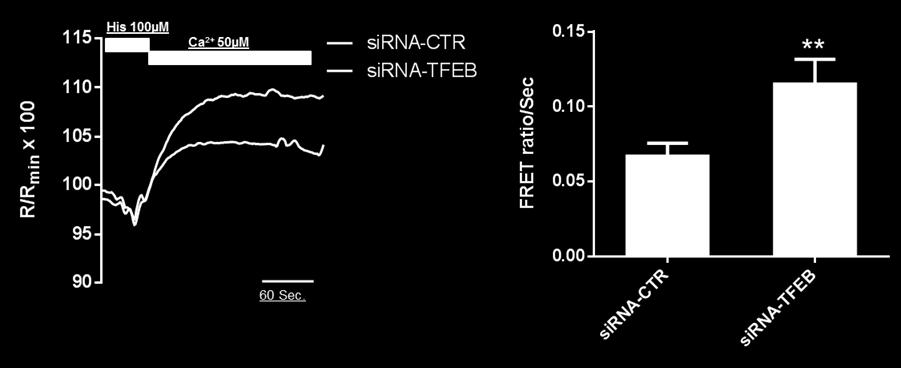
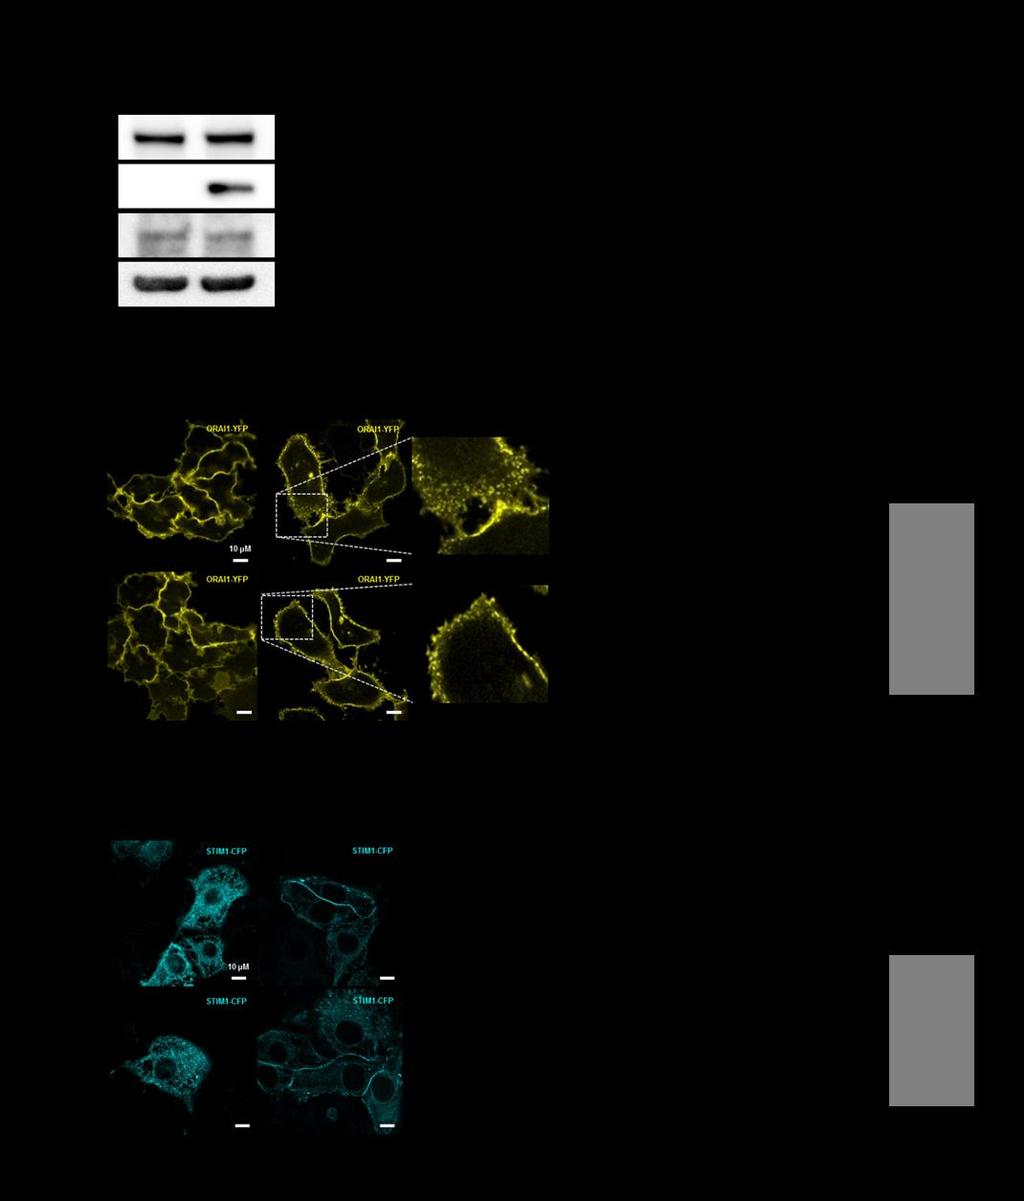
5 dye (red) (sirna-ctr n = 17, sirna-tfeb n = 11). (D) Cytosolic Ca 2+ measurements of capacitative Ca 2+ entry measured by cytosolic aequorin in HeLa cells transfected with control sirna (sirna-ctr) or sirna for TFEB (sirna-tfeb). After intracellular Ca 2+ store depletion, 50 μm Ca 2+ was perfused in solution (sirna-ctr n = 23, sirna-tfeb n = 16). Data are presented as the means ± SEM; *p<0.05, ***p< a.u.c. = area under the curve. Fig. S4. TFEB overexpression did not alter the basal ER Ca 2+ concentration. (A) Representation of phases of FRET experiments in HeLa cells transfected with the ER-targeted Cameleon (D1ER) probe to directly measure [Ca 2+ ]ER. Ca 2+ was depleted from the ER with agonist (histamine 100 μm) and subsequently stimulated with 50 M Ca 2+ to induce ER Ca 2+ re-uptake. (B) The ER Ca 2+ concentration measured with ER-targeted aequorin in control (pcdna3) or overexpressing TFEB 3xflag (TFEB) HeLa cells in the presence of a low extracellular Ca 2+ concentration (CaCl2 50 μm). Administration of histamine (100 μm) resulted in comparable ER emptying under both conditions (n = 10 for each condition). Data are presented as the means ± SEM. Fig. S5. Transient TFEB downregulation increased Ca 2+ re-uptake by the endoplasmic reticulum. Ca 2+ re-uptake rate measurement using the ER-targeted Cameleon (D1ER) probe in HeLa cells transfected for 72 h with control sirna (sirna-ctr) or sirna for TFEB (sirna-tfeb) during washout of agonist (histamine 100 μm) (pcdna3 n = 41, TFEB n = 33). Data are presented as the means ± SEM; **p<0.01. Fig. S6. TFEB overexpression did not influence STIM1 and ORAI1 expression or punctae formation.
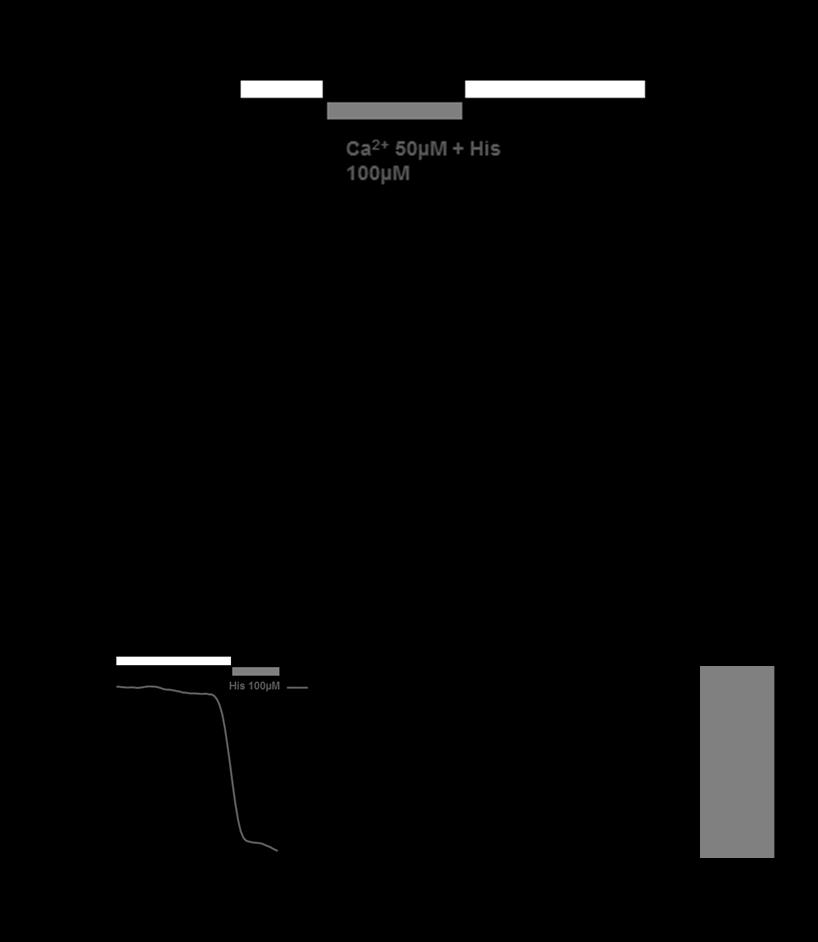
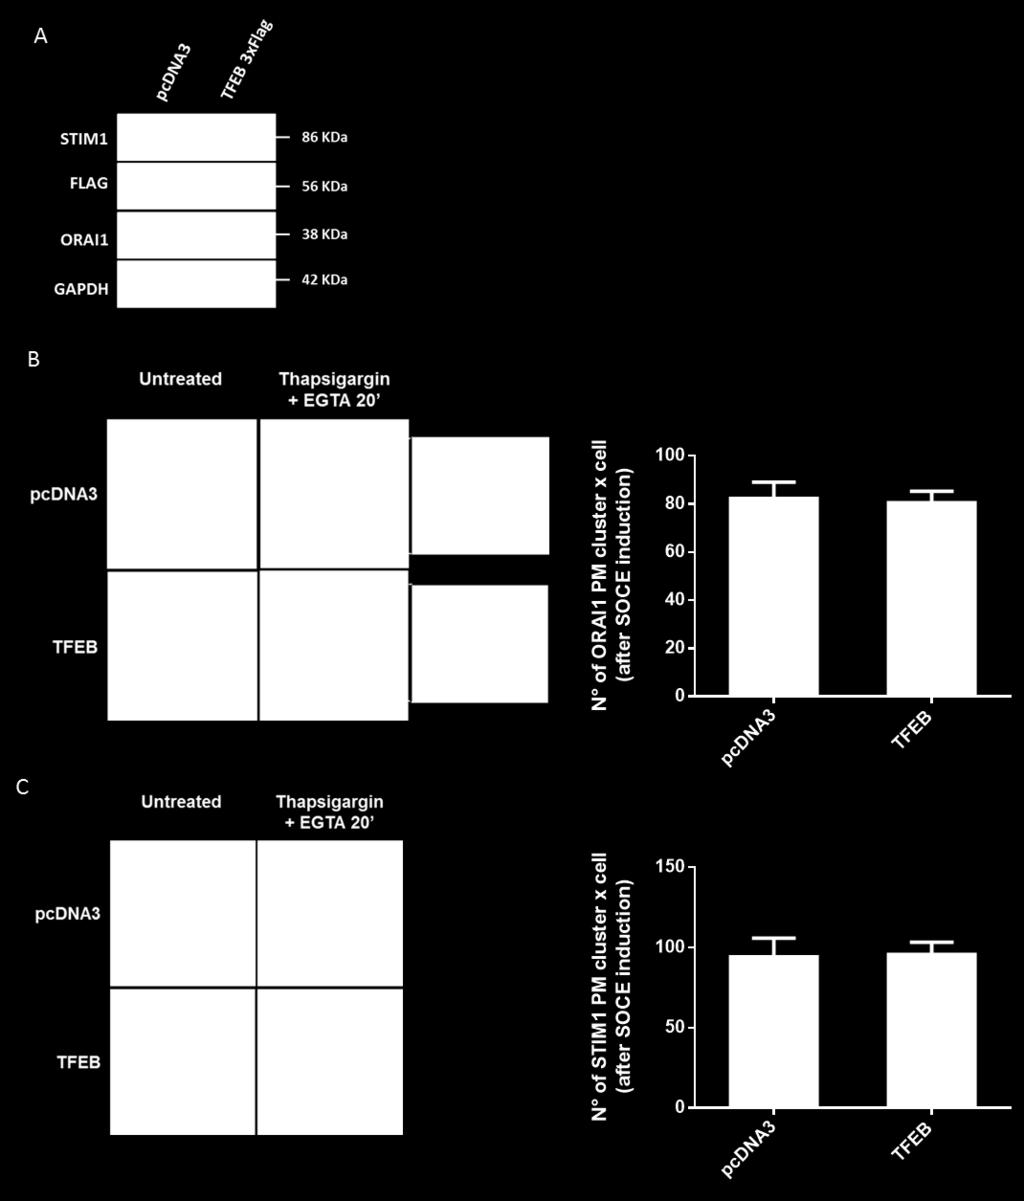
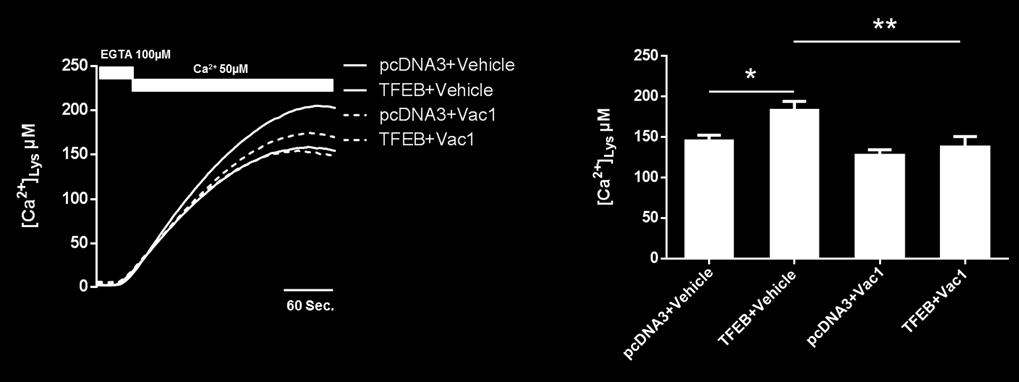
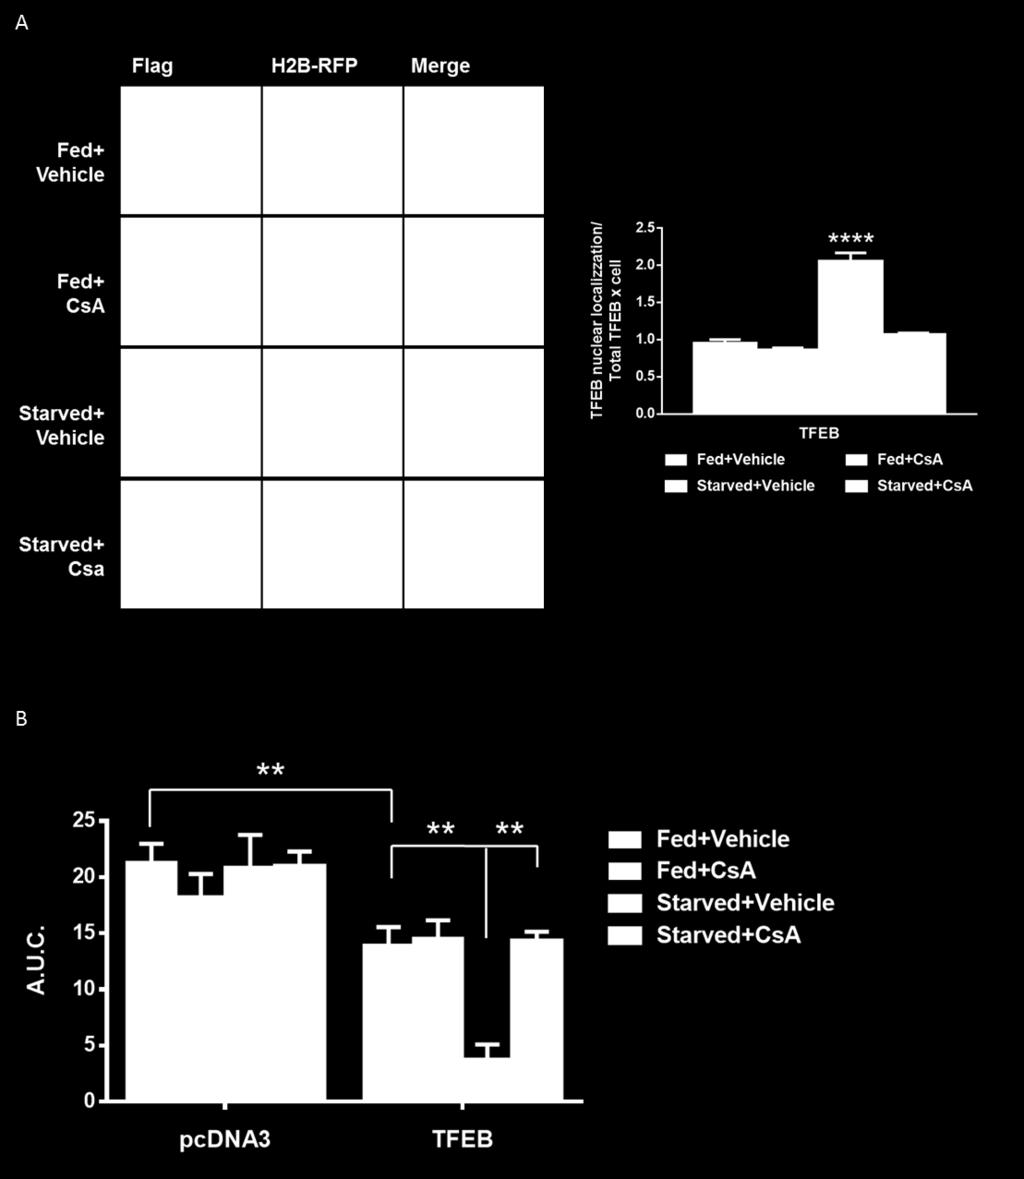
6 (A) Representative immunoblot images of protein expression levels of STIM1 and ORAI1 in HeLa cells transfected for 48 h with a plasmid expressing pcdna3 (Control) or TFEB 3xflag (TFEB). (B) ORAI1-YFP representative images and ORAI1 clusters quantification of HeLa cells transfected with a plasmid expressing pcdna3 (Control) or TFEB 3xflag (TFEB) before and after treatment with thapsigargin (200 nm) for 15 min in a Ca 2+ -free medium (KRB/EGTA) (pcdna3 n = 16, TFEB n = 13). (C) STIM1-YFP representative images and STIM1 clusters quantification of HeLa cells transfected with a plasmid expressing pcdna3 (Control) or TFEB 3xflag (TFEB) before and after treatment with thapsigargin (200 nm) for 15 min in a Ca 2+ -free medium (KRB/EGTA) (pcdna3 n = 13, TFEB n = 14). Data are presented as the means ± SEM. Fig. S7. Vac-1 treatment reduced lysosomal Ca 2+ in TFEB-overexpressing cells. (A) Lysosomal Ca 2+ uptake measured using lysosomal aequorin in HeLa cells transfected with pcdna3 (control) or with TFEB3xflag (TFEB) and pretreated with 10 μm Vac-1 or DMSO (vehicle) for 1 h. After intracellular Ca 2+ store depletion, the cells were perfused with 50 μm Ca 2+ (pcdna3 + Vehicle n = 12, TFEB + Vehicle n = 12, pcdna3 + Vac-1 n = 9, TFEB + Vac-1 n = 9). Data are presented as the means ± SEM; *p<0.05, **p<0.01. Fig. S8. The calcineurin/tfeb pathway modulates SOCE in TFEB-overexpressing HeLa cells. (A) Representative immunofluorescence images and quantification of TFEB nuclear localization (green) on the total TFEB fraction of HeLa cells overexpressing TFEB 3xflag under basal conditions (fed) of after 6 h of starvation (starved), treated with vehicle (DMSO) or CsA (10 μm). The cells were also transfected with the H2B-RFP construct to mark the nucleus (red) (Fed + Vehicle n = 29, Fed + CsA n = 28, Starved + Vehicle n = 18, Starved + CsA n = 45). (B) Cytosolic Ca 2+ measurements of capacitative Ca 2+ entry measured using cytosolic aequorin in HeLa cells transfected with pcdna3 or TFEB 3xflag (TFEB) under basal conditions (fed) of after 6 h of
7 starvation (starved), treated with vehicle (DMSO) or CsA (10 μm). After intracellular Ca 2+ store depletion, 50 μm Ca 2+ was perfused in solution (for pcdna3 samples: Fed + Vehicle n = 7, Fed + CsA n = 8, Starved + Vehicle n = 7, Starved + CsA n = 8; for TFEB samples: Fed + Vehicle n = 8, Fed + CsA n = 7, Starved + Vehicle n = 8, Starved + CsA n = 7). Data are presented as the means ± SEM; **p<0.01, ****p< a.u.c. = area under the curve.

8 Supplementary Figure S1.
9 Supplementary Figure S2.
10 Supplementary Figure S3.
11 Supplementary Figure S4.
12 Supplementary Figure S5.
13 Supplementary Figure S6.
14 Supplementary Figure S7.
15 Supplementary Figure S8.
SUPPLEMENTARY INFORMATION
 Supplementary Figures Supplementary Figure S1. Binding of full-length OGT and deletion mutants to PIP strips (Echelon Biosciences). Supplementary Figure S2. Binding of the OGT (919-1036) fragments with
HCC1937 is the HCC1937-pcDNA3 cell line, which was derived from a breast cancer with a mutation
 SUPPLEMENTARY INFORMATION Materials and Methods Human cell lines and culture conditions HCC1937 is the HCC1937-pcDNA3 cell line, which was derived from a breast cancer with a mutation in exon 20 of BRCA1
Protocol for Gene Transfection & Western Blotting
 The schedule and the manual of basic techniques for cell culture Advanced Protocol for Gene Transfection & Western Blotting Schedule Day 1 26/07/2008 Transfection Day 3 28/07/2008 Cell lysis Immunoprecipitation
The Schedule and the Manual of Basic Techniques for Cell Culture
 The Schedule and the Manual of Basic Techniques for Cell Culture 1 Materials Calcium Phosphate Transfection Kit: Invitrogen Cat.No.K2780-01 Falcon tube (Cat No.35-2054:12 x 75 mm, 5 ml tube) Cell: 293
T H E J O U R N A L O F C E L L B I O L O G Y
 Supplemental material Chairoungdua et al., http://www.jcb.org/cgi/content/full/jcb.201002049/dc1 T H E J O U R N A L O F C E L L B I O L O G Y Figure S1. Expression of CD9 and CD82 inhibits Wnt/ -catenin
Supplementary Figure S1. Venn diagram analysis of mrna microarray data and mirna target analysis. (a) Western blot analysis of T lymphoblasts (CLS)
 Western blot analysis of T lymphoblasts (CLS)") Supplementary Figure S1. Venn diagram analysis of mrna microarray data and mirna target analysis. (a) Western blot analysis of T lymphoblasts (CLS) and their exosomes (EXO) in resting (REST) and activated
Supplementary Figure S1. Venn diagram analysis of mrna microarray data and mirna target analysis. (a) Western blot analysis of T lymphoblasts (CLS) and their exosomes (EXO) in resting (REST) and activated
Supplementary Information
 Supplementary Information Supplementary Figure 1. CD4 + T cell activation and lack of apoptosis after crosslinking with anti-cd3 + anti-cd28 + anti-cd160. (a) Flow cytometry of anti-cd160 (5D.10A11) binding
Supplementary Figure 1.TRIM33 binds β-catenin in the nucleus. a & b, Co-IP of endogenous TRIM33 with β-catenin in HT-29 cells (a) and HEK 293T cells
 and HEK 293T cells") Supplementary Figure 1.TRIM33 binds β-catenin in the nucleus. a & b, Co-IP of endogenous TRIM33 with β-catenin in HT-29 cells (a) and HEK 293T cells (b). TRIM33 was immunoprecipitated, and the amount of
Supplementary Figure 1.TRIM33 binds β-catenin in the nucleus. a & b, Co-IP of endogenous TRIM33 with β-catenin in HT-29 cells (a) and HEK 293T cells (b). TRIM33 was immunoprecipitated, and the amount of
MTC-TT and TPC-1 cell lines were cultured in RPMI medium (Gibco, Breda, The Netherlands)
") Supplemental data Materials and Methods Cell culture MTC-TT and TPC-1 cell lines were cultured in RPMI medium (Gibco, Breda, The Netherlands) supplemented with 15% or 10% (for TPC-1) fetal bovine serum
Supplemental data Materials and Methods Cell culture MTC-TT and TPC-1 cell lines were cultured in RPMI medium (Gibco, Breda, The Netherlands) supplemented with 15% or 10% (for TPC-1) fetal bovine serum
Supplemental Information. Autophagy in Oncogenic K-Ras. Promotes Basal Extrusion. of Epithelial Cells by Degrading S1P. Current Biology, Volume 24
 Current Biology, Volume 24 Supplemental Information Autophagy in Oncogenic K-Ras Promotes Basal Extrusion of Epithelial Cells by Degrading S1P Gloria Slattum, Yapeng Gu, Roger Sabbadini, and Jody Rosenblatt
IP: anti-gfp VPS29-GFP. IP: anti-vps26. IP: anti-gfp - + +
 FAM21 Strump. WASH1 IP: anti- 1 2 3 4 5 6 FAM21 Strump. FKBP IP: anti-gfp VPS29- GFP GFP-FAM21 tail H H/P P H H/P P c FAM21 FKBP Strump. VPS29-GFP IP: anti-gfp 1 2 3 FKBP VPS VPS VPS VPS29 1 = VPS29-GFP
SUPPLEMENTARY INFORMATION
 SUPPLEMENTARY INFORMATION FOR Liver X Receptor α mediates hepatic triglyceride accumulation through upregulation of G0/G1 Switch Gene 2 (G0S2) expression I: SUPPLEMENTARY METHODS II: SUPPLEMENTARY FIGURES
Supplementary data Supplementary Figure 1 Supplementary Figure 2
 Supplementary data Supplementary Figure 1 SPHK1 sirna increases RANKL-induced osteoclastogenesis in RAW264.7 cell culture. (A) RAW264.7 cells were transfected with oligocassettes containing SPHK1 sirna
Evaluation of directed and random motility in microslides Assessment of leukocyte adhesion in flow chambers
 Evaluation of directed and random motility in microslides Motility experiments in IBIDI microslides, image acquisition and processing were performed as described. PMN, which ended up in an angle < 180
Figure S1. PMVs from THP-1 cells expose phosphatidylserine and carry actin. A) Flow
 Flow") SUPPLEMENTARY DATA Supplementary Figure Legends Figure S1. PMVs from THP-1 cells expose phosphatidylserine and carry actin. A) Flow cytometry analysis of PMVs labelled with annexin-v-pe (Guava technologies)
SUPPLEMENTARY DATA Supplementary Figure Legends Figure S1. PMVs from THP-1 cells expose phosphatidylserine and carry actin. A) Flow cytometry analysis of PMVs labelled with annexin-v-pe (Guava technologies)
MicroRNA sponges: competitive inhibitors of small RNAs in mammalian cells
 MicroRNA sponges: competitive inhibitors of small RNAs in mammalian cells Margaret S Ebert, Joel R Neilson & Phillip A Sharp Supplementary figures and text: Supplementary Figure 1. Effect of sponges on
HIV-1 Virus-like Particle Budding Assay Nathan H Vande Burgt, Luis J Cocka * and Paul Bates
 HIV-1 Virus-like Particle Budding Assay Nathan H Vande Burgt, Luis J Cocka * and Paul Bates Department of Microbiology, Perelman School of Medicine at the University of Pennsylvania, Philadelphia, USA
GFP-LC3 +/+ CLU -/- kda CLU GFP. Actin. GFP-LC3 +/+ CLU -/- kda CLU GFP. Actin
 Supplementary Fig. 1 a CQ treatment ScrB OGX11 MG132 I II AZD5363 I II b GFP / / GFP / / GFP / / GFP / / GFP GFP Actin Actin ctrl CQ GFP / / GFP / / GFP / / GFP / / GFP GFP Actin Actin rapamycin rapamycincq
p = formed with HCI-001 p = Relative # of blood vessels that formed with HCI-002 Control Bevacizumab + 17AAG Bevacizumab 17AAG
 A.. Relative # of ECs associated with HCI-001 1.4 1.2 1.0 0.8 0.6 0.4 0.2 0.0 ol b p < 0.001 Relative # of blood vessels that formed with HCI-001 1.4 1.2 1.0 0.8 0.6 0.4 0.2 0.0 l b p = 0.002 Control IHC:
2,6,9-Triazabicyclo[3.3.1]nonanes as overlooked. amino-modification products by acrolein
![2,6,9-Triazabicyclo[3.3.1]nonanes as overlooked. amino-modification products by acrolein](/thumbs/86/94743397.jpg "2,6,9-Triazabicyclo[3.3.1]nonanes as overlooked. amino-modification products by acrolein") Supplementary Information 2,6,9-Triazabicyclo[3.3.1]nonanes as overlooked amino-modification products by acrolein Ayumi Tsutsui and Katsunori Tanaka* Biofunctional Synthetic Chemistry Laboratory, RIKEN
Supplementary Information 2,6,9-Triazabicyclo[3.3.1]nonanes as overlooked amino-modification products by acrolein Ayumi Tsutsui and Katsunori Tanaka* Biofunctional Synthetic Chemistry Laboratory, RIKEN
2.5. AMPK activity
 Supplement Fig. A 3 B phos-ampk 2.5 * Control AICAR AMPK AMPK activity (Absorbance at 45 nm) 2.5.5 Control AICAR Supplement Fig. Effects of AICAR on AMPK activation in macrophages. J774. macrophages were
(a) Significant biological processes (upper panel) and disease biomarkers (lower panel)
 Significant biological processes (upper panel) and disease biomarkers (lower panel)") Supplementary Figure 1. Functional enrichment analyses of secretomic proteins. (a) Significant biological processes (upper panel) and disease biomarkers (lower panel) 2 involved by hrab37-mediated secretory
Supplementary Figure 1. Functional enrichment analyses of secretomic proteins. (a) Significant biological processes (upper panel) and disease biomarkers (lower panel) 2 involved by hrab37-mediated secretory
Sestrin2 and BNIP3 (Bcl-2/adenovirus E1B 19kDa-interacting. protein3) regulate autophagy and mitophagy in renal tubular cells in. acute kidney injury
 regulate autophagy and mitophagy in renal tubular cells in. acute kidney injury") Sestrin2 and BNIP3 (Bcl-2/adenovirus E1B 19kDa-interacting protein3) regulate autophagy and mitophagy in renal tubular cells in acute kidney injury by Masayuki Ishihara 1, Madoka Urushido 2, Kazu Hamada
Sestrin2 and BNIP3 (Bcl-2/adenovirus E1B 19kDa-interacting protein3) regulate autophagy and mitophagy in renal tubular cells in acute kidney injury by Masayuki Ishihara 1, Madoka Urushido 2, Kazu Hamada
Supplementary Information
 Electronic Supplementary Material (ESI) for Analyst. This journal is The Royal Society of Chemistry 2018 Supplementary Information Spying on Protein Interactions in Living Cells with Reconstituted Scarlet
SUPPLEMENTAL MATERIAL. Supplementary Methods
 SUPPLEMENTAL MATERIAL Supplementary Methods Culture of cardiomyocytes, fibroblasts and cardiac microvascular endothelial cells The isolation and culturing of neonatal rat ventricular cardiomyocytes was
Validation & Assay Performance Summary
 Validation & Assay Performance Summary LanthaScreen IGF-1R GripTite Cells Cat. no. K1834 Modification Detected: Phosphorylation of Multiple Tyr Residues on IGF-1R LanthaScreen Cellular Assay Validation
THE ROLE OF ALTERED CALCIUM AND mtor SIGNALING IN THE PATHOGENESIS OF CYSTINOSIS
 Research Foundation, 18 month progress report THE ROLE OF ALTERED CALCIUM AND mtor SIGNALING IN THE PATHOGENESIS OF CYSTINOSIS Ekaterina Ivanova, doctoral student Elena Levtchenko, MD, PhD, PI Antonella
ab Membrane Fractionation Kit Instructions for Use For the rapid and simple separation of membrane, cytosolic and nuclear cellular fractions.
 ab139409 Membrane Fractionation Kit Instructions for Use For the rapid and simple separation of membrane, cytosolic and nuclear cellular fractions. This product is for research use only and is not intended
Supplemental Materials. STK16 regulates actin dynamics to control Golgi organization and cell cycle
 Supplemental Materials STK16 regulates actin dynamics to control Golgi organization and cell cycle Juanjuan Liu 1,2,3, Xingxing Yang 1,3, Binhua Li 1, Junjun Wang 1,2, Wenchao Wang 1, Jing Liu 1, Qingsong
Supplemental Materials Molecular Biology of the Cell
 Supplemental Materials Molecular Biology of the Cell Garcia-Alvarez et al. Supplementary Figure Legends Figure S1.Expression and RNAi-mediated silencing of STIM1 in hippocampal neurons (DIV, days in vitro).
Supporting Information
 Supporting Information Pang et al. 10.1073/pnas.1322009111 SI Materials and Methods ELISAs. These assays were performed as previously described (1). ELISA plates (MaxiSorp Nunc; Thermo Fisher Scientific)
p47 negatively regulates IKK activation by inducing the lysosomal degradation of polyubiquitinated NEMO
 Supplementary Information p47 negatively regulates IKK activation by inducing the lysosomal degradation of polyubiquitinated NEMO Yuri Shibata, Masaaki Oyama, Hiroko Kozuka-Hata, Xiao Han, Yuetsu Tanaka,
genome edited transient transfection, CMV promoter
 Supplementary Figure 1. In the absence of new protein translation, overexpressed caveolin-1-gfp is degraded faster than caveolin-1-gfp expressed from the endogenous caveolin 1 locus % loss of total caveolin-1-gfp
Supplementary Information POLO-LIKE KINASE 1 FACILITATES LOSS OF PTEN-INDUCED PROSTATE CANCER FORMATION
 Supplementary Information POLO-LIKE KINASE 1 FACILITATES LOSS OF PTEN-INDUCED PROSTATE CANCER FORMATION X. Shawn Liu 1, 3, Bing Song 2, 3, Bennett D. Elzey 3, 4, Timothy L. Ratliff 3, 4, Stephen F. Konieczny
Supplementary Material and Methods
 Online Supplement Kockx et al, Secretion of Apolipoprotein E from Macrophages 1 Supplementary Material and Methods Cloning of ApoE-GFP Full-length human apoe3 cdna (pcdna3.1/zeo + -apoe) was kindly provided
SUPPLEMENTARY INFORMATION. Supplementary Figures S1-S9. Supplementary Methods
 SUPPLEMENTARY INFORMATION SUMO1 modification of PTEN regulates tumorigenesis by controlling its association with the plasma membrane Jian Huang 1,2#, Jie Yan 1,2#, Jian Zhang 3#, Shiguo Zhu 1, Yanli Wang
supplementary information
 Figure S1 Nucleotide binding status of RagA mutants. Wild type and mutant forms of MycRagA was transfected into HEK293 cells and the transfected cells were labeled with 32 Pphosphate. MycRagA was immunoprecipitated
Supplementary Figure 1.
 Supplementary Figure 1. Visualization of endoplasmic reticulum-mitochondria interaction by in situ proximity ligation assay. A) Illustration of targeted proteins in mitochondria (M), endoplasmic reticulum
SUPPLEMENTARY LEGENDS...
 TABLE OF CONTENTS SUPPLEMENTARY LEGENDS... 2 11 MOVIE S1... 2 FIGURE S1 LEGEND... 3 FIGURE S2 LEGEND... 4 FIGURE S3 LEGEND... 5 FIGURE S4 LEGEND... 6 FIGURE S5 LEGEND... 7 FIGURE S6 LEGEND... 8 FIGURE
Supplementary Figure 1 Lymphocytes can be tracked for at least 4 weeks after
 Supplementary Figure 1 Lymphocytes can be tracked for at least 4 weeks after photoconversion by using H2B-Dendra2. 4-5 PPs of H2B-Dendra2 BM chimeras were photoconverted and analyzed 7 days (upper panel)
SUPPLEMENT. Materials and methods
 SUPPLEMENT Materials and methods Cell culture and reagents Cell media and reagents were from Invitrogen unless otherwise indicated. Antibiotics and Tet-certified serum were from Clontech. In experiments
Figure S1. Western blot analysis of clathrin RNA interference in human DCs Human immature DCs were transfected with 100 nm Clathrin SMARTpool or
 Figure S1. Western blot analysis of clathrin RNA interference in human DCs Human immature DCs were transfected with 100 nm Clathrin SMARTpool or control nontargeting sirnas. At 90 hr after transfection,
1. Materials and Methods 1.1 Animals experiments process The experiments were approved by the Institution Animal Ethics Committee of Jilin University
 1. Materials and Methods 1.1 Animals experiments process The experiments were approved by the Institution Animal Ethics Committee of Jilin University (Reference NO. 2015-003). 96 Kunming (KM) mice (8 weeks;
Supplementary Figure 1: si-craf but not si-braf sensitizes tumor cells to radiation.
 Supplementary Figure 1: si-craf but not si-braf sensitizes tumor cells to radiation. (a) Embryonic fibroblasts isolated from wildtype (WT), BRAF -/-, or CRAF -/- mice were irradiated (6 Gy) and DNA damage
Western Immunoblotting Preparation of Samples:
 Western Immunoblotting Preparation of Samples: Total Protein Extraction from Culture Cells: Take off the medium Wash culture with 1 x PBS 1 ml hot Cell-lysis Solution into T75 flask Scrap out the cells
Supplementary Table 1. Metabolic parameters in GFP and OGT-treated mice
 Supplementary Table 1. Metabolic parameters in GFP and OGT-treated mice Fasted Refed GFP OGT GFP OGT Liver G6P (mmol/g) 0.03±0.01 0.04±0.02 0.60±0.04 0.42±0.10 A TGs (mg/g of liver) 20.08±5.17 16.29±0.8
Live cell imaging of trafficking of the chaperone complex vaccine to the ER. BMDCs were incubated with ER-Tracker Red (1 M) in staining solution for
 in staining solution for") Live cell imaging of trafficking of the chaperone complex vaccine to the ER. BMDCs were incubated with ER-Tracker Red (1 M) in staining solution for 15 min at 37 C and replaced with fresh complete medium.
Live cell imaging of trafficking of the chaperone complex vaccine to the ER. BMDCs were incubated with ER-Tracker Red (1 M) in staining solution for 15 min at 37 C and replaced with fresh complete medium.
Tumor suppressor Spred2 interaction with LC3 promotes autophagosome maturation and induces autophagy-dependent cell death
 www.impactjournals.com/oncotarget/ Oncotarget, Supplementary Materials 2016 Tumor suppressor Spred2 interaction with LC3 promotes autophagosome maturation and induces autophagy-dependent cell death Supplementary
Supplementary information. The Light Intermediate Chain 2 Subpopulation of Dynein Regulates Mitotic. Spindle Orientation
 Supplementary information The Light Intermediate Chain 2 Subpopulation of Dynein Regulates Mitotic Spindle Orientation Running title: Dynein LICs distribute mitotic functions. Sagar Mahale a, d, *, Megha
PRODUCT INFORMATION & MANUAL
 PRODUCT INFORMATION & MANUAL Mitochondrial Extraction Kit NBP2-29448 Research use only. Not for diagnostic or therapeutic procedures www.novusbio.com P: 303.760.1950 P: 888.506.6887 F: 303.730.1966 technical@novusbio.com
Plasma Membrane Protein Extraction Kit
 ab65400 Plasma Membrane Protein Extraction Kit Instructions for Use For the rapid and sensitive extraction and purification of Plasma Membrane proteins from cultured cells and tissue samples. This product
Downregulation of angiotensin type 1 receptor and nuclear factor-κb. by sirtuin 1 contributes to renoprotection in unilateral ureteral
 Supplementary Information Downregulation of angiotensin type 1 receptor and nuclear factor-κb by sirtuin 1 contributes to renoprotection in unilateral ureteral obstruction Shao-Yu Yang 1,2, Shuei-Liong
Proteomic profiling of small-molecule inhibitors reveals dispensability of MTH1 for cancer cell survival
 Supplementary Information for Proteomic profiling of small-molecule inhibitors reveals dispensability of MTH1 for cancer cell survival Tatsuro Kawamura 1, Makoto Kawatani 1, Makoto Muroi, Yasumitsu Kondoh,
SUPPLEMENTARY INFORMATION
 doi:10.1038/nature12652 Supplementary Figure 1. PRDM16 interacts with endogenous EHMT1 in brown adipocytes. Immunoprecipitation of PRDM16 complex by flag antibody (M2) followed by Western blot analysis
SUPPLEMENTARY INFORMATION
 Supplementary Table 1. Cell sphingolipids and S1P bound to endogenous TRAF2. Sphingolipid Cell pmol/mg TRAF2 immunoprecipitate pmol/mg Sphingomyelin 4200 ± 250 Not detected Monohexosylceramide 311 ± 18
Islet viability assay and Glucose Stimulated Insulin Secretion assay RT-PCR and Western Blot
 Islet viability assay and Glucose Stimulated Insulin Secretion assay Islet cell viability was determined by colorimetric (3-(4,5-dimethylthiazol-2-yl)-2,5- diphenyltetrazolium bromide assay using CellTiter
Supplemental Figures:
 Supplemental Figures: Figure 1: Intracellular distribution of VWF by electron microscopy in human endothelial cells. a) Immunogold labeling of LC3 demonstrating an LC3-positive autophagosome (white arrow)
TRAF6 ubiquitinates TGFβ type I receptor to promote its cleavage and nuclear translocation in cancer
 Supplementary Information TRAF6 ubiquitinates TGFβ type I receptor to promote its cleavage and nuclear translocation in cancer Yabing Mu, Reshma Sundar, Noopur Thakur, Maria Ekman, Shyam Kumar Gudey, Mariya
ab SREBP-2 Translocation Assay Kit (Cell-Based)
") ab133114 SREBP-2 Translocation Assay Kit (Cell-Based) Instructions for Use For analysis of translocation of SREBP-2 into nuclei. This product is for research use only and is not intended for diagnostic
ab133114 SREBP-2 Translocation Assay Kit (Cell-Based) Instructions for Use For analysis of translocation of SREBP-2 into nuclei. This product is for research use only and is not intended for diagnostic
General Laboratory methods Plasma analysis: Gene Expression Analysis: Immunoblot analysis: Immunohistochemistry:
 General Laboratory methods Plasma analysis: Plasma insulin (Mercodia, Sweden), leptin (duoset, R&D Systems Europe, Abingdon, United Kingdom), IL-6, TNFα and adiponectin levels (Quantikine kits, R&D Systems
TSH Receptor Monoclonal Antibody (49) Catalog Number MA3-218 Product data sheet
 Catalog Number MA3-218 Product data sheet") Website: thermofisher.com Customer Service (US): 1 800 955 6288 ext. 1 Technical Support (US): 1 800 955 6288 ext. 441 TSH Receptor Monoclonal Antibody (49) Catalog Number MA3-218 Product data sheet Details
Website: thermofisher.com Customer Service (US): 1 800 955 6288 ext. 1 Technical Support (US): 1 800 955 6288 ext. 441 TSH Receptor Monoclonal Antibody (49) Catalog Number MA3-218 Product data sheet Details
Online Data Supplement. Anti-aging Gene Klotho Enhances Glucose-induced Insulin Secretion by Upregulating Plasma Membrane Retention of TRPV2
 Online Data Supplement Anti-aging Gene Klotho Enhances Glucose-induced Insulin Secretion by Upregulating Plasma Membrane Retention of TRPV2 Yi Lin and Zhongjie Sun Department of physiology, college of
Supplementary Figure S I: Effects of D4F on body weight and serum lipids in apoe -/- mice.
 Supplementary Figures: Supplementary Figure S I: Effects of D4F on body weight and serum lipids in apoe -/- mice. Male apoe -/- mice were fed a high-fat diet for 8 weeks, and given PBS (model group) or
SUPPLEMENTARY INFORMATION
 DOI: 10.1038/ncb2566 Figure S1 CDKL5 protein expression pattern and localization in mouse brain. (a) Multiple-tissue western blot from a postnatal day (P) 21 mouse probed with an antibody against CDKL5.
RayBio KinaseSTAR TM Akt Activity Assay Kit
 Activity Assay Kit User Manual Version 1.0 March 13, 2015 RayBio KinaseSTAR TM Akt Activity Kit Protocol (Cat#: 68AT-Akt-S40) RayBiotech, Inc. We Provide You With Excellent Support And Service Tel:(Toll
293T cells were transfected with indicated expression vectors and the whole-cell extracts were subjected
 SUPPLEMENTARY INFORMATION Supplementary Figure 1. Formation of a complex between Slo1 and CRL4A CRBN E3 ligase. (a) HEK 293T cells were transfected with indicated expression vectors and the whole-cell
Supplementary information. The mitochondrial calcium uniporter is a multimer that can include a dominant-negative pore-forming subunit
 Supplementary information The mitochondrial calcium uniporter is a multimer that can include a dominant-negative pore-forming subunit Anna Raffaello 1,4, Diego De Stefani 1,4, Davide Sabbadin 2, Enrico
T H E J O U R N A L O F C E L L B I O L O G Y
 Supplemental material Edens and Levy, http://www.jcb.org/cgi/content/full/jcb.201406004/dc1 T H E J O U R N A L O F C E L L B I O L O G Y Figure S1. Nuclear shrinking does not depend on the cytoskeleton
hexahistidine tagged GRP78 devoid of the KDEL motif (GRP78-His) on SDS-PAGE. This
 on SDS-PAGE. This") SUPPLEMENTAL FIGURE LEGEND Fig. S1. Generation and characterization of. (A) Coomassie staining of soluble hexahistidine tagged GRP78 devoid of the KDEL motif (GRP78-His) on SDS-PAGE. This protein was expressed
SUPPLEMENTAL FIGURE LEGEND Fig. S1. Generation and characterization of. (A) Coomassie staining of soluble hexahistidine tagged GRP78 devoid of the KDEL motif (GRP78-His) on SDS-PAGE. This protein was expressed
Fluorescence Microscopy
 Fluorescence Microscopy Imaging Organelles Mitochondria Lysosomes Nuclei Endoplasmic Reticulum Plasma Membrane F-Actin AAT Bioquest Introduction: Organelle-Selective Stains Organelles are tiny, specialized
Supplementary Materials and Methods
 Supplementary Materials and Methods Immunoblotting Immunoblot analysis was performed as described previously (1). Due to high-molecular weight of MUC4 (~ 950 kda) and MUC1 (~ 250 kda) proteins, electrophoresis
Human SH-SY5Y neuroblastoma cells (A.T.C.C., Manassas, VA) were cultured in DMEM, F-12
 were cultured in DMEM, F-12") SUPPLEMENTARY METHODS Cell cultures Human SH-SY5Y neuroblastoma cells (A.T.C.C., Manassas, VA) were cultured in DMEM, F-12 Ham with 25 mm HEPES and NaHCO 3 (1:1) and supplemented with 10% (v/v) FBS, 1.0
SUPPLEMENTARY METHODS Cell cultures Human SH-SY5Y neuroblastoma cells (A.T.C.C., Manassas, VA) were cultured in DMEM, F-12 Ham with 25 mm HEPES and NaHCO 3 (1:1) and supplemented with 10% (v/v) FBS, 1.0
Fang et al. NMuMG. PyVmT unstained Anti-CCR2-PE MDA-MB MCF MCF10A
 A NMuMG PyVmT 16.5+.5 47.+7.2 Fang et al. unstained Anti-CCR2-PE 4T1 Control 37.6+6.3 56.1+.65 MCF1A 16.1+3. MCF-7 3.1+5.4 MDA-M-231 42.1+5.5 unstained Secondary antibody only Anti-CCR2 SUPPLEMENTAL FIGURE
BMP6 treatment compensates for the molecular defect and ameliorates hemochromatosis in Hfe knockout mice
 SUPPLEMENTARY MATERIALS BMP6 treatment compensates for the molecular defect and ameliorates hemochromatosis in Hfe knockout mice Elena Corradini, Paul J. Schmidt, Delphine Meynard, Cinzia Garuti, Giuliana
SUPPLEMENTAL INFORMATION
 SUPPLEMENTAL INFORMATION EXPERIMENTAL PROCEDURES Tryptic digestion protection experiments - PCSK9 with Ab-3D5 (1:1 molar ratio) in 50 mm Tris, ph 8.0, 150 mm NaCl was incubated overnight at 4 o C. The
Tel: ; Fax: ;
 Tel.: +98 216 696 9291; Fax: +98 216 696 9291; E-mail: mrasadeghi@pasteur.ac.ir Tel: +98 916 113 7679; Fax: +98 613 333 6380; E-mail: abakhshi_e@ajums.ac.ir A Soluble Chromatin-bound MOI 0 1 5 0 1 5 HDAC2
SUPPLEMENTARY FIGURES
 SUPPLEMENTARY FIGURES Supplementary Figure 1. (A) Left, western blot analysis of ISGylated proteins in Jurkat T cells treated with 1000U ml -1 IFN for 16h (IFN) or left untreated (CONT); right, western
SI Materials and methods
 SI Materials and methods Cell culture and transfection. Primary cultures of neonatal cardiac myocytes were prepared as described previously 1. Hearts were removed from rat pups at postnatal day 1 (P1).
SUPPLEMENTARY INFORMATION
 DOI: 1.138/ncb222 / b. WB anti- WB anti- ulin Mitotic index (%) 14 1 6 2 T (h) 32 48-1 1 2 3 4 6-1 4 16 22 28 3 33 e. 6 4 2 Time (min) 1-6- 11-1 > 1 % cells Figure S1 depletion leads to mitotic defects
Instructions for Use. APO-AB Annexin V-Biotin Apoptosis Detection Kit 100 tests
 3URGXFW,QIRUPDWLRQ Sigma TACS Annexin V Apoptosis Detection Kits Instructions for Use APO-AB Annexin V-Biotin Apoptosis Detection Kit 100 tests For Research Use Only. Not for use in diagnostic procedures.
Supplementary Figure 1
 Supplementary Figure 1 Supplementary Figure 1. Neither the activation nor suppression of the MAPK pathway affects the ASK1/Vif interaction. (a, b) HEK293 cells were cotransfected with plasmids encoding
Supplementary Figure 1.
 Supplementary Figure 1. Increased β cell mass and islet diameter in βtsc2 -/- mice up to 35 weeks A: Reconstruction of multiple anti-insulin immunofluorescence images showing differences in β cell mass
Mapping the Ligand-binding Site on a GPCR Using Genetically-encoded Photocrosslinkers
 Mapping the Ligand-binding Site on a GPCR Using Genetically-encoded Photocrosslinkers Amy Grunbeck, Thomas Huber, Pallavi Sachdev, Thomas P. Sakmar Laboratory of Molecular Biology and Biochemistry, The
Supplementary Figure 1. Spatial distribution of LRP5 and β-catenin in intact cardiomyocytes. (a) and (b) Immunofluorescence staining of endogenous
 and (b) Immunofluorescence staining of endogenous") Supplementary Figure 1. Spatial distribution of LRP5 and β-catenin in intact cardiomyocytes. (a) and (b) Immunofluorescence staining of endogenous LRP5 in intact adult mouse ventricular myocytes (AMVMs)
Supplementary Figure 1. Spatial distribution of LRP5 and β-catenin in intact cardiomyocytes. (a) and (b) Immunofluorescence staining of endogenous LRP5 in intact adult mouse ventricular myocytes (AMVMs)
Anti-Lamin B1/LMNB1 Picoband Antibody
 Anti-Lamin B1/LMNB1 Picoband Antibody Catalog Number:PB9611 About LMNB1 Lamin-B1 is a protein that in humans is encoded by the LMNB1 gene. The nuclear lamina consists of a two-dimensional matrix of proteins
Fig. S1. Subcellular localization of overexpressed LPP3wt-GFP in COS-7 and HeLa cells. Cos7 (top) and HeLa (bottom) cells expressing for 24 h human
 and HeLa (bottom) cells expressing for 24 h human") Fig. S1. Subcellular localization of overexpressed LPP3wt-GFP in COS-7 and HeLa cells. Cos7 (top) and HeLa (bottom) cells expressing for 24 h human LPP3wt-GFP, fixed and stained for GM130 (A) or Golgi97
Fig. S1. Subcellular localization of overexpressed LPP3wt-GFP in COS-7 and HeLa cells. Cos7 (top) and HeLa (bottom) cells expressing for 24 h human LPP3wt-GFP, fixed and stained for GM130 (A) or Golgi97
Epithelial cell death is an important contributor to oxidant-mediated acute lung injury SUPPORTING INFORMATION 60611, USA
 Epithelial cell death is an important contributor to oxidant-mediated acute lung injury SUPPORTING INFORMATION G.R. Scott Budinger 1,2 *, Gökhan M. Mutlu 1 *, Daniela Urich 2, Saul Soberanes 1, Leonard
SUPPLEMENTARY INFORMATION
 DOI: 10.1038/ncb3076 Supplementary Figure 1 btrcp targets Cep68 for degradation during mitosis. a) Cep68 immunofluorescence in interphase and metaphase. U-2OS cells were transfected with control sirna
Supplementary Figure S1 Supplementary Figure S2
 Supplementary Figure S A) The blots shown in Figure B were qualified by using Gel-Pro analyzer software (Rockville, MD, USA). The ratio of LC3II/LC3I to actin was then calculated. The data are represented
Effect of starvation-induced autophagy on cell cycle of tumor cells
 [Chinese Journal of Cancer 27:8, 102-108; August 2008]; 2008 Sun Yat-Sen University Cancer Center Basic Research Paper Effect of starvation-induced autophagy on cell cycle of tumor cells Jun-Na Ge, 1 Dan
Supplementary figure legends
 Supplementary figure legends Supplementary Figure 1. Exposure of CRT occurs independently from the apoptosisassociated loss of the mitochondrial membrane potential (MMP). (A) HeLa cells treated with MTX
VEGFR2-Mediated Vascular Dilation as a Mechanism of VEGF-Induced Anemia and Bone Marrow Cell Mobilization
 Cell Reports, Volume 9 Supplemental Information VEGFR2-Mediated Vascular Dilation as a Mechanism of VEGF-Induced Anemia and Bone Marrow Cell Mobilization Sharon Lim, Yin Zhang, Danfang Zhang, Fang Chen,
Chromatin IP (Isw2) Fix soln: 11% formaldehyde, 0.1 M NaCl, 1 mm EDTA, 50 mm Hepes-KOH ph 7.6. Freshly prepared. Do not store in glass bottles.
 Fix soln: 11% formaldehyde, 0.1 M NaCl, 1 mm EDTA, 50 mm Hepes-KOH ph 7.6. Freshly prepared. Do not store in glass bottles.") Chromatin IP (Isw2) 7/01 Toshi last update: 06/15 Reagents Fix soln: 11% formaldehyde, 0.1 M NaCl, 1 mm EDTA, 50 mm Hepes-KOH ph 7.6. Freshly prepared. Do not store in glass bottles. 2.5 M glycine. TBS:
Chromatin IP (Isw2) 7/01 Toshi last update: 06/15 Reagents Fix soln: 11% formaldehyde, 0.1 M NaCl, 1 mm EDTA, 50 mm Hepes-KOH ph 7.6. Freshly prepared. Do not store in glass bottles. 2.5 M glycine. TBS:
NLRX1: 5 -GCTCCATGGCTTAGAGCATC-3 (forward) 5 -AACTCCTCCTCCGTCCTGAT-3 (reverse) β-actin
 5 -AACTCCTCCTCCGTCCTGAT-3 (reverse) β-actin") NLRX1 β-actin 1 2 3 4 5 6 1 2 3 4 5 6 NLRX1 (667 bp) β-actin (523 bp) Supplementary Figure 1: Expression of NLRX1 in human cell lines. 1: HeLa, 2: HEK293T, 3: MCF-7, 4:Ramos, 5:Jurkat, 6: THP1. The following
NLRX1 β-actin 1 2 3 4 5 6 1 2 3 4 5 6 NLRX1 (667 bp) β-actin (523 bp) Supplementary Figure 1: Expression of NLRX1 in human cell lines. 1: HeLa, 2: HEK293T, 3: MCF-7, 4:Ramos, 5:Jurkat, 6: THP1. The following
Expanded View Figures
 PEX13 functions in selective autophagy Ming Y Lee et al Expanded View Figures Figure EV1. PEX13 is required for Sindbis virophagy. A, B Quantification of mcherry-capsid puncta per cell (A) and GFP-LC3
APPENDIX Heparin 2 mg heparin was dissolved in 0.9 % NaCl (10 ml). 200 µl of heparin was added to each 1 ml of blood to prevent coagulation.
. 200 µl of heparin was added to each 1 ml of blood to prevent coagulation.") APPENDIX 1 Preparation of reagents 1.1. Preparation of dosing solution Nonylphenol 15 mg of Nonylphenol was dissolved in olive oil (10 ml) and used as stock solution. The stock solution was serially diluted
APPENDIX 1 Preparation of reagents 1.1. Preparation of dosing solution Nonylphenol 15 mg of Nonylphenol was dissolved in olive oil (10 ml) and used as stock solution. The stock solution was serially diluted
T H E J O U R N A L O F C E L L B I O L O G Y
 Supplemental material Chen et al., http://www.jcb.org/cgi/content/full/jcb.201210119/dc1 T H E J O U R N A L O F C E L L B I O L O G Y Figure S1. Lack of fast reversibility of UVR8 dissociation. (A) HEK293T
SUPPLEMENTARY INFORMATION
 DOI: 10.1038/ncb2607 Figure S1 Elf5 loss promotes EMT in mammary epithelium while Elf5 overexpression inhibits TGFβ induced EMT. (a, c) Different confocal slices through the Z stack image. (b, d) 3D rendering
EPI TIR-FM min
 a 15 b EPI 45 75 min TIR-FM c min Supplementary figure 1. Fluorescence microscopy of Gag- GFP. HeLa cells were transfected with Gag and Gag-GFP and imaged at 5-6 hpt. a, Images of a single cell observed
Luminescent platforms for monitoring changes in the solubility of amylin and huntingtin in living cells
 Electronic Supplementary Material (ESI) for Molecular BioSystems. This journal is The Royal Society of Chemistry 2016 Contents Supporting Information Luminescent platforms for monitoring changes in the