AN ABSTRACT OF THE THESIS OF
|
|
|
- Roy Turner
- 6 years ago
- Views:
Transcription
1
2 AN ABSTRACT OF THE THESIS OF Michael D. Petrocchi for the degree of Master of Science in Radiation Health Physics presented on June 7, Title: Relative Effective Dose Risk Based on Medical Diagnostic Modalities at the Nebraska Medical Center Abstract approved: Kathryn A. Higley The use of medical diagnostic imaging involving ionizing radiation has drastically increased in recent years causing concern about possible long term consequences such as the induction of cancer. Recognizing this recent trend, the Institutional Review Board (IRB) at the Nebraska Medical Center commissioned this study in order to determine effective doses and corresponding lifetime attributable risk of cancer for all diagnostic scans involving ionizing radiation at its facility. The eventual product will be an on-line dose calculator specific only to the Nebraska Medical Center s scanning protocols to be utilized by its physicians, researchers, and patients for education and informed consent policies. In all, 32 conventional X-ray scans, 39 nuclear medicine scans, and over 100 individual Computed Tomography scans were analyzed to determine effective doses using the most current dosimetry data and computer software available at the time of this study.
3 The Biological Effects of Ionizing Radiation (BEIR) VII methodology was then applied for each nuclear medicine and CT scan s effective dose to estimate the Lifetime Attributable Risk (LAR) of developing cancer based on age and gender. Comparisons of effective doses were also made between similar diagnostic scans from Duke University, Radiation Dose Assessment Resource (RADAR), and Conventional X-ray effective dose outcomes showed that there was no definitively higher rate of radiation dose between institutions. Nuclear medicine effective doses varied considerably depending on the amount of radiopharmaceutical administered and source of dosimetry information acquired. The computed tomography effective doses from the Nebraska Medical Center had higher values for scan regions that included the torso region with all other scans yielding similar effective doses. Determining medical diagnostic radiation doses can be an intricate, complex method. It is pertinent that each institution wanting an accurate effective dose from their diagnostic scans base their calculations on individual scanning parameters and the most current radiation dosimetry information.
4 Copyright by Michael D. Petrocchi June 7, 2010 All Rights Reserved
5 Relative Effective Dose Risk Based on Medical Diagnostic Modalities at the Nebraska Medical Center by Michael D. Petrocchi A THESIS submitted to Oregon State University in partial fulfillment of the requirements for the degree of Master of Science Presented on June 7, 2010 Commencement June 2011
6 Master of Science thesis of Michael D. Petrocchi presented on June 7, APPROVED: Major Professor, representing Radiation Health Physics Head of the Department of Nuclear Engineering and Radiation Health Physics Dean of the Graduate School I understand that my thesis will become part of the permanent collection of Oregon State University libraries. My signature below authorizes the release of my thesis to any reader upon request. Michael D. Petrocchi, Author
7 ACKNOWLEDGEMENTS The author expresses sincere appreciation for the mentoring of Duane Kanne and the support and encouragement of my family.
8 CONTRIBUTION OF AUTHORS Frank Rutar, M.S., CHP assisted with data collection and nuclear medicine dose verification. Thomas Lane, Ph.D. aided in Computed Tomography and Conventional X-ray verification.
9 TABLE OF CONTENTS 1. Introduction Health Professional s Training on the Effects of Medical Radiation Effectively Communicating Effective Whole Body dose Linear No Threshold Model and how it s Utilized BIER VII report and how it differs from the BEIR V report Stochastic Effects and their Risks of Occurring Relative Risk and Informed Consent Uncertainty in Tissue Weighting Factors and Lifetime Risks of Cancer Conventional Radiographic X-ray Nuclear Medicine Assumed standard patient size (Standard Man) Radiation Dose Determination in Nuclear Medicine Computed Tomography Variations in CT Scanning Material and Methods Capacity of medical imaging modalities X-ray Dose Calculations Description of STUK (PCXMC 2.0.1)..29 Page
10 TABLE OF CONTENTS (Continued) Page 2.3 Nuclear Medicine Dose Calculations Calculating Nuclear Medicine Dose Computed Tomography Dose Calculations Description of IMPACTS Dosimetry Program CT Input Assumptions Results Conventional X-Ray Procedure Results Nuclear Medicine Procedure Results Computed Tomography Examination Results Computed Tomography Results, 16 Slice CT Scanner Computed Tomography Results, 64 Slice CT Scanner Discussion Conventional X-ray Procedures Nuclear Medicine Procedures Computed Tomography Procedures GE Lightspeed Pro 16 Comparisons GE Lightspeed Pro 16 Incidence Rates of Cancer GE VCT 64 slice Comparisons GE VCT 64 slice Incidence Rates of Cancer...104
11 TABLE OF CONTENTS (Continued) Page Incidence Rates of Cancer, 16 Slice CT scans vs. 64 Slice CT Scans Conclusion Conventional X-ray Nuclear Medicine Computed Tomography Closing Statement 113 Bibliography Appendix A.116
12 LIST OF FIGURES Figure Page 2.1 The PCXMC Home Screen The Main PCXMC Input Window PCXMC 2.0 Patient Input Dose Window Orgdose Input Screen for Nuclear Medicine Procedures Input Spreadsheet for IMPACTS Version 0.99x Adult, Hermaphrodite, Mathematical Phantom PCXMC 2.0 version 0.99x Lifetime Attributable Risk Calculation Spreadsheet Four of the Most Common X-ray Procedures Performed and their Effective Doses Comparison of Nuclear Medicine Procedures Nebraska Medical Center F-18 FDG LAR of Cancer Nebraska Medical Center Tc-99m Sestamibi LAR of Cancer Slice CT Procedure Comparison Nebraska Medical Center 16 Slice CT Routine Chest Scan s LAR of Cancer Nebraska Medical Center 16 Slice CT Chest / Abdomen / Pelvis Scan s LAR of Cancer Nebraska Medical Center 16 Slice CT Cervical Spine Scan s LAR of Cancer Nebraska Medical Center 16 Slice CT Thoracic Spine Scan s LAR of Cancer
13 LIST OF FIGURES (Continued) Figure Page 3.10 Nebraska Medical Center 16 Slice CT Lumbar Spine Scan s LAR of Cancer Nebraska Medical Center 16 Slice CT Colonography Scan s LAR of Cancer Slice CT Procedure Comparison Nebraska Medical Center 64 Slice CT Cervical Spine Scan s LAR of Cancer Nebraska Medical Center 64 Slice CT Routine Chest Scan s LAR of Cancer Nebraska Medical Center 64 Slice CT Chest / Abdomen / Pelvis Scan s LAR of Cancer Nebraska Medical Center 64 Slice CT Neck / Chest / Abdomen / Pelvis Scan s LAR of Cancer Nebraska Medical Center 64 Slice CT PET Whole Body Scan s LAR of Cancer
14 LIST OF TABLES TABLE Page 2.1 The Nebraska Medical Center s Technique Chart The Nebraska Medical Center s Prescribed Dose Limit Chart The Nebraska Medical Center s Prescribed Dose Limit Chart cont d The Nebraska Medical Center s X-ray procedure data Duke University s X-ray protocol list with corresponding effective doses according to gender Conventional X-ray Comparison A list of Nebraska Medical Center s nuclear medicine procedures and their pertinent effective doses A list of Nebraska Medical Center s nuclear medicine procedures and their pertinent effective doses Cont d The Nebraska Medical Center s nuclear medicine procedures with corresponding effective doses and lifetime attributable risks of cancer for males according to the age at exposure The Nebraska Medical Center s nuclear medicine procedures with corresponding effective doses and lifetime attributable risks of cancer for males according to the age at exposure The Nebraska Medical Center s nuclear medicine procedures with corresponding effective doses and lifetime attributable risks of cancer for females according to the age at exposure The Nebraska Medical Center s nuclear medicine procedures with corresponding effective doses and lifetime attributable risk of cancer for females according to the age at exposure..61
15 LIST OF TABLES (Continued) TABLE Page 3.10 The 18 most common Computed Tomography (CT) procedures performed on the GE Lightspeed Pro 16 at the Nebraska Medical Center and the pertinent effective doses for each scan The 21 most common Computed Tomography (CT) procedures performed on the GE Lightspeed VCT 64 slice CT at the Nebraska Medical Center and their pertinent effective doses for each scan GE Lightspeed Pro 16 effective doses and lifetime attributable risks of caner for males according to the Nebraska Medical Center s protocols for scan type and gender GE Lightspeed Pro 16 effective doses and lifetime attributable risks of caner for females according to the Nebraska Medical Center s protocols for scan type and gender GE Lightspeed Pro 16 effective doses and lifetime attributable risks of caner for males according to the Nebraska Medical Center s protocols for scan type and gender GE Lightspeed Pro 16 effective doses and lifetime attributable risks of caner for females according to the Nebraska Medical Center s protocols for scan type and gender GE VCT (64 slice) effective doses and lifetime attributable risks of caner for males according to the Nebraska Medical Center s protocols for scan type and gender GE VCT (64 slice) effective doses and lifetime attributable risks of caner for females according to the Nebraska Medical Center s protocols for scan type and gender GE VCT (64 slice) effective doses and lifetime attributable risks of caner for males according to the Nebraska Medical Center s protocols for scan type and gender 80
16 LIST OF TABLES (Continued) TABLE Page 3.19 GE VCT (64 slice) effective doses and lifetime attributable risks of caner for females according to the Nebraska Medical Center s protocols for scan type and gender GE VCT (64 slice) effective doses and lifetime attributable risks of caner for males according to the Nebraska Medical Center s protocols for scan type and gender GE VCT (64 slice) effective doses and lifetime attributable risks of caner for females according to the Nebraska Medical Center s protocols for scan type and gender 83
17 Chapter 1 Introduction The purpose of this thesis is to determine effective doses of radiation to the patient population from medical diagnostic modalities involving ionizing radiation based on individual scanning protocols at the Nebraska Medical Center. A comparison of effective doses is then compared to another institution of similar size and scope, as well as other on-line dose calculators available to the general public. In addition to comparing these results, the calculated effective radiation doses are translated into a cancer incidence rate that patients may incur from the diagnostic scan. Patients participating in clinical research will also be given their cancer incidence rate as part of the Nebraska Medical Center s informed consent policy. The diagnostic modalities included in this study are computed tomography (CT), nuclear medicine, and conventional radiographic (x-ray) procedures. Data derived from these scans is used to create an on-line Dose Calculator for the Institutional Review Board (IRB) which is specific only to the Nebraska Medical Center s individual scanning protocols. By inputting variables such as the patient s gender, age, scan type, and number of scans undergone, the dose calculator will be able to provide: 1) the effective dose for all diagnostic procedures involved, 2) a stochastic risk of developing cancer, and 3) suggested consent language to be given to the human subject / patient. Due to the current increase in medical imaging over the last two decades, there has been recent discussion in the medical community as to the beneficial use of recording and tracking cumulative radiation doses.
18 2 Effective doses calculated from this research maybe utilized in tracking Nebraska Medical Center s patient radiation exposures throughout their lifetime. Currently, this option is only used at the National Institute of Health (National Institute of Health, 1) but, is also being considered in other major institutions around the nation including the Nebraska Medical Center. It is pertinent that both the physician and the patient undergoing medical imaging procedures involving ionizing radiation be cognizant of radiation exposure and possible health risks involved. In order to provide this information, radiation doses must be explained and then a clearly communicated to a risk that can be easily understood by the general public. These risks can then be weighed with the tangible medical benefits the patient will gain from undergoing that procedure. By comparing the risk versus the benefit of the procedure, physicians can make the necessary judgment as to whether the scan is viable for the patient s progression of treatment. 1.1 Health Professional s Training on the Effects of Medical Radiation One of the main focuses for this research is to better educate referring physicians as to the radiation exposures for which they are subjecting to their patients. Numerous studies recently performed in Europe have discovered an increasing concern that the knowledge of referring physicians who prescribe medical diagnostic procedures involving radiation is inadequate (McCusker et al. 2009).
19 3 This is of particular concern because CT parameters are not always adjusted to take into account the age and varying sizes of pediatric patients, with children frequently being imaged using adult CT protocols, thus exposing them to an unnecessarily high radiation dose as a consequence(soye and Paterson 2008, ). According to one study completed at a Northern Ireland hospital in 2008 (Soye and Paterson 2008, ), 153 physicians were sent questionnaires regarding what types of radiation doses were administered during diagnostic scanning with scans ranging from typical chest x-rays to CT angiography. Of the 153 physicians, 52 had received some kind of formal training regarding ionizing radiation. Of these, 22 (42%) achieved a score of 50% or more. Of the remaining 101 physicians with no formal training on ionizing radiation, 18 (18%) achieved a score of 50% or above (Soye and Paterson 2008, ). This survey confirms that clinical awareness of radiation dose administered to patients during common radiological procedures and their consequent risks is poor. However, this survey did indicate that radiation safety training does increase the awareness of radiation dose. In a separate study completed in 2009, researchers investigated how well medical students and junior doctors in Ireland correlated the effects of radiation doses to their patients. Of the 269 participants, 99% of subjects underestimated the dose of radiation involved in a barium enema, plain film abdomen, lumbar spine x-ray, and a PET scan (McCusker et al. 2009). Almost 90% underestimated the dose of a CT abdomen/pelvis scan. There was however, a documented increase in radiation dose knowledge of medical students after entry into their clinical rotations (McCusker et al. 2009)(McCusker et al. 2009).
20 4 Although these surveys were taken from physicians trained in European medical schools, there is a similar correlation to medical students in the United States. Currently, there is no formal radiation safety training included with current U.S. medical school curriculum. These studies are an obvious indication that more needs to be done to educate current and existing physicians about ionizing radiation relevant to medical imaging. The purpose of this research is not to pronounce medical radiation as being completely harmful, but that it be respected and used appropriately with the correct training and knowledge. One goal of this dose calculator is to enhance the knowledge of physicians and researchers on radiation doses currently being administered at the Nebraska Medical Center, so they may make a more comprehensive decision on their patient s treatment process. 1.2 Effectively Communicating Effective Whole Body dose The calculation of a radiation dose administered to a patient during a medical scan can be a complicated and complex task. There are several variables that must be accounted for when determining an estimated radiation dose which can be understood by radiation safety specialists, physicians, and patients. In order to arrive at a simplified, universal term used to describe a radiation dose, the International Committee of Radiation Protection (ICRP) created a term called Effective Dose (ED) (Hall and Giaccia 2006). The effective dose allows non-uniform internal and external radiation doses to be expressed as a single value, representing an equivalent whole body dose.
21 5 Or, in other terms, the effective dose is the whole body dose of x-rays that would have to be delivered to produce the same stochastic risk as the partial-body dose that was actually delivered (Hall and Giaccia 2006). The effective dose values are thought to be more meaningful than total body dose and facilitate comparisons of radiation doses administered from different medical modalities involving radiation such as computed tomography (CT), nuclear medicine, and conventional radiography. To first determine the effective dose, the dose equivalent must first be calculated. The dose equivalent is simply the mean energy imparted by the ionizing radiation multiplied by the radiation s quality factor (Q value) (Sorenson and Phelps 1987). Once the dose equivalent has been determined, this value is then multiplied by a tissue weighting factor which relates to the tissues/organs that are directly affected by the particular radiation particles. Some organs or tissues will be more susceptible to radiation induced stochastic effects than others. For example, according to the ICRP report 60, bone marrow has a tissue weighting factor (W T ) of 0.12, is more susceptible to radiation than bone or skin (W T = 0.01) (ICRP (International Commission on Radiological Protection) 1990). The result of the dose equivalent and tissue weighting factors is the effective dose which has standard units of millisieverts (msv). Common units still utilized in the medical community are measured in millirem (mrem) and will be used in this thesis to depict radiation exposure from each medical modality.
22 6 1.3 Linear No Threshold Model and how it s Utilized Because medical diagnostic scanning typically involves low doses of radiation (<10,000 mrem) at staggered time periods we must rely upon extrapolated epidemiological data on cancer incidence from higher doses (>10,000 mrem) of acute exposures. Extrapolation of this data is used to form the linear non-threshold (LNT) model which is used as the basis for radiation protection with an emphasis on protecting public health. The LNT model is based on the relationship between cancer incidence and radiation dose over lower dose ranges. Recently, the BEIR VII Committee (NRC 2006) and the ICRP (2007) recommendations took into account the most current biological and physical information in order to develop, the best possible risk estimate for exposure to low-dose, low linear-energy-transfer (LET) radiation in human subjects (Preston 2008, ). This new information incorporated low dose rates studied from radiation workers in the nuclear industry and compared it to the most current data from the Japanese bomb survivor s registry. Information from these reports is utilized in this research to more accurately correlate a range of low dose radiation scenarios for groups within the population to their lifetime attributable risks of cancer. These risk estimates may also be used in the future to establish radiation protection standards for patients undergoing multiple medical scans involving ionizing radiation.
23 7 1.4 BIER VII report and how it differs from the BEIR V report In order to determine the health risk factors from low levels of ionizing radiation incurred from medical diagnostic imaging at the Nebraska Medical Center, the most current and up to date epidemiological data of radiological effects on humans was utilized. The Biological Effects of Ionizing report VII; phase 2 (BEIR VII) is the seventh report in a series of reports compiled by the National Research Council (NRC) to advise the United States government on the relationship between human health and exposure to ionizing radiation. The BEIR VII report is an update of the previously published material from the BEIR V report which was released in Newly released experimental research and epidemiological information stemming from 1990 to 2004 was included in the most recent BEIR report to better aide regulatory bodies on how to best characterize risk at the doses and dose rates experienced by radiation workers and members of the general public. The primary purpose of the BEIR VII report is to construct the best possible risk estimates for individuals who were exposed to low-dose, low linear energy transfer (LET) radiation such as ones found in medical diagnostic imaging. Since the publication of BEIR V report in 1990, there has been a considerable amount of information released regarding the health effects of ionizing radiation. One area that has seen a substantial increase in information has been radiationinduced cancers from the Hiroshima and Nagasaki survivors.
24 8 Since the BEIR V report, the Life Span Study (LSS) cohort from the Hiroshima Tumor Registry has become available allowing the committee to use both incidence and mortality data to develop its models. By incorporating data from both the Hiroshima and Nagasaki tumor registries the committee was able to evaluate approximately 13,000 incidences of cancer and about 10,000 cancer deaths compared to the 6,000 cancer deaths that were only available to the BEIR V committee(beir VII Committee 2006). Due to this increase in epidemiologic and biological data there has been an increase confidence in the cancer risk estimates. Additionally, there is evidence stemming from the A-bomb survivor group that suggests radiation exposure could also be the cause of other health effects such as cardiovascular disease and stroke. Radiation dosimetry at Hiroshima and Nagasaki were also recently reevaluated in order to give more credibility to dose estimates and the relationships between radiation exposure and health effects observed in these A-bomb survivors. In an attempt to go beyond the previous scope of the BEIR V report, the BEIR VII committee was also able to incorporate information from radiation worker studies, medical radiation exposures, and populations with environmental exposures. Advancements in science which relate to estimation of genetic (hereditary) effects from radiation have also increased since the 1990 report. Genetic risk estimation has been aided by advances in human molecular biology, making it possible to project risks for all types of genetic diseases.
25 9 There have also been advancements in cell and molecular biology which has contributed additional information on how cells respond to radiation induced damage, as well as, the association between DNA damage response and cancer development. Genetic effects will not be covered in this research because it was deemed unnecessary at this time by the Nebraska Medical Center personnel, but may be utilized as a future study. Dosimetry software programs used to calculate effective doses for all diagnostic modalities included in this research were also able to determine cancer incidence rates based on BEIR VII methodology. The STUK medical x-ray software program also had the capability of determining cancer incidence rates, but radiation exposures were deemed too low to effectively report a concise incidence rate of cancer. These cancer rates may be further explored at a future time. 1.5 Stochastic Effects and their Risks of Occurring There are two types of radiation effects which occur in medicine, deterministic effects and stochastic effects. A deterministic effect has a practical threshold in dose, the severity of effects increase with dose, and results from damage to many cells from a typical one time, high dose exposure. Typically, this type of effect is seen from acute exposures from radiotherapy devices used in radiation oncology treatments. The other type of effect is called stochastic, is most closely related with diagnostic radiology. The stochastic effect occurs when an irradiated human cell is modified instead of killed.
26 10 The modified cell may undergo an uncontrolled replication process, which may lead to malignant cell proliferation (Hall and Giaccia 2006). Stochastic effects are based on the probability of inducing the effect, not the severity of the effect, which is increased with increasing radiation doses. Because stochastic effects are random, it implies that in a population of patients undergoing diagnostic scanning, there will only be detrimental effects seen in some individuals. But, as the dose to the population is increased, so to is the probability that more patients will develop some type of malignant proliferation. Therefore, we are unable to exactly predict who in the population of patients will be afflicted. By calculating medical radiation risk from a calculated effective dose, medical professionals can more accurately gauge the uncertain risks of developing cancer. To estimate the risk associated with a particular procedure, such as CT scan, the preferred method is to measure, or calculate, the dose to each organ as a function of age, gender, and type of CT examination, apply cancer risk estimates specific for that organ, age and gender, available from the BEIR VII report, but ultimately from the A- bomb survivor data and then to sum these risks for all organs exposed (Hall 2009, A171-84). In order to estimate the risk associated with a diagnostic scan, for example a CT scan, the preferred method is to calculate individual organ doses as a function of age, gender, and type of scanning procedure, then apply cancer risk estimates specific for the exam. These individual organ risks are then summed to give a risk for all exposed organs or a cumulative whole body risk estimate. This whole body risk estimate will then be used to gauge the Risk versus Benefit of undergoing the diagnostic scan.
27 Relative Risk and Informed Consent Although medical diagnostic scans are not considered high rates of radiation, they can potentially result in a dose close to the lower limit for which there is credible epidemiological evidence for an excess cancer incidence. For this reason we want to determine the relative risk or the risk of developing cancer relative to the exposure of radiation. The relative risk is the ratio of the probability of the event occurring in the exposed group versus the non-exposed group. By determining the risks involved with medical modalities using low-level ionizing radiation we can better understand the likely hood of cancer occurring in our population. Without low-dose calculations for incidence rates of cancer, the risk-benefit ratio of diagnostic scanning cannot be assessed by the general public or their prescribing physicians. As a patient of this population, the most important question to ask is: What are the risks of developing cancer from undergoing this scan? With data from this research health professionals can more accurately answer this question in terms that patients can better understand. If risk were put into perspective, assume that a typical CT scan of the abdomen resulted in roughly 10 msv or 1 rem of radiation exposure. And according to the BEIR VII methodology, the estimated lifetime risk of this patient developing some form of cancer in their life is increased by approximately 0.05% or 5 in 10,000. This increase would be added to say a 21% lifetime chance of developing cancer from some other type of carcinogen (i.e., asbestos, smoking, chemicals, etc.) therefore, changing the risk of developing cancer from 21% to 21.05%.
28 12 If the lifetime risk of cancer from that one CT scan were put into perspective with other events such as dying from drowning (0.09%) or being involved in a pedestrian accident (0.16%) the results of developing cancer from one CT scan would be considerably smaller (Anonymous2009, 4-5). The cause for concern comes when these diagnostic scans accumulate over the course of a lifetime, resulting in higher cumulative risk of developing cancer. Because there is risk involved with undergoing medical diagnostic scanning, hospitals and medical research facilities have considered incorporating informed consent before a patient decides to undergo scanning. Informed consent is based on moral and legal premise of patient autonomy where the patient has the right to make their own decisions when it comes to their healthcare choices. Physicians give informed consent to patients in order to make them aware of the risks that they may incur as a result of the procedures for which they are about to undergo. For many physician-patient interactions, implied consent is given for such things as physical exams or routine blood tests. But, for more invasive tests with more significant risks or alternatives, a written consent would be required of the patient. More hospitals are favoring a written consent when it comes to diagnostic scanning in order to alleviate any future liability and also to better inform the patient of the type of risk involved. The Nebraska Medical Center has informed consent for all of their medical research subjects currently undergoing investigative studies for Federal Drug Administration (FDA) approval.
29 13 According to Title 21 of the Code of Federal Regulations 50.20, No investigator may involve a human being as a subject in research covered by these FDA regulations unless the investigator has obtained the legally effective informed consent of the subject or the subject's legally authorized representative. An investigator shall seek such consent only under circumstances that provide the prospective subject or the representative sufficient opportunity to consider whether or not to participate and that minimize the possibility of coercion or undue influence. The information that is given to the subject or the representative shall be in language understandable to the subject or the representative. No informed consent, whether oral or written, may include any exculpatory language through which the subject or the representative is made to waive or appear to waive any of the subject's legal rights, or releases or appears to release the investigator, the sponsor, the institution, or its agents from liability for negligence. It is the goal of this research and the Nebraska Medical Center to incorporate a means to communicate an easily understood risk language for patients to effectively comprehend. The dose calculator compiled as a result of this work will provide the required informed consent language needed to necessitate the FDA regulations laid out in 21 CFR for diagnostic imaging incurred during medical research studies. 1.7 Uncertainty in Tissue Weighting Factors and Lifetime Risks of Cancer It is important to indicate that the tissue weighting factors used to compile effective doses in this study have a considerable amount of uncertainty in their representative values.
30 14 According to the ICRP 60 report, when considering these relative contributions and recognizing that the process of deriving them, let alone the uncertainties in the original data themselves, has large uncertainties the ICRP decided that the values could be rounded and grouped into a simple system of weights of adequate accuracy for calculations of effective dose (ICRP (International Commission on Radiological Protection) 1990). For example, the following grouped tissue weighting factors were presented in ICRP report 60: Group Organ Tissue Weighting Factor (W T ) 1) Gonads ) Bone Marrow 0.12 Colon 0.12 Lung 0.12 Stomach ) Bladder 0.05 Breast 0.05 Liver 0.05 Esophagus 0.05 Thyroid 0.05 Remainder ) Skin 0.01 Bone Surface 0.01 Total 1.00 Because there is so much uncertainty with tissue weighting factors it should be understood that these values are only rough estimates and should not be considered concise or accurate when determining effective dose. It is important to note that these values are only utilized to give an estimate of radiation dose administered during a medical scan.
31 15 The Life Span Study (LSS) cohort used in determining the BEIR VII risk calculations consists of about 120,000 survivors of the Hiroshima and Nagasaki atomic bombings in Because of its large size, there are several key features that make the LSS cohort important when determining quantitative estimates of risk from exposure of low LET radiation. These key features include a large population that is not selected due to disease or occupation, its long follow-up period (1950 to 2000), and the fact that it includes both sexes and all ages at exposure. Although the Life Span Study has some beneficial attributes, it is also important to understand that it also has some limitations to consider when interpreting risk estimates. For example, the subjects were of Japanese decent, exposed under wartime conditions (e.g. men away at war, predominately women in exposed population), and differ from various populations from which risk estimates are desired. Because of such uncertainties, it is important to regard estimates of LAR with skepticism, placing more confidence in the range of possible values. Even though a confidence interval is the typical statistical method for doing so, the approach here also accounts for uncertainties external to the data, treating subjective probability distributions for these uncertainties as if they resulted from real data. The resulting range of plausible values for lifetime risk is therefore labeled a subjective confidence interval to emphasize its dependence on opinions in addition to direct numerical observation (BEIR VII Committee 2006).
32 16 Lifetime risk estimates are accompanied by subjective confidence intervals that quantify the three most significant uncertainty sources: 1) sampling variability in risk model parameter estimates from the Life Span Study (LSS) data, 2) the uncertainty about transport of risk from Japanese (LSS) to a U.S. population, and 3) the uncertainty in the appropriate value of a dose and dose rate effectiveness factor (DDREF) for adjusting low-dose risks based on linear-in-dose risk models estimated from Life Span Study data. The cancer risk values, which form the basis of the repercussion of radiation exposure, are not to be regarded as precise or absolute. They are, however, still subject to many uncertainties and to many assumptions involving factors which may be subject to change. There seems to be even greater uncertainties regarding the total risk to individual organs. As more studies transpire and more data is collected it is hoped that these uncertainties will diminish as the Japanese survivor data increase and as more information develops from a broader variety of human experiences (ICRP (International Commission on Radiological Protection) 1990). It is very difficult to arrive, in any precise way at a satisfactory measure of overall uncertainty in the nominal values of risk used by the commission for low dose exposure. The many factors mean that uncertainty can be large both for the nominal total risk and especially for individual organ risks (ICRP (International Commission on Radiological Protection) 1990).
33 Conventional Radiographic X-ray X-rays are generated by an x-ray tube, under a low pressure vacuum that uses high voltage to accelerate electrons which are eventually released by a hot cathode at a high velocity. These high velocity electrons are attracted towards a positively charged metal target called the anode, creating x-rays. The incident electron s energy controls the maximum energy of the x-ray photon. Therefore, if the voltage on the tube is set at 100 kv, it cannot create an x-ray with energy greater than 100 kev. It is both the tube current and voltage, along with the organs and tissues located within the scan region, which dictates the radiation dose to the patient. Conventional x-ray procedures have become essential in the detection of pathology of the skeletal system and can also be utilized to detect some disease processes in soft tissues. One of the most popular forms of x-ray in use today is the chest x-ray. The chest x-ray is used to identify lung diseases such as pneumonia, lung cancer, and pulmonary edema. Other x-ray regions such as the abdominal x-rays can detect free fluid or free air (from visceral perforations), as well as, intestinal obstructions. Gallbladder and kidney stones can also be reveled with the use of conventional x-rays. The conventional x-ray has become the cornerstone of medical diagnostic imaging and is commonly used to diagnosis many diseases. Although radiation doses are considered extremely small when compared to other modalities such as CT, it maybe beneficial to record accumulated effective doses from x-ray procedures for any future epidemiological studies regarding conventional x-ray.
34 18 The hypothesis for effective doses resulting from conventional diagnostic x- ray procedures will be concurrent with standard dose estimates due to the lack of variation in protocols from a national standard of x-ray parameters. Parameters for x- ray scanning were based primarily on the 7 th edition of Bontrager s Handbook of Radiographic Positioning and Techniques where radiographic positioning and exposure factors are standardized along with proper patient shielding. The only variation from the Nebraska Medical Center s scanning protocols versus other institutions will be the peak kilovoltage (kvp) and current of the x-ray tube (mas) of the x-ray machine. These variables are predicted to have small variations on radiation exposure resulting from x-ray scans involving organs or tissues of interest. Effective doses calculated using Nebraska Medical Center s protocol list will be compared with four main x-ray scans (chest, abdomen, pelvis, and skull) from Duke University, and a current on-line dose calculator called xrayrisk.com. These results will gauge how the Nebraska Medical Center s results compare with other current data on radiation doses currently available to the public. The main focus for calculating effective doses from the Nebraska Medical Center s conventional x-ray protocol list is to provide a tailor-made radiation dose website for researchers and clinicians utilizing diagnostic x-rays at the Nebraska Medical Center. This information will help them determine what type of radiation doses they will be administering to their research subjects or patients. Lifetime attributable risks of cancer will not be determined for x-rays due to their lower rates of cancer incidence, but may possibly be calculated in a future studies.
35 Nuclear Medicine The calculation of radiation dose is essential to the safe use of radiopharmaceuticals. Internal dose calculations are of basic scientific interest to clinicians in order to determine what doses will occur to individual organs of the body. These calculations also play a role in safety and regulatory standpoints. Physicians may want to know what scans have the highest radiation dose in order to make an accurate decision about patient safety. There may also be a situation where a misadministration occurs where the dosimetry must be evaluated in order to comply with regulatory guidelines. Internal doses may also be used for historical interest or for future epidemiological purposes, population studies, or litigation purposes. There are three means to calculating dose in a medical setting. Some clinicians believe that calculating the critical organ (organ receiving the highest dose) is most important especially those organs that are extremely radiosensitive such as red bone marrow. Others believe that the total body dose (which takes the total energy absorbed by all tissues of the body and divide by the total mass of the body) is the most feasible means in determining dose. However, the total body is not a useful means in determining risk because radiopharmaceuticals involve a nonuniform localization in the body, translating into a non-uniform dose. These methods are different than the effective dose calculation we found to be the most accurate for our nuclear medicine radiation dose studies at the Nebraska Medical Center.
36 Assumed standard patient size (Standard Man) Due to the complexities of determining internal doses from nuclear medicine procedures it is important to estimate as many biological variables in order have a consistent outcome. The most common means of estimating internal doses is by using the Standard Man or Reference Man model. The Standard Man model is commonly used for radiation protection purposes. It is a standard set of biological characteristics that are used in order to calculate patient dose. Anatomical values used in the calculations of internal dosimetry are usually taken from Publication 23 of the International Commission on Radiological Protection, ICRP, which is an exhaustive compilation of masses, sizes and compositions of human organs and bodies from prenatal to adult (Gollnick 2000). In ICRP report 23, the reference adult male and the reference adult female are considered to possess the average characteristics of all North American men and women. The reference man is defined as being between years of age, weighing 154 pounds (70 kg), is 5 feet 7 inches (170 cm), and lives in an average climate of 10 to 20 C. Although most patients do not fall within this category, the Standard Man model is currently the most logical means at arriving at internal dose estimates for the Nebraska Medical Center s dose calculator Radiation Dose Determination in Nuclear Medicine When determining radiation doses administered in nuclear medicine studies the principle quantity of interest is the absorbed dose.
37 21 The absorbed dose is the mean energy imparted by ionizing radiation to a particular mass and has units in rad or gray. This absorbed dose can then be multiplied by a quality factor (Q) which accounts for the different types of radiation causing biological effects (i.e. alpha particles, beta particles, gamma rays, and x-rays) giving the dose equivalent. In order to estimate an absorbed dose for all significant tissues, the quantity of energy absorbed per unit mass must be determined for each tissue. If we were to take two objects, one was designated as the target tissue and the other object contained a uniformly contaminated area with radioactive material. Depending on the identity of the radionuclide contained within the object, radiation particles of a specific energy and abundance will be dispersed at a rate dependent on the amount of activity present. The only other factor needed in determining dose within the target is a term referred to as the fraction of emitted energy. This quantity is most often referred to as the absorbed fraction which represents the fraction of energy absorbed from the source to the target organ. When determining internal doses involved with nuclear medicine studies a mathematical simulation program called Monte Carlo is used. Monte Carlo methods are a class of computational algorithms that rely on repeated random sampling to compute their results. They are often used in simulating physical and mathematical systems. The Monte Carlo program incorporates the physics of radiation transport within the body to determine internal radiation dose.
38 22 The input parameters used in modeling Monte Carlo simulations involve: 1) how the type of radiation travels through and interacts with matter, 2) the different physical properties of photons, electrons, and sometimes neutrons, and 3) the geometrical formulas that describe shapes. For example, if we wanted to simulate radiation transport through the body and had two simple spheres which represented different soft tissues. One sphere would contain radioactivity and the other would represent the target tissue. As the Monte Carlo program progresses through its simulation it would mimic the emission of photons/electrons from the source sphere and record the history of interactions of those emissions in the sphere which represented the target tissue. Each emission deposited into the target tissue would then be recorded. From the information gathered from the Monte Carlo simulation, the absorbed fraction can be determined by dividing the energy absorbed in the target tissue by the total energy emitted by the source Computed Tomography One of the most common and highly developed forms of diagnostic imaging today in the United States is the CT scan. CT scans provide the medical community with high quality diagnostic images with very short scan times (seconds). Because of these two qualities, CT procedures have become an essential means in aiding the diagnosis of patients.
39 23 Since its inception in 1972, the number of CT scans in the U.S. has risen from an estimated 18.3 million scans in 1993 to over 62 million scans in 2006 ((National Council on Radiation Protection and Measurements 2009). Technological advances in CT and the ease of use of this technology have also led to additional clinical applications that have increased the use of CT scanners at a rate of 8% to 15% per year for the last 7 to 10 years (National Council on Radiation Protection and Measurements 2009). Because of the increased use of this medical diagnostic modality, there is increased concern over the long term health effects resulting from cumulative CT exposures to patients over the course of their lifetime. A journal article recently published in the Archives of Internal Medicine called Projected Cancer Risks from Computed Tomographic Scans Performed in the United States in 2007 indicated some important factors when studying risks associated with CT scans. It also indicated some important scanning trends in the U.S. that may be valuable for future studies associated with CT scanners. Some of these risk factors will be addressed in our research and also help guide our knowledge on the Nebraska Medical Center s current scanning protocols. They include: 1. Approximately 30% of all CT scans were estimated to be performed in adults aged 35 to 54 years, 13% in those aged 18 to 34 years, and 7% in persons younger than 18 years. 2. Approximately 60% of the CT scans were estimated to be performed in females.
40 24 3. Projected number of incident cancers per 10,000 scans generally decreased with increasing age at exposure. 4. Risks were higher for females due to additional risk of breast cancer / higher lung cancer risk coefficients. 5. Largest contributions of radiation dose were from scan types performed most frequently: abdomen/pelvis, chest, head, and chest CT angiography. 6. Two thirds of projected cancers were estimated to occur in women primarily because of higher frequency of use (60% of scans) and higher breast / lung cancer risks from scans that expose the chest. 7. Approximately one-third of the projected cancers (35%) were from scans performed between the ages of 35 and 54 years, whereas 15% were from scans performed before the age of 18 years. 8. Lung cancer was the most common projected radiation-related cancer followed by colon cancer and leukemia. 9. Cancer sites with the highest risks were common cancers with a high frequency of exposure to that organ (e.g., colon from CT of abdomen / pelvis, and lung from CT of the chest) or higher radiosensitive tissues such as red bone marrow and leukemia.
41 25 The basis for this research is to calculate effective doses from each CT scan currently being administered at the Nebraska Medical Center by using a CT dosimetry software program called IMPACTS. IMPACTS will use the current Nebraska Medical Center s CT scanning protocols and the ICRP 60 tissue weighting factors to determine effective doses. A comparison of the Nebraska Medical Center s results will then be compared to a similar medical institution (Duke University), a reputable organization providing the most current and up to date dose calculations (RADAR website), and an on-line dose calculator developed by radiologists (xrayrisk.com) which is easily available for patient use. This comparison will gauge how the Nebraska Medical Center s CT scanning parameters and their corresponding effective doses relate with other institutions and other forms of CT dose information Variations in CT Scanning Each institution will most likely have different scanning parameters, depending on the type of image needed for the radiologist to interpret. For example, the following scanning parameters can directly affect the radiation dose to the patient: exposure technique factors, x-ray beam collimation, pitch, patient centering, number of detectors, and over-ranging which is also referred to as z-overscanning. A majority of these variables for CT scans stay roughly the same throughout the scan. But, the tube current (measured in milliamperage), exposure time (measured in seconds), the tube potential or voltage (measured in kilovolts), and the pitch are the four main factors in determining radiation dose of a CT scan.
42 26 The product of the tube current and the rotation time is called milliamperage per second or mas. The mas determines the quantity of photons (dose) incident on the patient for the duration of the exposure and is directly proportional to the dose given to the patient. Some CT scanners are equipped with Automatic Exposure Controls (AEC) which use a technique referred to as automatic tube current modulation (ATCM) to optimize the dose to the patient while maintaining constant imaging quality regardless of the size of the patient in the z-axis or the attenuation changes in the x-y axis. Today, AEC devices are installed on all currently manufactured CT scanners on the market. Both CT scanners at the Nebraska Medical Center are equipped with AEC devices to limit patient exposures. The peak kilovoltage (kvp) determines the penetrating power of the photons emanating from the x-ray tube. The higher the kvp value means that photons have higher energies and can penetrate thicker objects compared to lower kvp values. Adults typically have a thicker body mass and require a kvp of around 120. If for example, all other factors remain constant, and the kilovoltage peak was increased from 120 kvp to 140 kvp on a single-detector, the CT dose index (CTDI) for a body phantom would increase approximately 39% ((McNitt-Gray 2002, ). The last scanning parameter which has an integral role in patient dose is the pitch and/or spacing. For helical scans, the pitch parameter (defined as table distance travelled in one 360 rotation / total collimated width of the x-ray beam) has an inverse effect on dose. As pitch increases, the time that any one point in space spends in the x-ray beam is decreased, therefore decreasing the dose.
43 27 The IMPACTS CT dosimetry program used in this research incorporates all four of these parameters along with the scan region and tissue weighting factors from the ICRP 60 report to determine the eventual effective dose. In theory, if all scanning parameters are kept uniform, the resulting dose calculator should be able to determine with a slim margin of error the correct whole body effective dose given to the patient undergoing diagnostic procedures. We predict that our results will closely correlate to other institutions of similar size and scanning equipment. There will however, be some variations in results. Chapter 2 Materials and Methods Data collected for this research was obtained at the Nebraska Medical Center (NMC). The Nebraska Medical Center is a not-for-profit hospital located in Omaha, Nebraska and serves the healthcare needs of both Omaha and surrounding rural communities. It is the largest healthcare facility in the state with more than 4,900 employees and more than 1,000 physicians on staff. The tertiary care medical center collectively houses approximately 689 licensed beds. It serves as a designated trauma facility for Eastern Nebraska/Western Iowa and provides highly specialized care in a number of areas including its internationally renowned solid organ and bone marrow transplantation services. In 2007, NMC treated more than 26,000 inpatients and had more than 445,000 encounters in outpatient settings including diagnostic testing, radiology, and specialty clinics.
44 Capacity of medical imaging modalities In 2005, the radiology department moved into the Hixson-Lied Center for Clinical Excellence. This building is home to one of the largest Emergency Departments in the Midwest and also houses four CT scanners, two MRI scanners, and two x-ray rooms located in close proximity to emergency trauma bays. The nuclear medicine department was recently renovated to accommodate five gamma cameras, as well as one PET/CT scanner. The two CT scanners which perform a majority of the scanning in the radiology department are the GE Lightspeed Pro 16 slice and a GE VCT 64 slice. The diagnostic modalities which will be included in the Nebraska Medical Center s Institutional Review Board (IRB) research includes both the GE Lightspeed Pro 16 slice and a GE VCT 64 slice CT scanners, a complete list of current nuclear medicine studies and all x-ray procedures utilizing scan regions with critical organs of interest. Currently, the radiology department has increased the number of CT scans completed for both in-house and outpatient settings to approximately 4,000 per month. The nuclear medicine department completes approximately 250 scans per month and the x-ray department has seen its number of scans increased to approximately 4,500 per month. The current number of diagnostic scans at the Nebraska Medical Center correlates with the increase tread commonly found throughout the nation s hospitals of similar size and capacity.
45 X-ray Dose Calculations Upon review of the most current x-ray procedures being performed at the Nebraska Medical Center ~29 procedures were selected based on their frequency and ability to directly affect critical organ dose. Extremities such as wrists, elbows, ankles, and feet were absent from our calculations due to their lack or insignificant whole body effective dose exposure. We included scans which encompassed areas in the head, thorax, abdomen, and pelvic regions due to their ability to correlate to a greater affect on dose to critical organs and therefore increase the effective dose. In order to arrive at the effective dose for patients undergoing x-ray procedures, there were three tools which aided in the process. First, was a computer software program called STUK (PCXMC 2.0.1) which is able to calculate patient dose with parameters that are set by the user. The next tool is the Nebraska Medical Center s technique chart which lists all current x-ray scanning protocols such as tube current and voltage settings. The last item of interest was an x-ray procedure handbook called Bontrager s Handbook of Diagnostic X-ray Imaging. This handbook gave the other necessary input variables for the PCXMC software program Description of STUK (PCXMC 2.0.1) The PCXMC software version (manufactured by STUK, the Radiation and Nuclear Safety Authority in Finland), is a Monte Carlo program designed to calculate patients individual organ doses and effective doses from medical x-ray examinations.
46 30 The organs and tissues taken into account include: active bone marrow, adrenals, brain, breasts, colon (upper and lower large intestine), extrathoracic airways, gall bladder, heart, kidneys, liver, lungs, lymph nodes, muscle, esophagus, oral mucosa, ovaries, pancreas, prostate, salivary glands, skeleton, skin, small intestine, spleen, stomach, testicles, thymus, thyroid, urinary bladder, and uterus. Effective doses are calculated through this program by utilizing both the present tissue weighting factors of ICRP Publication 103 (2007) and the old tissue weighting factors of ICRP 60 (1991). Hermaphrodite phantom models from Christy and Eckerman (1987) were used in order to achieve the anatomical data, which describes patients of six different ages: new-born, 1, 5, 10, 15 and adult. Due to a majority of adult patients undergoing scans at the Nebraska Medical Center facility, only the adult phantom will be used for our dose modeling. The PCXMC program can change phantoms in order to make them more realistic for external irradiation conditions, therefore making it more suitable to calculate effective doses according to the new ICRP Publication 103 (2007) for tissue weighting factors.

47 31 Table 2.1 The Nebraska Medical Center s Technique Chart. This Technique Chart was used for each diagnostic x-ray protocol. The column which denotes the CR system was utilized.

48 32 The PCXMC program has a home screen which can be seen in Figure 2.1 below. From this main screen data can be entered, run through a Monte Carlo simulation and then compute into dose estimates. Risk assessments may also be calculated for lifetime attributable risks of cancer, but due to low effective doses received from x-ray examinations, it was deemed unnecessary to complete the risk assessment portion of x-ray output data for this study. Figure 2.1 The PCXMC home screen In order to properly calculate a patient s whole body effective dose from an x- ray procedure, the first step is entering specific patient imaging parameters. The examination data section is selected and the user is given the following screen as seen in Figure 2.2. The first three parameters needed to run the code for dose calculations include: 1) Field Size, calculated by entering the x-ray beam size at the image receptor plane (i.e. the width and height of the actual x-ray image) measured in centimeters. 2) Field to Image Distance (F.I.D.) or Source to Image Distance (S.I.D.), the distance between the x-ray tube focal spot and the image receptor (cm).
49 33 3) The Object to Image Distance (O.I.D.) which is the distance between the patient s exit surface and the image receptor (i.e. chest bucky). These three parameters were depicted from Bontrager s Handbook of Radiographic Positioning and Techniques, 7 th edition a standard protocol for all x-ray technicians at the Nebraska Medical Center. Once these values have been entered, the PCXMC software will calculate the Focus Skin Distance (FSD), beam width, and the beam height. The last two variables that are necessary for this examination data screen include the projection angle (i.e., AP, PA, lateral right, or lateral left) and the scan region which can be manipulated by using the cursor to adjust the field to the correct location. The scan region is automatically set once the field size calculator information has been entered. Once all input parameters have been added, the file can then be saved according to the scan type (i.e., Chest PA, Abdomen, etc.).

50 34 Figure 2.2 The main PCXMC input window. This input window used for the calculation of range and effective doses from conventional radiography. The user supplies all the technique parameters used for the patient exam, with the exception of input dose quality. The second step to calculating effective dose is to run each scan s saved parameters through the Monte Carlo calculations. This Monte Carlo program is a calculation of photon transport based on stochastic mathematical simulation of the interactions between photons and matter. Photons are emitted from an isotropic point source into the solid angle specified by the focus skin distance (FSD) and the x-ray field dimensions, and followed while they randomly interact with the phantom according to the probability distributions of the physical processes that they may undergo: photo-electric absorption, coherent (Rayleigh) scattering or incoherent (Compton) scattering. At each interaction point the energy disposition to the organ at that position is calculated and stored for dose calculation.
51 35 A large number of independent random photon histories are generated and estimates of the mean values of the energy depositions in the various organs of the phantom are used for calculating the dose in these organs (Tapiovaara and Siiskonen 2008). Once the Monte Carlo modeling is run for a particular scan type, it is then automatically saved by the PCXMC and ready to be utilized for dose assessment. The final step in determining the dose to a patient undergoing an x-ray procedure is to open the Compute Dose file from the main home screen (Figure 2.1). This window will then give two options to choose from: Change X-ray Spectrum and Open Monte Carlo data for dose calculation. The Change X-ray spectrum option will allow the user to input variables for the x-ray tube such as chemical element of the filter material, filter thickness, x-ray tube potential (kv), and x-ray tube anode angle. All variables stayed consistent except the x-ray tube potential which was adjusted to account for hospital s current technique chart (Table 2.1). After the x-ray spectrum was corrected for the pertinent scan, the Open Monte Carlo data for dose calculation option is opened. The program will then prompt the user to select the correct scan which has already been run through the Monte Carlo mathematical simulation. Upon selecting the correct scan, the user will then be asked to input the patient input dose as seen in Figure 2.3.

52 36 Figure 2.3 PCXMC 2.0 Patient Input Dose window. The input dose quality used for x-ray protocols was tube current time product (mas). The x-ray beam projection can be freely adjusted to suit various examination conditions for both radiography and fluoroscopy. The main factor in determining organ dose calculation is the incident air kerma. This determinant represents the air kerma at the point where the central axis of the x-ray beam enters the patient and must be provided by the user. The user can also enter the amount of radiation through three other means such as the entrance exposure (mr, free-in-air, without backscatter), air kerma-area product or dose-area product (mgy cm 2 ), or exposurearea product (R cm 2 ). Since we are using x-ray radiation measurements, the PCXMC program is able to estimate the incident air kerma from our input of the x-ray tube current-time product or mas. This will be the chosen variable for the amount of radiation being administered for each x-ray scan. Since the Nebraska Medical Center s techniques chart lists ranges of current-time products (mas), the average of these ranges was entered into the STUK program. Also averaged were the ranges of the tube potential s peak kilovoltage (kvp) as seen in Table 2.1.
53 37 Results from our Monte Carlo dose calculations can then be utilized to determine whole body effective doses according to ICRP reports 60 and 103. Both of these whole body effective doses can be seen in the results section of this thesis. The PCXMC software is also able to calculate risk estimates based on the absolute and relative risk models of the BEIR VII committee, but risk was not determined for x-ray scans due to small percentages. 2.3 Nuclear Medicine Dose Calculations Approximately 60 different diagnostic nuclear medicine procedures are currently performed at the Nebraska Medical Center. Only diagnostic scans were included in this research. Therapeutic radiopharmaceuticals such as I-131 thyroid ablations, Yttrium-90 radiolabelled monoclonal antibodies, etc. were not included. A list of current nuclear medicine procedures were obtained from the Nebraska Medical Center which listed the radionuclide, its chemical form, the type of procedure being performed, a range of typical adult doses, and the normal administered dose to the average adult. The typical dose is obtained from each package insert and can be adjusted by an authorized physician due to personalized imaging requirements. These prescribed dose charts have been reviewed and approved by authorized physicians trained in nuclear medicine procedures. The normal dose for each procedure was used in figuring the resulting effective dose for adult patients only. Please see Tables 2.2 and 2.3, which include all nuclear medicine procedures at the Nebraska Medical Center.
54 Table 2.2 The Nebraska Medical Center s Prescribed Dose Limit Chart. 38
55 39 Table 2.3 The Nebraska Medical Center s Prescribed Dose Limit Chart Cont d Calculating Nuclear Medicine Dose Because internal dosimetry has a different means in calculating effective dose than external exposure such as CT and x-ray procedures, a different approach must be taken. For this reason, the CDE, Inc. Dosimetry Services website was utilized.
56 40 The CDE, Inc. Dosimetry Services partnered with the Radiation Internal Dose Information Center (RIDIC) to provide a site of reference which contains all radionuclide information. The RIDIC provides physicians, nuclear medicine professionals, regulators, manufacturers, and nuclear pharmacy workers with the most up-to-date information on internal dose estimates and internal dosimetry techniques applied to the practice of nuclear medicine (CDE 2001). The contents of the RIDIC s website contains effective dose information for all nuclear medicine procedures currently used at the Nebraska Medical Center. Estimated radiation dose is given in Roentgen Equivalent Man (REM) received per millicurie (mci) of dose administered to the patient. Once the typical dose to an adult patient has been determined in units of mci, the estimated radiation dose for the whole body can be looked up on the CDE s website. The website will give the units in REM per mci. Therefore, the typical administered dose is multiplied by the estimated radiation dose variable to give the total body effective dose equivalent in REM. This calculation was made for each diagnostic nuclear medicine procedure and listed in the results section. A second radiation dosimetry software program was also utilized in order to compare other current dose estimates. This program, called Orgdose, is a newly released dose calculator which is user friendly and can calculate nuclear medicine effective doses with simple input values. One benefit to using the Orgdose program was the addition of calculating the cancer incidence risk according to the BEIR VII report.
57 41 Because this software program can calculate risk, data from nuclear medicine studies will correlate with information gathered from the computed tomography studies to gain a more consistent output of risk for the eventual NMC dose calculator. The input screen for the Orgdose nuclear medicine procedures can be seen in Figure 2.4. On this input screen the examination type, administered activity (in MBq), and the radiopharmaceutical are entered. Pull down menus are available for the examination type and the radiopharmaceutical used. However, not all of the scans performed at the Nebraska Medical Center were included in the Orgdose dosimetry program. Therefore, we were unable to calculate the incidence rate of cancer for those scans. Once the nuclear medicine parameters are entered into the Orgdose program, it will automatically calculate the Average Effective Dose in millisieverts (msv). This effective dose was then converted to mrem and recorded on the master Nuclear Medicine spreadsheet found in the Results section. Comparisons of the Orgdose whole body output doses will be compared with the CDE Inc. Internal Dosimetry results in Discussion section.

58 42 Figure 2.4 Orgdose Input Screen for Nuclear Medicine Procedures. From the input screen above, cancer risk calculations can be made once all procedure data has been entered. Orgdose is then able to calculate the lifetime attributable risk of cancer by choosing the age and gender of the patient from pull down menus. The age of the patients are given as 0, 1, 5, 10, 15, 20, 25, 30, 35, 40, 45, 50, 55, 60, 65, 70, and 80. Once the gender and age is entered, Orgdose will automatically run the risk calculation according to the BEIR VII data. Each nuclear medicine scan will have a CDE Inc. Internal Dosimetry whole body effective dose, an Orgdose effective whole body dose, and an incidence rate of cancer for each age of the patient at the time of the nuclear medicine procedure. This data will then be added to the master nuclear medicine spreadsheet found in the Results section.
59 43 A comparison will be drawn between the CDE Inc. Internal Dosimetry website (2000) and the newer version of Orgdose (2008) in the Discussion section. 2.4 Computed Tomography Dose Calculations The Nebraska Medical Center utilizes two types of Computed Tomography (CT) scanners on a daily basis to meet the diagnostic needs of inpatient, outpatient, and emergency department patients. The two main CT scanners utilized in the Radiology Department at the time of this research were the General Electric (GE) Lightspeed Pro 16 a 16 slice unit and the General Electric VCT Discovery, a 64 slice scanner. Because CT scanning input variables can vary from scan to scan, written protocols regarding typical scan parameters were acquired from the Nebraska Medical Center s radiology department. These protocols were reviewed by the medical diagnostic physicist and pertinent changes were made according to current imaging parameters. Each of these scans individual parameters can be found in for the Lightspeed Pro 16 slice scanner in Appendix A Description of IMPACTS Dosimetry Program In order to correlate the CT parameters into an effective dose equivalent, a computer program called IMPACT: CT Patient Dosimetry Calculator, version 0.99x (2006) was used.
60 44 This software was compiled by a group called IMPACT which stands for Imaging Performance Assessment of CT Scanners and is part of the Imaging Physics section of the Medical Physics Department at St. George s Hospital in Tooting, London. IMPACTS main focus is to accurately and consistently evaluate the imaging and dose performance of CT scanners while still maintaining an objective, independent, and comparative role. Their test procedures are well established and widely accepted throughout the world for CT dosimetry. IMPACTS version 0.99x, is compiled as a spreadsheet tool for calculating patient organ and effective doses from CT examinations. It utilizes the NRPB Monte Carlo dose data sheets produced in report SR250. The NRPB report permits the estimation of the mean absorbed dose to approximately 25 organs and tissues in reference adult patients from common radiographic, CT, and fluoroscopic examinations. The Monte Carlo simulations of calculated x-ray spectra in an adult, hermaphrodite, mathematical phantom can be seen in Figure 2.6. The free-in-air, onaxis dose was measured for each scanner and, with knowledge of kv, focus-to-axis distance and details of the x-ray beam filter, the Monte Carlo techniques modeled the dose distribution within the mathematical phantom. There were 23 data sets produced for all the surveyed contiguous, 5 mm thick transverse slabs, covering the mathematical phantom. Therefore, a data set consists of 208 normalized dose values for each of the 27 organs represented in the phantom. Tissue Weighting Factors (W T ) from ICRP 60 is used in calculating effective doses for version 0.99x.
61 45 The latest version of IMPACTS Version (2009) has the most recent Tissue Weighting Factors listed from ICRP 103 (2007), but was not available at the time of data collection for this research CT Input Assumptions IMPACTS version 0.99x spreadsheet must have eight key input parameters entered in order to most accurately calculate the whole body effective dose for our reference man/woman phantom. In Figure 2.5, is the input spreadsheet for IMPACTS version 0.99x. The first key input parameter is the camera make and model. The IMPACTS system pulls data sets from referenced material previously recorded from the NRPB studies regarding our two scanners of interest, the General Electric (GE) Lightspeed Pro 16 and GE VCT 64. The remaining input parameters are taken from the Nebraska Medical Center s Department of Radiology protocol list. This protocol list includes tube potential (kv), scan region of interest, tube current over time (mas), rotation time, collimation of the x-ray beam, and pitch. An example of the protocol list for the GE Lightspeed Pro 16 can be seen in Appendix A.

62 46 Figure Input spreadsheet for IMPACTS version 0.99x. After each parameter is entered into the IMPACTS input spreadsheet, the scan region of interest must be set on the adult, hermaphrodite, mathematical phantom as seen in Figure 2.6. In order to adjust the region of scanning interest, the tab named Phantom must be selected. The beginning and end regions of this phantom are then imported to the main calculation in order to properly weigh all sensitive biological organs and tissues located within the region of interest.
.")
63 47 Figure Adult, hermaphrodite, mathematical phantom. This phantom is used in the Monte Carlo simulations of the PCXMC 2.0 software with highlighted area of scanning. Once all parameters are verified, the Update Data Set button is clicked to calculate the Total Effective Dose for all combined weighted tissues in millisieverts (msv). It is important to note that each sex has different tissues and organs that are more radiosensitive than others. Therefore, each sex may have a different value for their Total Whole Body Effective Dose. For example, reproductive structures or gonads in females have a greater tissue weighting factor and therefore, have a greater effect on the total effective dose. The effective dose data was then recorded on the master spreadsheet for both the Lightspeed Pro 16 and VCT 64 according to the individual scan.
64 48 An additional feature that can be utilized from the IMPACTS software is the determination of incidence rate of developing cancer as a result of undergoing a particular CT scan. On the main IMPACTS spreadsheet there is a tab indicated as LAR% which stands for Lifetime Attributable Risk Percentage. This LAR spreadsheet page references the gender of the patient and the effective dose from the main input screen. These variables are used along with LAR values referenced from Table 12D-1 in the BEIR VII report 7, which will calculate the increase in lifetime attributable risks of cancer as seen in Figure 2.7. On Table 12D-1 of the BEIR VII report, the LAR is given by the number of cases per 100,000 persons exposed to a single dose of 0.1 Gy given at several age groups. This lifetime attributable risk is then multiplied by both the equivalent organ dose (EOD) and a conversion factor to get the percent increase of cancer risk for each specified organ. These organ percentages are then added to give the whole body percent increase of developing cancer over the remaining course of a lifetime.
65 49 Figure 2.7 PCXMC 2.0 version 0.99x Lifetime Attributable Risk Calculation Spreadsheet. Each major CT scan performed at the Nebraska Medical Center has both a whole body effective dose according to available protocols, as well as, increased incidence rates of developing cancer for ages ranging from 0 to 80. This information is compiled on a master spreadsheet containing the GE Lightspeed Pro 16 and GE VCT 64 parameters. The most common CT scan s effective doses will be compared with other institutions of similar size and presented in the discussion section of this thesis.
66 50 Chapter 3 Results 3.1 Conventional X-Ray Procedure Results Table 3.1 lists the 32 currently performed x-ray examinations at the Nebraska Medical Center. For each exam is a list of all input data entered into the STUK PCXMC software program for calculating medical x-ray examinations. The input data was gathered from the technique chart (Table 2.1) and general x-ray techniques which were referenced from the Bontrager s: Handbook of Radiologic Positioning and Techniques. After all input values were run with the STUK PCXMC software program, resulting whole body effective doses were recorded according to the ICRP 60 and 103 tissue weighting factors. The last two columns reflect the whole body effective doses for each scan. a. This table lists all current protocols and techniques.
67 51
68 Table 3.2 Duke University s X-ray protocol list with corresponding effective doses according to gender. 52
69 53 For a comparison between the Nebraska Medical Center and Duke University, two institutions of similar size, the effective doses were used for comparison. Table 3.2 lists all x-ray protocols available on the Duke University s Radiation Safety website according to scan type and gender of the patient. Similar studies between Duke and the Nebraska Medical Center will be compared in Table 3.3. Table 3.3 Conventional X-ray Comparison. A comparison of effective doses between the Nebraska Medical Center, Duke University, and an on-line calculator xrayrisk.com according to individual procedures.
70 54 A complete list of the Nebraska Medical Center s protocols are listed on the left hand side of the column with corresponding effective doses according to ICRP 60 and 103 tissue weighting factors. Duke University s effective doses are given for only those procedures similar to the Nebraska Medical Center s which include doses according to gender. The final column of Table 3.3 is a list of effective doses given for the xrayrisk.com website that were similar to the Nebraska Medical Center s procedure list. Figure 3.1 Four of the most common x-ray procedures performed and their effective doses. The Nebraska Medical Center s procedures were compared between the ICRP reports 60 and 103 for tissue weighting factors. Duke University s scans were separated according to gender and xrayrisk.com s were single outputs with no correlation to either gender or ICRP tissue weighting factors.
 were used for NMC protocols.")
71 Nuclear Medicine Procedure Results Table 3.4 A list of Nebraska Medical Center s nuclear medicine procedures and their pertinent effective doses. Two different dose calculating methods (RADAR / RIDIC and Orgdose) were used for NMC protocols. These effective doses are then compared to Duke University and xrayrisk.com s.
 were used for NMC protocols.")
72 Table 3.5 A list of Nebraska Medical Center s nuclear medicine procedures and their pertinent effective doses cont d. Two different dose calculating methods (RADAR / RIDIC and Orgdose) were used for NMC protocols. These effective doses are then compared to Duke University and xrayrisk.com s. 56
73 57 The Nebraska Medical Center s Dose Limit Chart, which encompassed all current nuclear medicine procedures and normal dose administrations, found in the two tables above, were used in conjunction with individual radiopharmaceutical given on the RADAR / RIDIC website to determine the whole body effective doses. The Nebraska Medical Center s normal doses were also entered into the Orgdose computer software to give a comparison of whole body effective doses. These two dose outcomes were then compared to Duke University and xrayrisk.com s whole body effective doses for similar nuclear medicine scans in Figure 3.2. Figure 3.2 Comparison of Nuclear Medicine Procedures. A comparison of nuclear medicine procedures to include the following nuclear procedures: Technitium-99m liver/spleen scan, Technitium-99m myocardial stress test, Thallium-201 myocardial imaging, F-18 FDG tumor localization, and Technitium-99m MDP bone scan. The Nebraska Medical Center s protocols were calculated using two different methods and compared against Duke University and xrayrisk.coms websites. me
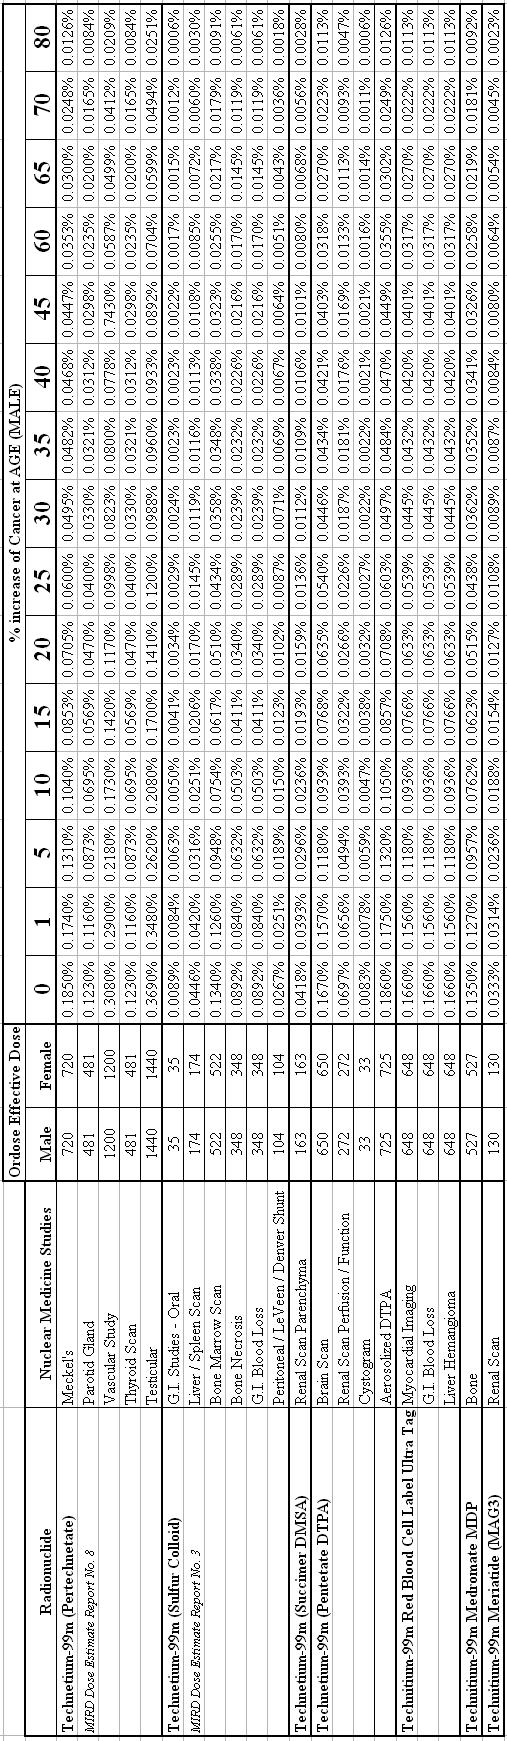
74 58

75 59
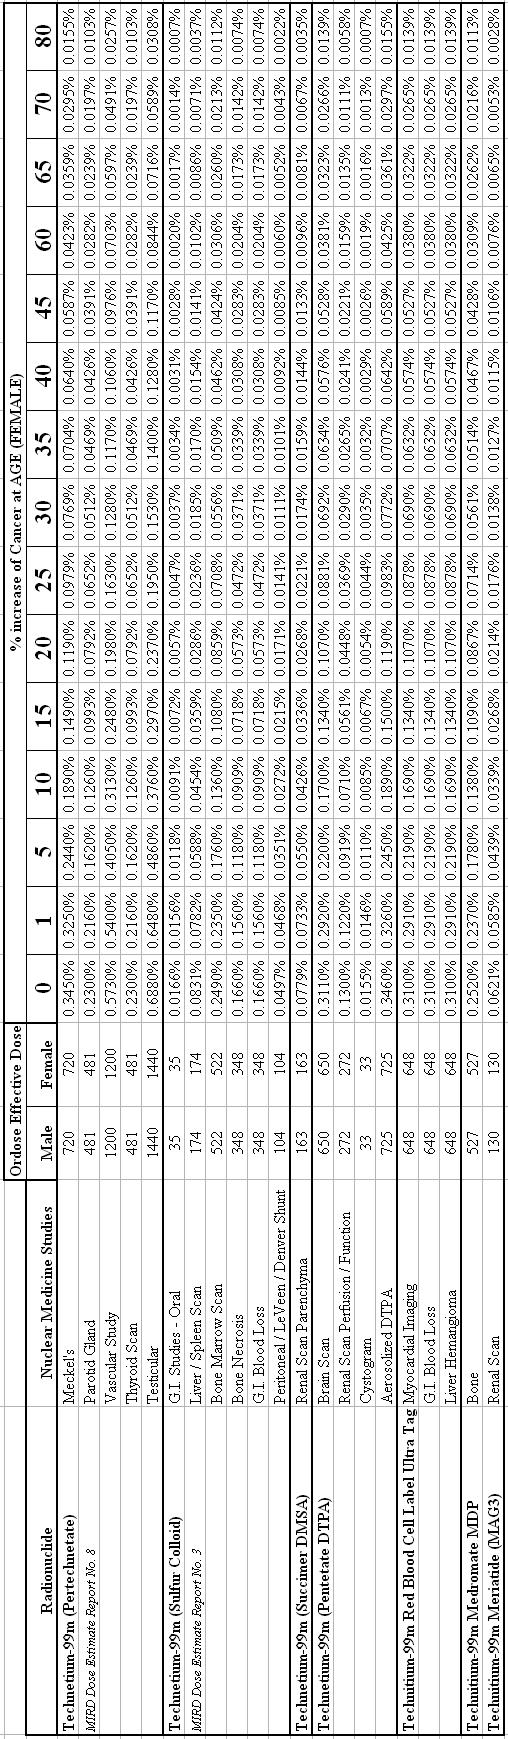
76 60
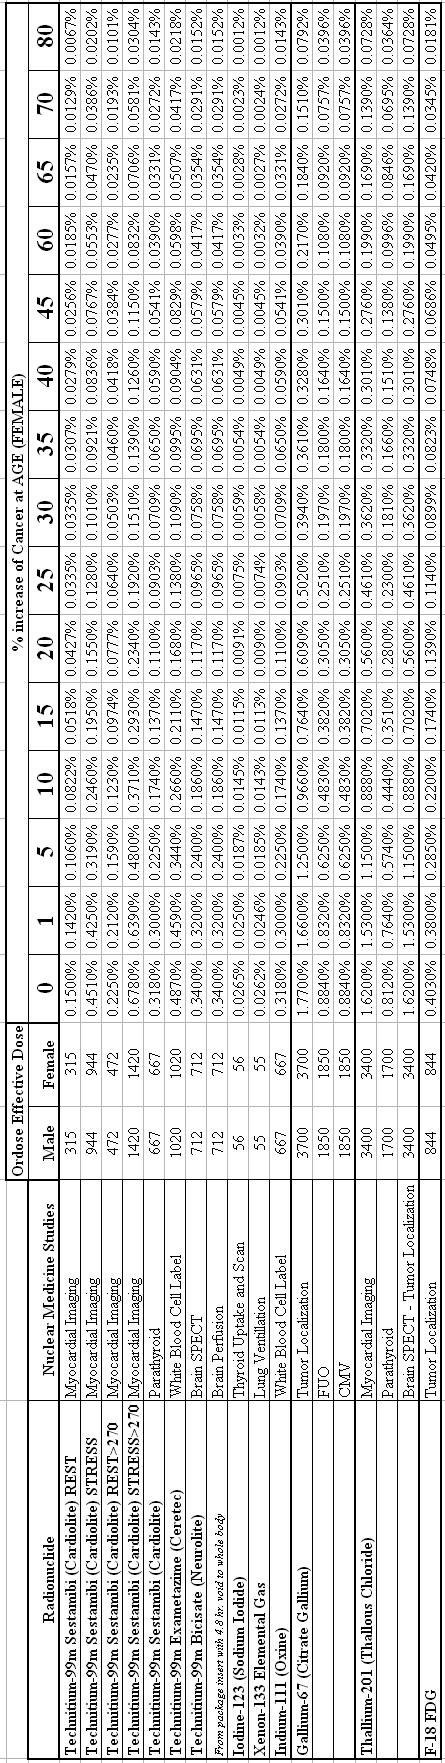
77 61
78 Figure 3.3 Nebraska Medical Center F-18 FDG LAR of Cancer. The Lifetime Attributable Risk of Cancer for a patient administered 12 mci of F-18 FDG according to the age at exposure. This data was calculated using the Orgdose computer software. 62
79 Figure 3.4 The Lifetime Attributable Risk of Cancer of a patient administered 25 mci of Tc-99m Sestamibi (Cardiolite) Stress Test according to the age at exposure. This data was calculated using the Orgdose computer software. 63
80 Computed Tomography Examination Results Computed Tomography Results, 16 Slice CT Scanner Table 3.10 The 18 most common Computed Tomography (CT) procedures performed on the GE Lightspeed Pro 16 at the Nebraska Medical Center and the pertinent effective doses for each scan according to gender. A comparison between the RADAR, Duke University and x-rayrisk.com s on-line dose calculators is also shown in Table 3.10 above.
81 Figure Slice CT Procedure Comparison. Comparison of 16 slice CT effective doses of various scan regions to include: Routine Head (Axial), Routine Chest (Helical), Chest / Abdomen / Pelvis (Helical), and Pelvis (Helical) from the Nebraska Medical Center (NMC), Duke University, and xrayrisk.com 65
82 66 Individual 16 Slice CT Scans and the Lifetime Attributable Risk of Cancer according to the Nebraska Medical Center s Scanning Protocols Figure 3.6 Nebraska Medical Center 16 Slice CT Routine Chest Scan s LAR of Cancer. Figure 3.7 Nebraska Medical Center 16 Slice CT Chest / Abdomen / Pelvis Scan s LAR of Cancer.
83 67 Figure 3.8 Nebraska Medical Center 16 Slice CT Cervical Spine Scan s LAR of Cancer Figure 3.9 Nebraska Medical Center 16 Slice CT Thoracic Spine Scan s LAR of Cancer
84 68 Figure 3.10 Nebraska Medical Center 16 Slice CT Lumbar Spine Scan s LAR of Cancer Figure 3.11 Nebraska Medical Center 16 Slice CT Colonography Scan s LAR of Cancer
85 Computed Tomography Results, 64 Slice CT Scanner Table The 21 most common Computed Tomography (CT) procedures performed on the GE VCT 64 slice CT at the Nebraska Medical Center and their pertinent effective doses for each scan. A comparison between the Nebraska Medical Center, RADAR, Duke University and x-rayrisk.com s on-line dose calculators is also shown above.
86 Figure Slice CT Procedure Comparison. Comparison of 64 slice CT effective doses of various scan regions to include: Routine Head (Axial), Routine Chest (Helical), Chest / Abdomen / Pelvis (Helical), and Pelvis (Helical) from the Nebraska Medical Center (NMC), Duke University, and xrayrisk.com 70
87 71 Figure 3.13 Nebraska Medical Center 64 Slice CT Cervical Spine Scan s LAR of Cancer Figure 3.14 Nebraska Medical Center 64 Slice CT Routine Chest Scan s LAR of Cancer
88 72 Figure 3.15 Nebraska Medical Center 64 Slice CT Chest / Abdomen / Pelvis Scan s LAR of Cancer. Figure 3.16 Nebraska Medical Center 64 Slice CT Neck / Chest / Abdomen / Pelvis Scan s LAR of Cancer.
89 73 Figure 3.17 Nebraska Medical Center 64 Slice CT PET Whole Body Scan s LAR of Cancer ifetime attributable risk of caner for males according to the Nebraska fective doses and incidence rates of cancer were calculated from x (2006).
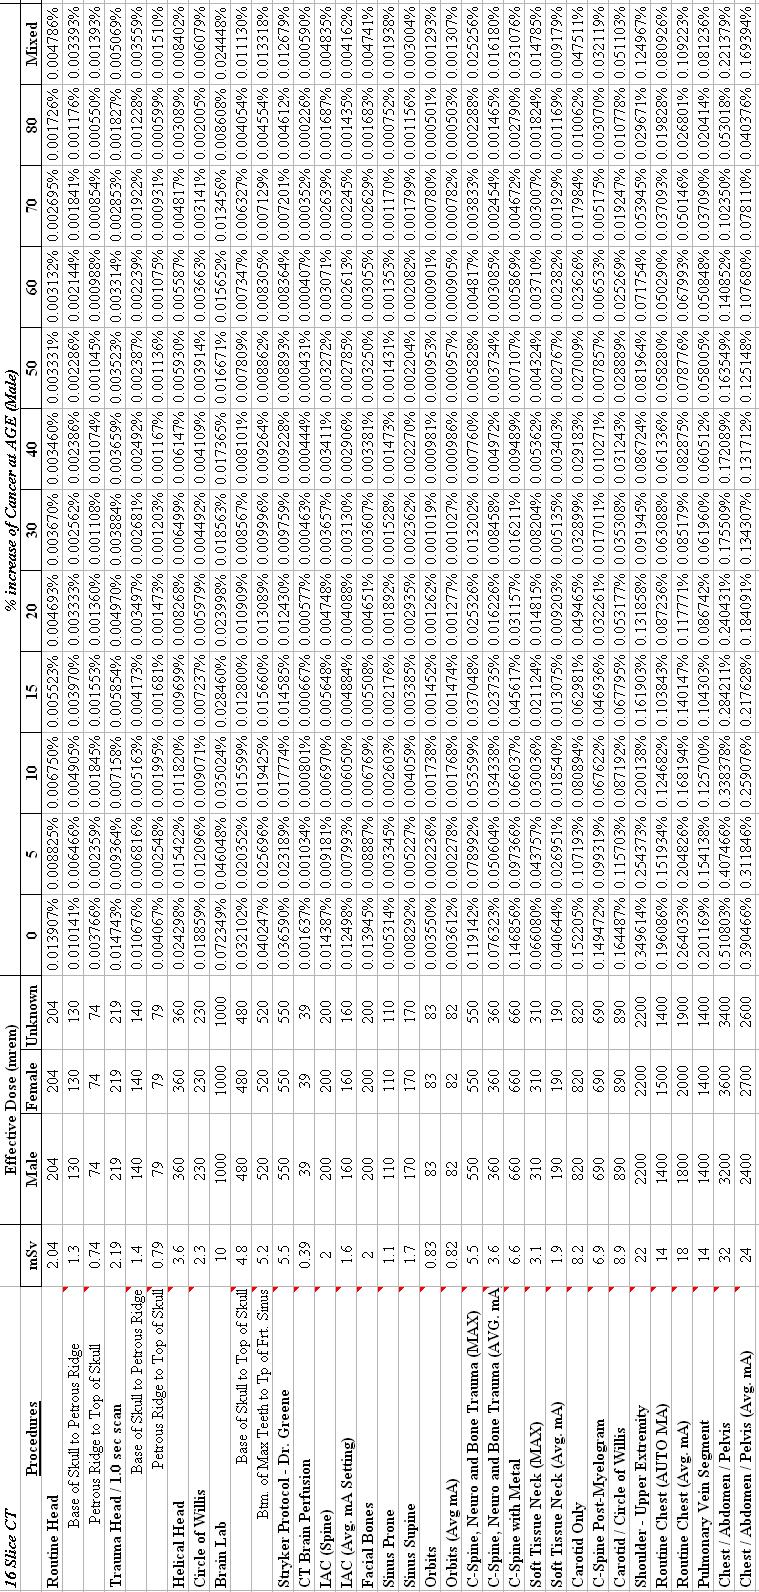
90 aska 74
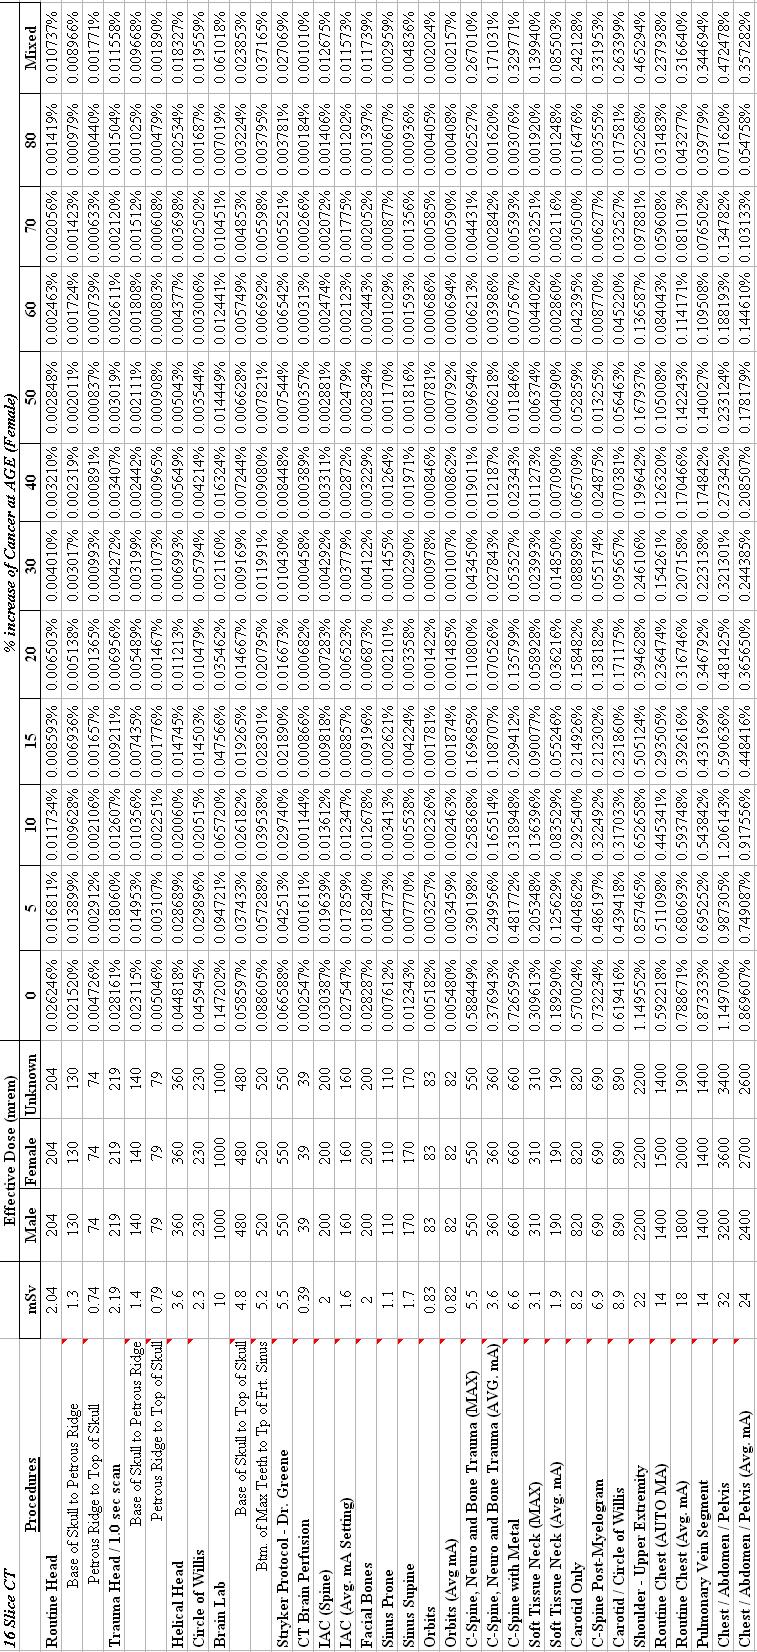
91 aska 75
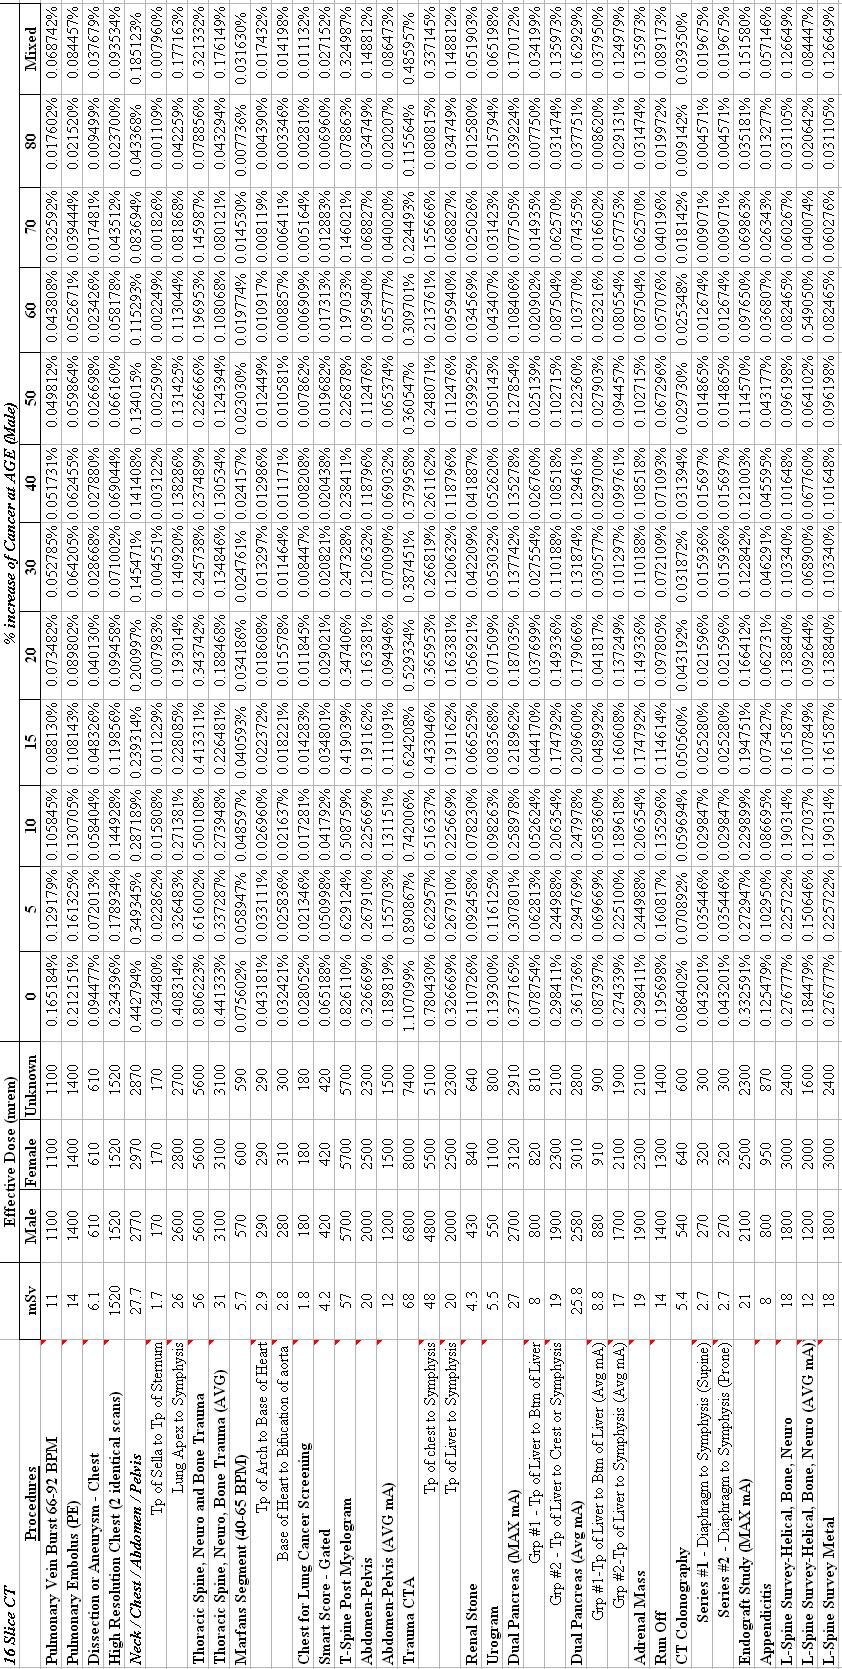
92 braska 76
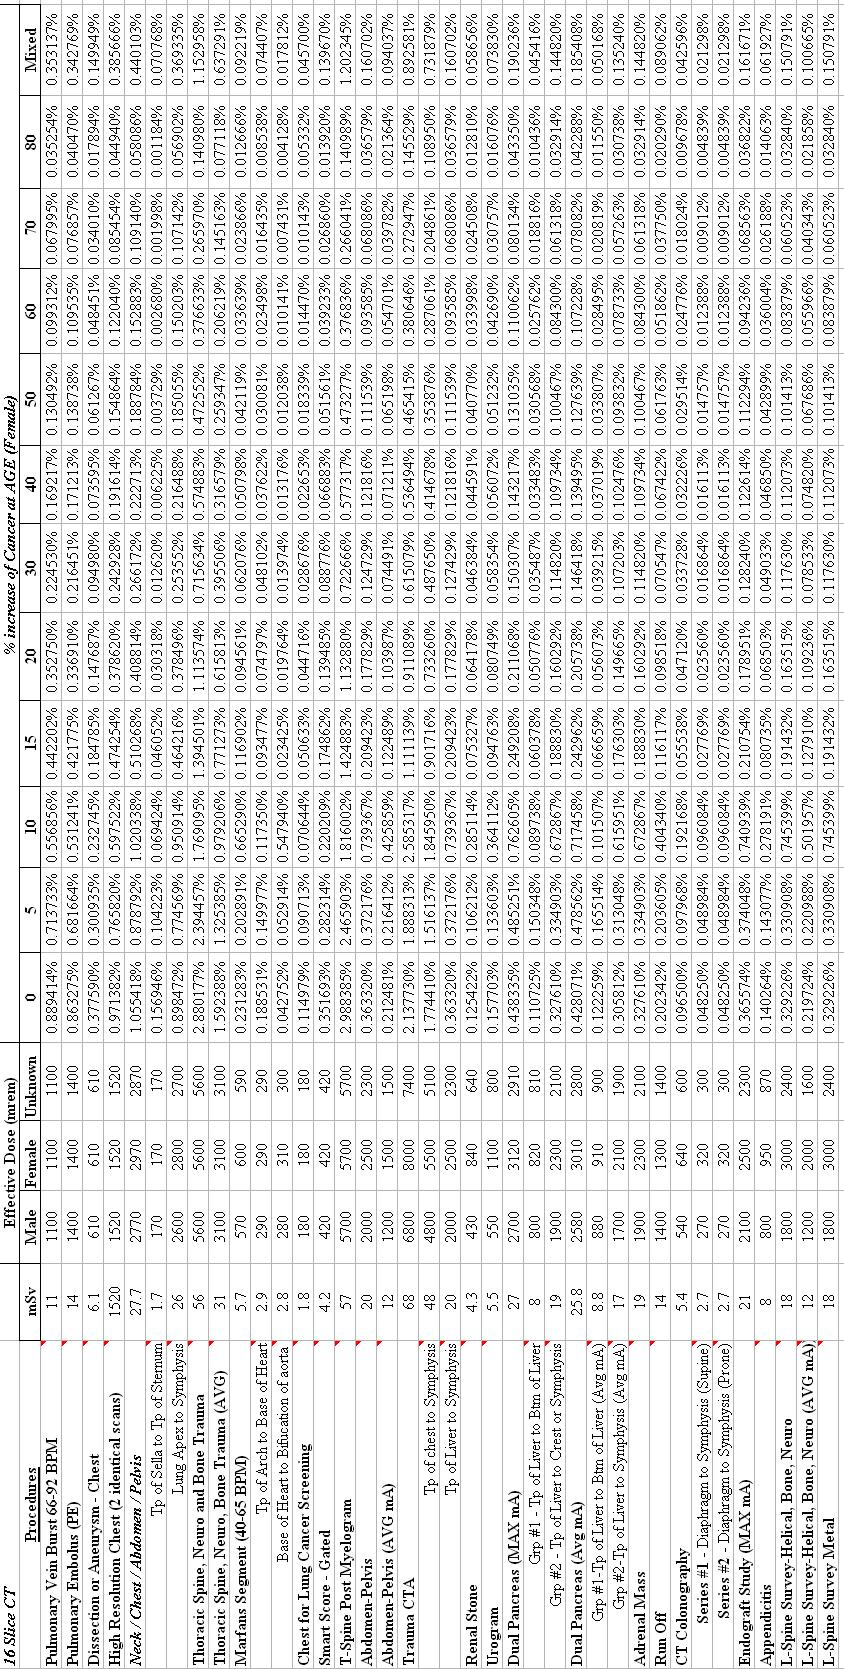
93 a 77
94 ka 78
95 a 79
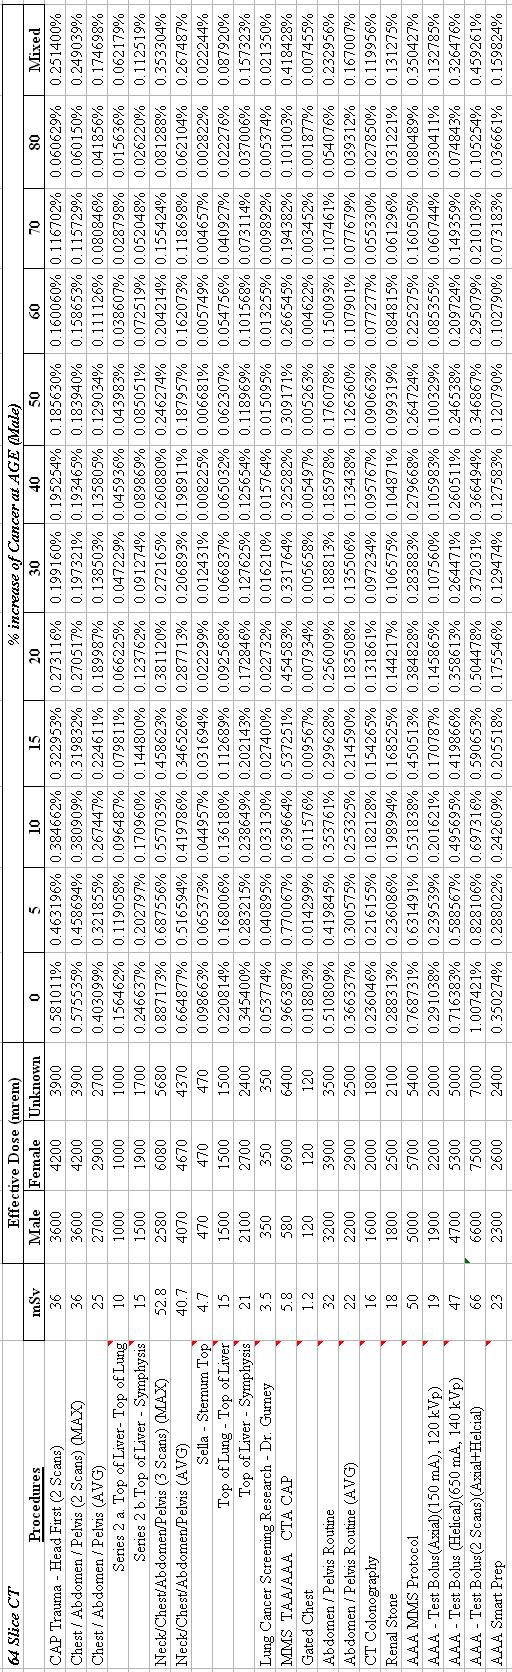
96 ska 80
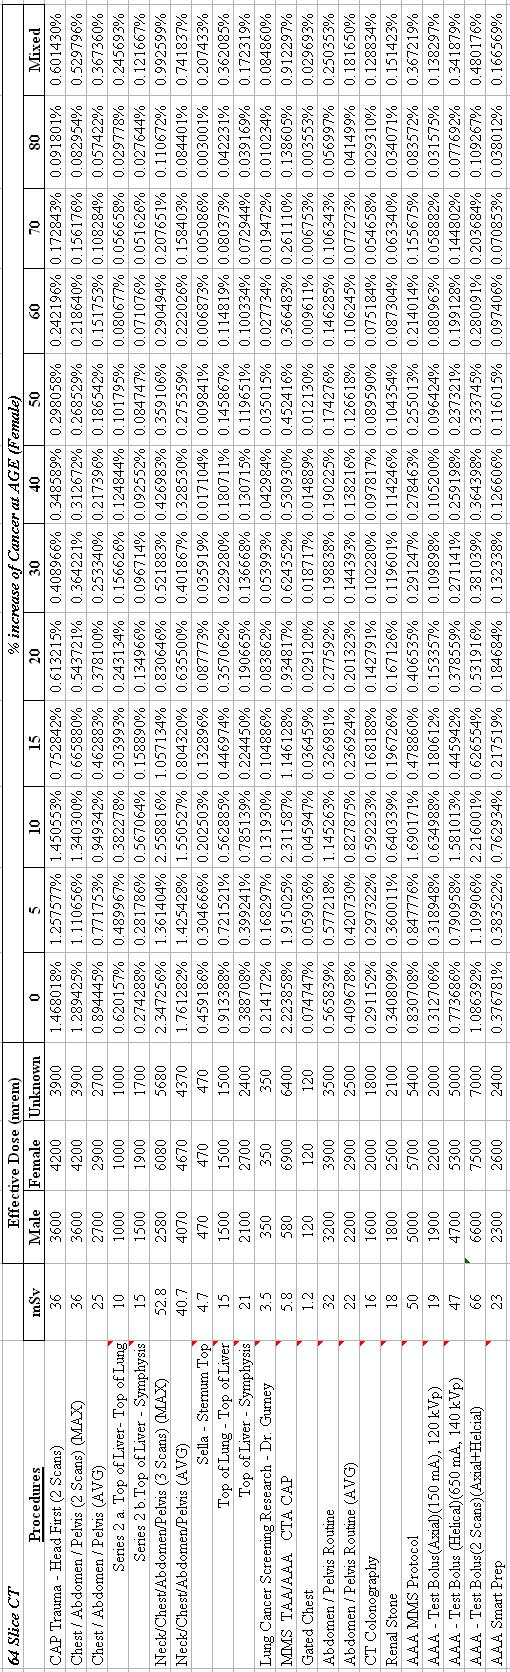
97 a 81
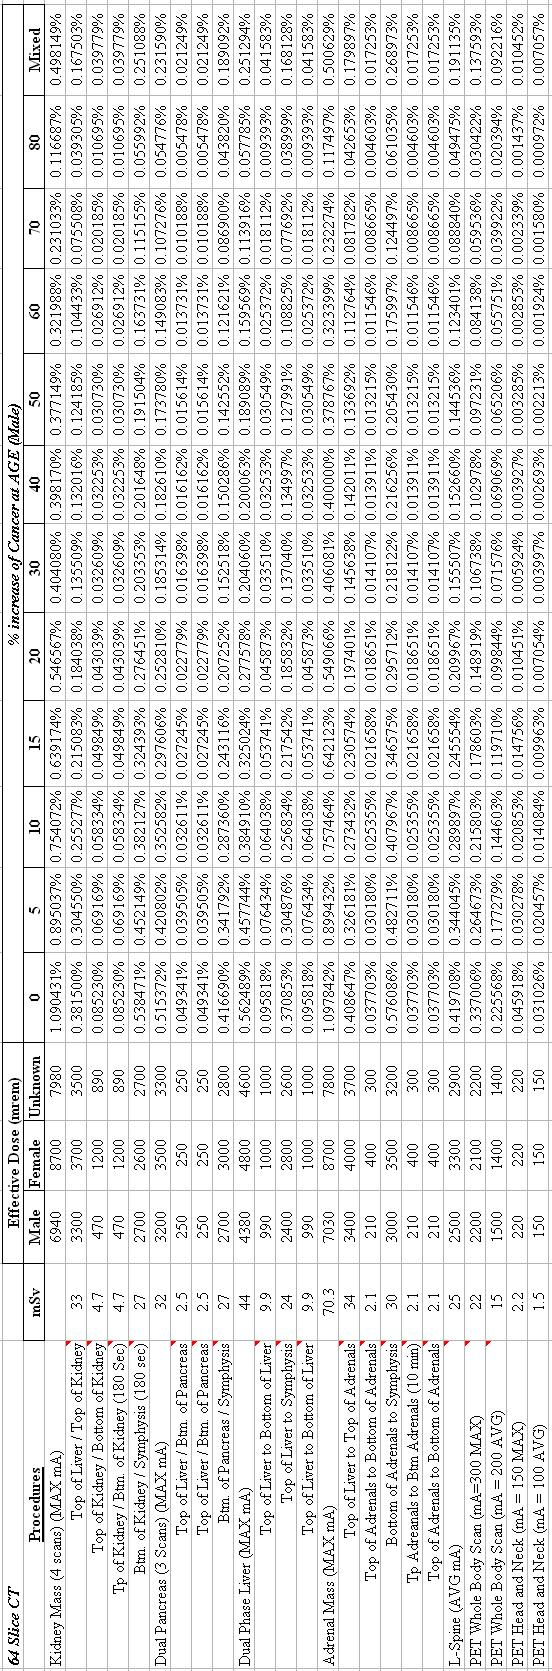
98 82
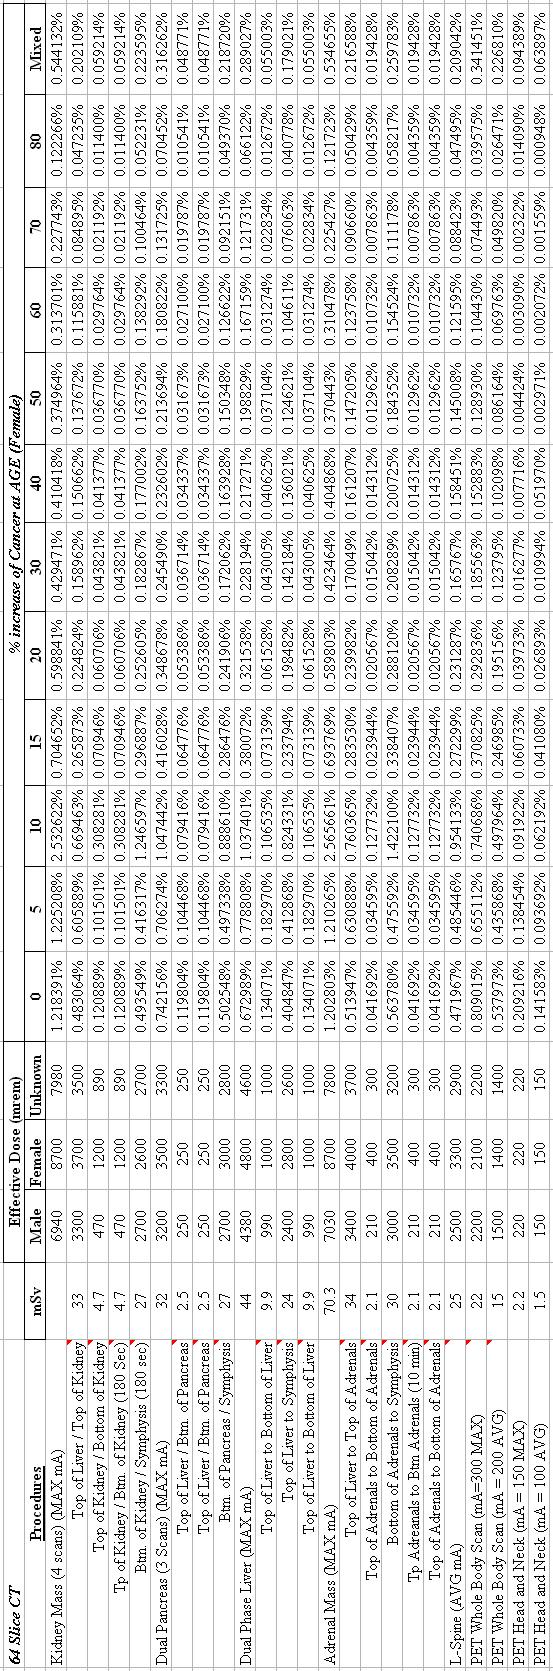
99 83
100 84 Chapter 4 Discussion The main purpose of this research is to determine effective doses of radiation from medical diagnostic modalities involving radiation based solely on individual scanning protocols at the Nebraska Medical Center (NMC). From input values acquired from NMC protocols, these effective doses were calculated using various computer software programs specifically designed for determining effective dose output. Each NMC medical modality has individual results for each of scans listed on current protocols. Since the NMC had a greater number of specific individual scans, only the most common scans from each modality were used in a comparison to other current data available from Duke University and other commonly utilized on-line dose calculators. For the nuclear medicine and computed tomography incidence rates of cancer were also determined using the effective doses calculated from the Orgdose and IMPACTS computer software programs, respectively. These lifetime attributable risks (LAR) of cancer were determined for their eventual use in the Nebraska Medical Center s dose calculator and to calculate cumulative exposures experienced by patients over the course of their lifetime. 4.1 Conventional X-ray Procedures The hypothesis for all x-ray procedures performed at the Nebraska Medical Center versus other institutions was that all effective doses would all be predominately similar due to universal positioning technique.
101 85 The only variations from one institution to the other would most likely be the tube current (mas) and slight variation on tube voltage (kvp) settings. In Table 3.1, all input parameters for the STUK medical x-ray program were listed along with output effective doses according to ICRP reports 60 and 103. Because each ICRP report has varying tissue weighting factors, there was special interest in procedures with fields of view (FOV) in the breast and reproductive organ regions of the body. For example, the most distinct difference for the change in breast tissue weighting factor in ICRP 103 can be seen for the Chest Lateral 72 SID with grid for an adult. The effective dose was increased from 40 mrem using ICRP 60 tissue values to 51 mrem or a 27.5% increase by using the ICRP 103 tissues values. For the three other chest x-ray procedures (PA 72 SID without grid adult, AP 48 SID with grid adult, and 48 SID without grid adult) there was only a slight increase of 3 to 5 mrem from ICRP 60 to 103. In contrast, the reproductive organ areas have a reduced tissue weighting factor in ICRP 103 than in ICRP 60. This variation of tissue weighting factors is evident for the x-ray scan of the pelvic region. According to NMC protocols and the STUK x-ray program, an x-ray of the pelvic area would yield an effective dose of 77 mrem according to the ICRP 60 weighting factors, but would be reduced approximately 41% to 45 mrem with ICRP 103 weighting factors. The same outcome can also be seen in x-rays of the lumbar spine region. These two areas are the only variations in effective doses from tissue weighting factors seen from ICRP 60 versus 103 in Table 3.1. The remaining x-ray procedures completed at the Nebraska Medical Center did not have any considerable variations from the two ICRP reports.
102 86 For a comparison to another medical institution of similar scope, as well as, a general on-line publicly accessible dose calculator, Table 3.3 shows the variations in effective dose. In this table, there is evidence in protocol variations from each institution. Input values that are most likely the reason for institution variations include x-ray tube voltage (kvp) and tube current (mas). If Duke University s protocol and technique lists were available, a detailed analysis could be drawn between the differences of the two medical institutions. However, this comparison would be out of the scope of this research, only comparisons of effective doses will be discussed. The only major variation in effective x-ray doses from the two institutions is the Hip AP scan. From this scan, Duke has a male effective dose of 117 mrem and a female dose of 47 mrem, where NMC has an effective dose around 6 mrem for both genders. Because the hip scan region includes the reproductive organs of a female, Duke most likely used ICRP 60 for its tissue weighting factors due to the higher male to female effective dose output. Duke also may have increased their x-ray tube current to a substantially higher value than NMC s tube current setting of 30 mas. With the exception of a few x-ray scans, there seems to be similar effective doses for major scans such as chest, pelvis, spine series, and extremities. In Figure 3.1, four of the most common x-ray procedures are listed with each institution s effective doses. For the typical Chest AP x-ray all effective doses are around 20 mrem. This is primarily due to typically low tube current (6-9 mas).
103 87 Chest x-rays are typically administered to patients with lung ailments and therefore, do not need to penetrate dense tissue in order to produce a satisfactory image. Thus, the chest x-ray administers a relatively low dose of ionizing radiation. A good example of a scan which would need to increase tube current in order to penetrate a more dense body region would be of the abdominal area. In Figure 4.1, the NMC protocol is greater than both Duke and xrayrisk.coms most likely due to an increase in tube current to 83 mas. This verifies that tube current and scan region are intricate values when determining x-ray procedure effective doses. It is also interesting to note that the Duke University s abdomen effective dose for females (94 mrem) is almost double that of the males (49 mrem). This most likely is a greater weighting of the female reproductive structures located within this scan region where as, the males reproductive structures are most vulnerable in x-ray scans of the hip region, as evident in Table 3.3. The last effective dose to discuss for the abdomen is the one found on xrayrisk.com s (70 mrem), which seems to be half of the two Duke output effective dose values for male/female and approximately one third of the Nebraska Medical Center s effective dose. The last scan region of comparison in Figure 3.1 is the skull. The output effective doses for this scan region vary considerably between NMC (~3 mrem) to Duke s (~42 mrem). Since the brain and the surrounding skull have small tissue weighting factors, the increase in dose is most likely an increase in the tube current which is needed in order to penetrate the dense bone matter of the skull.
104 88 According to the NMC skull protocols listed, the tube current is only 30 mas. Therefore, the Duke University must have a tube current in the magnitude of 10 times larger than the Nebraska Medical Center s. The xrayrisk.com s effective dose is similar to NMC s with a dose of 10 mrem. 4.2 Nuclear Medicine Procedures The Nebraska Medical Center s complete list of nuclear medicine procedures, on Tables 3.4 and 3.5, lists each radionuclide and its pertinent nuclear medicine study. Each nuclear medicine study s effective dose was then determined by two current dose calculation methods called RADAR / RIDIC and Orgdose. The basis for using two methods to determine effective doses was to compare effective doses between an organization specializing in up to date information on internal dose estimates which draws information from accurate sources called RADAR and a new user friendly internal dose calculator which will be used to determine both effective dose and the lifetime attributable risk of cancer called Orgdose. Orgdose was utilized in this research due to its ability to easily calculate cancer incidence rates according to the BEIR VII report. It was necessary for the Orgdose and RADAR effective doses to be in close proximity in order to verify that the LAR were also similar due to the fact that RADAR is unable to calculate risk of cancer. Out of the 40 nuclear studies that RADAR and Orgdose had in common, 25 of those studies had higher effective doses using RADAR data.
105 89 There seemed to be a trend regarding the type of radiopharmaceutical used. In studies involving Tc-99m Sulfur Colloid, there was 15 to 98 mrem higher for RADAR effective doses than those calculated using the Orgdose software. In contrast, Orgdose s effective doses for Tc-99m Pertechnetate were between 91 mrem to 270 mrem greater than those calculated using RADAR. The greatest nuclear study variation between these two dose calculating methods occurred between the three most prescribed studies such as Tc-99m Sestamibi (Cardiolite) used in myocardial imaging, Tl-201 (Thallous Chloride) also used in myocardial imaging, and F-18 FDG tumor localization studies. For the myocardial imaging procedures involving Tc-99m Sestamibi, Orgdose had an effective dose double that of RADAR s with approximately 540 mrem more, totaling 944 mrem. For the Tl-201 myocardial imaging, Orgdose once again had an effective dose 1,000 mrem greater than that of RADAR s calculated effective dose. In contrast however, Orgdose had an effective dose 476 mrem lower for F-18 FDG tumor localization than RADAR. These variations are concerning because they can greatly effect the cumulative cancer incidence rates a patient may incur from undergoing these particular scans. In this case, the Nebraska Medical Center will accept conservative and reliable values for effective dose estimates and use the RADAR dose information. Also listed in Tables 3.4 and 3.5 are the effective doses for Duke University and xrayrisk.com.
106 90 By including these two sources of effective doses we can compare the Nebraska Medical Center s data with an institution of similar nuclear medicine procedures, as well as, an on-line dose calculator that may be used by patients interested in knowing their radiation dose from a nuclear medicine study. In Figure 3.2, a bar graph is used to compare the five most popular nuclear medicine studies and their effective doses from the Nebraska Medical Center, Duke University, and xrayrisk.com. The first study to be compared is the Tc-99m Sulfur Colloid Liver/Spleen scan where all four effective doses have similar doses of 250, 174, 200, and 310 mrem. These effective doses can be explained by approximately 80% to 90% of the injected radioactive particles being sequestered in the liver and 5% to 10% localizing in the spleen (Mettler and Guiberteau 2006). Because a majority of this radiation is contained within these two organs the whole body effective dose is lowered because no other organs retain radioactive particles thus reducing the exposure to other vital organs and lowering the effective dose. The second comparison of this figure is one of the most widely used nuclear studies performed in the United States. Here, the Tc-99m Sestamibi (Cardiolite) myocardial stress test is compared. Although the typical administered dose of Tc- 99m Sestamibi is larger than other myocardial imaging agents such as Tl-201, it offers better counting statistics, with reduced radiation dose to patients and also has advantageous photon energies, producing higher-resolution SPECT images (Mettler and Guiberteau 2006). In comparing the results in Figure 3.2, we see that Duke has the highest effective dose with 1,440 mrem followed by the Nebraska Medical Center and xrayrisk.com with approximately 940 mrem each.
107 91 It is also interesting to note that by using the Nebraska Medical Center s protocol with the RADAR calculation, the effective dose for a Tc-99m Sestamibi stress test was only 399 mrem or 72% less than Duke University s reported effective dose. The third nuclear medicine study to be compared is the Tl-201 (Thallous Chloride) myocardial imaging agent. The difference between Tl-201 and other radiopharmaceuticals listed is the increased biological half life of Tl-201. Thallium clearance from the body occurs mostly by urinary excretion, with only 4% to 8% cleared in 24 hours. About 3% of the thallium localizes in the kidneys, which are considered critical organs. The slow biological clearance and long physical half life result in an effective half-life in the body of 55 hours (Mettler and Guiberteau 2006). Because Tl-201 remains in the body for an extended period of time, it increases the absorbed dose to the patient and limits the amount that can be administered. This increased effective dose can be seen in Figure 3.2. Here we see that the effective dose for Tl-201 for the Nebraska Medical Center and Duke University are approximately 3,000 to 3,400 mrem when compared to xrayrisk.com s effective dose of 4,070 mrem. Effective doses incurred from Tl-201 radiopharmaceuticals have a dose four times that of Tc-99m myocardial imaging agents translating to an increased cancer incidence rate as seen in Table 3.7. The fourth radiopharmaceutical compared in Figure 3.2 is a popular imaging agent for tumor localization called Fluorine-18 FDG. Fluorine-18 FDG is a position emitter with an energy of 511 kev and an extremely short half life of approximately 109 minutes.
108 92 Because F-18 has a high energy, but a short half life, its effective dose is roughly higher than a Tc-99m myocardial rest/stress test at 1,320 mrem. A majority of the organ exposure takes place in the bladder and depends greatly on the hydration and voiding of the patient. According to the reported F-18 effective dose for Duke University (2,200 mrem), it is 67% higher than the Nebraska Medical Center s protocol which had an effective dose of 1,320 mrem. This increase in dose maybe due to an increase in administered prescribed dose of F-18 utilized by Duke University s protocols. Currently, there is a standing physician order of mci of F-18 at the Nebraska Medical Center. According to RADAR, for every mci of F-18 administered, there is an effective dose of 110 mrem. So, if Duke s dose estimates correlated with RADAR they would most likely have an administered dose around 20 mci. The Nebraska Medical Center and xrayrisk.com have comparable effective doses with 1,320 mrem and 1,410 mrem, respectively. Orgdose has an effective dose 36% lower than the Nebraska Medical Center, which most likely means that it utilized a lower dose per activity ratio than the one used for NMC. The last radiopharmaceutical examined was a Tc-99m MDP (Medronate) bone dose, which yields a common effective dose around 500 mrem for all institutions. The similarity in dose is a result of 50 to 60% of the radiopharmaceutical being taken up by the bone while the remainder of the activity is excreted via the kidneys. Because a majority of Tc-99m MDP resides in the bone and away from critical organs the effective dose is lower.
109 93 It also has a 24 hour biological half life which limits its exposure period to other vital organs. Tables 3.6 to 3.9 list each individual nuclear medicine procedure provided by the Nebraska Medical Center along with the effective dose according to gender. Also included in these tables are the incidence rates of cancer which may occur as a result of undergoing a particular scan at a given age from 0 to 80 years according to the BEIR VII data. The LAR of cancer were produced using the Orgdose computer software program and will eventually be entered into the database used for the Nebraska Medical Center s on-line dose calculator if approved by the Nebraska Medical Center s certified health physicist. Figure 3.3 represents the cancer incidence rates of a patient undergoing a 12 mci F-18 tumor localization study according to the age at which the scan occurred. Although ages zero to 10 are included in this study, it is highly unlikely that a pediatric patient would receive a dose of this magnitude. An F-18 FDG dose of 12 mci is reserved for adult patients in the age range of 20 to 80 years. Pediatric ages were included in this figure in order to give the reader an idea of how cancer incidence rates change over the course of a life time. In this figure we can see that the greatest risk of cancer occurs at young ages where a female patient in the age group of 20 years would have a 15 in 10,000 chance in developing some form of solid type cancer over the course of her lifetime. As age increases, the risk of cancer slowly decreases due to an extended latent period for a malignancy to occur. Typically, latent periods can last from 10 to 60 years.
110 94 This figure also shows the increased radiosensitivity that females have versus males. This trend will be seen throughout this study and is verified from previous research on this topic. In Figure 3.4, a similar trend can be seen with a 25 mci dose of Tc-99m Sestamibi, a myocardial imaging agent. According to this data, females again have the highest initial cancer risk exponentially decreasing over the course of a lifetime to become concurrent with males around the age of 65. Again, pediatric patients would never be administered a radiopharmaceutical dose of this magnitude, but an interesting trend can be seen in this figure for males at the age of 1 year old. Here the risk of cancer jumps from 0.25% to almost 0.30%, then follows the exponential decrease as seen in the previous decreasing trend. This spike in risk may be due to the increased number of human cells undergoing the mitotic cell stage of replication. During this point in the cells replication process it is highly sensitive to radiation induced abnormalities which can eventually lead to future cell malignancies later in life. 4.3 Computed Tomography Procedures The CT scanners most readily utilized at the Nebraska Medical Center are the GE Lightspeed Pro 16 and the GE VCT 64 slice. In this discussion section, the effective doses for the most common scans of each scanner at the Nebraska Medical Center are compared with Duke University, RADAR, and xrayrisk.com.
111 95 Although the main purpose of this thesis is to determine the effective doses specific only to the Nebraska Medical Center s current imaging protocol lists, a comparison was made in order to see how results related to a similar medical institutions and other accessible medical dose information currently found in websites such as RADAR and xrayrisk.com. This section will also compare the differences in cancer incidence rates between males and females undergoing some common CT scans with either the GE Lightspeed Pro 16 or the GE VCT 64 slice GE Lightspeed Pro 16 Comparisons In Table 3.10, is a list of the 18 most common CT scans performed on the GE Lightspeed Pro 16 scanner at the Nebraska Medical Center. Included with each scan are calculated effective doses as determined by current protocols run through the IMPACTS version 0.99x dose calculating computer software. Each scan type has an effective dose according to the gender of the patient. The scanning parameters for the GE Lightspeed Pro 16 CT scanner used in determining each scan s effective dose can be found in Appendix A. The results of these scans reveal that there is no variation in dose to the head or upper torso for both genders with effective doses remaining the same. The major variation in gender doses occurs when the scan region includes female breast tissue and reproductive structures. This is evident in the following scans: routine chest, chest/abdomen/pelvis, abdomen/pelvis, kidney mass, dual pancreas, CT colonography, appendicitis, and L-spine helical.
112 96 The differences in effective dose range from 30 mrem for a dual pancreas scan to as much as 800 mrem for an L-spine exam or from 3% to approximately 66% difference from female to male effective doses in the mid to lower torso region. The only instance where the male effective dose exceeded the female effective dose was the pelvis (helical) scan where the male had a 540 mrem greater dose or an 81% increase to 1,200 mrem from 660 mrem. This variation in dose can be explained by the pelvic scan region including the male reproductive structures. When we compare the Nebraska Medical Center s 16 slice data with other institutions, it is important to note that there is no designation between 16 or 64 slice CT scanners with Duke University, RADAR, or xrayrisk.com. These references only give data for a typical scan type and do not designate which type of CT scanner is used. Therefore, their information only gives a general effective dose. The differences in effective doses resulting from the two types of CT scanners can be seen later in this discussion section. In Table 3.10, it is apparent that a majority of the scans at the Nebraska Medical Center yield a higher effective dose than other sources listed. Out of the 18 CT scans listed, only 4 scans from either Duke University or xrayrisk.com had a higher recorded effective dose. The soft tissue neck scan for xrayrisk.com (600 mrem) was three times higher than that of the NMC (190 mrem) and Duke University s routine head (axial) (500 mrem) was more than double that of NMC and the RADAR site. Xrayrisk.com also had higher effective doses for the dual liver and CT colonography at 1,500 and 1,000 mrem, respectively.
113 97 Table 3.10 clearly shows that there is a drastic variation in effective doses being administered to patients which is most likely due to individual scanning parameter protocols. The Nebraska Medical Center clearly has a number of scans with higher effective doses than other institutions. In Figure 3.5, a comparison is drawn between the four most common 16 slice CT procedures to include: routine head (axial), routine chest (helical), chest / abdomen / pelvis (helical), and pelvis (helical). For the routine head (axial) all effective doses from NMC, RADAR, and xrayrisk.com are around 200 mrem, while the Duke University reports an effective dose more than double that exposure at 500 mrem. There are two possible reasons for this outcome. First, the tube current is most likely higher than the other institutions translating in a higher dose and two, the Duke University effective dose maybe the product of a 64 slice CT scanner which yields a higher dose as seen in Table The 16 slice CT procedures for the routine chest (helical) reveal an interesting trend that can be seen in the following two most common CT scans listed in this figure. The Nebraska Medical Center s average effective dose for males and females is higher than all other institutions. This fact is clearly evident in the routine chest (helical) scan which yields an effective dose of 2,000 mrem for women and 1,800 mrem for men. These NMC doses are double that on the RADAR website (930 mrem), four times greater than Duke University (540 mrem), and three times greater than xrayrisk.com s (700 mrem).
114 98 Since the ICRP 60 tissue weighting factors for breast tissue were used in determining the NMC results, it would be presumably lower than the newly released ICRP 103 breast tissue weighting factors. The most likely increase in dose is due to the average tube current setting of 469 mas. The tube voltage and scan region could be two possibilities of an increased dose but, all 16 slice protocols have a constant tube voltage setting of 120 kvp and the scan region is most likely similar to other institutions. Another NMC CT scan recording a higher effective dose than other institutions is the chest/abdomen/pelvis with 2,700 mrem for females and 2,400 mrem for males. The RADAR and xrayrisk.com had reported values for this scan at 1,800 mrem, while Duke reported 1,314 mrem. Once again, this could be primarily due to the average tube current administered during this procedure which was 494 mas. The last 16 slice CT scan examined in this figure was the pelvic (helical) scan. The pelvic scan was the only CT scan where the male effective dose exceeded the female effective dose by approximately 540 mrem. The reason for this increase in effective dose for males is that the pelvic scan region includes a portion of the male reproductive structures meaning a higher tissue weighting factor and therefore a higher effective dose. The pelvic scan did not indicate an extreme variation from other institutions. Duke University had a comparable effective dose of 1,000 mrem which was similar to the NMC males at 1,200 mrem. The women s NMC effective dose of 660 mrem was comparable to both the RADAR and xrayrisk.com s published doses of 620 and 600 mrem, respectively.
115 99 Although the Nebraska Medical Center s scans used ICRP 60 tissue weighting factors to calculate the effective dose, this does not explain the higher effective dose value. The average tube current setting for this scan was approximately 494 mas, with all other parameters held the same GE Lightspeed Pro 16 Incidence Rates of Cancer To get an idea of how the effective dose affected the lifetime attributable risk of cancer, six of the Nebraska Medical Center s individual CT scans incidence rates of cancer were plotted on Figures 3.6 to These scans included routine chest, chest/abdomen/pelvis, cervical spine, thoracic spine, lumbar spine, and CT colonography. The trends represented in these figures correspond with published literature which state that the projected number of incident cancers per 10,000 scans generally decreased with increasing age at exposure(berrington de Gonzalez et al. 2009, ). In all six figures there is a definitive decrease in cancer risk as age is increased. At around the age range of 30 to 80 years of age, incidence rates slowed considerably. The reason for the decrease in cancer risk is most likely due to the slowing of the human body s growth cycle. At these increased ages, cells also have less mitotic cell cycles which tend to be more vulnerable to radiation exposure. There is also less time for cancerous cells to manifest in the age groups from 30 to 80 years, with some latent periods lasting as long as 60 years.
116 100 Current literature also points out that female patient s are at higher risks of developing cancer as a result of a CT scan than males due to their additional risk of breast and lung cancer risk coefficients(berrington de Gonzalez et al. 2009, ). This is definitively seen throughout all figures completed for this research. In all cases, females are more radiosensitive than males from ages zero to 30 years of age. In some cases however, the incidence rates of females and males are the same at ages 50 and above in the cervical spine (Figure 3.8), lumbar spine (Figure 3.10), and CT colonography (Figure 3.11). This correlation may be due to the absence of any reproductive structures which are highly radiosensitive and can greatly increase cancer risk. It is important to note on these figures that scanning parameters used in determining these incidence rates of cancer were calculated using adult protocols. Therefore, the reasons for such high cancer incidence rates from ages zero to 15 years are higher than incidence rates of using pediatric scanning protocols. However, there has been some documentation of adult scanning parameters used in pediatric cases. For this reason, this information has been included in cases where a pediatric patient might accidently be administered radiation doses using adult protocols at the Nebraska Medical Center. Pediatric protocols were not used in this study, but maybe utilized in further studies. Although the scanning protocols used in these studies were solely meant for adult patients, an interesting trend was noted on the following CT scans: chest/abdomen/pelvis (Figure 3.7), lumbar spine (Figure 3.10), and CT colonography (Figure 3.11).
117 101 In these figures, there is a considerable spike in LAR at the age of 10 years for females only. For the chest/abdomen/pelvis scan, the rate jumps from 0.75% at age 5 to 0.92% at age 10 then declines to 0.45% for age 15. In the lumbar spine scan the risk increases dramatically from 0.22% at age 5 to 0.50% at age 10, then decreases drastically back to 0.13% at age 15. And for the CT colonography CT scan the risk increases from 0.1% at age 5 to 0.19% at age 10 then decreases to 0.05% at age 15. The only conclusion that can be determined of this skew in data is the highly radiosensitive reproductive structures of females that are in a pubescent stage have a greater vulnerability to radiation than at any other stage in their lifetime. Cells in the female body during this period of life are experiencing numerous mitotic cell cycles and therefore have the greatest influence from ionizing radiation and a greater chance of becoming malignant in the future. This maybe a topic of interest in future CT studies calculated with the newly released ICRP 103 tissue weighting factors and how they relate to the BEIR VII data GE VCT 64 slice Comparisons In Table 3.11, 21 of the most common CT procedures performed on the GE VCT 64 slice CT scanner at the Nebraska Medical Center were listed with their pertinent effective doses according to the gender of the patient. Trends found on the 64 slice data reflect those consistent with previous data on the 16 slice CT scanner.
118 102 Of the 21 listed scans, female effective doses were higher on 10 scans which involved scan regions of the chest (breast) and female reproductive structures. The only two scans where the male s effective doses exceeded the females were the chest/abdomen/pelvis (helical) and the PET whole body. In contrast to the 16 slice data, the male 64 slice pelvis scan (2,200 mrem) was less than the females (2,900 mrem). Overall, the gender s effective dose trends are consistent with published literature as well as that found for the NMC 16 slice CT data. In comparison with the Nebraska Medical Center s 64 slice effective doses with other institutions, the trend was similar to our findings with the 16 slice data. Of the 21 CT scans listed, only 3 scans (soft tissue neck, dual phase liver, and dual pancreas) from either RADAR or orayrisk.com had higher effective doses. Once again, it is important to note that the published effective doses from RADAR, Duke University, or xrayrisk.com do not indicate whether their doses are derived from a CT scanner with 16 slice or 64 slice capabilities. Therefore, the same doses used to compare the 16 slice CT data were also used to compare the 64 slice data from the Nebraska Medical Center to other institutions. In Figure 3.12, five of the most common 64 slice CT procedures (routine head (axial), routine chest (helical), chest/abdomen/pelvis (helical), pelvis (helical), and PET whole body) were compared between the NMC, RADAR, Duke University, and xrayrisk.com. For the routine head (axial) there is a consistent dose of approximately 500 mrem for the two medical institutions NMC and Duke, while RADAR and xrayrisk.com have less than half that value at 200 mrem.
119 103 For the next four scans included in Figure 3.12, there is a consistent trend which indicates that the NMC effective doses exceed those reported from other institutions. The NMC routine chest had an average effective dose of ~2,100 mrem compared to RADAR (930 mrem), Duke (540 mrem), and xrayrisk.com (700 mrem). Upon review of the NMC routine chest protocol it was found that the pitch was lowered to from and the average tube current was around 515 mas, both variables would increase the radiation dose. However, it is important to note that the average tube current used in calculating this dose was not the tube current which was used for the duration of the scan. On these General Electric (GE) CT scanners there are automatic exposure controls (AEC) installed which adjust the tube current setting throughout the scan in order to achieve an optimal scan without exposing the patient to excessive radiation. The AEC raises and lowers tube current throughout the scan varying on the density of the scanning region of the patient. During a scan, the tube current can range any where from 100 mas to 700 mas, so our best estimate for radiation doses is by using the average tube current used for the duration of the scan. For the NMC chest/abdomen/pelvis (helical) there was an average dose of approximately 2,800 mrem to the 1,800 mrem reported for both RADAR and xrayrisk.com. We estimated that the female effective dose for the female would be higher than that of the males due to the radiosensitive scan regions of the chest and female reproductive organs, but the male surpassed the female with a dose 200 mrem greater with 2,900 mrem.
120 104 Perhaps the largest variation in radiation dose occurred for the 64 slice pelvis scan. For this scan, the Nebraska Medical Center protocols yielded a dose of 2,200 mrem for the male and 2,900 mrem for the female, while Duke recorded 1,000 mrem. Again, it is important to note that this dose estimate only takes into account the average tube current over the course of a scan, as well as, the uncertainty of what type of CT scanner / protocols other institutions are using in determining their radiation exposures. The last comparison on Figure 3.12 is the whole body PET scan. Only the Nebraska Medical Center and Duke University had reported doses for this scan. The Nebraska Medical Center reported an average dose of 1,450 mrem, while Duke had an exposure of 864 mrem. Due to the current popularity of the whole body PET scan it was surprising to note that RADAR did have any information regarding this scan. Whole body PET scans typically have a lower tube current setting around 200 mas resulting in a lower overall dose. However, the scan region encompasses a larger portion of the human body keeping the effective dose higher GE VCT 64 slice Incidence Rates of Cancer Five CT scans were chosen from the list of 64 slice protocols from the Nebraska Medical Center to see how effective doses related to age and gender of cancer incidence rates. These five scans included the cervical spine, routine chest, chest/abdomen/pelvis, neck/chest/abdomen/pelvis, and whole body PET scan found on Figures 3.13 to 3.17.
121 105 All five figures indicate a trend similar to published information as well as 16 slice data previously discussed in this section. The LAR of cancer per 10,000 scans again decreased with increasing age at exposure. At age ranges from 30 to 80 years, incidence rates slowed considerably and were nearly identical for both males and females. The 64 slice data also indicates that female patients are at higher risks of developing cancer as a result of undergoing a CT scan than males due to their additional risk of breast and lung cancer risk coefficients. This is most evident from ages 0 to 30 years of age for females. Once the age of the patient reaches the age of 40 and above, their risks of cancer are almost identical between the two genders. It is again important to note that the LAR of cancer calculated using 64 slice scanning parameters, as with the 16 slice scanning parameters, were adult parameters. Therefore, the reasons for such high incidence rates from ages zero to 15 years are higher than scanning protocols typically used for pediatric patients. There has been some documentation of adult scanning parameters being used in pediatric cases. For this reason, this 64 slice information has been included in cases where a pediatric patient might be accidently administered radiation doses using adult protocols at the Nebraska Medical Center. Pediatric protocols were not used in this study, but maybe utilized in further studies.
122 106 Although the scanning protocols used in these studies were solely meant for adult patients, an interesting trend was again noted for the following 64 slice CT scans: chest/abdomen/pelvis (Figure 3.15) and the neck/chest/abdomen/pelvis (Figure 3.16). In these figures, there is a considerable spike in cancer risk at the age of 10 years for females only. The only conclusion that can be determined from this continued skew in data is that the highly radiosensitive reproductive structures of females are in a pubescent stage. Cells in the female body during this period of life are experiencing numerous mitotic cell cycles, therefore have the greatest influence from ionizing radiation and a greater chance of becoming malignant in the future. In Figure 3.14, the 64 slice routine chest CT revealed a slight increase in 10 year old female s cancer risk, but did not have a spike like previous scans which included the female reproductive structures. Therefore, we can conclude that scanning regions which encompass the female reproductive structures at a pubescent age will yield the highest cancer risk than any other times in a female s lifetime Incidence Rates of Cancer, 16 Slice CT scans vs. 64 Slice CT Scans For a comparison of the LAR of cancer between the two different CT scanners the following CT scans were investigated: routine chest, cervical spine, and chest/abdomen/pelvis. The routine chest 64 slice scanner had roughly a 0.1% higher cancer risk than the 16 slice for males from ages 0 to 30, but had the identical rates from ages 30 to 80. The female routine chest had approximately the same rate for females from ages zero to 80 for both 16 and 64 slice CT scans.
123 107 The cervical spine scan yielded a different result with the 64 slice CT scan having a cancer risk for females that was approximately twice as high as the 16 slice CT from ages 0 to 30. Once the age of females reached the age of 40 and over, there was an identical cancer risk to males of the same ages. For the same scan done for males the result was similar to the females from ages 0 to 30. There was a LAR of cancer that was twice as high in the 64 slice CT then there were for the 16 slice CT for the same cervical spine scan. Once the male reached the age of 40 and above, there were identical incidence rates of cancer between the 64 and 16 slice CT cervical scans. The variation in dose is most likely due to the lower pitch setting of the 64 slice scanner at 0.531, while the 16 slice had a pitch of The 64 slice scanner also had a higher tube current at 481 mas to the 16 slice s tube current setting of 324 mas. Both of these factors would greatly affect the dose administered to the patient, therefore correlating to their resulting cancer risk. The next LAR of cancer to compare between the 64 and 16 slice CT scanners is the chest/abdomen/pelvis. Interestingly enough, these two CT scanners yielded the same cancer risk throughout ages 0 to 80. A review of the scanning protocols revealed that these two scanners had very similar settings. For example, the average tube current for the 64 slice scanner was 457 mas, while the 16 slice scanner had an average tube current setting of 494 mas. Both scanners had identical scan regions, pitch, and rotations per second. Although both scanners revealed the same cancer risk they did not have the same effective dose. The 16 slice CT administered an average effective dose of 2,550 mrem and the 64 slice CT administered an average effective dose of 2,800 mrem.
124 108 Chapter 5 Conclusion 5.1 Conventional X-ray In reviewing the differences in x-ray procedures completed at the Nebraska Medical Center between ICRP reports 60 and 103 we determined that there is a difference between the two sources of tissue weighting factors. It is evident that the ICRP 103 weighting factors are more heavily weighted for female breast tissue, but the results showed that there was only a slight increase in dose from mrem. The ICRP 103 report also had a reduced weighting factor for reproductive structures. Again, this was evident in the pelvic and lumbar spine scans where the differences resulted in a 41% decrease in effective dose for the pelvic scan and a 20% decrease for the lumbar scan. All other organs and tissues did not show any variation in dose between the two reports such as the skull or cervical spine areas. It was determined by radiation safety personnel at the Nebraska Medical Center that the ICRP 103 tissue weighting factors will be used in the final dose calculator due to its updated radiation dose information. To conclude our results regarding x-ray effective dose outcomes from different institutions we found there to be variations between the Nebraska Medical Center, Duke University, and xrayrisk.com with no definitive institution having a higher rate of radiation dose than another.
125 109 In Figure 3.1, four major x-ray scans were compared and showed that Duke University had the highest effective doses for the pelvis and skull areas, but the Nebraska Medical Center had the highest dose for the abdomen. All institutions had similar chest x-ray doses. The true determinant of effective dose is determined based on each institutions individual protocol and technique settings. Because the Nebraska Medical Center is constructing a dose calculator specifically designed according to its protocols, only the generated effective doses from the STUK program using these NMC input variables and ICRP 103 tissue weighting factors will be used to generate a patients true effective dose. As more information on x-ray effective dose calculations becomes available either through updated tissue weighting factors or scanning protocols, the Nebraska Medical Center will adapt its dose calculator to correspond with pertinent changes in x-ray exposures. 5.2 Nuclear Medicine There were two individual effective dose calculation methods used in determining our results from the Nebraska Medical Center protocols. The basis for using two methods to determine effective doses was to compare effective doses between a source called RADAR which is an organization specializing in up to date and reliable information on internal dose estimates and a new user friendly internal dose calculator called Orgdose, which will be used to determine both effective dose and cancer incidence rates. From our results, it was apparent that there was a discrepancy between the two dose calculating methods. Each program calculated a particular radiopharmaceutical in different way.
126 110 For example, when we calculated the effective doses for scans which incorporated Tc-99m sulfur colloid, the RADAR estimates were anywhere from 15 to 98 mrem higher than Orgdose. On the contrary, nuclear medicine scans which incorporated Tc-99m pertechnetate were 91 to 270 mrem higher when using the Orgdose program versus the RADAR / RIDIC dose estimates. The most drastic difference between the two programs was seen in the scans which incorporated Tc-99m Sestamibi (Cardiolite) and Tl-201 both used in myocardial imaging. Orgdose revealed a dose twice as high for Tc-99m Sestamibi (Cardiolite) and 1,000 mrem higher for the Tl- 201 than the referenced dose estimates provided from RADAR / RIDIC. Because the Nebraska Medical Center is more concerned with arriving at a reliable, accurate effective dose, the RADAR / RIDIC data offered effective dose information for all nuclear medicine studies, where Orgdose was missing effective doses for 22 of the 64 listed nuclear medicine scans. When comparing the Nebraska Medical Center with other effective dose data for nuclear medicine studies (Tables 3.4 and 3.5) we found that there was again no trend where one institution had typically higher or lower effective dose based on the type of scan. There are major factors that need to be determined from these institutions before NMC effective doses can be accurately compared. One important factor is the typical prescribed amount of radiopharmaceutical administered. Effective doses are directly related with the amount of radiopharmaceutical administered to the patient; therefore we cannot accurately gauge an accurate comparison until this information is revealed.
127 111 In conclusion, when determining effective doses for all nuclear medicine studies, it is evident that each nuclear scan must be individually examined for the typical administered radiopharmaceutical dose and the accuracy of the source where the effective dose information was derived. Radiopharmaceutical package inserts offer the best means of determining the effective dose because they contain calculated doses studied during clinical trials for FDA approval. In some cases however, there may be a drastic difference between effective doses found in on-line dose calculators and a package insert. Care should be taken not to base radiation dose estimates on one on-line calculator because there are no reliable sources referenced. The Nebraska Medical Center found that the best means in determining internal doses resulting from nuclear medicine studies is a combination between the radiopharmaceutical insert information and the RADAR website which utilizes the Radiation Internal Dose Information Center (RIDIC) located at the Oak Ridge Institute for Science and Education (ORISE). This organization has over 27 years of experience in determining internal dose estimates gathered from numerous reliable sources from around the world. Each scan will be compared between the radiopharmaceutical insert and the RADAR information to determine the most likely radiation effective dose administered to the patient.
128 CT Procedures After a cross comparison from the Nebraska Medical Center s GE Lightspeed Pro 16 slice CT procedures with other CT exposure references, it is clear that the Nebraska Medical Center s radiation exposures are higher in a majority of the 18 scans provided in Table This trend can also be seen with the GE VCT 64 slice CT scanner where a majority of scans which involve the torso area revealed higher effective doses than other institutions. It is important to note that information provided by Duke University, RADAR, and xrayrisk.com did not indicate the type of multi-detector CT scanners used in their findings. They also did not have information available regarding scanning protocols used in arriving at their reported effective dose values. This is an indicator of how important it is for medical institutions to research all parameters involved with their scanning protocols before arriving at a true effective radiation dose administered to a patient and not to base their information on an on-line calculator. This study is a good example of how estimating radiation doses can be an intricate process which must take into account specific scanning parameters and type of CT scanner used. The Nebraska Medical Center s specific dose information calculated from the IMPACT CT dosimetry program version 0.99x will be added to the on-line dose calculator once all scanning protocols are again reviewed by the diagnostic medical physicist at the Nebraska Medical Center. Currently, we are reviewing the possibility of utilizing a newly released version of the IMPACTS software which now determines tissue weighting factors based on ICRP report 103.
129 Closing Statement With the drastic increase of ionizing medical diagnostic imaging over the past 25 years and its current increasing trend, it is important to effectively communicate radiation dose information in an easily understood method so that patients and physicians are well informed of all risks involved. It is our hope that this specially designed on-line dose calculator for the Nebraska Medical Center will better educate clinicians and researchers when determining radiation exposure to their patients and research subjects and to possibly aide future epidemiological studies on radiation induced from medical diagnostic imaging.
130 114 BIBLIOGRAPHY Radiation from medical tests. putting risk into perspective Mayo Clinic Health Letter (English Ed.) 27 (10) (Oct): 4-5. BEIR VII Committee Health risks from exposures to low levels of ionizing radiation; BEIR VII, phase 2. Washington, D.C.: The National Academies Press. Berrington de Gonzalez, A., M. Mahesh, K. P. Kim, M. Bhargavan, R. Lewis, F. Mettler, and C. Land Projected cancer risks from computed tomographic scans performed in the united states in Archives of Internal Medicine 169 (22) (Dec 14): CDE, Inc D. S. CDE, inc. dosimetry services [cited 08/ ]. Available from Gollnick, D. A Basic radiation protection technology. 4th ed. United States of America: Pacific Radiation Corporation. Hall, E. J Is there a place for quantitative risk assessment? Journal of Radiological Protection : Official Journal of the Society for Radiological Protection 29 (2A) (Jun): A Hall, E. J., and A. J. Giaccia Radiobiology for the radiologist, sixth edition. Philadelphia, PA: Lippincott Williams & Wilkins. ICRP (International Commission on Radiological Protection) ICRP publication 60: 1990 recommendations of the ICRP. Oxford, UK: Pergamon: Elsevier Science. McCusker, M. W., C. de Blacam, M. Keogan, R. McDermott, and P. Beddy Survey of medical students and junior house doctors on the effects of medical radiation: Is medical education deficient? Irish Journal of Medical Science (Oct 10). McNitt-Gray, M. F AAPM/RSNA physics tutorial for residents: Topics in CT. radiation dose in CT. Radiographics : A Review Publication of the Radiological Society of North America, Inc 22 (6) (Nov-Dec): Mettler, F. A., and M. J. Guiberteau Essentials of nuclear medicine imaging, fifth edition. fifth ed. Philadelphia, PA: Saunders Elsevier. National Council on Radiation Protection and Measurements NCRP report no. 160: Ionizing radiation of the population of the united states. Vol. 160.
131 115 BIBLIOGRAPHY CONTINUED National Institute of Health. New diagnostic imaging devices at the NIH clinical center to automatically record radiation exposure. [cited June 10, 2010 Available from Preston, R. J Update on linear non-threshold dose-response model and implications for diagnostic radiology procedures. Health Physics 95 (5) (Nov): Sorenson, J., and M. Phelps Physics in nuclear medicine, 2nd edition. 2nd ed. United States of America: W.B. Suanders Company. Soye, J. A., and A. Paterson A survey of awareness of radiation dose among health professionals in northern ireland. The British Journal of Radiology 81 (969) (Sep): Tapiovaara, M., and T. Siiskonen PCXMC 2.0; A monte carlo program for calculating patient doses in medical x-ray examinations. 2nd ed. Helsinki, Finland: Radiation and Nuclear Safety Authority of Finland.


132 116 APPENDIX A Nebraska Medical Center GE Lightspeed Pro 16 CT Protocols Routine Head Group 1 Group 2 Scan Region: Scan Region: Base of Skull Petrous Ridge Petrous Ridge Top of Skull ma: 300 ma: 300 KV: 140 KV: 120 Collimation: Open 20 cm Collimation: Open 20 cm Mode: 1.0 sec Mode: 1.0 sec Pitch: 1 Pitch: 1 Trauma Head / 1.0 sec scan Group 1 Group 2 Scan Region: Scan Region: Base of Skull Petrous Ridge Petrous Ridge Top of Skull ma: 320 ma: 320 KV: 140 KV: 120 Collimation: Open 20 cm Collimation: Open 20 cm Mode: 1.0 sec Mode: 1.0 sec Pitch: 1 Pitch: 1


133 117 Helical Head Scan Region: Base of Skull Top of Skull ma: SMART MA 440 MAX KV: 120 Collimation: 10 cm Mode: 0.8 sec Pitch: 0.625:1 Circle of Willis Scan Region: Bottom of C1 Mid Vents. ma: 550 KV: 120 Collimation: 20 cm Mode: 0.6 sec Pitch: 0.938:1 Brain Lab Group 1 Group 2 Scan Region: Scan Region: Base of Skull Petrous Ridge Btm of Max teeth Tp of Frontal Sinuses ma: SMART MA = 350 ma: SMART MA = 350 KV: 140 KV: 140 Collimation: Open 20 cm Collimation: Open 20 cm Mode: 1.0 sec Mode: 1.0 sec Pitch: Pitch: 0.562


134 118 Stryker Protocol Dr. Greene Scan Region: Base of Skull Top of Skull ma: AUTO 400 MAX KV: 140 Collimation: 20 cm Mode: 1.0 sec Pitch: 0.562:1 CT Brain Perfusion Scan Region: Basal Ganglia ma: 400 KV: 80 Collimation: 10 cm Mode: 1.0 sec Pitch: 1 IAC (Spine) Scan Region: Base of Skull Top of Petrous Ridge ma: SMART MA 440 KV: 120 Collimation: 20 cm Mode: 0.7 sec Pitch: 0.562
 Scan Region: Base of Skull Top of Petrous Ridge ma: 350")


135 119 IAC (Spine) (AVG. ma Setting) Scan Region: Base of Skull Top of Petrous Ridge ma: 350 KV: 120 Collimation: 20 cm Mode: 0.7 sec Pitch: Facial Bones Scan Region: Mandible Top of Orbit ma: 520 KV: 120 Collimation: 20 cm Mode: 0.5 sec Pitch: Sinus Prone Scan Region: Behind sphenoid Through Frontal Sinus ma: 335 SMART MA KV: 120 Collimation: 20 cm Mode: 0.5 sec Pitch: 0.562


 Scan Region: Inferior Orbital Superior Orbital ma: 350 KV:")
136 120 Sinus Supine Scan Region: Below Maxillary Sinus Above Frontal Sinus ma: 440 SMART MA KV: 120 Collimation: 20 cm Mode: 0.5 sec Pitch: Orbits Scan Region: Inferior Orbital Superior Orbital ma: 440 SMART MA KV: 120 Collimation: 20 cm Mode: 0.5 sec Pitch: Orbits (AVG. ma Setting) Scan Region: Inferior Orbital Superior Orbital ma: 350 KV: 120 Collimation: 20 cm Mode: 0.5 sec Pitch: 0.562

 Scan Region: Base of Skull Mid T1 ma: 324 KV: 120 Collimation:")
137 121 C-Spine, Neuro, and Bone Trauma Scan Region: Base of Skull Mid T1 ma: AUTO MA = 500 MAX KV: 120 Collimation: 20 cm Mode: 1.0 sec Pitch: C-Spine, Neuro, and Bone Trauma (AVG. ma Setting) Scan Region: Base of Skull Mid T1 ma: 324 KV: 120 Collimation: 20 cm Mode: 1.0 sec Pitch: 0.938


138 122 C Spine with Metal Scan Region: Base of Skull Mid T1 ma: AUTO MA = 600 MAX KV: 120 Collimation: 20 cm Mode: 1.0 sec Pitch: Soft Tissue Neck Top of Sella Turcica (Bone behind eye) Top of Sternum ma: AUTO MA = 600 MAX KV: 120 Collimation: 20 cm Mode: 0.6 sec Pitch: 1.375
 Top of Sella Turcica (Bone behind eye) Top of Sternum ma:")

139 123 Soft Tissue Neck (AVG. ma Setting) Top of Sella Turcica (Bone behind eye) Top of Sternum ma: 361 KV: 120 Collimation: 20 cm Mode: 0.6 sec Pitch: Carotid ONLY Scan Region: Aortic Arch Mid Ventricles ma: 600 KV: 120 Collimation: 20 cm Mode: 0.6 sec Pitch: 1.375


140 124 C-Spine Post - Myelogram Scan Region: Base of Skull T1 ma: 600 MAX KV: 120 Collimation: 20 cm Mode: 1.0 sec Pitch: Carotid / Circle of Willis (COW) Scan Region: Aortic Arch Top of Ventricles ma: 650 KV: 120 Collimation: 20 cm Mode: 0.6 sec Pitch: 1.375

141 125 Shoulder Upper Extremity Scan Region: Top of Shoulder Bottom of Scapula ma: 650 KV: 120 Collimation: 20 cm Mode: 0.8 sec Pitch: Routine Chest Scan Region: Lung Apex - Adrenals ma: AUTO 350 KV: 120 Collimation: 20 cm Mode: 0.8 sec Pitch: 1.375

142 126 Routine Chest (Avg. ma Setting) Scan Region: Lung Apex - Adrenals ma: 469 KV: 120 Collimation: 20 cm Mode: 0.8 sec Pitch: Pulmonary Vein Segment Scan Region: Arch Base of Heart ma: 325 KV: 120 Collimation: 20 cm Mode: 0.7 sec Pitch: 0.562
143 CHEST / ABDOMEN / PELVIS Scan Region: Lung Apex - Symphysis ma: AUTO 650 MAX KV: 120 Collimation: 20 cm Mode: 0.7 sec Pitch:

144 128 CHEST / ABDOMEN / PELVIS (Avg. ma Setting) Scan Region: Lung Apex - Symphysis ma: 494 KV: 120 Collimation: 20 cm Mode: 0.7 sec Pitch: Pulmonary Vein Burst BPM Scan Region: Top of Arch Base of Heart ma: ECG AUTO 300 KV: 120 Collimation: 20 cm Mode: 0.4 sec Pitch: 0.24


145 129 Pulmonary Embolus (PE) Scan Region: Lung Apex Base of Lungs ma: AUTO 670 MAX KV: 120 Collimation: 20 cm Mode: 0.5sec Pitch: Dissection or Aneurysm - Chest Scan Region: Lung Apex Below Diaphragm ma: AUTO 300 KV: 120 Collimation: 20 cm Mode: 0.7ec Pitch: 1.375


146 130 HI Resolution Chest (HRCT) 2 Scans (Inspiration & Expiration) Scan Region: Lung Apex Base of Lung ma: 250 KV: 120 Collimation: 20 cm Mode: 0.8ec Pitch: Neck / Chest / Abdomen / Pelvis Group 1 Group 2 Top of Sella Top of Sternum Lung Apex - Symphysis ma: 300 ma: 600 KV: 120 KV: 120 Collimation: 20 cm Collimation: 20 cm Mode: 0.6 sec Mode: 0.6 sec Pitch: Pitch: 1.375

 Scan Region: Mid C7 Mid L1 ma: 325 KV: 120 Collimation: 20 cm")
147 131 Thoracic Spine, Neuro, and Bone Trauma Scan Region: Mid C7 Mid L1 ma: AUTO 600 MAX KV: 120 Collimation: 20 cm Mode: 1.0 sec Pitch: Thoracic Spine, Neuro, and Bone Trauma (Avg. ma Setting) Scan Region: Mid C7 Mid L1 ma: 325 KV: 120 Collimation: 20 cm Mode: 1.0 sec Pitch: 0.562


148 132 Marfans Segment (40-65 BPM) Group 1 Group 2 Scan Region: Scan Region: Top of Arch Base of Heart Base of Heart Bifurcation of Aorta ma: ECG AUTO 300 ma: ECG AUTO 300 KV: 120 KV: 120 Collimation: 20 cm Collimation: 20 cm Mode: 0.4 sec Mode: 0.4 sec Pitch: Pitch: 1.375

149 133 Marfans Segment (66-92 BPM) Group 1 Group 2 Scan Region: Scan Region: Top of Arch Base of Heart Base of Heart Bifurcation of Aorta ma: ECG AUTO 350 ma: ECG AUTO 350 KV: 120 KV: 120 Collimation: 20 cm Collimation: 20 cm Mode: 0.4 sec Mode: 0.4 sec Pitch: 0.26 Pitch: 1.375


150 134 Pulmonary Vein Burst (92+ BPM) Scan Region: Top of Arch Base of Heart ma: AUTO 300 KV: 120 Collimation: 20 cm Mode: 0.4 sec Pitch: 0.26 Chest for Lung Cancer Screening Scan Region: Top of Lung Base of Lung ma: 80 KV: 120 Collimation: 10 cm Mode: 0.80ec Pitch: 1.35


151 135 Smart Score - Gated Scan Region: Top of Heart Base of Heart ma: 400 KV: 120 Collimation: 20 cm Mode: 0.5 sec Pitch: 1.0 T-Spine Post Myelogram Scan Region: Mid C7 Mid L1 ma: AUTO MA 600 MAX KV: 120 Collimation: 20 cm Mode: 1.0 sec Pitch: 0.562
152 Abdomen-Pelvis Scan Region: Diaphragm - Symphysis ma: AUTO MA 670 MAX KV: 120 Collimation: 20 cm Mode: 0.7 sec Pitch:
 Scan Region: Diaphragm - Symphysis ma: 388 KV: 120")
153 Abdomen-Pelvis (Avg. ma Setting) Scan Region: Diaphragm - Symphysis ma: 388 KV: 120 Collimation: 20 cm Mode: 0.7 sec Pitch:

154 138 Trauma CTA Group 1 Group 2 Scan Region: Top of Chest - Symphysis Scan Region: Top of Liver - Symphysis ma: 670 AUTO MA ma: 670 AUTO MA KV: 140 KV: 120 Collimation: 20 cm Collimation: 20 cm Mode: 0.7 sec Mode: 0.7 sec Pitch: Pitch: 1.375

155 Renal Stone Scan Region: Top of Kidney Bottom of Bladder ma: AUTO MA 600 MAX KV: 120 Collimation: 20 cm Mode: 0.6 sec Pitch:

156 Urogram Scan Region: Top of Kidney Bottom of Bladder ma: AUTO MA 650 MAX KV: 120 Collimation: 20 cm Mode: 0.7 sec Pitch:

157 141 Dual Liver Group 1 Group 2 Scan Region: Diaphragm Btm. of Liver Scan Region: Diaphragm Crest of Sym ma: AUTO MA 670 MAX ma: AUTO MA 670 MAX KV: 120 KV: 120 Collimation: 20 cm Collimation: 20 cm Mode: 0.7 sec Mode: 0.7 sec Pitch: Pitch: 1.375

158 Dual Liver cont d Group 3 Scan Region: Diaphragm Bottom of Liver ma: AUTO MA 670 MAX KV: 120 Collimation: 20 cm Mode: 0.7 sec Pitch:

159 143 Kidney Mass Group 1 Group 2 Scan Region: Top Liver Top Kidneys Scan Region: Tp. Kidneys Btm. Kidneys ma: AUTO MA 650 MAX ma: AUTO MA 650 MAX KV: 120 KV: 120 Collimation: 20 cm Collimation: 20 cm Mode: 0.7 sec Mode: 0.7 sec Pitch: Pitch: 1.375

160 144 Kidney Mass Cont d Group 3 Group 4 Scan Region: Tp. Kidneys Btm. Kidneys Scan Region: Btm. Kidneys - Symphysis ma: AUTO MA 650 MAX ma: AUTO MA 650 MAX KV: 120 KV: 120 Collimation: 20 cm Collimation: 20 cm Mode: 0.7 sec Mode: 0.7 sec Pitch: Pitch: 1.375

161 145 Dual Pancreas Group 1 Group 2 Scan Region: Top Liver Btm. Liver Scan Region: Tp. Liver Crest or Symphysis ma: AUTO MA 600 MAX ma: AUTO MA 600 MAX KV: 120 KV: 120 Collimation: 20 cm Collimation: 20 cm Mode: 0.7 sec Mode: 0.7 sec Pitch: Pitch: 1.375

162 Adrenal Mass Scan Region: Top of Liver - Symphysis ma: AUTO MA 600 MAX KV: 120 Collimation: 20 cm Mode: 0.7 sec Pitch:

163 Run Off Scan Region: Diaphragm Through Toes ma: AUTO MA 350 KV: 120 Collimation: 20 cm Mode: 0.7 sec Pitch:

164 148 CT Colonography Series 2 (SUPINE) Series 3 (Prone) Scan Region: Diaphragm - Symphysis Scan Region: Diaphragm - Symphysis ma: 120 ma: 120 KV: 120 KV: 120 Collimation: 20 cm Collimation: 20 cm Mode: 0.5 sec Mode: 0.5 sec Pitch: Pitch: 1.375

165 149 Endograft Study Group 1 Group 2 Scan Region: Top of Liver - Symphysis Scan Region: Top of Graft Btm. Graft ma: AUTO MA 670 MAX ma: AUTO MA 670 MAX KV: 120 KV: 120 Collimation: 20 cm Collimation: 20 cm Mode: 0.7 sec Mode: 0.7 sec Pitch: Pitch: 1.375

166 Appendicitis Series 2 Scan Region: Diaphragm - Symphysis ma: AUTO MA 350 KV: 120 Collimation: 20 cm Mode: 0.5 sec Pitch:
167 L-spine Survey Helical, Bone and Neuro Series 2 Scan Region: Mid T12 S1 ma: AUTO MA 600 MAX KV: 120 Collimation: 20 cm Mode: 1.0 sec Pitch:
 Series 2 Scan Region: Mid T12 S1 ma: 403 KV: 120 Collimation: 20 cm")
168 L-spine Survey Helical, Bone and Neuro (Avg. ma Setting) Series 2 Scan Region: Mid T12 S1 ma: 403 KV: 120 Collimation: 20 cm Mode: 1.0 sec Pitch:

169 L-spine Survey with metal Series 2 Scan Region: Mid T12 S1 ma: 600 KV: 120 Collimation: 20 cm Mode: 1.0 sec Pitch:

170 Pelvis for Fracture Series 2 Scan Region: Top of Crest Lesser Trochanter ma: 650 KV: 120 Collimation: 20 cm Mode: 0.6 sec Pitch:

171 Enterography Series 2 Scan Region: Top of Liver Symphysis ma: Smart MA Auto MA 350 KV: 120 Collimation: 20 cm Mode: 0.7 sec Pitch:
Radiation related cancer risk & benefit/risk assessment for screening procedures
 WHO Workshop on Justification of CT for IHA 15-17 Oct 2014 Radiation related cancer risk & benefit/risk assessment for screening procedures Elke A. Nekolla BfS Federal Office for Radiation Protection Radiation
Dose Estimates for Nuclear Medicine Procedures: What are they? Where do they come from?
 Dose Estimates for Nuclear Medicine Procedures: What are they? Where do they come from? SNM Continuing Education Lecture Salt Lake City, UT -- June 6, 2010 Darrell R. Fisher Pacific Northwest National
Estimating Risk of Low Radiation Doses (from AAPM 2013) María Marteinsdóttir Nordic Trauma,
 María Marteinsdóttir Nordic Trauma,") Estimating Risk of Low Radiation Doses (from AAPM 2013) María Marteinsdóttir Nordic Trauma, 20140521 Stochastic effects Linear No Threshold - LNT-model Uncertain Material produced by William R. Hendee
Estimating Risk of Low Radiation Doses (from AAPM 2013) María Marteinsdóttir Nordic Trauma, 20140521 Stochastic effects Linear No Threshold - LNT-model Uncertain Material produced by William R. Hendee
Radiation Safety for New Medical Physics Graduate Students
 Radiation Safety for New Medical Physics Graduate Students John Vetter, PhD Medical Physics Department UW School of Medicine & Public Health Background and Purpose of This Training This is intended as
RADIATION SAFETY. Junior Radiology Course
 RADIATION SAFETY Junior Radiology Course Expectations for the Junior Radiology Course Medical School wants students to learn basic principles, factual knowledge, safety info, etc. Medical Students want
Radiation exposure of the Yazd population from medical conventional X-ray examinations
 Iran. J. Radiat. Res., 2007; 4 (4): 195-200 Radiation exposure of the Yazd population from medical conventional X-ray examinations F. Bouzarjomehri 1*, M.H. Dashti 2, M.H. Zare 1 1 Department of Medical
created by high-voltage devices Examples include medical and dental x-rays, light, microwaves and nuclear energy
 What is radiation? Radiation is energy emitted from a source, that travels through space and can penetrate matter. Listed below are two types that we are exposed to and contribute to our overall radiation
Recent Progress in Radiation Dosimetry for Epidemiology and Radiological Protection. John Harrison ICRP Committee 2
 Recent Progress in Radiation Dosimetry for Epidemiology and Radiological Protection John Harrison ICRP Committee 2 Joint ICRP-RERF-JHPS Workshop: Tokyo, December 2017 Task Group 79 : Use of Effective Dose
Measurement of organ dose in abdomen-pelvis CT exam as a function of ma, KV and scanner type by Monte Carlo method
 Iran. J. Radiat. Res., 2004; 1(4): 187-194 Measurement of organ dose in abdomen-pelvis CT exam as a function of ma, KV and scanner type by Monte Carlo method M.R. Ay 1, M. Shahriari 2, S. Sarkar 3, P.
CONTENTS NOTE TO THE READER...1 LIST OF PARTICIPANTS...3
 CONTENTS NOTE TO THE READER...1 LIST OF PARTICIPANTS...3 PREAMBLE...9 Background...9 Objective and Scope...9 Selection of Topics for Monographs...10 Data for Monographs...11 The Working Group...11 Working
Ionizing Radiation. Michael J. Vala, CHP. Bristol-Myers Squibb
 Ionizing Radiation Michael J. Vala, CHP Bristol-Myers Squibb michael.vala@bms.com 732-227-5096 2013 American Industrial Hygiene Association, New Jersey Section, Inc. Course Objectives At the end of this
GUIDELINES ON IONISING RADIATION DOSE LIMITS AND ANNUAL LIMITS ON INTAKE OF RADIOACTIVE MATERIAL
 RADIATION PROTECTION AUTHORITY OF ZIMBABWE (RPAZ) RADIATION PROTECTION ACT [CHAPTER 15:15] GUIDELINES ON IONISING RADIATION DOSE LIMITS AND ANNUAL LIMITS ON INTAKE OF RADIOACTIVE MATERIAL Compiled by Radiation
People Exposed to More Radiation from Medical Exams
 People Exposed to More Radiation from Medical Exams With its release of a new report, titled Ionizing Radiation Exposure of the Population of the United States (Report No. 160, 2009), the National Council
Background Radiation in U.S. ~ msv/yr msv/yr ~0.02 ~0.02 msv msv/day /day (~2 m rem/day) mrem/day) NCRP 4
 mrem/day) NCRP 4") Patient Safety Concerns in Diagnostic Radiology? Lawrence T. Dauer, PhD, CHP Assistant Attending Health Physicist Department of Medical Physics RAMPS/GNYCHPS Spring Symposium April 30, 2010 Benefits?
Patient Safety Concerns in Diagnostic Radiology? Lawrence T. Dauer, PhD, CHP Assistant Attending Health Physicist Department of Medical Physics RAMPS/GNYCHPS Spring Symposium April 30, 2010 Benefits?
ALTERNATIVES TO THE EFFECTIVE DOSE FOR STOCHASTIC RISK ASSESSMENT IN MEDICAL IMAGING
 ALTERNATIVES TO THE EFFECTIVE DOSE FOR STOCHASTIC RISK ASSESSMENT IN MEDICAL IMAGING By ANDRES F. ABADIA A THESIS PRESENTED TO THE GRADUATE SCHOOL OF THE UNIVERSITY OF FLORIDA IN PARTIAL FULFILLMENT OF
CT Radiation Risks and Dose Reduction
 CT Radiation Risks and Dose Reduction Walter L. Robinson, M.S. D.A.B.S.N.M., D.A.B.M.P., D.A.B.R. Consultant Certified Medical Radiation Health & Diagnostic Imaging Physicist Medical Radiation and Children
Sources of Data of Stochastic Effects of Radiation. Michael K O Connor, Ph.D. Dept. of Radiology, Mayo Clinic
 Sources of Data of Stochastic Effects of Radiation Michael K O Connor, Ph.D. Dept. of Radiology, Mayo Clinic Biological Effects of Ionizing Radiation (BEIR) 2007 National Academy of Science National Research
ICRP Recommendations Evolution or Revolution? John R Cooper Main Commission
 ICRP Recommendations Evolution or Revolution? John R Cooper Main Commission 3 September 2009 ICRP Recommendations 1. Reasons for new Recommendations 2. Summary of health risks 3. Summary of changes to
Radiation Quantities and Units
 Radiation Quantities and Units כולנו מתעסקים יום יום עם אמצעי דימות שונים החושפים את הנבדק לקרינה מייננת. בשנים האחרונות השימוש ב- CT עולה באופן חד ביותר בבתי החולים ובקהילה. מה אנחנו באמת יודעים לגבי
Estimating Testicular Cancer specific Mortality by Using the Surveillance Epidemiology and End Results Registry
 Appendix E1 Estimating Testicular Cancer specific Mortality by Using the Surveillance Epidemiology and End Results Registry To estimate cancer-specific mortality for 33-year-old men with stage I testicular
Tracking Doses in the Pediatric Population
 Tracking Doses in the Pediatric Population Frederic H. Fahey DSc Boston Children s Hospital Harvard Medical School frederic.fahey@childrens.harvard.edu Disclosures Sadly, none that pay me any money! SNMMI
BEIR VII: Epidemiology and Models for Estimating Cancer Risk
 National Cancer Institute U.S. DEPARTMENT OF HEALTH AND HUMAN SERVICES National Institutes of Health BEIR VII: Epidemiology and Models for Estimating Cancer Risk Ethel S. Gilbert National Cancer Institute
Skyscan 1076 in vivo scanning: X-ray dosimetry
 Skyscan 1076 in vivo scanning: X-ray dosimetry DOSIMETRY OF HIGH RESOLUTION IN VIVO RODENT MICRO-CT IMAGING WITH THE SKYSCAN 1076 An important distinction is drawn between local tissue absorbed dose in
Core Concepts in Radiation Exposure 4/10/2015. Ionizing Radiation, Cancer, and. James Seward, MD MPP
 Ionizing Radiation, Cancer, and Causation James P. Seward, MD MPP FACOEM Clinical Professor of Medicine, UCSF American Occupational Health Conf May 4, 2015 Ionizing Radiation, Cancer, and Causation James
Managing Patient Dose in Computed Tomography (CT) INTERNATIONAL COMMISSION ON RADIOLOGICAL PROTECTION
 INTERNATIONAL COMMISSION ON RADIOLOGICAL PROTECTION") Managing Patient Dose in Computed Tomography (CT) International Commission on Radiological Protection Information abstracted from ICRP Publication 87 Available at www.icrp.org Task Group: M.M. Rehani,
Managing Patient Dose in Computed Tomography (CT) International Commission on Radiological Protection Information abstracted from ICRP Publication 87 Available at www.icrp.org Task Group: M.M. Rehani,
 Page 1 of 5 Patient Safety: Radiation Dose in X-Ray and CT Exams What are x-rays and what do they do? X-rays are forms of radiant energy, like light or radio waves. Unlike light, x-rays can penetrate the
DETERMINATION OF ENTRANCE SKIN DOSE FROM DIAGNOSTIC X-RAY OF HUMAN CHEST AT FEDERAL MEDICAL CENTRE KEFFI, NIGERIA
 DETERMINATION OF ENTRANCE SKIN DOSE FROM DIAGNOSTIC X-RAY OF HUMAN CHEST AT FEDERAL MEDICAL CENTRE KEFFI, NIGERIA Full Length Research Article 1 Ibrahim, U, 3 Daniel, I.H., 3 Ayaninola, O., 4 Ibrahim,
Managing the imaging dose during Image-guided Radiotherapy. Martin J Murphy PhD Department of Radiation Oncology Virginia Commonwealth University
 Managing the imaging dose during Image-guided Radiotherapy Martin J Murphy PhD Department of Radiation Oncology Virginia Commonwealth University Radiographic image guidance has emerged as the new paradigm
JHM-IRB Guidelines for Radiation Statements
 JHM-IRB Guidelines for Radiation Statements When a participant in a research study is subjected to ionizing radiation exposure (other than that which is incidental for the standard medical management of
Managing Patient Dose in Computed Tomography (CT)
") Managing Patient Dose in Computed Tomography (CT) International Commission on Radiological Protection Information abstracted from ICRP Publication 87 Available at www.icrp.org Task Group: M.M. Rehani,
Managing Patient Dose in Computed Tomography (CT) International Commission on Radiological Protection Information abstracted from ICRP Publication 87 Available at www.icrp.org Task Group: M.M. Rehani,
Dosimetric Consideration in Diagnostic Radiology
 Dosimetric Consideration in Diagnostic Radiology Prof. Ng Kwan-Hoong Department of Biomedical Imaging University of Malaya ngkh@um.edu.my Radiation Dosimetry Workshop, 28-29 March 2014 2 Why do we measure
STUDIES OF LOW-DOSE RADIATION AND CANCER. E. Lubin
 STUDIES OF LOW-DOSE RADIATION AND CANCER E. Lubin 1 RELEVANT DATA BEIR VII 2006 UNSCEAR 2000 ICRP PIERCE D. PRESTON DL Japanese survivors. CARDIS E. IARC occupational exposure. BRENNER D. CT exposure and
Where does the estimate of 29,000 cancers come from? Based on Table 12D from BEIR VII, + risk estimates for 56,900,000 patients
 BEIR VII: What It Does and Doesn t Say Michael K O Connor, Ph.D. Dept. of Radiology, Mayo Clinic Using BEIR VII report, estimated radiation-related incident cancers Estimated that 29,000 future cancers
Estimates of Risks LONG-TERM LOW DOSE EFFECTS OF IONIZING RADIATION
 Estimates of Risks LONG-TERM LOW DOSE EFFECTS OF IONIZING RADIATION Low Level Radiation Exposure Single exposure of 10 rad or less Larger exposures delivered over periods of days or longer (low dose
Cancer Risks from CT Scans: Now We Have Data What Next?
 Cancer Risks from CT Scans: Now We Have Data What Next? David J. Brenner, PhD, DSc Center for Radiological Research Columbia University Medical Center djb3@columbia.edu There is no question that CT has
Effects of Long-Term Exposure to Radiation. Tim Marshel R.T. (R)(N)(CT)(MR)(NCT)(PET)(CNMT)
(N)(CT)(MR)(NCT)(PET)(CNMT)") Effects of Long-Term Exposure to Radiation Tim Marshel R.T. (R)(N)(CT)(MR)(NCT)(PET)(CNMT) SNMTS Approved MIIWIIQI: Effects of Long Term Exposure to Radiation 45 Hr PET Registry Review Course Reference
Effects of Long-Term Exposure to Radiation Tim Marshel R.T. (R)(N)(CT)(MR)(NCT)(PET)(CNMT) SNMTS Approved MIIWIIQI: Effects of Long Term Exposure to Radiation 45 Hr PET Registry Review Course Reference
Biological Effects of Ionizing Radiation & Commonly Used Radiation Units
 INAYA MEDICAL COLLEGE (IMC) RAD 232 - LECTURE 2 & 3 Biological Effects of Ionizing Radiation & Commonly Used Radiation Units DR. MOHAMMED MOSTAFA EMAM How does radiation injure people? - High energy radiation
RADIATION RISK ASSESSMENT
 RADIATION RISK ASSESSMENT EXPOSURE and TOXITY ASSESSMENT Osipova Nina, associated professor, PhD in chemistry, Matveenko Irina, Associate professor, PhD in philology TOMSK -2013 The contents 1.What is
3 rd International Symposium on the System of Radiological Protection Seoul, October John Harrison
 3 rd International Symposium on the System of Radiological Protection Seoul, October 2015 John Harrison UK Task Group 79 : Use of Effective Dose as a Risk-related Radiological Protection Quantity John
Radiation Dosimetry for CT Protocols
 Radiation Dosimetry for CT Protocols This document contains radiation dosimetry information from CT scans and can be used by investigators to estimate the dosimetry information required by the JRSC or
The activity. Suggested Answers
 Teacher notes Introduction This activity encourages students to consider the principles of radiation protection and how they might apply in the nuclear industry and in medicine. They discuss and answer
Radiation Exposure 1980 to 2006
 Radiation Exposure 1980 to 2006 Background 3-6 msv/yr Natural (85% 45%) Radon Cosmic Rays Air travel Living at Altitude Man-made (15% 55%) Medical Imaging** mgy Radiation Therapy cgy Radiation Whole Body
Review of the Radiobiological Principles of Radiation Protection
 1 Review of the Radiobiological Principles of Radiation Protection Cari Borrás, D.Sc., FACR, FAAPM Radiological Physics and Health Services Consultant Adjunct Assistant Professor (Radiology) GWU School
X-rays How safe are they?
 X-rays How safe are they? Patient information Thirty years ago, X-rays were the only way to see what was going on inside your body. Now other methods of medical imaging are available, some using different
Biological Effects of Ionizing Radiation & Commonly Used Radiation Units
 INAYA MEDICAL COLLEGE (IMC) RAD 232 - LECTURE 3, 4 & 5 Biological Effects of Ionizing Radiation & Commonly Used Radiation Units DR. MOHAMMED MOSTAFA EMAM How does radiation injure people? - High energy
Radiation Doses in Radiology: Influence of Standards and Regulations
 Radiation Doses in Radiology: Influence of Standards and Regulations Beebe Symposium National Academy of Sciences December 9, 2009 Washington D.C. Orhan H Suleiman MS PhD, FAAPM Senior Science Policy Adviser
Lab & Rad Safety Newsletter
 Ohio UNIVERSITY Fall 2018 Lab & Rad Safety Newsletter Alan Watts Radiation Safety Officer In This Issue: Instruction Concerning Risks From Occupational Radiation Exposure... pg.1-5 = Required = Optional
Austin Radiological Association Nuclear Medicine Procedure PET SODIUM FLUORIDE BONE SCAN (F-18 NaF)
") Austin Radiological Association Nuclear Medicine Procedure PET SODIUM FLUORIDE BONE SCAN (F-18 NaF) Overview Indication Sodium Fluoride F18 injection is a radioactive diagnostic agent for positron emission
Austin Radiological Association Nuclear Medicine Procedure PET SODIUM FLUORIDE BONE SCAN (F-18 NaF) Overview Indication Sodium Fluoride F18 injection is a radioactive diagnostic agent for positron emission
Utilize radiation safety principles to reduce the amount of radiation used to achieve desired clinical result.
 Minimizing Dose Understand the importance and methods of pre-procedure patient assessment including a review of previous radiologic exams, disease processes and anatomical considerations that may increase
Radiation Dose in Pediatric Imaging
 Radiation Dose in Pediatric Imaging A Brief History of Radiology Dose: Why Does It Matter? Measuring Exposure and Dose Deterministic Effects Stochastic Effects Common Exams: What is the Risk? Reducing
Understanding Radiation and Its Effects
 Understanding Radiation and Its Effects Prepared by Brooke Buddemeier, CHP University of California Lawrence Livermore National Laboratory Presented by Jeff Tappen Desert Research Institute 1 Radiation
Cone Beam CT Protocol Optimisation for Prostate Imaging with the Varian Radiotherapy OBI imaging system. Dr Craig Moore & Dr Tim Wood
 Cone Beam CT Protocol Optimisation for Prostate Imaging with the Varian Radiotherapy OBI imaging system Dr Craig Moore & Dr Tim Wood Background With the increasing use of CBCT imaging alongside complex
Radiation Units and Dosimetry 15 August Kalpana M. Kanal, Ph.D., DABR 1
 Introduction Radiation Units and Dosimetry Radiation dose quantities are used as indicators of the risk of biologic damage to patients from x-rays and thus a good knowledge of the different dose parameters
Lecture 14 Exposure to Ionizing Radiation
 Lecture 14 Exposure to Ionizing Radiation Course Director, Conrad Daniel Volz, DrPH, MPH Assistant Professor, Environmental & Occupational Health, University of Pittsburgh, Graduate School of Public Health
Radiation Protection Program Update: The Details. July 2010
 Radiation Protection Program Update: The Details July 2010 Update Topics 2 Changes mandated by Title 10, Code of Federal Regulations, Part 835, Occupational Radiation Protection (10 CFR 835) How changes
Accounting for Imaging Dose
 Accounting for Imaging Dose High Profile Over-exposures Lead to Growing Concern FDA issues warning in October 2009-209 patients exposed to 8 times typical dose for CT brain perfusion scan (3-4 Gy) - Some
Table of Contents. Introduction 3. Background 4
 Training manual Table of Contents Introduction 3 Background 4 What are X-rays? 4 How are X-rays Generated? 5 Primary and Scatter Radiation 6 Interactions with Matter 6 Biological Effects of Radiation 7
Radiation Health Effects
 Radiation Health Effects Elena Buglova Incident and Emergency Centre Department of Nuclear Safety and Security Content Historical background Primary target for cell damage Deterministic effects Stochastic
Austin Radiological Association Ga-68 NETSPOT (Ga-68 dotatate)
") Austin Radiological Association Ga-68 NETSPOT (Ga-68 dotatate) Overview Ga-68 dotatate binds to somatostatin receptors, with highest affinity for subtype 2 receptors (sstr2). It binds to cells that express
Austin Radiological Association Ga-68 NETSPOT (Ga-68 dotatate) Overview Ga-68 dotatate binds to somatostatin receptors, with highest affinity for subtype 2 receptors (sstr2). It binds to cells that express
UQ X-ray Safety Training Module
 UQ X-ray Safety Training Module 23 January 2018, v2 1 UQ X-ray Safety Training Module Course Overview: This training module has been developed for workers at the University of Queensland, and forms part
Why is CT Dose of Interest?
 Why is CT Dose of Interest? CT usage has increased rapidly in the past decade Compared to other medical imaging CT produces a larger radiation dose. There is direct epidemiological evidence for a an increase
Patti Edwards, Senior Radiographer, West Herts Hospitals, UK. February Radiation Safety
 Patti Edwards, Senior Radiographer, West Herts Hospitals, UK. February 2008. Radiation Safety Sub -headings Background Radiation Effects of Radiation Safe Levels Effective Doses ALARA Principle Radiation
Understanding radiation-induced cancer risks at radiological doses
 Understanding radiation-induced cancer risks at radiological doses David J. Brenner Center for Radiological Research Columbia University Medical Center New York, NY djb3@columbia.edu Let s distinguish
Debra Pennington, MD Director of Imaging Dell Children s Medical Center
 Debra Pennington, MD Director of Imaging Dell Children s Medical Center 1 Gray (Gy) is 1 J of radiation energy/ 1 kg matter (physical quantity absorbed dose) Diagnostic imaging doses in mgy (.001 Gy)
Chem 481 Lecture Material 3/11/09
 Chem 481 Lecture Material 3/11/09 Health Physics NRC Dose Limits The NRC has established the following annual dose limits. Organ NRC Limit (mrem/year) Comments Whole Body 5000 (50 msv/yr) Lens of the Eye
ICRP Symposium on the International System of Radiological Protection
 ICRP Symposium on the International System of Radiological Protection October 24-26, 2011 Bethesda, MD, USA M. Balonov, ICRP Committee 2, IRH, Russia P. Shrimpton, HPA, UK To be used just for regulatory
APPENDIX G - Organ/Tissue Weighting Factors and Detriment/Risk Coefficients
 APPENDIX G - Organ/Tissue Weighting Factors and Detriment/Risk Coefficients G.1 Introduction In January 1977, ICRP published ICRP-26. The ICRP established risk factors for different tissues that were based
Introduction and Background
 CT Lung Cancer Screening and the Medical Physicist: Background, Findings and Participant Dosimetry Summary of the National Lung Screening Trial (NLST) Randell Kruger, PhD, DABR Medical Physics Section
Twelfth Annual Warren K. Sinclair Keynote Address
 THE INFLUENCE OF NCRP ON RADIATION PROTECTION IN THE U.S.: REGULATION AND GUIDANCE Twelfth Annual Warren K. Sinclair Keynote Address Kenneth R. Kase Annual Meeting of NCRP 16 March 2015 1 OUTLINE Introduction
Non-target dose from radiotherapy: Magnitude, Evaluation, and Impact. Stephen F. Kry, Ph.D., D.ABR.
 Non-target dose from radiotherapy: Magnitude, Evaluation, and Impact Stephen F. Kry, Ph.D., D.ABR. Goals Compare out-of-field doses from various techniques Methods to reduce out-of-field doses Impact of
Cancer Risk Factors in Ontario. Other Radiation
 Cancer Risk Factors in Ontario Other Radiation OTHer radiation risk factor/ exposure Radon-222 and decay products X-radiation, gamma radiation Cancer The context where high risks were reported Magnitude
The Linear No-Threshold Model (LNT): Made to Be Tested, Made to Be Questioned. Richard C. Miller, PhD Associate Professor The University of Chicago
: Made to Be Tested, Made to Be Questioned. Richard C. Miller, PhD Associate Professor The University of Chicago") The Linear No-Threshold Model (LNT): Made to Be Tested, Made to Be Questioned Richard C. Miller, PhD Associate Professor The University of Chicago Regulatory Organizations NCRP (Nat l Council on Radiation
The Linear No-Threshold Model (LNT): Made to Be Tested, Made to Be Questioned Richard C. Miller, PhD Associate Professor The University of Chicago Regulatory Organizations NCRP (Nat l Council on Radiation
CT Dose Estimation. John M. Boone, Ph.D., FAAPM, FSBI, FACR Professor and Vice Chair of Radiology. University of California Davis Medical Center
 CT Dose Estimation John M. Boone, Ph.D., FAAPM, FSBI, FACR Professor and Vice Chair of Radiology 1 University of California Davis Medical Center CT Dose Estimation Introduction The CTDI Family of Metrics
Radiologic Units: What You Need to Know
 Radiologic Units: What You Need to Know TODD VAN AUKEN M.ED. RT (R)(MR) Agenda Greys, Sieverts, Coulombs per kg, & Becquerel's Conventional Units Other Concepts (LET, Q-Factor, Effective Dose, NCRP Report
Managing Radiation Risk in Pediatric CT Imaging
 Managing Radiation Risk in Pediatric CT Imaging Mahadevappa Mahesh, MS, PhD, FAAPM, FACR, FACMP, FSCCT. Professor of Radiology and Cardiology Johns Hopkins University School of Medicine Chief Physicist
The Management of Imaging Procedure Dose Nuclear Medicine Dose Indices
 The Management of Imaging Procedure Dose Nuclear Medicine Dose Indices Wesley E. Bolch, PhD, PE, DABHP, FHPS, FAAPM Director, Advanced Laboratory for Radiation Dosimetry Studies Department of Biomedical
DRAFT REPORT FOR CONSULTATION: DO NOT REFERENCE. Annals of the ICRP ICRP PUBLICATION 1XX
 1 2 ICRP ref 4811-7254-2307 24 April 2018 3 4 5 6 7 8 9 10 11 12 13 14 15 16 17 18 19 20 21 22 23 24 25 26 27 28 29 30 31 32 33 34 35 36 37 Annals of the ICRP ICRP PUBLICATION 1XX The Use of Effective
Olowookere, C.J. Dept of Physics Ajayi Crowther University, Oyo
 Olowookere, C.J. Dept of Physics Ajayi Crowther University, Oyo RADIATION AND DIAGNOSTIC IMAGING APPLICATIONS diagnosis (clinical) treatment industrial use preservation of food & crops generation of energy
Practice and Risk at Medical Facilities in Agency Operations
 Practice and Risk at Medical Facilities in Agency Operations Igor Gusev Radiation Protection Unit IAEA International Atomic Energy Agency Outline What is medical radiation exposure? Radiation sources and
ICRP = International Commission on. recommendations and guidance on. Functioning since 1928.
 ICRP = International Commission on Radiological Protection; An advisory body providing recommendations and guidance on radiation protection; Functioning since 1928. While the use of ionising radiation
Ionizing Radiation Exposure of the Population of the United States. David A. Schauer Executive Director
 Ionizing Radiation Exposure of the Population of the United States David A. Schauer Executive Director Key Dates in NCRP s s History 1929: U.S. Advisory Committee on X-ray and Radium Protection 1946: U.S.
Saint Louis University Institutional Review Board Ionizing Radiation Risk Informed Consent Template Language
 Saint Louis University Institutional Review Board Ionizing Radiation Risk Informed Consent Template Language Does the study involve research-related exposure to ionizing radiation? That is, will study
Nuclear Radiation Today
 CHAPTER 10 13 SECTION Nuclear Changes Nuclear Radiation Today KEY IDEAS As you read this section, keep these questions in mind: Where are some common sources of radiation? What are some beneficial uses
Nuclear Medicine and PET. D. J. McMahon rev cewood
 Nuclear Medicine and PET D. J. McMahon 150504 rev cewood 2018-02-15 Key Points Nuclear Medicine and PET: Imaging: Understand how Nuc Med & PET differ from Radiography & CT by the source of radiation. Be
Steven Aaron Ross, M.D. Pediatric Radiologist El Paso Imaging Consultants El Paso Children s Hospital
 Steven Aaron Ross, M.D. Pediatric Radiologist El Paso Imaging Consultants El Paso Children s Hospital I will prescribe regimens for the good of my patients according to my ability and my judgment and never
Ernest Rutherford:
 November 1895: Roentgen discovers x rays February 1896: Becquerel discovers radioactivity Ernest Rutherford 1898-99 Ernest Rutherford: 1898-99 The Electromagnetic Spectrum Interaction of Charged Particles
ADVANCES IN RADIATION TECHNOLOGIES IN THE TREATMENT OF CANCER
 ADVANCES IN RADIATION TECHNOLOGIES IN THE TREATMENT OF CANCER Bro. Dr. Collie Miller IARC/WHO Based on trends in the incidence of cancer, the International Agency for Research on Cancer (IARC) and WHO
Radiation Protection- Cath lab
 Radiation Protection- Cath lab Dr. Mawya A Khafaji Associate Prof. Medical Physics, Faculty of Medicine, KAU Head of Medical Physics Unit Dept. of Radiology -KAUH Head, Volunteer Office -KAUH Outline:
Re: PSM of the National Voluntary Consensus Standard for Patient Safety Measures, 2 nd Report
 Re: PSM-044-10 of the National Voluntary Consensus Standard for Patient Safety Measures, 2 nd Report Dear members of the National Quality Forum Board: As Professors of Radiologic Physics (at Mayo Clinic
Laboratory Safety 197/405. Types of Radiation 198/405
 Laboratory Safety 197/405 Types of Radiation 198/405 Particle Radiation Alpha He nucleus (heavy particle) +2 charge Internal hazard only Beta Electron -1 charge Internal and external hazard Neutron 199/405
IOWA RADIOLOGY 1. Guide to CT Scans Clive Downtown Des Moines
 IOWA RADIOLOGY 1 Guide to CT Scans 515-226-9810 Clive Downtown Des Moines Table of Contents IOWA RADIOLOGY 2 What is CT?... 3.Why have a CT scan?... 4 What are the risks of CT scanning?... 5 Ionizing Radiation...
Ionizing Radiation. Alpha Particles CHAPTER 1
 CHAPTER 1 Ionizing Radiation Ionizing radiation is radiation that has sufficient energy to remove electrons from atoms. In this document, it will be referred to simply as radiation. One source of radiation
Radiation Related Second Cancers. Stephen F. Kry, Ph.D., D.ABR.
 Radiation Related Second Cancers Stephen F. Kry, Ph.D., D.ABR. Objectives Radiation is a well known carcinogen Atomic bomb survivors Accidental exposure Occupational exposure Medically exposed Radiotherapy
Assessment of effective dose in paediatric CT examinations
 Assessment of effective dose in paediatric CT examinations E. Dougeni 1,2 CL. Chapple 1, J. Willis 1, G. Panayiotakis 2 1 Regional Medical Physics Department, Freeman Hospital, Freeman Road, Newcastle
Biological Effects of Radiation KJ350.
 Biological Effects of Radiation KJ350 deborah.oughton@nmbu.no 2111 2005 Radiation Biology Interaction of radiation with biological material Doses (Gy, Sv) and effects Scientific Controversy Radiation Protection
Radiation Safety Information for Students in Courses given by the Nuclear Physics Group at KTH, Stockholm, Sweden
 Radiation Safety Information for Students in Courses given by the Nuclear Physics Group at KTH, Stockholm, Sweden September 2006 The aim of this text is to explain some of the basic quantities and units
Dosimetry of recently introduced CBCT Units for Oral and Maxillofacial Radiology
 Dosimetry of recently introduced CBCT Units for Oral and Maxillofacial Radiology John B Ludlow, Laura E Davies-Ludlow, André Mol University of North Carolina, Chapel Hill, NC Background CBCT is seeing
MONTE CARLO SIMULATIONS FOR HOMELAND SECURITY USING ANTHROPOMORPHIC PHANTOMS. A Thesis Presented to The Academic Faculty.
 MONTE CARLO SIMULATIONS FOR HOMELAND SECURITY USING ANTHROPOMORPHIC PHANTOMS A Thesis Presented to The Academic Faculty by Kimberly A Burns In Partial Fulfillment of the Requirements for the Degree Master
CT Radiation Dosimetry Study Using Monte Carlo Simulation and. Computational Anthropomorphic Phantoms
 CT Radiation Dosimetry Study Using Monte Carlo Simulation and Computational Anthropomorphic Phantoms by Yakun Zhang Graduate Program in Medical Physics Duke University Date: Approved: Ehsan Samei, Supervisor
The radiation dose in retrospective
 The radiation dose in retrospective gated tdcoronary computed td tomography (CCT) Saeed AL Ahmari, Ghormallah AL Zahrani, Sumiah AL Helali, Samir AL Dulikan, Abdullah Bafagih, HibaKhashojji Prince Sultan