Nature Biotechnology: doi: /nbt Supplementary Figure 1
|
|
|
- Howard Shepherd
- 6 years ago
- Views:
Transcription

1 Supplementary Figure 1 Overview of the transplant procedure and supplementary data to Figure 1. a. Under isofluorane anesthesia, the lumen of the colon is washed by a gentle PBS enema. b. Using a p200 pipette, 50 μl of organoids are pipetted into the lumen of the colon over 30 seconds. c. Using a p10 pipette, 4 μl of VetBond Tissue Adhesive is placed over the anal canal to seal it. d. Fluorescence endoscopy (top) and gross dissection images in bright field (middle) and GFP fluorescence (bottom) of a colon from an engrafted animal maintained ON Dox for 54 weeks after transplantation. White arrows mark the GFP+ adenoma. e. Kaplan-Meier survival curves of shapc.3374 engrafted mice, maintained ON or OFF Dox, as compared to our previously published shapc.3364 GEMM1. A significant difference (P=.0023) in survival between shapc.3374 GEMMs maintained On Dox (orange) and shapc.3374 Transplants maintained On Dox (blue), was calculated by a Log-Rank (Mantel-Cox) test. f. Schematic depicting the treatment protocol to test Apc restoration in long-lived engrafted shapc colon stem cells (top), and gross dissection images of Apc-restored engrafted mucosa (for corresponding histology see Fig. 1B, bottom row). Scale bars are 5mm.
 that, upon tamoxifen (4- OHT) and Dox administration, developed colon adenomas in a manner consistent with previous results1. b. H&E stain of a TG- Apc.8745e tumor 13.")
2 Supplementary Figure 2 Establishing and credentialing organoids from a newly generated shapc GEMM. a. Schematic depicting a newly developed transgenic mouse harboring a unique Apc shrna (TG-Apc.8745e) that, upon tamoxifen (4- OHT) and Dox administration, developed colon adenomas in a manner consistent with previous results1. b. H&E stain of a TG- Apc.8745e tumor 13.1 weeks post 4-OHT/Dox administration. Scale bar is 200 μm. c. Bright field image of organoids harvested from (TG-Apc.8745e) that are grown in Dox in and the absence of Wnt supplementation. Scale bar is 200 μm. d. Immunofluorescent stains of proliferation (EdU, Red), colonic differentiation (Krt20, Green) and nuclei (Dapi, Blue) of shapc.8745e organoids grown ON Dox (Top, +DOX/Apc OFF ) or 4 days after Dox withdrawal (Bottom, -Dox/Apc On ). Scale bars are 50 μm. e. qrt-pcr analysis of mrna harvested from shapc.8745e organoids grown ON Dox (+Dox) or 4 days after Dox withdrawal (-Dox), for markers of Wnt activation (Myc, Axin2, Fzd7) and colon differentiation (Krt20). Error bars are standard deviation of 3 technical replicates.

3 Supplementary Figure 3 Comparison of APC silenced and APC-restored tumors in the shapc.8745e transplant model. a. H&E and immunofluorescent stains of an shapc.8745e transplant maintained ON DOX for 40 weeks. The left most image is a low magnification image of an axial section of the entire colon, with a black arrow indicating the normal host mucosa, two black arrowheads indicating the borders of the adenoma, and a black box indicating where the higher magnification H&E (next panel) and immunofluorescent images were acquired. b. H&E and immunofluorescent images (Dapi, Ki67, GFP, Krt20) of a transplant that was maintained on dox for 35 days, then taken off dox for 6 weeks, and then pulsed with dox for 2 days to allow for detection of the engraftment by GFP signal. The white box indicates the region of the image presented in high magnifications (bottom) demonstrating normal functioning host (GFP negative) and grafted Apc-restored (GFP positive) mucosa side-by-side in the tissue. Scale bars are 200 μm.
4
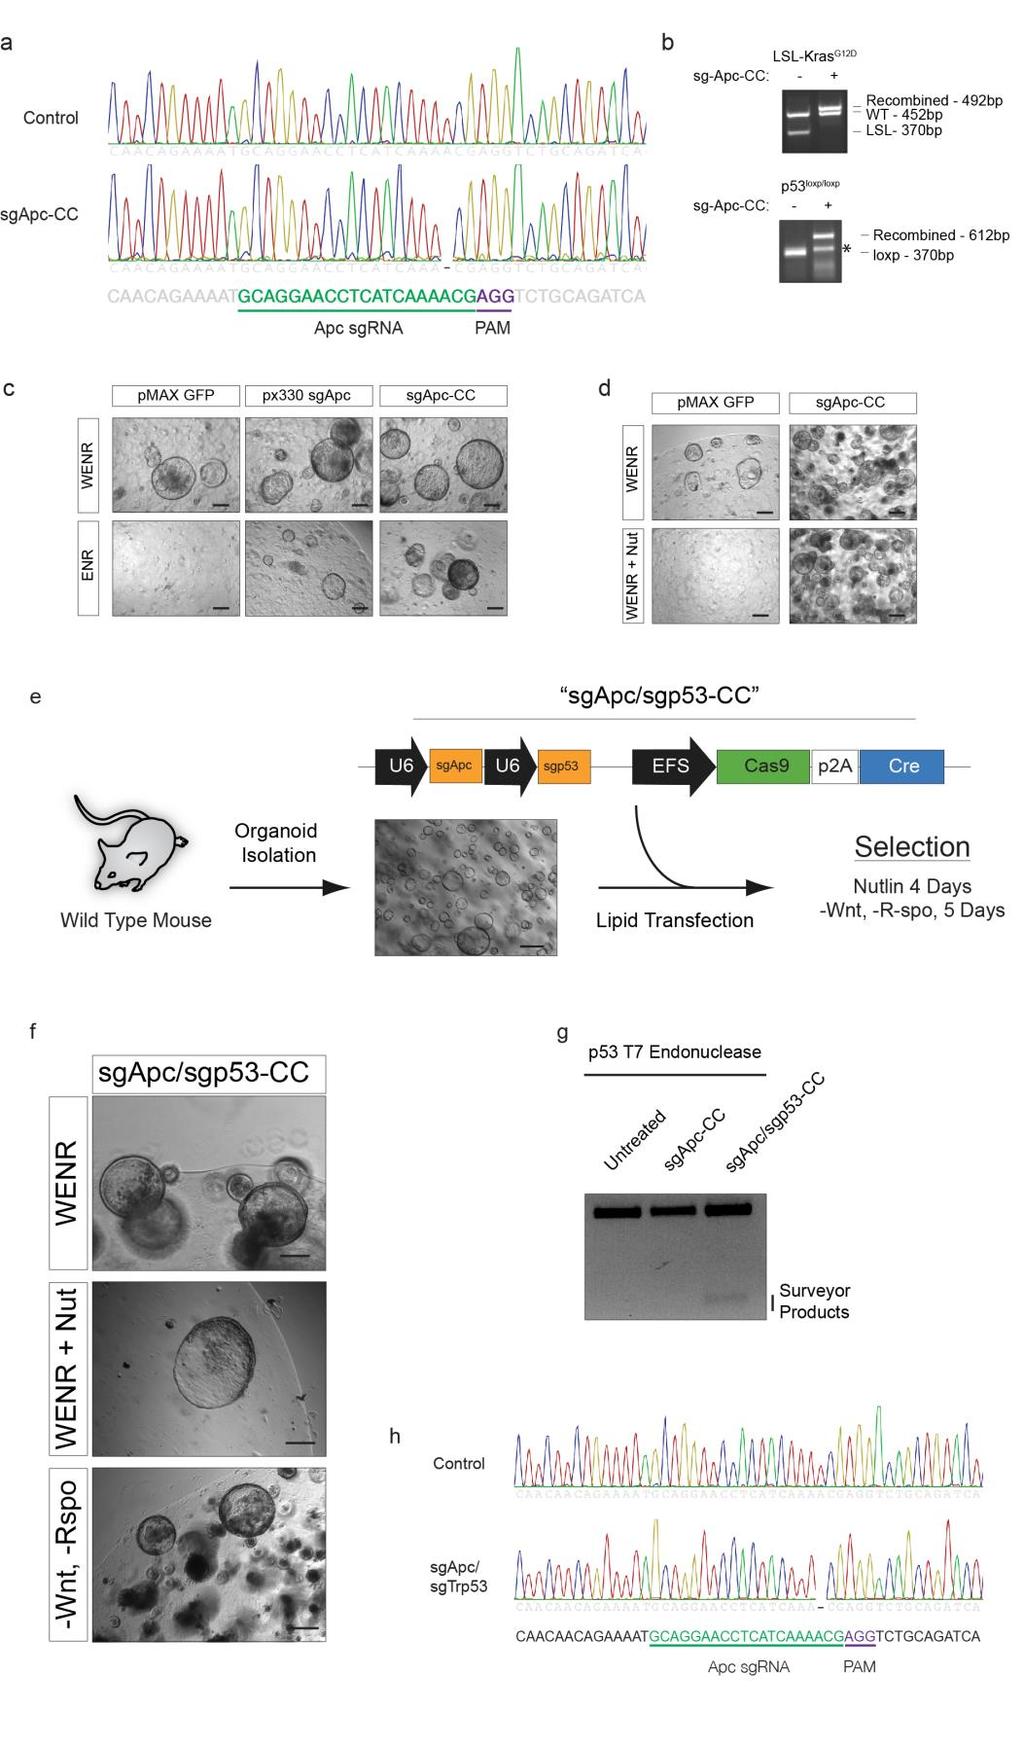
5 Supplementary Figure 4 Ex vivo engineering of murine colon organoids. a. Sanger-sequencing analysis of the Apc locus targeted by the sgapc-cc vector in Control (non-transfected organoids) (top), and transfected organoids (bottom). b. Top, PCR genotyping of the LSL-Kras G12D allele from DNA extracted from non-transfected (Lane 1) organoids and sgapc-cc-transfected (Lane 2). Lane 1 shows the expected unrecombined PCR products for the LSL-KRAS G12D allele (327bp) and the WT allele (452 bp). Lane 2 shows the expected recombined KRAS G12D product (492 bp) and WT product (452 bp). Bottom, PCR genotyping of the p53 loxp/loxp alleles from DNA extracted from non-transfected (Lane 1) and sgapc-cc-transfected (Lane 2) organoids. Lane 1 shows the expected unrecombined PCR product for the p53 loxp/loxp alleles (370bp). Lane 2 shows the expected recombined p53 -/- product (612 bp). A known background band appears around bp, which is indicated by an asterisk. c. Control transfected (pmaxgfp) and sgapc transfected organoids either in the px330 backbone (middle) or Cas9-P2A-Cre CC backbone (right) cultured in complete growth media (Wnt3a, Egf, Noggin, R-spondin, WENR, top) or selected in media lacking Wnt growth factor (ENR, bottom). d. Control transfected (pmaxgfp) or sgapc-cc transfected organoids grown in either complete growth media (WENR, top) or media containing 10 um Nutlin (WENR + Nut, bottom). e Schematic depiction of the protocol used to generate Apc mut / p53 mut organoids via one-step multi-allelic genome editing. f. sgapc/sgp53-cc transfected cells grown in complete growth media ( WENR, top), or selected in complete growth media supplemented with 10 um Nutlin (WENR + Nut, middle), and growth media lacking Wnt or Rspo ( -Wnt, -Rspo, bottom). Scale bars are 200 μm. g. T7 Endonuclease mutation detection of transfected colon organoids showed the expected generation of indels at the p53 locus. h. Sanger-sequencing analysis of the Apc locus targeted by the sgapc/sgp53-cc vector in Control (non-transfected) (top), and transfected cells (bottom).
6 Supplementary Figure 5 Characterization of blood cell populations in DSS treated animals. Schematic illustrating the treatment and collection of mice for immunophenotyping and CBC analysis. Peripheral blood (b) and spleens (c) were collected from mice at sequential time points and analyzed for the presence of each cell surface marker. d. Peripheral blood was collected from mice at the corresponding time point and samples were analyzed using the Hemavet 950FS. WBC: White blood cells, LY: Lymphocytes, NE: Neutrophils, MO: Monocytes, BAE: Basophiles, EO: Eosinophils, RBC: Red blood cells. PLT: platelets. Dot plots are presented with summary statistics that represent the mean value of each cell population as quantified by FACS from five mice (n=5), ± SD. Significance was determined using unpaired two-tailed t-test.
 5 weeks post transplant, and prepared as axial cross-sections for histological examination by H&E")
7 Supplementary Figure 6 Endoscopies and matched histologies of tumors harvested from the immunocompetent CRC model. C57Bl/6 Apc mut /Kras G12D /p53 mut engrafted organoids examined by endoscopy (left) 5 weeks post transplant, and prepared as axial cross-sections for histological examination by H&E staining (7 weeks post-transplant, right). Scale bars are 1 mm throughout.
 of a C57Bl/6 Apc mut /Kras G12D /p53 mut transplant, 16 weeks after infusion of cells. b.")
8 Supplementary Figure 7 Disease staging by MRI, lymphovascular invasion and survival analysis of the immunocompetent CRC model. a. Colon endoscopy (also shown in Fig. 2) of a C57Bl/6 Apc mut /Kras G12D /p53 mut transplant, 16 weeks after infusion of cells. b. MRI of the same tumor at 16 weeks (top) and 20 weeks (bottom) post transplant, displaying progressive tumor invasion into pericolorectal tissue. There is a locally invasive partially circumferential non-obstructing lesion involving the distal colon with tumor penetration through the serosal lining of the colon involving the pericolorectal fat. The animal is oriented Dorsal (D) top, Ventral (V) bottom, and left (L) left, right (R) right. White arrows point to areas of local tumor infiltration through the muscularis propria and serosal lining of the colon. Scale bars are 5 mm. c. Histochemical (H&E) stains imaged at low magnification (top) and high magnification (bottom) of a C57Bl/6 Apc mut /Kras G12D /p53 mut tumor 16.5 weeks post transplant. The white arrow indicates the region depicted in the high magnification image, and the black arrow points to a nest of tumor cells that occupy the lumen of a vessel inside the primary tumor. Scale bars are 200 μm. D. Kaplan-Meier survival curve of transgenic triple mutant animals (from Dow et al. Cell, 2015), labeled, shapc/kras G12D /p53 mut GEMM (blue line), and Foxn1nu/nu animals that received transplants derived from triple transgenic animals, labeled as, shapc/kras G12D /p53 mut Transplants (red line), and C57Bl/6 animals that were engrafted with C57Bl/6 Apc mut /Kras G12D /p53 mut cells (green line). Note that shapc triple mutant transplants are collated data from lines 4-6 of Table 1. The significant difference (p=0.03) in survival is noted between comparable immunocompetent models: triple mutant GEMMs (blue) and triple mutant transplants (green), is shown as calculated by a Log-Rank (Mantel-Cox) test.
9
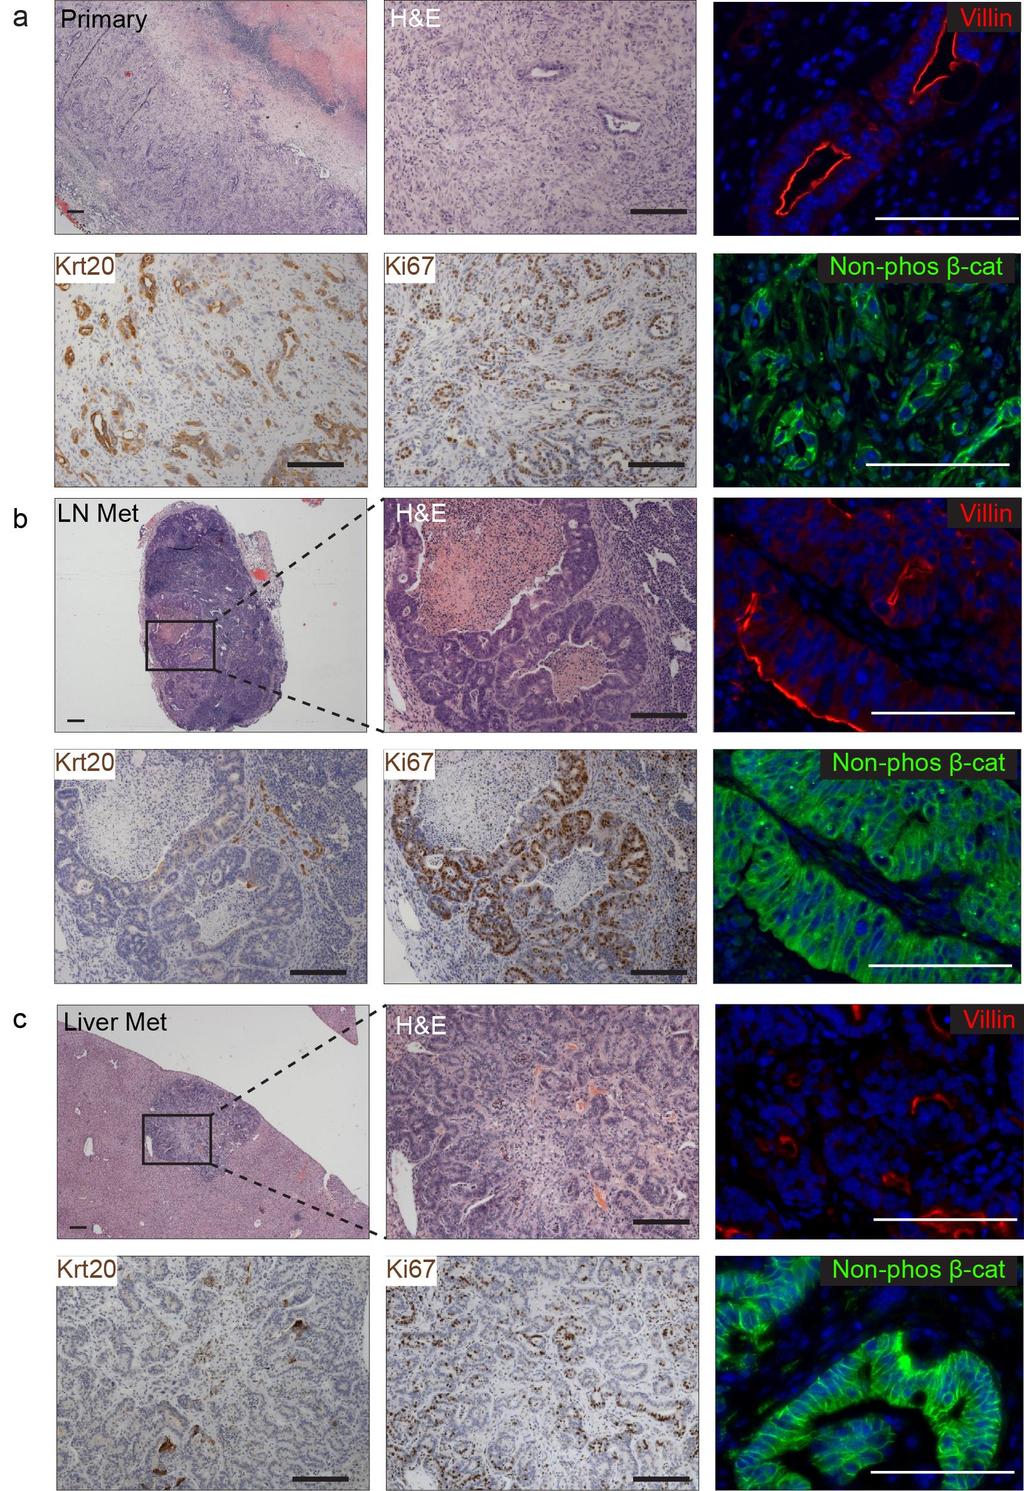
10 Supplementary Figure 8 Identification of primary, regionally disseminated, and metastasized tumors in the immunocompetent mouse model of CRC. Histochemical (H&E), immunohistochemical (Krt20, Ki67), and immunofluorescence (Villin-Red, Non-Phosphorylated Beta-Catenin- Green, Dapi-Blue) stains of a primary tumor engraftment (a), regional dissemination to a lymph node (b), and metastasis to the liver 21.4 weeks post transplant (c).

11 Supplementary Figure 9 Immunofluorescent staining and PCR genotyping confirm liver metastasis originated from the primary orthotopic tumor. A. Immunofluorescent images from a colorectal liver metastasis, stained with the intestine-specific marker, Villin. High magnification images (right) show apical concentration of Villin within glandular epithelium of the metastasis. Red arrows indicate autofluorescent signal from red blood cells and background fluorescence in liver hepatocytes. Note, fluorescent signal in hepatocytes in not localized. B.
12 PCR detection of engineered (Cre-dependent) Kras and p53 loci in wildtype cells, LSL-Kras/p53flox/flox organoids (pre-cre), KrasG12D/p53-/- organoids (post-cre), and genomic DNA from microdissected primary tumor and liver metastasis. Detection of the Cre-recombined Kras and p53 alleles demonstrates that the liver met is derived from organoids engrafted in the colon. Wildtype bands are present at higher frequency in the tumor tissue due to the presence of stromal and immune cells in the dissected tumor.
13 Supplementary Figure 10 Stepwise progression of CRC disease in the orthotopic transplant model. Timing and anatomic staging of CRC disease in the C57Bl6/J mice transplanted with syngeneic C57Bl/6 Apc mut /Kras G12D /p53 mut organoids. Livers of the six mice that were analyzed after 16 weeks were inspected macroscopically for surface metastases, and we performed comprehensive liver sectioning and staining on three of those six animals.
 or 2-D ce")
14 Supplementary Figure 11 Comparison between 2D tissue culture and 3D organoid orthotopic engraftment models. a. Bright field images of triple mutant colon organoids grown in 3-D conditions or as a 2-D cell line. b. Endoscopies of animals transplanted with 3-D organoids (left) or 2-D cell lines (right) at 6 and 5 weeks post transplant, respectively. c. H&E stained sections of tumors harvested from mice transplanted with 3-D triple mutant organoids (top) or 2-D cell lines (bottom). d. Kaplan-Meyer curve illustrating overall survival of animals transplanted with either 3-D organoids (red, n=21, which also appears in Supplementary Fig. 12) or 2-D cell lines (blue, n=19). The significant difference (p<0.0001) in survival is shown as calculated by a Log-Rank (Mantel-Cox) test. e. Disease staging analysis of animals transplanted with either 2-D cell lines or 3-D organoids at early time points (5-7 weeks). f. Copy number analysis of freshly derived triple mutant 3-D organoids or 2-D cell lines.
15
16 Supplementary Figure 12
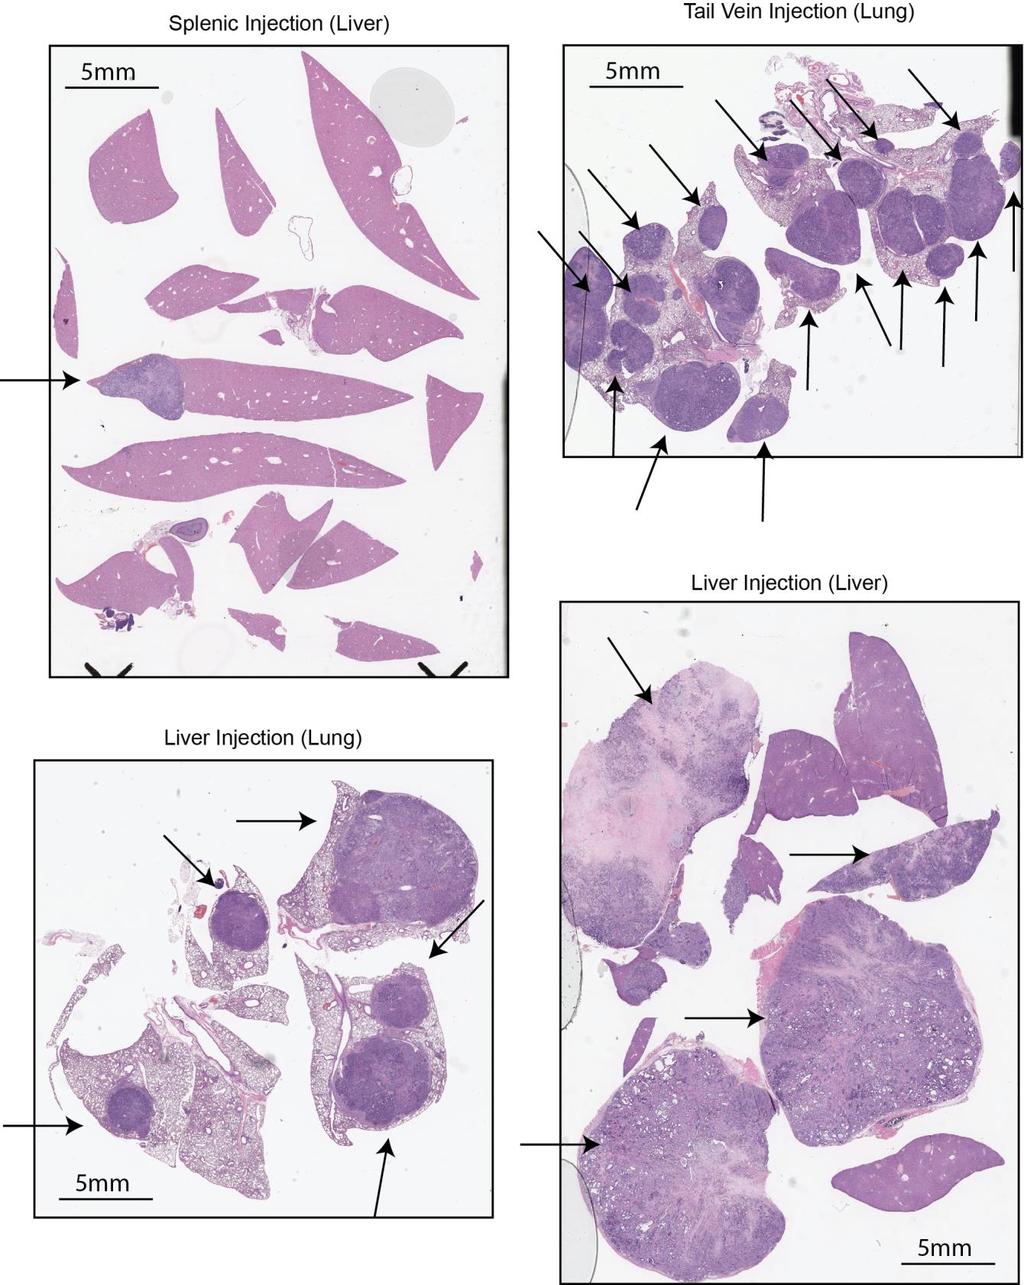
17 Distant metastasis generation by vessel seeding of engineered organoids. Shown are whole slide scans from C57Bl/6 animals injected in the splenic vein (top left), tail vein (top right) or directly into the liver (bottom left and right), with Apc mut /Kras G12D /p53 mut organoids.
18
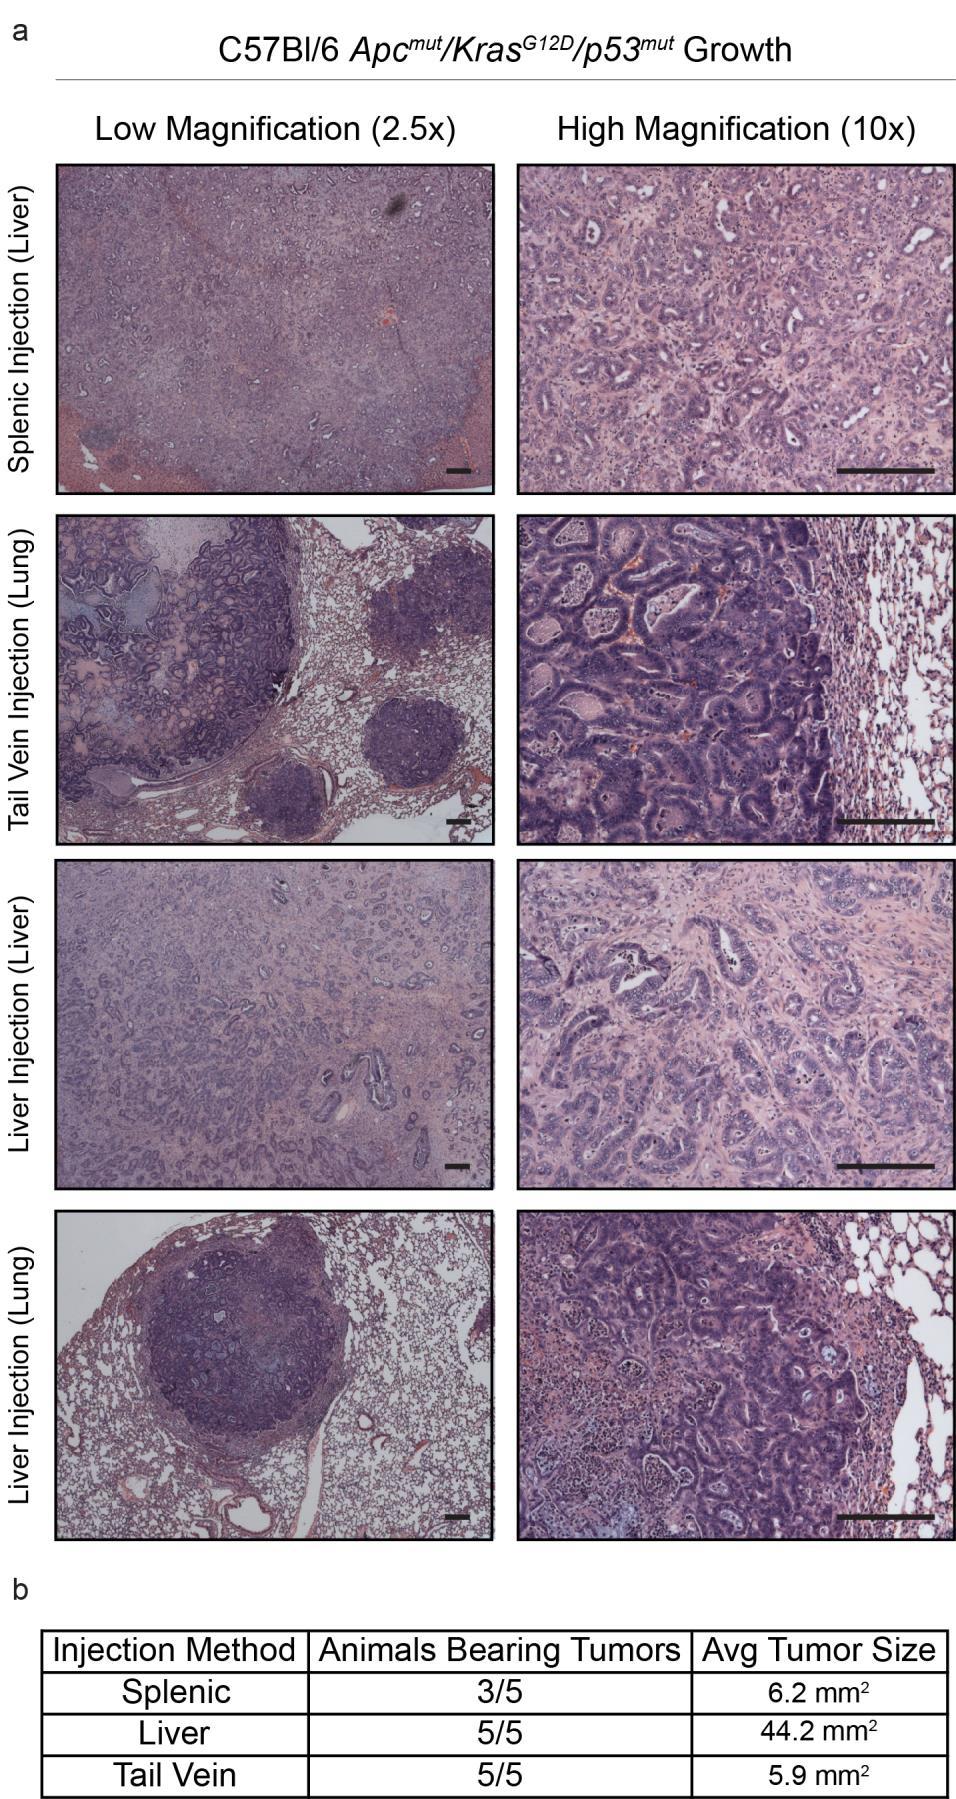
19 Supplementary Figure 13 Histological characterization of tumors arising at distant sites following vessel seeding. a. Low magnification (2.5x) and high magnification (10x) images of H&E stained section from splenic injections (top), tail vein injections (second row), and liver injections (3rd and 4th rows). b. Results from 3 injections performed in 5 animals each. Avg Tumor Size is the average of cross-sectional measurements of histology specimens that are presented as whole slide scans in Supplementary Fig. 13. Scale bars are 200μm throughout.

20 Supplementary Figure 14
21 Evaluation of APC restoration in a metastatic model of CRC by vessel seeding of engineered organoids. a. Schematic representation of the generation and transduction of shapc/kras G12D /p53 mut /MNIL-shSmad4 or MNIL shren organoids. b. Immunoblot of Smad4 protein levels in shren.713 (Control) and shsmad4.591 organoids. c. Bright field images of shren.713 (shcontrol) and shsmad4 organoids grown in ENRWD (Egf, Noggin, R-spondin, Wnt3a, Dox) (left) or supplemented with 10 ng/ml TGF-Beta (ENRWD+T) (right). Scale bars are 200 μm. d. Bioluminescence imaging of animals 4 weeks post splenic injection with shsmad4 cells. e. Quantification of luciferase signal 13 weeks after splenic injection of shapc/kras G12D /p53 R127H /-MNIL-Ren713 organoids (blue) and shapc/kras G12D /p53 R127H /-MNIL-Smad4.591 organoids (red) that were maintained on dox for 3 weeks and then randomized into Dox ON and Dox OFF groups. f. A slide scan of H&E stained shapc/kras G12D /p53 R127H /-MNIL-Smad4.591 tumors that were harvested 10 weeks after splenic injection and maintained on doxycycline. g. Tumor derived organoids were generated from gross liver tumors (left panels), examined by H&E staining, and grown as organoids under the same protocols for wild type colon growth. h. qrtpcr analysis on mrna extracted from organoids maintained ON Dox, or 4 days OFF dox. Samples are uninjected parental shapc/kras G12D /p53 R172H /- /MNIL-Smad4 organoid line, or tumor derived organoids from two different tumors that arose from splenic injections of the parental line.

22 Supplementary Figure 15 Engraftment of human CRC organoids into immunocompromised mice. a. H&E stained section of a patient-derived CRC that was obtained from a primary tumor. b. Serial endoscopies of engrafted human CRC tumors and H&E stains of tumors at 8 weeks post transplant. C. Clinical information related to the patient derived CRC organoid lines that were established and orthotopically engrafted.
SUPPLEMENTARY INFORMATION
 DOI: 10.1038/ncb2607 Figure S1 Elf5 loss promotes EMT in mammary epithelium while Elf5 overexpression inhibits TGFβ induced EMT. (a, c) Different confocal slices through the Z stack image. (b, d) 3D rendering
Supplementary Figure 1.TRIM33 binds β-catenin in the nucleus. a & b, Co-IP of endogenous TRIM33 with β-catenin in HT-29 cells (a) and HEK 293T cells
 and HEK 293T cells") Supplementary Figure 1.TRIM33 binds β-catenin in the nucleus. a & b, Co-IP of endogenous TRIM33 with β-catenin in HT-29 cells (a) and HEK 293T cells (b). TRIM33 was immunoprecipitated, and the amount of
Supplementary Figure 1.TRIM33 binds β-catenin in the nucleus. a & b, Co-IP of endogenous TRIM33 with β-catenin in HT-29 cells (a) and HEK 293T cells (b). TRIM33 was immunoprecipitated, and the amount of
Type of file: PDF Size of file: 0 KB Title of file for HTML: Supplementary Information Description: Supplementary Figures
 Type of file: PDF Size of file: 0 KB Title of file for HTML: Supplementary Information Description: Supplementary Figures Supplementary Figure 1 mir-128-3p is highly expressed in chemoresistant, metastatic
Supplementary Figure 1. Deletion of Smad3 prevents B16F10 melanoma invasion and metastasis in a mouse s.c. tumor model.
 A B16F1 s.c. Lung LN Distant lymph nodes Colon B B16F1 s.c. Supplementary Figure 1. Deletion of Smad3 prevents B16F1 melanoma invasion and metastasis in a mouse s.c. tumor model. Highly invasive growth
Supplemental Figure 1. Intracranial transduction of a modified ptomo lentiviral vector in the mouse
 Supplemental figure legends Supplemental Figure 1. Intracranial transduction of a modified ptomo lentiviral vector in the mouse hippocampus targets GFAP-positive but not NeuN-positive cells. (A) Stereotaxic
a) Primary cultures derived from the pancreas of an 11-week-old Pdx1-Cre; K-MADM-p53
 Primary cultures derived from the pancreas of an 11-week-old Pdx1-Cre; K-MADM-p53") 1 2 3 4 5 6 7 8 9 10 Supplementary Figure 1. Induction of p53 LOH by MADM. a) Primary cultures derived from the pancreas of an 11-week-old Pdx1-Cre; K-MADM-p53 mouse revealed increased p53 KO/KO (green,
1 2 3 4 5 6 7 8 9 10 Supplementary Figure 1. Induction of p53 LOH by MADM. a) Primary cultures derived from the pancreas of an 11-week-old Pdx1-Cre; K-MADM-p53 mouse revealed increased p53 KO/KO (green,
EPIGENETIC RE-EXPRESSION OF HIF-2α SUPPRESSES SOFT TISSUE SARCOMA GROWTH
 EPIGENETIC RE-EXPRESSION OF HIF-2α SUPPRESSES SOFT TISSUE SARCOMA GROWTH Supplementary Figure 1. Supplementary Figure 1. Characterization of KP and KPH2 autochthonous UPS tumors. a) Genotyping of KPH2
Breeding scheme, transgenes, histological analysis and site distribution of SB-mutagenized osteosarcoma.
 Supplementary Figure 1 Breeding scheme, transgenes, histological analysis and site distribution of SB-mutagenized osteosarcoma. (a) Breeding scheme. R26-LSL-SB11 homozygous mice were bred to Trp53 LSL-R270H/+
Supplementary Figure 1. A. Bar graph representing the expression levels of the 19 indicated genes in the microarrays analyses comparing human lung
 Supplementary Figure 1. A. Bar graph representing the expression levels of the 19 indicated genes in the microarrays analyses comparing human lung immortalized broncho-epithelial cells (AALE cells) expressing
Supplemental Table S1
 Supplemental Table S. Tumorigenicity and metastatic potential of 44SQ cell subpopulations a Tumorigenicity b Average tumor volume (mm ) c Lung metastasis d CD high /4 8. 8/ CD low /4 6./ a Mice were injected
Supplementary Figure 1: Hsp60 / IEC mice are embryonically lethal (A) Light microscopic pictures show mouse embryos at developmental stage E12.
 Light microscopic pictures show mouse embryos at developmental stage E12.") Supplementary Figure 1: Hsp60 / IEC mice are embryonically lethal (A) Light microscopic pictures show mouse embryos at developmental stage E12.5 and E13.5 prepared from uteri of dams and subsequently genotyped.
Supplementary Figure 1: Hsp60 / IEC mice are embryonically lethal (A) Light microscopic pictures show mouse embryos at developmental stage E12.5 and E13.5 prepared from uteri of dams and subsequently genotyped.
Supplementary Figures
 Supplementary Figures Supplementary Fig. 1. Galectin-3 is present within tumors. (A) mrna expression levels of Lgals3 (galectin-3) and Lgals8 (galectin-8) in the four classes of cell lines as determined
(A) Cells grown in monolayer were fixed and stained for surfactant protein-c (SPC,
 Cells grown in monolayer were fixed and stained for surfactant protein-c (SPC,") Supplemental Figure Legends Figure S1. Cell line characterization (A) Cells grown in monolayer were fixed and stained for surfactant protein-c (SPC, green) and co-stained with DAPI to visualize the nuclei.
Supplemental Figure Legends Figure S1. Cell line characterization (A) Cells grown in monolayer were fixed and stained for surfactant protein-c (SPC, green) and co-stained with DAPI to visualize the nuclei.
SUPPLEMENTARY INFORMATION
 b 350 300 250 200 150 100 50 0 E0 E10 E50 E0 E10 E50 E0 E10 E50 E0 E10 E50 Number of organoids per well 350 300 250 200 150 100 50 0 R0 R50 R100 R500 1st 2nd 3rd Noggin 100 ng/ml Noggin 10 ng/ml Noggin
Supplementary Figure 1. Genotyping strategies for Mcm3 +/+, Mcm3 +/Lox and Mcm3 +/- mice and luciferase activity in Mcm3 +/Lox mice. A.
 Supplementary Figure 1. Genotyping strategies for Mcm3 +/+, Mcm3 +/Lox and Mcm3 +/- mice and luciferase activity in Mcm3 +/Lox mice. A. Upper part, three-primer PCR strategy at the Mcm3 locus yielding
Supplementary Figures
 Supplementary Figures Supplementary Figure 1 Increased ABHD5 expression in human colon cancer associated macrophages. (a) Murine peritoneal macrophages were treated with regular culture medium (Ctrl) or
Supplementary Figure 1: Expression of NFAT proteins in Nfat2-deleted B cells (a+b) Protein expression of NFAT2 (a) and NFAT1 (b) in isolated splenic
 Protein expression of NFAT2 (a) and NFAT1 (b) in isolated splenic") Supplementary Figure 1: Expression of NFAT proteins in Nfat2-deleted B cells (a+b) Protein expression of NFAT2 (a) and NFAT1 (b) in isolated splenic B cells from WT Nfat2 +/+, TCL1 Nfat2 +/+ and TCL1 Nfat2
Supplementary Figure 1: Expression of NFAT proteins in Nfat2-deleted B cells (a+b) Protein expression of NFAT2 (a) and NFAT1 (b) in isolated splenic B cells from WT Nfat2 +/+, TCL1 Nfat2 +/+ and TCL1 Nfat2
(a) Schematic diagram of the FS mutation of UVRAG in exon 8 containing the highly instable
 Schematic diagram of the FS mutation of UVRAG in exon 8 containing the highly instable") Supplementary Figure 1. Frameshift (FS) mutation in UVRAG. (a) Schematic diagram of the FS mutation of UVRAG in exon 8 containing the highly instable A 10 DNA repeat, generating a premature stop codon
Supplementary Figure 1. Frameshift (FS) mutation in UVRAG. (a) Schematic diagram of the FS mutation of UVRAG in exon 8 containing the highly instable A 10 DNA repeat, generating a premature stop codon
Nature Immunology: doi: /ni Supplementary Figure 1
 Supplementary Figure 1 NLRP12 is downregulated in biopsy samples from patients with active ulcerative colitis (UC). (a-g) NLRP12 expression in 7 UC mrna profiling studies deposited in NCBI GEO database.
AP VP DLP H&E. p-akt DLP
 A B AP VP DLP H&E AP AP VP DLP p-akt wild-type prostate PTEN-null prostate Supplementary Fig. 1. Targeted deletion of PTEN in prostate epithelium resulted in HG-PIN in all three lobes. (A) The anatomy
Supplementary Figure 1. Characterization of NMuMG-ErbB2 and NIC breast cancer cells expressing shrnas targeting LPP. NMuMG-ErbB2 cells (a) and NIC
 and NIC") Supplementary Figure 1. Characterization of NMuMG-ErbB2 and NIC breast cancer cells expressing shrnas targeting LPP. NMuMG-ErbB2 cells (a) and NIC cells (b) were engineered to stably express either a LucA-shRNA
Supplementary Figure 1. Characterization of NMuMG-ErbB2 and NIC breast cancer cells expressing shrnas targeting LPP. NMuMG-ErbB2 cells (a) and NIC cells (b) were engineered to stably express either a LucA-shRNA
Supplementary Materials. for Garmy-Susini, et al, Integrin 4 1 signaling is required for lymphangiogenesis and tumor metastasis
 Supplementary Materials for Garmy-Susini, et al, Integrin 4 1 signaling is required for lymphangiogenesis and tumor metastasis 1 Supplementary Figure Legends Supplementary Figure 1: Integrin expression
Supplementary Figure 1 IMQ-Induced Mouse Model of Psoriasis. IMQ cream was
 Supplementary Figure 1 IMQ-Induced Mouse Model of Psoriasis. IMQ cream was painted on the shaved back skin of CBL/J and BALB/c mice for consecutive days. (a, b) Phenotypic presentation of mouse back skin
(A) RT-PCR for components of the Shh/Gli pathway in normal fetus cell (MRC-5) and a
 RT-PCR for components of the Shh/Gli pathway in normal fetus cell (MRC-5) and a") Supplementary figure legends Supplementary Figure 1. Expression of Shh signaling components in a panel of gastric cancer. (A) RT-PCR for components of the Shh/Gli pathway in normal fetus cell (MRC-5) and
Supplementary figure legends Supplementary Figure 1. Expression of Shh signaling components in a panel of gastric cancer. (A) RT-PCR for components of the Shh/Gli pathway in normal fetus cell (MRC-5) and
mir-7a regulation of Pax6 in neural stem cells controls the spatial origin of forebrain dopaminergic neurons
 Supplemental Material mir-7a regulation of Pax6 in neural stem cells controls the spatial origin of forebrain dopaminergic neurons Antoine de Chevigny, Nathalie Coré, Philipp Follert, Marion Gaudin, Pascal
Supplementary Figure 1: STAT3 suppresses Kras-induced lung tumorigenesis
 Supplementary Figure 1: STAT3 suppresses Kras-induced lung tumorigenesis (a) Immunohistochemical (IHC) analysis of tyrosine 705 phosphorylation status of STAT3 (P- STAT3) in tumors and stroma (all-time
BRaf V600E cooperates with Pten silencing to elicit metastatic melanoma (Nature Genetics Supplementary Information)
") BRaf V600E cooperates with Pten silencing to elicit metastatic melanoma (Nature Genetics Supplementary Information) David Dankort, David P. Curley, Robert A. Cartlidge, Betsy Nelson, Anthony N. Karnezis,
BRaf V600E cooperates with Pten silencing to elicit metastatic melanoma (Nature Genetics Supplementary Information) David Dankort, David P. Curley, Robert A. Cartlidge, Betsy Nelson, Anthony N. Karnezis,
Supplementary Materials for
 www.sciencetranslationalmedicine.org/cgi/content/full/4/117/117ra8/dc1 Supplementary Materials for Notch4 Normalization Reduces Blood Vessel Size in Arteriovenous Malformations Patrick A. Murphy, Tyson
Nature Immunology: doi: /ni Supplementary Figure 1. Huwe1 has high expression in HSCs and is necessary for quiescence.
 Supplementary Figure 1 Huwe1 has high expression in HSCs and is necessary for quiescence. (a) Heat map visualizing expression of genes with a known function in ubiquitin-mediated proteolysis (KEGG: Ubiquitin
Supplemental Figure S1. RANK expression on human lung cancer cells.
 Supplemental Figure S1. RANK expression on human lung cancer cells. (A) Incidence and H-Scores of RANK expression determined from IHC in the indicated primary lung cancer subgroups. The overall expression
Supplemental Material
 Supplemental Material Supplementary Fig. 1. EETs stimulate primary tumor growth. a) Schematic presentation of genetic and pharmacological tools used to manipulate endogenous EET levels. b) Endothelial
(A) SW480, DLD1, RKO and HCT116 cells were treated with DMSO or XAV939 (5 µm)
 SW480, DLD1, RKO and HCT116 cells were treated with DMSO or XAV939 (5 µm)") Supplementary Figure Legends Figure S1. Tankyrase inhibition suppresses cell proliferation in an axin/β-catenin independent manner. (A) SW480, DLD1, RKO and HCT116 cells were treated with DMSO or XAV939
Supplementary Figure Legends Figure S1. Tankyrase inhibition suppresses cell proliferation in an axin/β-catenin independent manner. (A) SW480, DLD1, RKO and HCT116 cells were treated with DMSO or XAV939
Interactions between cancer stem cells and their niche govern metastatic colonization
 Correction Interactions between cancer stem cells and their niche govern metastatic colonization Ilaria Malanchi, Albert Santamaria-Martínez, Evelyn Susanto, Hong Peng, Hans-Anton Lehr, Jean-Francois Delaloye
Supplementary Fig. 1: ATM is phosphorylated in HER2 breast cancer cell lines. (A) ATM is phosphorylated in SKBR3 cells depending on ATM and HER2
 ATM is phosphorylated in SKBR3 cells depending on ATM and HER2") Supplementary Fig. 1: ATM is phosphorylated in HER2 breast cancer cell lines. (A) ATM is phosphorylated in SKBR3 cells depending on ATM and HER2 activity. Upper panel: Representative histograms for FACS
Supplementary Fig. 1: ATM is phosphorylated in HER2 breast cancer cell lines. (A) ATM is phosphorylated in SKBR3 cells depending on ATM and HER2 activity. Upper panel: Representative histograms for FACS
Postn MCM Smad2 fl/fl Postn MCM Smad3 fl/fl Postn MCM Smad2/3 fl/fl. Postn MCM. Tgfbr1/2 fl/fl TAC
 A Smad2 fl/fl Smad3 fl/fl Smad2/3 fl/fl Tgfbr1/2 fl/fl 1. mm B Tcf21 MCM Tcf21 MCM Smad3 fl/fl Tcf21 MCM Smad2/3 fl/fl Tcf21 MCM Tgfbr1/2 fl/fl αmhc MCM C 1. mm 1. mm D Smad2 fl/fl Smad3 fl/fl Smad2/3
Supplementary Figures
 Supplementary Figures Supplementary Figure 1 DOT1L regulates the expression of epithelial and mesenchymal markers. (a) The expression levels and cellular localizations of EMT markers were confirmed by
Figure S1. Generation of inducible PTEN deficient mice and the BMMCs (A) B6.129 Pten loxp/loxp mice were mated with B6.
 B6.129 Pten loxp/loxp mice were mated with B6.") Figure S1. Generation of inducible PTEN deficient mice and the BMMCs (A) B6.129 Pten loxp/loxp mice were mated with B6.129-Gt(ROSA)26Sor tm1(cre/ert2)tyj /J mice. To induce deletion of the Pten locus,
Figure S1. Generation of inducible PTEN deficient mice and the BMMCs (A) B6.129 Pten loxp/loxp mice were mated with B6.129-Gt(ROSA)26Sor tm1(cre/ert2)tyj /J mice. To induce deletion of the Pten locus,
Supporting Information
 Supporting Information Chan et al. 1.173/pnas.9654916 A Patient B Xenograft C * remaining feature of normal lymph node * * * D lymphocytes Infiltrating transitional carcinoma cells E Enlarged axillary
A263 A352 A204. Pan CK. pstat STAT3 pstat3 STAT3 pstat3. Columns Columns 1-6 Positive control. Omentum. Rectosigmoid A195.
 pstat3 75 Pan CK A A263 A352 A24 B Columns 1-6 Positive control A195 A22 A24 A183 Rectal Nodule STAT3 pstat3 STAT3 pstat3 Columns 7-12 Omentum Rectosigmoid Left Ovary Right Ovary Omentum Uterus Uterus
(a) Significant biological processes (upper panel) and disease biomarkers (lower panel)
 Significant biological processes (upper panel) and disease biomarkers (lower panel)") Supplementary Figure 1. Functional enrichment analyses of secretomic proteins. (a) Significant biological processes (upper panel) and disease biomarkers (lower panel) 2 involved by hrab37-mediated secretory
Supplementary Figure 1. Functional enrichment analyses of secretomic proteins. (a) Significant biological processes (upper panel) and disease biomarkers (lower panel) 2 involved by hrab37-mediated secretory
Supplementary Figure 1. Repression of hepcidin expression in the liver of mice treated with
 Supplementary Figure 1. Repression of hepcidin expression in the liver of mice treated with DMN Immunohistochemistry for hepcidin and H&E staining (left). qrt-pcr assays for hepcidin in the liver (right).
SUPPLEMENTARY FIGURE LEGENDS. atypical adenomatous hyperplasias (AAH); Grade II: adenomas; Grade III: adenocarcinomas;
; Grade II: adenomas; Grade III: adenocarcinomas;") SUPPLEMENTARY FIGURE LEGENDS Supplementary Figure S1: Tumor grades in Ras G12D ; p53 / lung tumors. Representative histology (H&E) of K-Ras G12D ; p53 / lung tumors 13 weeks after tumor initiation. Grade
SUPPLEMENTARY FIGURE LEGENDS Supplementary Figure S1: Tumor grades in Ras G12D ; p53 / lung tumors. Representative histology (H&E) of K-Ras G12D ; p53 / lung tumors 13 weeks after tumor initiation. Grade
Supplementary Figures
 Supplementary Figures Supplementary Figure 1 Characterization of stable expression of GlucB and sshbira in the CT26 cell line (a) Live cell imaging of stable CT26 cells expressing green fluorescent protein
T H E J O U R N A L O F C E L L B I O L O G Y
 T H E J O U R N A L O F C E L L B I O L O G Y Supplemental material Krenn et al., http://www.jcb.org/cgi/content/full/jcb.201110013/dc1 Figure S1. Levels of expressed proteins and demonstration that C-terminal
SUPPLEMENTARY INFORMATION
 DOI:.38/ncb3399 a b c d FSP DAPI 5mm mm 5mm 5mm e Correspond to melanoma in-situ Figure a DCT FSP- f MITF mm mm MlanaA melanoma in-situ DCT 5mm FSP- mm mm mm mm mm g melanoma in-situ MITF MlanaA mm mm
(A) PCR primers (arrows) designed to distinguish wild type (P1+P2), targeted (P1+P2) and excised (P1+P3)14-
 PCR primers (arrows) designed to distinguish wild type (P1+P2), targeted (P1+P2) and excised (P1+P3)14-") 1 Supplemental Figure Legends Figure S1. Mammary tumors of ErbB2 KI mice with 14-3-3σ ablation have elevated ErbB2 transcript levels and cell proliferation (A) PCR primers (arrows) designed to distinguish
1 Supplemental Figure Legends Figure S1. Mammary tumors of ErbB2 KI mice with 14-3-3σ ablation have elevated ErbB2 transcript levels and cell proliferation (A) PCR primers (arrows) designed to distinguish
hexahistidine tagged GRP78 devoid of the KDEL motif (GRP78-His) on SDS-PAGE. This
 on SDS-PAGE. This") SUPPLEMENTAL FIGURE LEGEND Fig. S1. Generation and characterization of. (A) Coomassie staining of soluble hexahistidine tagged GRP78 devoid of the KDEL motif (GRP78-His) on SDS-PAGE. This protein was expressed
SUPPLEMENTAL FIGURE LEGEND Fig. S1. Generation and characterization of. (A) Coomassie staining of soluble hexahistidine tagged GRP78 devoid of the KDEL motif (GRP78-His) on SDS-PAGE. This protein was expressed
Expanded View Figures
 Shao-Ming Shen et al Role of I in MT of cancers MO reports xpanded View igures igure V1. nalysis of the expression of I isoforms in cancer cells and their interaction with PTN. RT PR detection of Ish and
SUPPLEMENTARY INFORMATION
 DOI: 1.138/ncb3355 a S1A8 + cells/ total.1.8.6.4.2 b S1A8/?-Actin c % T-cell proliferation 3 25 2 15 1 5 T cells Supplementary Figure 1 Inter-tumoral heterogeneity of MDSC accumulation in mammary tumor
Pearson r = P (one-tailed) = n = 9
 = n = 9") 8F4-Specific Lysis, % 1 UPN1 UPN3 8 UPN7 6 Pearson r =.69 UPN2 UPN5 P (one-tailed) =.192 4 UPN8 n = 9 2 UPN9 UPN4 UPN6 5 1 15 2 25 8 8F4, % Max MFI Supplementary Figure S1. AML samples UPN1-UPN9 show variable
8F4-Specific Lysis, % 1 UPN1 UPN3 8 UPN7 6 Pearson r =.69 UPN2 UPN5 P (one-tailed) =.192 4 UPN8 n = 9 2 UPN9 UPN4 UPN6 5 1 15 2 25 8 8F4, % Max MFI Supplementary Figure S1. AML samples UPN1-UPN9 show variable
Supplementary Figure S1 Expression of mir-181b in EOC (A) Kaplan-Meier
 Kaplan-Meier") Supplementary Figure S1 Expression of mir-181b in EOC (A) Kaplan-Meier curves for progression-free survival (PFS) and overall survival (OS) in a cohort of patients (N=52) with stage III primary ovarian
Supplementary Figure S1 Expression of mir-181b in EOC (A) Kaplan-Meier curves for progression-free survival (PFS) and overall survival (OS) in a cohort of patients (N=52) with stage III primary ovarian
well for 2 h at rt. Each dot represents an individual mouse and bar is the mean ±
 Supplementary data: Control DC Blimp-1 ko DC 8 6 4 2-2 IL-1β p=.5 medium 8 6 4 2 IL-2 Medium p=.16 8 6 4 2 IL-6 medium p=.3 5 4 3 2 1-1 medium IL-1 n.s. 25 2 15 1 5 IL-12(p7) p=.15 5 IFNγ p=.65 4 3 2 1
Supplementary Figure 1. Generation of knockin mice expressing L-selectinN138G. (a) Schematics of the Sellg allele (top), the targeting vector, the
 Schematics of the Sellg allele (top), the targeting vector, the") Supplementary Figure 1. Generation of knockin mice expressing L-selectinN138G. (a) Schematics of the Sellg allele (top), the targeting vector, the targeted allele in ES cells, and the mutant allele in
Supplementary Figure 1. Generation of knockin mice expressing L-selectinN138G. (a) Schematics of the Sellg allele (top), the targeting vector, the targeted allele in ES cells, and the mutant allele in
SUPPLEMENTARY INFORMATION
 doi:1.138/nature1554 a TNF-α + in CD4 + cells [%] 1 GF SPF 6 b IL-1 + in CD4 + cells [%] 5 4 3 2 1 Supplementary Figure 1. Effect of microbiota on cytokine profiles of T cells in GALT. Frequencies of TNF-α
Supporting Information Table of Contents
 Supporting Information Table of Contents Supporting Information Figure 1 Page 2 Supporting Information Figure 2 Page 4 Supporting Information Figure 3 Page 5 Supporting Information Figure 4 Page 6 Supporting
Nature Immunology: doi: /ni eee Supplementary Figure 1
 eee Supplementary Figure 1 Hyphae induce NET release, but yeast do not. (a) NET release by human peripheral neutrophils stimulated with a hgc1 yeast-locked C. albicans mutant (yeast) or pre-formed WT C.
Supplementary Figure 1. EC-specific Deletion of Snail1 Does Not Affect EC Apoptosis. (a,b) Cryo-sections of WT (a) and Snail1 LOF (b) embryos at
 Cryo-sections of WT (a) and Snail1 LOF (b) embryos at") Supplementary Figure 1. EC-specific Deletion of Snail1 Does Not Affect EC Apoptosis. (a,b) Cryo-sections of WT (a) and Snail1 LOF (b) embryos at E10.5 were double-stained for TUNEL (red) and PECAM-1 (green).
Supplementary Figure 1. EC-specific Deletion of Snail1 Does Not Affect EC Apoptosis. (a,b) Cryo-sections of WT (a) and Snail1 LOF (b) embryos at E10.5 were double-stained for TUNEL (red) and PECAM-1 (green).
Suppl Video: Tumor cells (green) and monocytes (white) are seeded on a confluent endothelial
 and monocytes (white) are seeded on a confluent endothelial") Supplementary Information Häuselmann et al. Monocyte induction of E-selectin-mediated endothelial activation releases VE-cadherin junctions to promote tumor cell extravasation in the metastasis cascade
Supplementary Information Häuselmann et al. Monocyte induction of E-selectin-mediated endothelial activation releases VE-cadherin junctions to promote tumor cell extravasation in the metastasis cascade
Supplementary Information
 Supplementary Information mediates STAT3 activation at retromer-positive structures to promote colitis and colitis-associated carcinogenesis Zhang et al. a b d e g h Rel. Luc. Act. Rel. mrna Rel. mrna
Supplemental Information. Menin Deficiency Leads to Depressive-like. Behaviors in Mice by Modulating. Astrocyte-Mediated Neuroinflammation
 Neuron, Volume 100 Supplemental Information Menin Deficiency Leads to Depressive-like Behaviors in Mice by Modulating Astrocyte-Mediated Neuroinflammation Lige Leng, Kai Zhuang, Zeyue Liu, Changquan Huang,
Supplementary. presence of the. (c) mrna expression. Error. in naive or
 mrna expression. Error. in naive or") Figure 1. (a) Naive CD4 + T cells were activated in the presence of the indicated cytokines for 3 days. Enpp2 mrna expression was measured by qrt-pcrhr, infected with (b, c) Naive CD4 + T cells were activated
Figure 1. (a) Naive CD4 + T cells were activated in the presence of the indicated cytokines for 3 days. Enpp2 mrna expression was measured by qrt-pcrhr, infected with (b, c) Naive CD4 + T cells were activated
and follicular helper T cells is Egr2-dependent. (a) Diagrammatic representation of the
 Diagrammatic representation of the") Supplementary Figure 1. LAG3 + Treg-mediated regulation of germinal center B cells and follicular helper T cells is Egr2-dependent. (a) Diagrammatic representation of the experimental protocol for the
Supplementary Figure 1. LAG3 + Treg-mediated regulation of germinal center B cells and follicular helper T cells is Egr2-dependent. (a) Diagrammatic representation of the experimental protocol for the
SHREE ET AL, SUPPLEMENTAL MATERIALS. (A) Workflow for tumor cell line derivation and orthotopic implantation.
 Workflow for tumor cell line derivation and orthotopic implantation.") SHREE ET AL, SUPPLEMENTAL MATERIALS SUPPLEMENTAL FIGURE AND TABLE LEGENDS Supplemental Figure 1. Derivation and characterization of TS1-TGL and TS2-TGL PyMT cell lines and development of an orthotopic
SHREE ET AL, SUPPLEMENTAL MATERIALS SUPPLEMENTAL FIGURE AND TABLE LEGENDS Supplemental Figure 1. Derivation and characterization of TS1-TGL and TS2-TGL PyMT cell lines and development of an orthotopic
PREPARED FOR: U.S. Army Medical Research and Materiel Command Fort Detrick, Maryland
 Award Number: W81XWH-13-1-0198 TITLE: The Role of Akt Isoforms in Colorectal Cancer PRINCIPAL INVESTIGATOR: Jatin Roper CONTRACTING ORGANIZATION: Tufts Medical Center Boston, MA 02111 REPORT DATE: July
Supplementary Figure 1: Signaling centers contain few proliferating cells, express p21, and
 Supplementary Figure 1: Signaling centers contain few proliferating cells, express p21, and exclude YAP from the nucleus. (a) Schematic diagram of an E10.5 mouse embryo. (b,c) Sections at B and C in (a)
SUPPLEMENTARY FIGURES AND TABLE
 SUPPLEMENTARY FIGURES AND TABLE Supplementary Figure S1: Characterization of IRE1α mutants. A. U87-LUC cells were transduced with the lentiviral vector containing the GFP sequence (U87-LUC Tet-ON GFP).
Supplemental Figure 1. (A) The localization of Cre DNA recombinase in the testis of Cyp19a1-Cre mice was detected by immunohistchemical analyses
 The localization of Cre DNA recombinase in the testis of Cyp19a1-Cre mice was detected by immunohistchemical analyses") Supplemental Figure 1. (A) The localization of Cre DNA recombinase in the testis of Cyp19a1-Cre mice was detected by immunohistchemical analyses using an anti-cre antibody; testes at 1 week (left panel),
Supplemental Figure 1. (A) The localization of Cre DNA recombinase in the testis of Cyp19a1-Cre mice was detected by immunohistchemical analyses using an anti-cre antibody; testes at 1 week (left panel),
ANGPTL2 increases bone metastasis of breast cancer cells through. Tetsuro Masuda, Motoyoshi Endo, Yutaka Yamamoto, Haruki Odagiri, Tsuyoshi
 Masuda et al. Supplementary information for ANGPTL2 increases bone metastasis of breast cancer cells through enhancing CXCR4 signaling Tetsuro Masuda, Motoyoshi Endo, Yutaka Yamamoto, Haruki Odagiri, Tsuyoshi
Supplemental Information. Myocardial Polyploidization Creates a Barrier. to Heart Regeneration in Zebrafish
 Developmental Cell, Volume 44 Supplemental Information Myocardial Polyploidization Creates a Barrier to Heart Regeneration in Zebrafish Juan Manuel González-Rosa, Michka Sharpe, Dorothy Field, Mark H.
Zhu et al, page 1. Supplementary Figures
 Zhu et al, page 1 Supplementary Figures Supplementary Figure 1: Visual behavior and avoidance behavioral response in EPM trials. (a) Measures of visual behavior that performed the light avoidance behavior
Supplementary Figure S1. Generation of LSL-EZH2 conditional transgenic mice.
 Downstream Col1A locus S P P P EP Genotyping with P1, P2 frt PGKneopA + frt hygro-pa Targeting vector Genotyping with P3, P4 P1 pcag-flpe P2 P3 P4 frt SApA CAG LSL PGKATG frt hygro-pa C. D. E. ormal KRAS
Supplementary Figures for TSC1 controls macrophage polarization to prevent inflammatory disorder by Linnan Zhu et al
 Supplementary Figures for TSC1 controls macrophage polarization to prevent inflammatory disorder by Linnan Zhu et al Suppl. Fig. 1 Tissue DN C Proteins kd TSC1-17 TSC 1 loxp bp -48-285 ctin PEMs Neutrophils
Supplemental Figure 1
 Supplemental Figure 1 A S100A4: SFLGKRTDEAAFQKLMSNLDSNRDNEVDFQEYCVFLSCIAMMCNEFFEGFPDK Overlap: SF G DE KLM LD N D VDFQEY VFL I M N FF G PD S100A2: SFVGEKVDEEGLKKLMGSLDENSDQQVDFQEYAVFLALITVMCNDFFQGCPDR
Nature Medicine: doi: /nm.4322
 1 2 3 4 5 6 7 8 9 10 11 Supplementary Figure 1. Predicted RNA structure of 3 UTR and sequence alignment of deleted nucleotides. (a) Predicted RNA secondary structure of ZIKV 3 UTR. The stem-loop structure
Supplementary Figure 1. HOPX is hypermethylated in NPC. (a) Methylation levels of HOPX in Normal (n = 24) and NPC (n = 24) tissues from the
 Methylation levels of HOPX in Normal (n = 24) and NPC (n = 24) tissues from the") Supplementary Figure 1. HOPX is hypermethylated in NPC. (a) Methylation levels of HOPX in Normal (n = 24) and NPC (n = 24) tissues from the genome-wide methylation microarray data. Mean ± s.d.; Student
Supplementary Figure 1. HOPX is hypermethylated in NPC. (a) Methylation levels of HOPX in Normal (n = 24) and NPC (n = 24) tissues from the genome-wide methylation microarray data. Mean ± s.d.; Student
Supplementary Figure 1. Characterization of basophils after reconstitution of SCID mice
 Supplementary figure legends Supplementary Figure 1. Characterization of after reconstitution of SCID mice with CD4 + CD62L + T cells. (A-C) SCID mice (n = 6 / group) were reconstituted with 2 x 1 6 CD4
Nature Immunology: doi: /ni.3412
 Supplementary Figure 1 Gata1 expression in heamatopoietic stem and progenitor populations. (a) Unsupervised clustering according to 100 top variable genes across single pre-gm cells. The two main cell
B220 CD4 CD8. Figure 1. Confocal Image of Sensitized HLN. Representative image of a sensitized HLN
 B220 CD4 CD8 Natarajan et al., unpublished data Figure 1. Confocal Image of Sensitized HLN. Representative image of a sensitized HLN showing B cell follicles and T cell areas. 20 µm thick. Image of magnification
Bezzi et al., Supplementary Figure 1 *** Nature Medicine: doi: /nm Pten pc-/- ;Zbtb7a pc-/- Pten pc-/- ;Pml pc-/- Pten pc-/- ;Trp53 pc-/-
 Gr-1 Gr-1 Gr-1 Bezzi et al., Supplementary Figure 1 a Gr1-CD11b 3 months Spleen T cells 3 months Spleen B cells 3 months Spleen Macrophages 3 months Spleen 15 4 8 6 c CD11b+/Gr1+ cells [%] 1 5 b T cells
Supplementary Figures
 Supplementary Figures Supplementary Figure 1. Confirmation of Dnmt1 conditional knockout out mice. a, Representative images of sorted stem (Lin - CD49f high CD24 + ), luminal (Lin - CD49f low CD24 + )
TEB. Id4 p63 DAPI Merge. Id4 CK8 DAPI Merge
 a Duct TEB b Id4 p63 DAPI Merge Id4 CK8 DAPI Merge c d e Supplementary Figure 1. Identification of Id4-positive MECs and characterization of the Comma-D model. (a) IHC analysis of ID4 expression in the
p.r623c p.p976l p.d2847fs p.t2671 p.d2847fs p.r2922w p.r2370h p.c1201y p.a868v p.s952* RING_C BP PHD Cbp HAT_KAT11
 ARID2 p.r623c KMT2D p.v650fs p.p976l p.r2922w p.l1212r p.d1400h DNA binding RFX DNA binding Zinc finger KMT2C p.a51s p.d372v p.c1103* p.d2847fs p.t2671 p.d2847fs p.r4586h PHD/ RING DHHC/ PHD PHD FYR N
Figure S1. Reduction in glomerular mir-146a levels correlate with progression to higher albuminuria in diabetic patients.
 Supplementary Materials Supplementary Figures Figure S1. Reduction in glomerular mir-146a levels correlate with progression to higher albuminuria in diabetic patients. Figure S2. Expression level of podocyte
Supplementary Information
 Supplementary Information Supplementary Figure 1! a! b! Nfatc1!! Nfatc1"! P1! P2! pa1! pa2! ex1! ex2! exons 3-9! ex1! ex11!!" #" Nfatc1A!!" Nfatc1B! #"!" Nfatc1C! #" DN1! DN2! DN1!!A! #A!!B! #B!!C! #C!!A!
Supplementary Figure 1. AdipoR1 silencing and overexpression controls. (a) Representative blots (upper and lower panels) showing the AdipoR1 protein
 Representative blots (upper and lower panels) showing the AdipoR1 protein") Supplementary Figure 1. AdipoR1 silencing and overexpression controls. (a) Representative blots (upper and lower panels) showing the AdipoR1 protein content relative to GAPDH in two independent experiments.
Supplementary Figure 1. AdipoR1 silencing and overexpression controls. (a) Representative blots (upper and lower panels) showing the AdipoR1 protein content relative to GAPDH in two independent experiments.
stability and tumor suppression
 Supplementary information The stress kinase MKK7 couples oncogenic stress to p53 stability and tumor suppression Daniel Schramek 1, Athanassios Kotsinas 2, Arabella Meixner 1, Teiji Wada 1, Ulrich Elling
Supplemental Figure 1
 Supplemental Figure 1 1a 1c PD-1 MFI fold change 6 5 4 3 2 1 IL-1α IL-2 IL-4 IL-6 IL-1 IL-12 IL-13 IL-15 IL-17 IL-18 IL-21 IL-23 IFN-α Mut Human PD-1 promoter SBE-D 5 -GTCTG- -1.2kb SBE-P -CAGAC- -1.kb
SUPPLEMENTARY FIGURES
 SUPPLEMENTARY FIGURES 1 Supplementary Figure 1, Adult hippocampal QNPs and TAPs uniformly express REST a-b) Confocal images of adult hippocampal mouse sections showing GFAP (green), Sox2 (red), and REST
Supplementary Table S1. Tumor samples used for analysis Tumor size (cm) BNG (grade) ERα PR. pn-
 BNG (grade) ERα PR. pn-") Supplementary Table S1. Tumor samples used for analysis Sample# Age Tumor size (cm) pn- Stage Stage BNG (grade) ERα PR HER2 (FISH) Triple negative T1 46 3 N1a III 2 Pos Neg N T2 58 1 N(i-) I 3 Pos Neg
Supplementary Table S1. Tumor samples used for analysis Sample# Age Tumor size (cm) pn- Stage Stage BNG (grade) ERα PR HER2 (FISH) Triple negative T1 46 3 N1a III 2 Pos Neg N T2 58 1 N(i-) I 3 Pos Neg
Nature Genetics: doi: /ng Supplementary Figure 1. Details of sequencing analysis.
 Supplementary Figure 1 Details of sequencing analysis. (a) Flow chart showing which patients fall into each category and were used for analysis. (b) Graph showing the average and median coverage for all
Mitosis. Single Nano Micro Milli Macro. Primary. PCNA expression
 a b c DAPI YFP CC3 DAPI YFP PCNA DAPI YFP ph3 DAPI YFP KI67 e 6 Mitosis f 1 PCNA expression %ph3 + /YFP + n= 63 87 61 3 13 8 n= 15 3 9 1 5 %PCNA+/YFP+ 8 6 Supplementary Figure 1. Proliferation/apoptosis
* * * * Supplementary Figure 1. DS Lv CK HSA CK HSA. CK Col-3. CK Col-3. See overleaf for figure legend. Cancer cells
 Supplementary Figure 1 Cancer cells Desmoplastic stroma Hepatocytes Pre-existing sinusoidal blood vessel New blood vessel a Normal liver b Desmoplastic HGP c Pushing HGP d Replacement HGP e f g h i DS
Supplementary Figure 1: Neuregulin 1 increases the growth of mammary organoids compared to EGF. (a) Mammary epithelial cells were freshly isolated,
 Mammary epithelial cells were freshly isolated,") 1 2 3 4 5 6 7 8 9 10 Supplementary Figure 1: Neuregulin 1 increases the growth of mammary organoids compared to EGF. (a) Mammary epithelial cells were freshly isolated, embedded in matrigel and exposed
1 2 3 4 5 6 7 8 9 10 Supplementary Figure 1: Neuregulin 1 increases the growth of mammary organoids compared to EGF. (a) Mammary epithelial cells were freshly isolated, embedded in matrigel and exposed
The autoimmune disease-associated PTPN22 variant promotes calpain-mediated Lyp/Pep
 SUPPLEMENTARY INFORMATION The autoimmune disease-associated PTPN22 variant promotes calpain-mediated Lyp/Pep degradation associated with lymphocyte and dendritic cell hyperresponsiveness Jinyi Zhang, Naima
Supplementary Figure 1. SA-β-Gal positive senescent cells in various cancer tissues. Representative frozen sections of breast, thyroid, colon and
 Supplementary Figure 1. SA-β-Gal positive senescent cells in various cancer tissues. Representative frozen sections of breast, thyroid, colon and stomach cancer were stained with SA-β-Gal and nuclear fast
SUPPLEMENTARY INFORMATION. Supp. Fig. 1. Autoimmunity. Tolerance APC APC. T cell. T cell. doi: /nature06253 ICOS ICOS TCR CD28 TCR CD28
 Supp. Fig. 1 a APC b APC ICOS ICOS TCR CD28 mir P TCR CD28 P T cell Tolerance Roquin WT SG Icos mrna T cell Autoimmunity Roquin M199R SG Icos mrna www.nature.com/nature 1 Supp. Fig. 2 CD4 + CD44 low CD4
Supplementary Information Titles Journal: Nature Medicine
 Supplementary Information Titles Journal: Nature Medicine Article Title: Corresponding Author: Supplementary Item & Number Supplementary Fig.1 Fig.2 Fig.3 Fig.4 Fig.5 Fig.6 Fig.7 Fig.8 Fig.9 Fig. Fig.11
SUPPLEMENTARY LEGENDS...
 TABLE OF CONTENTS SUPPLEMENTARY LEGENDS... 2 11 MOVIE S1... 2 FIGURE S1 LEGEND... 3 FIGURE S2 LEGEND... 4 FIGURE S3 LEGEND... 5 FIGURE S4 LEGEND... 6 FIGURE S5 LEGEND... 7 FIGURE S6 LEGEND... 8 FIGURE
pplementary Figur Supplementary Figure 1. a.
 pplementary Figur Supplementary Figure 1. a. Quantification by RT-qPCR of YFV-17D and YFV-17D pol- (+) RNA in the supernatant of cultured Huh7.5 cells following viral RNA electroporation of respective
Title: Smooth muscle cell-specific Tgfbr1 deficiency promotes aortic aneurysm formation by stimulating multiple signaling events
 Title: Smooth muscle cell-specific Tgfbr1 deficiency promotes aortic aneurysm formation by stimulating multiple signaling events Pu Yang 1, 3, radley M. Schmit 1, Chunhua Fu 1, Kenneth DeSart 1, S. Paul