Supplementary Figure 1 IMQ-Induced Mouse Model of Psoriasis. IMQ cream was
|
|
|
- Neil Campbell
- 6 years ago
- Views:
Transcription
 Phenotypic presentation of mouse back skin treated with IMQ (severe erythema, scales and crusts). (c) H&E staining of lesional skin from treated mice.")
1 Supplementary Figure 1 IMQ-Induced Mouse Model of Psoriasis. IMQ cream was painted on the shaved back skin of CBL/J and BALB/c mice for consecutive days. (a, b) Phenotypic presentation of mouse back skin treated with IMQ (severe erythema, scales and crusts). (c) H&E staining of lesional skin from treated mice. a, acanthosis; b, 1
2 increased proliferative basal layer epidermal keratinocytes; c, dilated capillaries (small blood vessels in dermis); d, dermal cell infiltrates; k, hyperkeratosis; m, microabscesses; r, elongated rete ridge. Dotted line indicates the border between the epidermis and dermis; scale bar, 100μm.
3 Supplementary Figure Decreased IL- levels in IL-1A -/- mice and IL--mediated activation of NF-κB Signaling in Keratinocytes. (a) qpcr analysis of IL- expression from skin of WT (n=) and IL-1A -/- mice (n=) treated with IMQ. Results are presented as the ratio of mrna to -actin, relative to that in IL-1A -/- mice. (b) mir-1 expression in HaCaT cells stimulated with IL- in absence or presence of various concentrations of STAT inhibitor (istat) (SI-01, Selleck #S11). Results are presented as the ratio of mirna to the small nuclear RNA U, relative to that in untreated cells. (c) Phosphorylated-p (P-p) and CD flow cytometry analysis of single cell suspensions from normal epidermis of mouse treated with vehicle (Ctr) or lesional epidermis of mouse treated with IMQ. **p 0.01, two-tailed Student s t-test. Error bars depict SEM.
; EGFP, enhanced green fluorescent protein. (b) PCR genotyping of mir-1 transgenic founder mice (bp).")
4 9 Supplementary Figure Generation of mir-1 TG Mice. (a) Schematic illustration of the mir-1 transgenic construct used in this study to overexpress mir-1. CMV, cytomegalovirus (promoter); EGFP, enhanced green fluorescent protein. (b) PCR genotyping of mir-1 transgenic founder mice (bp). # indicated genotyping positive founder lines; m, DNA size marker; WT, wild-type control. (c) Quantitative RT-PCR analysis of mir-1 in PBMCs derived from WT or mir-1 TG mice (n= for each group). Results are presented as the ratio of mirna to the small nuclear RNA U, relative to that in WT mice. *p 0.0, two-tailed Student s t-test. Error bars depict SEM.
 Digital photos of H&E-stained skin samples derived from WT or mir-1 TG mice treated with IMQ were taken at the same orientation and magnification (n=).")
5 Supplementary Figure Increased Disease Severity in mir-1 TG Mice Treated with IMQ. (a, b) H&E staining of the back skin of WT or mir-1 TG mice treated with IMQ. (c) Digital photos of H&E-stained skin samples derived from WT or mir-1 TG mice treated with IMQ were taken at the same orientation and magnification (n=). The epidermal area was outlined, and its pixel area was measured using the lasso tool in Adobe Photoshop CS. The relative area of the epidermis was calculated by the formula provided in Methods. Scale bar, 100μm. (d) Dermal cell infiltrates for WT or mir-1 TG mice treated with IMQ. For all measurements, the median number of specifically stained dermal nucleated cells was counted in high-power fields per section. *p 0.0, **p<0.01, two-tailed Student s t-test. Error bars depict SEM. 1
6 Supplementary Figure Enhanced Proliferation of NHEK after overexpressing mir-1. Cell cycle analysis of NHEK transfected with control mimics (Ctr) and mir-1 mimics. Data are representative of two independent experiments.
 and cko mice (n=) every other day for 1 days.")
7 Supplementary Figure Decreased Disease Severity in cko mice after IL- Treatment. Mouse recombinant IL- was injected intradermally into the ear skin of mir-1 fl/fl (n=) and cko mice (n=) every other day for 1 days. (a) Phenotype of ear skin from mir-1 fl/fl and cko mice treated with ril-. (b) H&E staining of lesional skin from mir-1 fl/fl and cko mice treated with ril-. Scale bar, 100μm. (c, d) Skin thickness and acanthosis were quantitated from the H&E staining. *p 0.0, two-tailed Student s t-test. Error bars depict SEM.
8 Supplementary Figure Expression Levels of Inflammatory Genes in Lesional Skin of IMQ-Induced and IL--Mediated Mouse Models of Psoriasis. (a-f) Expression levels of IL-1, IL-, IL-1A, IL-, IFN- and TNF- in lesional skin samples derived from either mir-1 fl/fl or cko mice treated with IMQ. (g-l) Expression levels of IL-1,
9 IL-, IL-1, IL-, IFN- and TNF- in lesional ear skin samples derived from either mir-1 fl/fl or cko mice treated with ril-. Data are representative of two independent experiments. ns, not significant, *p 0.0, two-tailed Student s t-test. Error bars depict SEM. 9
10 Supplementary Figure mir-1 Expression in Epidermal Cells and Splenocytes of mir-1 fl/fl and cko Mice Treated with IMQ. (a) Expression of mir-1 in epidermis from mir-1 fl/fl and cko mice treated with vehicle (Ctr) or IMQ (n= for each group). (b) Expression of mir-1 in splenocytes from mir-1 fl/fl and cko mice treated with vehicle (Ctr) or IMQ (n= for each group). Results are presented as the ratio of mirna to the small nuclear RNA U, relative to that in mir-1 fl/fl mice treated with vehicle. ns, not significant, *p 0.0, two-tailed Student s t-test. Error bars depict SEM. 9 10
, WT mice treated with IMQ (WT) and mir-1 TG mice treated with IMQ (mir-1 TG ).")
11 Supplementary Figure 9 Identification of mir-1 Target Gene(s). (a, b) Predicted 0 candidate targets of mir-1. RNA was extracted from skin samples of non-treated WT mice (Control), WT mice treated with IMQ (WT) and mir-1 TG mice treated with IMQ (mir-1 TG ). (c) mrna levels of 1 candidate genes were measured by qpcr, and the 11
12 rest genes were undetectable. Results are presented as the ratio of mrna to -actin, relative to that in untreated WT controls. *p 0.0, **p 0.01, ***p<0.001, two-tailed Student s t-test. Error bars depict SEM. 1
13 Supplementary Figure 10 Upregulated Pppc Levels in cko Mice in IL--mediated Mouse Model of Psoriasis. (a) qpcr analysis of pppc expression in ear skin of mir-1 fl/fl and cko mice, treated with ril- or PBS (n=-). Results are presented as the ratio of mrna to -actin, relative to that in mir-1 fl/fl mice treated with PBS. (b) Western blotting of pppc expression in ear skin of mir-1 fl/fl and cko mice, treated with ril- or PBS. Data are representative of two independent experiments. **p 0.01, two-tailed Student s t-test. Error bars depict SEM. 1
14 9 Supplementary Figure 11 Pppc is not Targeted by mir-1a and Silencing Pppc does not alter mir-1 expression. (a, b) Ago was immunoprecipitated from epidermis lysates derived from mir-1 fl/fl or cko mice treated with IMQ. Immunoprecipitates were assayed for pppc and mir-1a. (c) Expressin of mir-1 in NHEK transfected with non-targeted sirna (sirna-ctr) and pppc targeted sirna (sirna-pppc). Results are presented as the ratio of mrna to -actin, relative to that in NHEK transfected with non-targeted sirna. Data are representative of two independent experiments. ns, not significant, two-tailed Student s t-test. Error bars depict SEM. 10 1
 Western blotting of pppc expression in primary mouse keratinocytes stimulated by IL-1A with different dosages and time points.")
15 9 Supplementary Figure 1 IL-1A Inhibits Pppc Expression in Keratinocytes. (a) Western blotting of pppc expression in primary mouse keratinocytes stimulated by IL-1A with different dosages and time points. (b, c) Western blotting of pppc expression in epidermis derived from IL-1A +/+ or IL-1A -/- mice treated with IMQ for days. Values (a, b) were expressed as fold changes relative to non-stimulated keratinocytes (a) or to IL-1A +/+ mouse (b). *p 0.0, two-tailed Student s t-test. Error bars depict SEM. 10 1
16 1
17 1

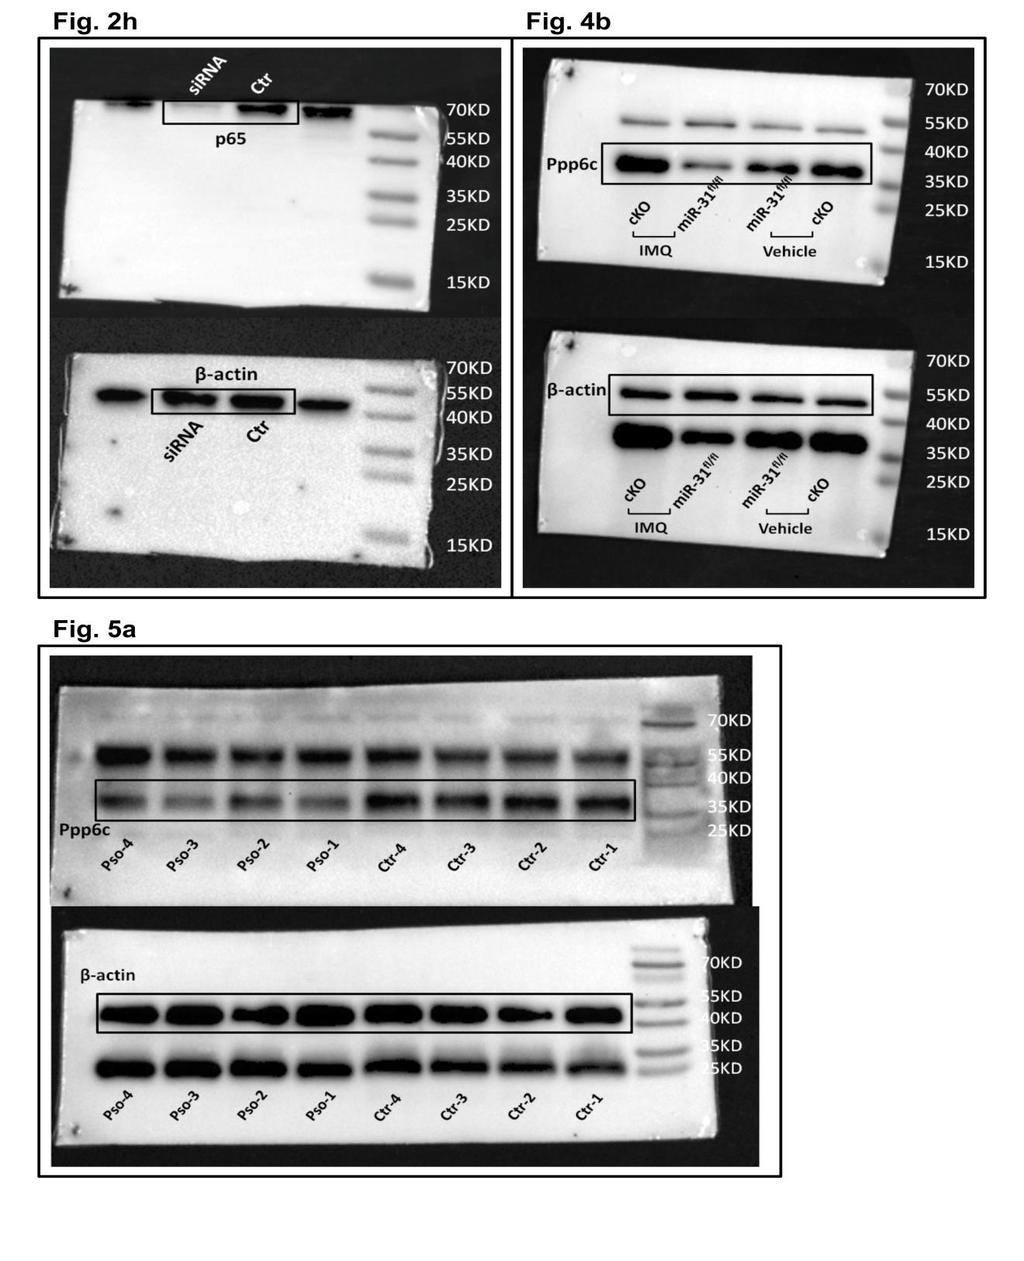
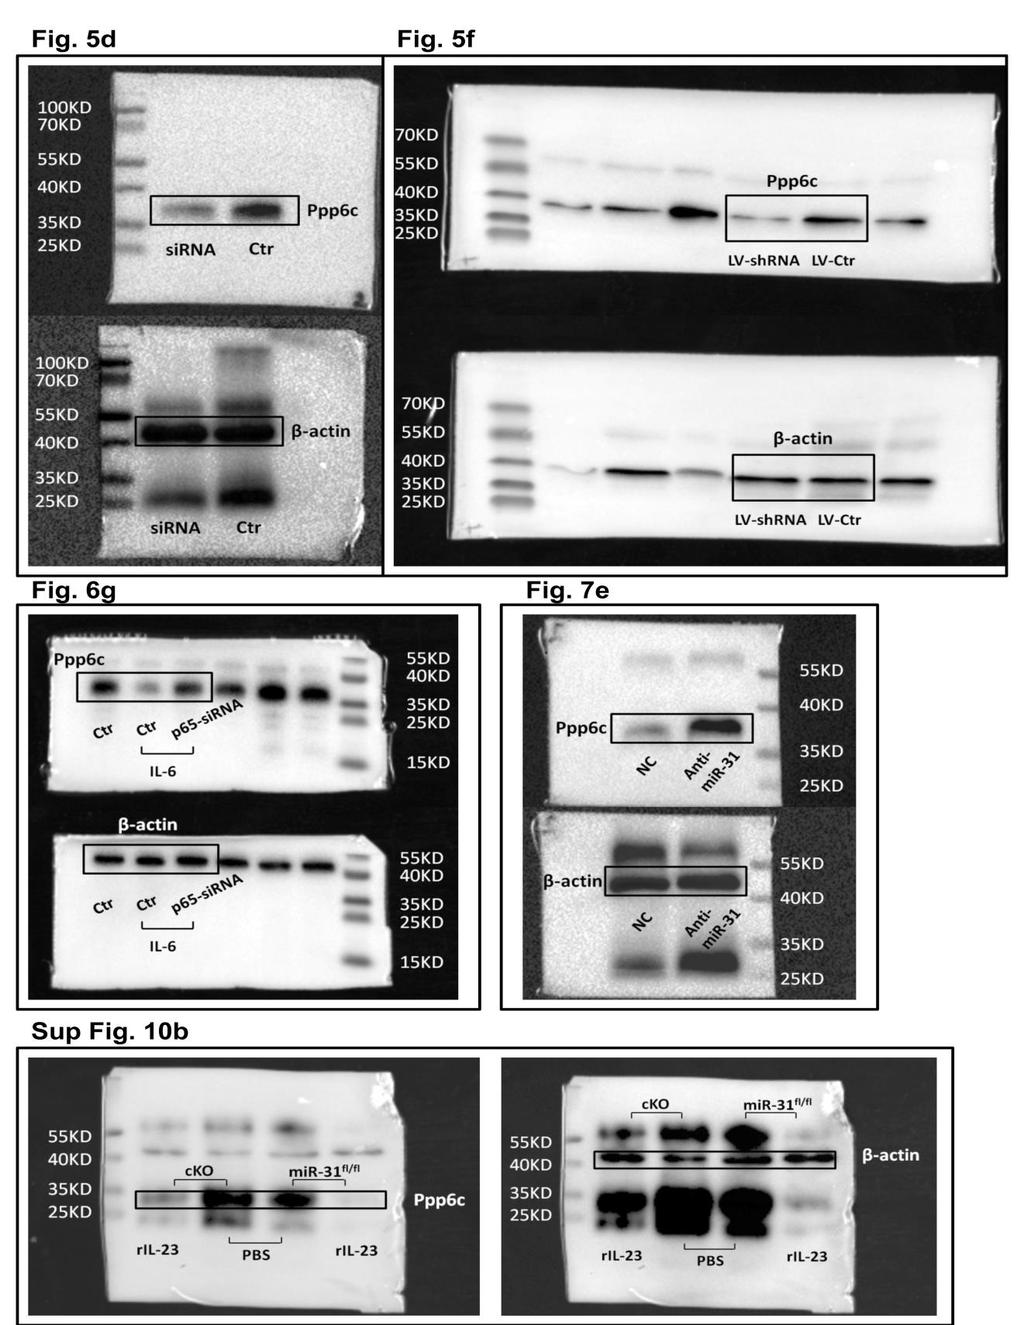
18 Supplementary Figure 1 List of original pictures of western blots. Black boxes highlight the indicated lanes in figures. 1
19 Supplementary Table 1. Information for patients with psoriasis vulgaris Sample ID Age in Gender PASI Score Years 1 1 M. M 1. M 1. M 10. M 1 19 F 1. F 1. 1 M unknown 9 M F. 11 M 9. 1 M unknown 1 M M M unknown 1 F M 1 1 M. 19 F M 1. 1 M 10. M 1. F 11. M. 9 M 1. M.9 M 1. 9 M. 9 M 1.9 All patients were clinically diagnosed as psoriasis vulgaris. M, male; F, female; PASI, Psoriasis Area and Severity Index; Unknown, data was missing. 19
T H E J O U R N A L O F C E L L B I O L O G Y
 T H E J O U R N A L O F C E L L B I O L O G Y Supplemental material Amelio et al., http://www.jcb.org/cgi/content/full/jcb.201203134/dc1 Figure S1. mir-24 regulates proliferation and by itself induces
Figure S1. Reduction in glomerular mir-146a levels correlate with progression to higher albuminuria in diabetic patients.
 Supplementary Materials Supplementary Figures Figure S1. Reduction in glomerular mir-146a levels correlate with progression to higher albuminuria in diabetic patients. Figure S2. Expression level of podocyte
Irf1 fold changes (D) 24h 48h. p-p65. t-p65. p-irf3. t-irf3. β-actin SKO TKO 100% 80% 60% 40% 20%
 24h 48h. p-p65. t-p65. p-irf3. t-irf3. β-actin SKO TKO 100% 80% 60% 40% 20%") Irf7 Fold changes 3 1 Irf1 fold changes 3 1 8h h 8h 8h h 8h p-p6 p-p6 t-p6 p-irf3 β-actin p-irf3 t-irf3 β-actin TKO TKO STKO (E) (F) TKO TKO % of p6 nuclear translocation % % 1% 1% % % p6 TKO % of IRF3
Irf7 Fold changes 3 1 Irf1 fold changes 3 1 8h h 8h 8h h 8h p-p6 p-p6 t-p6 p-irf3 β-actin p-irf3 t-irf3 β-actin TKO TKO STKO (E) (F) TKO TKO % of p6 nuclear translocation % % 1% 1% % % p6 TKO % of IRF3
Supplementary Figure 1: Fn14 is upregulated in the epidermis and dermis of mice
 Supplementary Figure 1: Fn14 is upregulated in the epidermis and dermis of mice undergoing AD- and psoriasis-like disease. Immunofluorescence staining for Fn14 (green) and DAPI (blue) in skin of naïve
Supplementary Figures
 Supplementary Figures Supplementary Figure 1 Characterization of stable expression of GlucB and sshbira in the CT26 cell line (a) Live cell imaging of stable CT26 cells expressing green fluorescent protein
% of live splenocytes. STAT5 deletion. (open shapes) % ROSA + % floxed
 % ROSA + % floxed") Supp. Figure 1. a 14 1 1 8 6 spleen cells (x1 6 ) 16 % of live splenocytes 5 4 3 1 % of live splenocytes 8 6 4 b 1 1 c % of CD11c + splenocytes (closed shapes) 8 6 4 8 6 4 % ROSA + (open shapes) % floxed
Supp. Figure 1. a 14 1 1 8 6 spleen cells (x1 6 ) 16 % of live splenocytes 5 4 3 1 % of live splenocytes 8 6 4 b 1 1 c % of CD11c + splenocytes (closed shapes) 8 6 4 8 6 4 % ROSA + (open shapes) % floxed
Intracellular MHC class II molecules promote TLR-triggered innate. immune responses by maintaining Btk activation
 Intracellular MHC class II molecules promote TLR-triggered innate immune responses by maintaining Btk activation Xingguang Liu, Zhenzhen Zhan, Dong Li, Li Xu, Feng Ma, Peng Zhang, Hangping Yao and Xuetao
Supplementary fig. 1. Crystals induce necroptosis does not involve caspases, TNF receptor or NLRP3. A. Mouse tubular epithelial cells were pretreated
 Supplementary fig. 1. Crystals induce necroptosis does not involve caspases, TNF receptor or NLRP3. A. Mouse tubular epithelial cells were pretreated with zvad-fmk (10µM) and exposed to calcium oxalate
Supplementary Figure S I: Effects of D4F on body weight and serum lipids in apoe -/- mice.
 Supplementary Figures: Supplementary Figure S I: Effects of D4F on body weight and serum lipids in apoe -/- mice. Male apoe -/- mice were fed a high-fat diet for 8 weeks, and given PBS (model group) or
Loss of RhoA promotes skin tumor formation. Supplementary Figure 1. Loss of RhoA does not impair F-actin organization.
 Supplementary Figure Legends Supplementary Figure 1. Loss of RhoA does not impair F-actin organization. a. Representative IF images of F-actin staining of big and small control (left) and RhoA ko tumors
Supplementary Figure 1: TSLP receptor skin expression in dcssc. A: Healthy control (HC) skin with TSLP receptor expression in brown (10x
 skin with TSLP receptor expression in brown (10x") Supplementary Figure 1: TSLP receptor skin expression in dcssc. A: Healthy control (HC) skin with TSLP receptor expression in brown (10x magnification). B: Second HC skin stained for TSLP receptor in brown
Supplementary Figure 1: TSLP receptor skin expression in dcssc. A: Healthy control (HC) skin with TSLP receptor expression in brown (10x magnification). B: Second HC skin stained for TSLP receptor in brown
Supplemental Figure 1. Western blot analysis indicated that MIF was detected in the fractions of
 Supplemental Figure Legends Supplemental Figure 1. Western blot analysis indicated that was detected in the fractions of plasma membrane and cytosol but not in nuclear fraction isolated from Pkd1 null
Supplementary Figure 1. Normal T lymphocyte populations in Dapk -/- mice. (a) Normal thymic development in Dapk -/- mice. Thymocytes from WT and Dapk
 Normal thymic development in Dapk -/- mice. Thymocytes from WT and Dapk") Supplementary Figure 1. Normal T lymphocyte populations in Dapk -/- mice. (a) Normal thymic development in Dapk -/- mice. Thymocytes from WT and Dapk -/- mice were stained for expression of CD4 and CD8.
Supplementary Figure 1. Normal T lymphocyte populations in Dapk -/- mice. (a) Normal thymic development in Dapk -/- mice. Thymocytes from WT and Dapk -/- mice were stained for expression of CD4 and CD8.
SUPPLEMENTARY INFORMATION
 DOI:.38/ncb3399 a b c d FSP DAPI 5mm mm 5mm 5mm e Correspond to melanoma in-situ Figure a DCT FSP- f MITF mm mm MlanaA melanoma in-situ DCT 5mm FSP- mm mm mm mm mm g melanoma in-situ MITF MlanaA mm mm
Supplementary Material
 Supplementary Material Summary: The supplementary information includes 1 table (Table S1) and 4 figures (Figure S1 to S4). Supplementary Figure Legends Figure S1 RTL-bearing nude mouse model. (A) Tumor
Supplementary Figures
 Supplementary Figures Supplementary Figure 1 Increased ABHD5 expression in human colon cancer associated macrophages. (a) Murine peritoneal macrophages were treated with regular culture medium (Ctrl) or
Programmed necrosis, not apoptosis, is a key mediator of cell loss and DAMP-mediated inflammation in dsrna-induced retinal degeneration
 Programmed necrosis, not apoptosis, is a key mediator of cell loss and DAMP-mediated inflammation in dsrna-induced retinal degeneration The Harvard community has made this article openly available. Please
Supplemental Figure 1
 Supplemental Figure 1 1a 1c PD-1 MFI fold change 6 5 4 3 2 1 IL-1α IL-2 IL-4 IL-6 IL-1 IL-12 IL-13 IL-15 IL-17 IL-18 IL-21 IL-23 IFN-α Mut Human PD-1 promoter SBE-D 5 -GTCTG- -1.2kb SBE-P -CAGAC- -1.kb
S1a S1b S1c. S1d. S1f S1g S1h SUPPLEMENTARY FIGURE 1. - si sc Il17rd Il17ra bp. rig/s IL-17RD (ng) -100 IL-17RD
 -100 IL-17RD") SUPPLEMENTARY FIGURE 1 0 20 50 80 100 IL-17RD (ng) S1a S1b S1c IL-17RD β-actin kda S1d - si sc Il17rd Il17ra rig/s15-574 - 458-361 bp S1f S1g S1h S1i S1j Supplementary Figure 1. Knockdown of IL-17RD enhances
SUPPLEMENTARY FIGURE 1 0 20 50 80 100 IL-17RD (ng) S1a S1b S1c IL-17RD β-actin kda S1d - si sc Il17rd Il17ra rig/s15-574 - 458-361 bp S1f S1g S1h S1i S1j Supplementary Figure 1. Knockdown of IL-17RD enhances
Supplementary Figure 1. Confocal immunofluorescence showing mitochondrial translocation of Drp1. Cardiomyocytes treated with H 2 O 2 were prestained
 Supplementary Figure 1. Confocal immunofluorescence showing mitochondrial translocation of Drp1. Cardiomyocytes treated with H 2 O 2 were prestained with MitoTracker (red), then were immunostained with
Supplementary Figure 1: si-craf but not si-braf sensitizes tumor cells to radiation.
 Supplementary Figure 1: si-craf but not si-braf sensitizes tumor cells to radiation. (a) Embryonic fibroblasts isolated from wildtype (WT), BRAF -/-, or CRAF -/- mice were irradiated (6 Gy) and DNA damage
Supplemental Figure 1. Signature gene expression in in vitro differentiated Th0, Th1, Th2, Th17 and Treg cells. (A) Naïve CD4 + T cells were cultured
 Naïve CD4 + T cells were cultured") Supplemental Figure 1. Signature gene expression in in vitro differentiated Th0, Th1, Th2, Th17 and Treg cells. (A) Naïve CD4 + T cells were cultured under Th0, Th1, Th2, Th17, and Treg conditions. mrna
Supplemental Figure 1. Signature gene expression in in vitro differentiated Th0, Th1, Th2, Th17 and Treg cells. (A) Naïve CD4 + T cells were cultured under Th0, Th1, Th2, Th17, and Treg conditions. mrna
IMO-8400, a novel TLR7, TLR8 and TLR9 antagonist, psoriasis
 IMO-8400, a novel TLR7, TLR8 and TLR9 antagonist, inhibits disease development in mouse models of psoriasis Weiwen e Ja Jiang, Fu-Gang Zhu, Dong Yu, Ekambar R. Kandimalla, a a, Nicola La Monica, and Sudhir
Supplementary Figure S1: Defective heterochromatin repair in HGPS progeroid cells
 Supplementary Figure S1: Defective heterochromatin repair in HGPS progeroid cells Immunofluorescence staining of H3K9me3 and 53BP1 in PH and HGADFN003 (HG003) cells at 24 h after γ-irradiation. Scale bar,
Supplementary Figures
 Supplementary Figures Supplementary Figure 1. Confirmation of Dnmt1 conditional knockout out mice. a, Representative images of sorted stem (Lin - CD49f high CD24 + ), luminal (Lin - CD49f low CD24 + )
(A) RT-PCR for components of the Shh/Gli pathway in normal fetus cell (MRC-5) and a
 RT-PCR for components of the Shh/Gli pathway in normal fetus cell (MRC-5) and a") Supplementary figure legends Supplementary Figure 1. Expression of Shh signaling components in a panel of gastric cancer. (A) RT-PCR for components of the Shh/Gli pathway in normal fetus cell (MRC-5) and
Supplementary figure legends Supplementary Figure 1. Expression of Shh signaling components in a panel of gastric cancer. (A) RT-PCR for components of the Shh/Gli pathway in normal fetus cell (MRC-5) and
Supplementary Figure 1 Chemokine and chemokine receptor expression during muscle regeneration (a) Analysis of CR3CR1 mrna expression by real time-pcr
 Analysis of CR3CR1 mrna expression by real time-pcr") Supplementary Figure 1 Chemokine and chemokine receptor expression during muscle regeneration (a) Analysis of CR3CR1 mrna expression by real time-pcr at day 0, 1, 4, 10 and 21 post- muscle injury. (b)
Supplementary Figure 1 Chemokine and chemokine receptor expression during muscle regeneration (a) Analysis of CR3CR1 mrna expression by real time-pcr at day 0, 1, 4, 10 and 21 post- muscle injury. (b)
Supplementary Information
 Supplementary Information mediates STAT3 activation at retromer-positive structures to promote colitis and colitis-associated carcinogenesis Zhang et al. a b d e g h Rel. Luc. Act. Rel. mrna Rel. mrna
ERK1/2/MAPK pathway-dependent regulation of the telomeric factor TRF2
 ERK1/2/MAPK pathway-dependent regulation of the telomeric factor TRF2 SUPPLEMENTARY FIGURES AND TABLE Supplementary Figure S1: Conservation of the D domain throughout evolution. Alignment of TRF2 sequences
Supplementary Figure 1. AdipoR1 silencing and overexpression controls. (a) Representative blots (upper and lower panels) showing the AdipoR1 protein
 Representative blots (upper and lower panels) showing the AdipoR1 protein") Supplementary Figure 1. AdipoR1 silencing and overexpression controls. (a) Representative blots (upper and lower panels) showing the AdipoR1 protein content relative to GAPDH in two independent experiments.
Supplementary Figure 1. AdipoR1 silencing and overexpression controls. (a) Representative blots (upper and lower panels) showing the AdipoR1 protein content relative to GAPDH in two independent experiments.
Primary Cilia Can Both Mediate and Suppress Hedgehog Pathway- Dependent Tumorigenesis (Supplementary Figures and Materials)
") Primary Cilia Can Both Mediate and Suppress Hedgehog Pathway- Dependent Tumorigenesis (Supplementary Figures and Materials) Sunny Y. Wong, Allen D. Seol, Po-Lin So, Alexandre N. Ermilov, Christopher K.
Primary Cilia Can Both Mediate and Suppress Hedgehog Pathway- Dependent Tumorigenesis (Supplementary Figures and Materials) Sunny Y. Wong, Allen D. Seol, Po-Lin So, Alexandre N. Ermilov, Christopher K.
Supplementary Figure 1
 Supplementary Figure 1 Supplementary Figure 1 Schematic depiction of the tandem Fc GDF15. Supplementary Figure 2 Supplementary Figure 2 Gfral mrna levels in the brains of both wild-type and knockout Gfral
Supplementary Figure 1. Deletion of Smad3 prevents B16F10 melanoma invasion and metastasis in a mouse s.c. tumor model.
 A B16F1 s.c. Lung LN Distant lymph nodes Colon B B16F1 s.c. Supplementary Figure 1. Deletion of Smad3 prevents B16F1 melanoma invasion and metastasis in a mouse s.c. tumor model. Highly invasive growth
Supplementary Figure 1. ETBF activate Stat3 in B6 and Min mice colons
 Supplementary Figure 1 ETBF activate Stat3 in B6 and Min mice colons a pstat3 controls Pos Neg ETBF 1 2 3 4 b pstat1 pstat2 pstat3 pstat4 pstat5 pstat6 Actin Figure Legend: (a) ETBF induce predominantly
Supplementary Figure 1. Characterization of basophils after reconstitution of SCID mice
 Supplementary figure legends Supplementary Figure 1. Characterization of after reconstitution of SCID mice with CD4 + CD62L + T cells. (A-C) SCID mice (n = 6 / group) were reconstituted with 2 x 1 6 CD4
c Ischemia (30 min) Reperfusion (8 w) Supplementary Figure bp 300 bp Ischemia (30 min) Reperfusion (4 h) Dox 20 mg/kg i.p.
 Reperfusion (8 w) Supplementary Figure bp 300 bp Ischemia (30 min) Reperfusion (4 h) Dox 20 mg/kg i.p.") a Marker Ripk3 +/ 5 bp 3 bp b Ischemia (3 min) Reperfusion (4 h) d 2 mg/kg i.p. 1 w 5 w Sacrifice for IF size A subset for echocardiography and morphological analysis c Ischemia (3 min) Reperfusion (8
a Marker Ripk3 +/ 5 bp 3 bp b Ischemia (3 min) Reperfusion (4 h) d 2 mg/kg i.p. 1 w 5 w Sacrifice for IF size A subset for echocardiography and morphological analysis c Ischemia (3 min) Reperfusion (8
MicroRNAs Modulate the Noncanonical NF- B Pathway by Regulating IKK Expression During Macrophage Differentiation
 MicroRNAs Modulate the Noncanonical NF- B Pathway by Regulating IKK Expression During Macrophage Differentiation Tao Li 1 *, Michael J. Morgan 1 *, Swati Choksi 1, Yan Zhang 1, You-Sun Kim 2#, Zheng-gang
Nature Medicine: doi: /nm.3922
 Title: Glucocorticoid-induced tumor necrosis factor receptor-related protein co-stimulation facilitates tumor regression by inducing IL-9-producing helper T cells Authors: Il-Kyu Kim, Byung-Seok Kim, Choong-Hyun
(a) Significant biological processes (upper panel) and disease biomarkers (lower panel)
 Significant biological processes (upper panel) and disease biomarkers (lower panel)") Supplementary Figure 1. Functional enrichment analyses of secretomic proteins. (a) Significant biological processes (upper panel) and disease biomarkers (lower panel) 2 involved by hrab37-mediated secretory
Supplementary Figure 1. Functional enrichment analyses of secretomic proteins. (a) Significant biological processes (upper panel) and disease biomarkers (lower panel) 2 involved by hrab37-mediated secretory
Supplementary Materials for
 www.sciencesignaling.org/cgi/content/full/8/364/ra18/dc1 Supplementary Materials for The tyrosine phosphatase (Pez) inhibits metastasis by altering protein trafficking Leila Belle, Naveid Ali, Ana Lonic,
SUPPLEMENTARY FIGURES
 SUPPLEMENTARY FIGURES 1 Supplementary Figure 1, Adult hippocampal QNPs and TAPs uniformly express REST a-b) Confocal images of adult hippocampal mouse sections showing GFAP (green), Sox2 (red), and REST
E10.5 E18.5 P2 10w 83w NF1 HF1. Sham ISO. Bmi1. H3K9me3. Lung weight (g)
") Myociyte cross-sectional Relative mrna levels Relative levels Relative mrna levels Supplementary Figures and Legends a 8 6 4 2 Ezh2 E1.5 E18.5 P2 1w 83w b Ezh2 p16 amhc b-actin P2 43w kd 37 86 16 wt mouse
Myociyte cross-sectional Relative mrna levels Relative levels Relative mrna levels Supplementary Figures and Legends a 8 6 4 2 Ezh2 E1.5 E18.5 P2 1w 83w b Ezh2 p16 amhc b-actin P2 43w kd 37 86 16 wt mouse
Supplementary Materials for
 www.sciencesignaling.org/cgi/content/full/7/308/ra4/dc1 Supplementary Materials for Antipsychotics Activate mtorc1-dependent Translation to Enhance Neuronal Morphological Complexity Heather Bowling, Guoan
microrna-200b and microrna-200c promote colorectal cancer cell proliferation via
 Supplementary Materials microrna-200b and microrna-200c promote colorectal cancer cell proliferation via targeting the reversion-inducing cysteine-rich protein with Kazal motifs Supplementary Table 1.
Rescue of mutant rhodopsin traffic by metformin-induced AMPK activation accelerates photoreceptor degeneration Athanasiou et al
 Supplementary Material Rescue of mutant rhodopsin traffic by metformin-induced AMPK activation accelerates photoreceptor degeneration Athanasiou et al Supplementary Figure 1. AICAR improves P23H rod opsin
Nature Immunology: doi: /ni.3866
 Nature Immunology: doi:10.1038/ni.3866 Supplementary Figure 1 The effect of TIPE2 on chemotaxis. a, The expression of TIPE2 in dhl-60c, dhl-60t, TIPE2-expressing and 15/16Q-expressing dhl-60t neutrophils
BRaf V600E cooperates with Pten silencing to elicit metastatic melanoma (Nature Genetics Supplementary Information)
") BRaf V600E cooperates with Pten silencing to elicit metastatic melanoma (Nature Genetics Supplementary Information) David Dankort, David P. Curley, Robert A. Cartlidge, Betsy Nelson, Anthony N. Karnezis,
BRaf V600E cooperates with Pten silencing to elicit metastatic melanoma (Nature Genetics Supplementary Information) David Dankort, David P. Curley, Robert A. Cartlidge, Betsy Nelson, Anthony N. Karnezis,
Supplementary Materials for
 www.sciencesignaling.org/cgi/content/full/4/199/ra75/dc1 Supplementary Materials for Signaling by the Matrix Proteoglycan Decorin Controls Inflammation and Cancer Through PDCD4 and MicroRNA-21 Rosetta
Supplementary Information
 Supplementary Information TABLE S1. SUBJECT CHARACTERISTICS* Normal Control Subjects Subjects with Asthma p Value Number 23 48 Age (years) 35±10 35±10 0.75 Sex, M:F (% F) 9:12 (57) 17:26 (60) 0.76 FEV1
Nature Structural & Molecular Biology: doi: /nsmb Supplementary Figure 1. Differential expression of mirnas from the pri-mir-17-92a locus.
 Supplementary Figure 1 Differential expression of mirnas from the pri-mir-17-92a locus. (a) The mir-17-92a expression unit in the third intron of the host mir-17hg transcript. (b,c) Impact of knockdown
SUPPLEMENTARY INFORMATION. Involvement of IL-21 in the epidermal hyperplasia of psoriasis
 SUPPLEMENTARY INFORMATION Involvement of IL-21 in the epidermal hyperplasia of psoriasis Roberta Caruso 1, Elisabetta Botti 2, Massimiliano Sarra 1, Maria Esposito 2, Carmine Stolfi 1, Laura Diluvio 2,
Supplementary Figure 1: Signaling centers contain few proliferating cells, express p21, and
 Supplementary Figure 1: Signaling centers contain few proliferating cells, express p21, and exclude YAP from the nucleus. (a) Schematic diagram of an E10.5 mouse embryo. (b,c) Sections at B and C in (a)
SUPPLEMENTARY INFORMATION
 doi:10.1038/nature12215 Supplementary Figure 1. The effects of full and dissociated GR agonists in supporting BFU-E self-renewal divisions. BFU-Es were cultured in self-renewal medium with indicated GR
Supplementary Fig. 1 p38 MAPK negatively regulates DC differentiation. (a) Western blot analysis of p38 isoform expression in BM cells, immature DCs
 Western blot analysis of p38 isoform expression in BM cells, immature DCs") Supplementary Fig. 1 p38 MAPK negatively regulates DC differentiation. (a) Western blot analysis of p38 isoform expression in BM cells, immature DCs (idcs) and mature DCs (mdcs). A myeloma cell line expressing
Supplementary Fig. 1 p38 MAPK negatively regulates DC differentiation. (a) Western blot analysis of p38 isoform expression in BM cells, immature DCs (idcs) and mature DCs (mdcs). A myeloma cell line expressing
SUPPLEMENTARY INFORMATION
 doi: 1.138/nature89 IFN- (ng ml ) 5 4 3 1 Splenocytes NS IFN- (ng ml ) 6 4 Lymph node cells NS Nfkbiz / Nfkbiz / Nfkbiz / Nfkbiz / IL- (ng ml ) 3 1 Splenocytes IL- (ng ml ) 1 8 6 4 *** ** Lymph node cells
Supplementary Table 1. List of primers used in this study
 Supplementary Table 1. List of primers used in this study Gene Forward primer Reverse primer Rat Met 5 -aggtcgcttcatgcaggt-3 5 -tccggagacacaggatgg-3 Rat Runx1 5 -cctccttgaaccactccact-3 5 -ctggatctgcctggcatc-3
Supplementary Figure 1.
 Supplementary Figure 1. Female Pro-ins2 -/- mice at 5-6 weeks of age were either inoculated i.p. with a single dose of CVB4 (1x10 5 PFU/mouse) or PBS and treated with αgalcer or control vehicle. On day
Supplemental Information. Increased 4E-BP1 Expression Protects. against Diet-Induced Obesity and Insulin. Resistance in Male Mice
 Cell Reports, Volume 16 Supplemental Information Increased 4E-BP1 Expression Protects against Diet-Induced Obesity and Insulin Resistance in Male Mice Shih-Yin Tsai, Ariana A. Rodriguez, Somasish G. Dastidar,
Supplementary Figure 1. BMS enhances human T cell activation in vitro in a
 Supplementary Figure 1. BMS98662 enhances human T cell activation in vitro in a concentration-dependent manner. Jurkat T cells were activated with anti-cd3 and anti-cd28 antibody in the presence of titrated
p47 negatively regulates IKK activation by inducing the lysosomal degradation of polyubiquitinated NEMO
 Supplementary Information p47 negatively regulates IKK activation by inducing the lysosomal degradation of polyubiquitinated NEMO Yuri Shibata, Masaaki Oyama, Hiroko Kozuka-Hata, Xiao Han, Yuetsu Tanaka,
Supplementary Figure 1. Characterization of NMuMG-ErbB2 and NIC breast cancer cells expressing shrnas targeting LPP. NMuMG-ErbB2 cells (a) and NIC
 and NIC") Supplementary Figure 1. Characterization of NMuMG-ErbB2 and NIC breast cancer cells expressing shrnas targeting LPP. NMuMG-ErbB2 cells (a) and NIC cells (b) were engineered to stably express either a LucA-shRNA
Supplementary Figure 1. Characterization of NMuMG-ErbB2 and NIC breast cancer cells expressing shrnas targeting LPP. NMuMG-ErbB2 cells (a) and NIC cells (b) were engineered to stably express either a LucA-shRNA
Supplementary Figure 1. mrna expression of chitinase and chitinase-like protein in splenic immune cells. Each splenic immune cell population was
 Supplementary Figure 1. mrna expression of chitinase and chitinase-like protein in splenic immune cells. Each splenic immune cell population was sorted by FACS. Surface markers for sorting were CD11c +
Supplementary Information
 Supplementary Information An orally available, small-molecule interferon inhibits viral replication Hideyuki Konishi 1, Koichi Okamoto 1, Yusuke Ohmori 1, Hitoshi Yoshino 2, Hiroshi Ohmori 1, Motooki Ashihara
ANGPTL2 increases bone metastasis of breast cancer cells through. Tetsuro Masuda, Motoyoshi Endo, Yutaka Yamamoto, Haruki Odagiri, Tsuyoshi
 Masuda et al. Supplementary information for ANGPTL2 increases bone metastasis of breast cancer cells through enhancing CXCR4 signaling Tetsuro Masuda, Motoyoshi Endo, Yutaka Yamamoto, Haruki Odagiri, Tsuyoshi
Soft Agar Assay. For each cell pool, 100,000 cells were resuspended in 0.35% (w/v)
") SUPPLEMENTARY MATERIAL AND METHODS Soft Agar Assay. For each cell pool, 100,000 cells were resuspended in 0.35% (w/v) top agar (LONZA, SeaKem LE Agarose cat.5004) and plated onto 0.5% (w/v) basal agar.
SUPPLEMENTARY MATERIAL AND METHODS Soft Agar Assay. For each cell pool, 100,000 cells were resuspended in 0.35% (w/v) top agar (LONZA, SeaKem LE Agarose cat.5004) and plated onto 0.5% (w/v) basal agar.
Supplemental Information. Metabolic Maturation during Muscle Stem Cell. Differentiation Is Achieved by mir-1/133a-mediated
 Cell Metabolism, Volume 27 Supplemental Information Metabolic Maturation during Muscle Stem Cell Differentiation Is Achieved by mir-1/133a-mediated Inhibition of the Dlk1-Dio3 Mega Gene Cluster Stas Wüst,
Supplementary Table 1. The primers used for quantitative RT-PCR. Gene name Forward (5 > 3 ) Reverse (5 > 3 )
 Reverse (5 > 3 )") 770 771 Supplementary Table 1. The primers used for quantitative RT-PCR. Gene name Forward (5 > 3 ) Reverse (5 > 3 ) Human CXCL1 GCGCCCAAACCGAAGTCATA ATGGGGGATGCAGGATTGAG PF4 CCCCACTGCCCAACTGATAG TTCTTGTACAGCGGGGCTTG
770 771 Supplementary Table 1. The primers used for quantitative RT-PCR. Gene name Forward (5 > 3 ) Reverse (5 > 3 ) Human CXCL1 GCGCCCAAACCGAAGTCATA ATGGGGGATGCAGGATTGAG PF4 CCCCACTGCCCAACTGATAG TTCTTGTACAGCGGGGCTTG
Figure S1. Generation of inducible PTEN deficient mice and the BMMCs (A) B6.129 Pten loxp/loxp mice were mated with B6.
 B6.129 Pten loxp/loxp mice were mated with B6.") Figure S1. Generation of inducible PTEN deficient mice and the BMMCs (A) B6.129 Pten loxp/loxp mice were mated with B6.129-Gt(ROSA)26Sor tm1(cre/ert2)tyj /J mice. To induce deletion of the Pten locus,
Figure S1. Generation of inducible PTEN deficient mice and the BMMCs (A) B6.129 Pten loxp/loxp mice were mated with B6.129-Gt(ROSA)26Sor tm1(cre/ert2)tyj /J mice. To induce deletion of the Pten locus,
Supplementary Materials for
 www.sciencesignaling.org/cgi/content/full/7/310/ra11/dc1 Supplementary Materials for STAT3 Induction of mir-146b Forms a Feedback Loop to Inhibit the NF-κB to IL-6 Signaling Axis and STAT3-Driven Cancer
2.5. AMPK activity
 Supplement Fig. A 3 B phos-ampk 2.5 * Control AICAR AMPK AMPK activity (Absorbance at 45 nm) 2.5.5 Control AICAR Supplement Fig. Effects of AICAR on AMPK activation in macrophages. J774. macrophages were
SUPPLEMENTARY INFORMATION
 doi:1.138/nature1554 a TNF-α + in CD4 + cells [%] 1 GF SPF 6 b IL-1 + in CD4 + cells [%] 5 4 3 2 1 Supplementary Figure 1. Effect of microbiota on cytokine profiles of T cells in GALT. Frequencies of TNF-α
L1 on PyMT tumor cells but Py117 cells are more responsive to IFN-γ. (A) Flow
 Flow") A MHCI B PD-L1 Fold expression 8 6 4 2 Fold expression 3 2 1 No tx 1Gy 2Gy IFN Py117 Py117 Supplementary Figure 1. Radiation and IFN-γ enhance MHCI expression and PD- L1 on PyMT tumor cells but Py117 cells
A MHCI B PD-L1 Fold expression 8 6 4 2 Fold expression 3 2 1 No tx 1Gy 2Gy IFN Py117 Py117 Supplementary Figure 1. Radiation and IFN-γ enhance MHCI expression and PD- L1 on PyMT tumor cells but Py117 cells
Nature Immunology: doi: /ni Supplementary Figure 1
 Supplementary Figure 1 NLRP12 is downregulated in biopsy samples from patients with active ulcerative colitis (UC). (a-g) NLRP12 expression in 7 UC mrna profiling studies deposited in NCBI GEO database.
Pharmacologic inhibition of histone demethylation as a therapy for pediatric brainstem glioma
 Supplementary information for: Pharmacologic inhibition of histone demethylation as a therapy for pediatric brainstem glioma Rintaro Hashizume 1, Noemi Andor 2, Yuichiro Ihara 2, Robin Lerner 2, Haiyun
SUPPLEMENTARY FIGURES AND TABLE
 SUPPLEMENTARY FIGURES AND TABLE Supplementary Figure S1: Characterization of IRE1α mutants. A. U87-LUC cells were transduced with the lentiviral vector containing the GFP sequence (U87-LUC Tet-ON GFP).
well for 2 h at rt. Each dot represents an individual mouse and bar is the mean ±
 Supplementary data: Control DC Blimp-1 ko DC 8 6 4 2-2 IL-1β p=.5 medium 8 6 4 2 IL-2 Medium p=.16 8 6 4 2 IL-6 medium p=.3 5 4 3 2 1-1 medium IL-1 n.s. 25 2 15 1 5 IL-12(p7) p=.15 5 IFNγ p=.65 4 3 2 1
Plasma exposure levels from individual mice 4 hours post IP administration at the
 Supplemental Figure Legends Figure S1. Plasma exposure levels of MKC-3946 in mice. Plasma exposure levels from individual mice 4 hours post IP administration at the indicated dose mg/kg. Data represent
Title of file for HTML: Supplementary Information Description: Supplementary Figures and Supplementary Table
 Title of file for HTML: Supplementary Information Description: Supplementary Figures and Supplementary Table Title of file for HTML: Peer Review File Description: Innate Scavenger Receptor-A regulates
Supplementary Figure 1
 Supplementary Figure 1 YAP negatively regulates IFN- signaling. (a) Immunoblot analysis of Yap knockdown efficiency with sh-yap (#1 to #4 independent constructs) in Raw264.7 cells. (b) IFN- -Luc and PRDs
GFP/Iba1/GFAP. Brain. Liver. Kidney. Lung. Hoechst/Iba1/TLR9!
 Supplementary information a +KA Relative expression d! Tlr9 5!! 5! NSC Neuron Astrocyte Microglia! 5! Tlr7!!!! NSC Neuron Astrocyte! GFP/Sβ/! Iba/Hoechst Microglia e Hoechst/Iba/TLR9! GFP/Iba/GFAP f Brain
SUPPLEMENTARY INFORMATION
 DOI: 1.138/ncb3355 a S1A8 + cells/ total.1.8.6.4.2 b S1A8/?-Actin c % T-cell proliferation 3 25 2 15 1 5 T cells Supplementary Figure 1 Inter-tumoral heterogeneity of MDSC accumulation in mammary tumor
 DOI: 10.1038/ncb2210 b. ICAM1 ng ml -1 P = 0.0001 Small RNA (15-30nts) ng ml -1 Cell Lysate Exosome HDL Plasma HDL Normal Human HDL mirnas R = 0.45 P < 0.0001 Normal Human Exosome mirnas Figure S1. Characterization
Supplementary Figure 1
 d f a IL7 b IL GATA RORγt h HDM IL IL7 PBS Ilra R7 PBS HDM Ilra R7 HDM Foxp Foxp Ilra R7 HDM HDM Ilra R7 HDM. 9..79. CD + FOXP + T reg cell CD + FOXP T conv cell PBS Ilra R7 PBS HDM Ilra R7 HDM CD + FOXP
T H E J O U R N A L O F C E L L B I O L O G Y
 T H E J O U R N A L O F C E L L B I O L O G Y Supplemental material Krenn et al., http://www.jcb.org/cgi/content/full/jcb.201110013/dc1 Figure S1. Levels of expressed proteins and demonstration that C-terminal
Crucial role for human Toll-like receptor 4 in the development of contact allergy to nickel
 Supplementary Figures 1-8 Crucial role for human Toll-like receptor 4 in the development of contact allergy to nickel Marc Schmidt 1,2, Badrinarayanan Raghavan 1,2, Verena Müller 1,2, Thomas Vogl 3, György
Nature Immunology: doi: /ni Supplementary Figure 1. Cytokine pattern in skin in response to urushiol.
 Supplementary Figure 1 Cytokine pattern in skin in response to urushiol. Wild-type (WT) and CD1a-tg mice (n = 3 per group) were sensitized and challenged with urushiol (uru) or vehicle (veh). Quantitative
Kidney. Heart. Lung. Sirt1. Gapdh. Mouse IgG DAPI. Rabbit IgG DAPI
 a e Na V 1.5 Ad-LacZ Ad- 110KD b Scn5a/ (relative to Ad-LacZ) f 150 100 50 0 p = 0.65 Ad-LacZ Ad- c Heart Lung Kidney Spleen 110KD d fl/fl c -/- DAPI 20 µm Na v 1.5 250KD fl/fl Rabbit IgG DAPI fl/fl Mouse
Integrin CD11b negatively regulates TLR-triggered inflammatory responses by. activating Syk and promoting MyD88 and TRIF degradation via cbl-b
 Integrin CD11b negatively regulates TLR-triggered inflammatory responses by activating Syk and promoting MyD88 and TRIF degradation via cbl-b Chaofeng Han, Jing Jin, Sheng Xu, Haibo Liu, Nan Li, and Xuetao
Supplementary Figure 1 The ability to regenerate an ear hole is discontinuous with wound healing. Ear-hole closure at D85 for each sex within each
 Supplementary Figure 1 The ability to regenerate an ear hole is discontinuous with wound healing. Ear-hole closure at D85 for each sex within each species observed. Data show a binary response to a 4 mm
Nature Immunology: doi: /ni Supplementary Figure 1. Production of cytokines and chemokines after vaginal HSV-2 infection.
 Supplementary Figure 1 Production of cytokines and chemokines after vaginal HSV-2 infection. C57BL/6 mice were (a) treated intravaginally with 20 µl of PBS or infected with 6.7x10 4 pfu of HSV-2 in the
RAW264.7 cells stably expressing control shrna (Con) or GSK3b-specific shrna (sh-
 or GSK3b-specific shrna (sh-") 1 a b Supplementary Figure 1. Effects of GSK3b knockdown on poly I:C-induced cytokine production. RAW264.7 cells stably expressing control shrna (Con) or GSK3b-specific shrna (sh- GSK3b) were stimulated
1 a b Supplementary Figure 1. Effects of GSK3b knockdown on poly I:C-induced cytokine production. RAW264.7 cells stably expressing control shrna (Con) or GSK3b-specific shrna (sh- GSK3b) were stimulated
SUPPLEMENTARY MATERIAL
 SUPPLEMENTARY MATERIAL IL-1 signaling modulates activation of STAT transcription factors to antagonize retinoic acid signaling and control the T H 17 cell it reg cell balance Rajatava Basu 1,5, Sarah K.
Supplemental Materials for. Effects of sphingosine-1-phosphate receptor 1 phosphorylation in response to. FTY720 during neuroinflammation
 Supplemental Materials for Effects of sphingosine-1-phosphate receptor 1 phosphorylation in response to FTY7 during neuroinflammation This file includes: Supplemental Table 1. EAE clinical parameters of
SUPPLEMENTARY INFORMATION
 DOI: 1.138/ncb222 / b. WB anti- WB anti- ulin Mitotic index (%) 14 1 6 2 T (h) 32 48-1 1 2 3 4 6-1 4 16 22 28 3 33 e. 6 4 2 Time (min) 1-6- 11-1 > 1 % cells Figure S1 depletion leads to mitotic defects
Supporting Information
 Supporting Information Franco et al. 10.1073/pnas.1015557108 SI Materials and Methods Drug Administration. PD352901 was dissolved in 0.5% (wt/vol) hydroxyl-propyl-methylcellulose, 0.2% (vol/vol) Tween
SUPPLEMENTARY INFORMATION. Supp. Fig. 1. Autoimmunity. Tolerance APC APC. T cell. T cell. doi: /nature06253 ICOS ICOS TCR CD28 TCR CD28
 Supp. Fig. 1 a APC b APC ICOS ICOS TCR CD28 mir P TCR CD28 P T cell Tolerance Roquin WT SG Icos mrna T cell Autoimmunity Roquin M199R SG Icos mrna www.nature.com/nature 1 Supp. Fig. 2 CD4 + CD44 low CD4
Control GST GST-RAP. α2-mg. 170 kda. b-actin. 42 kda LRP-1
 % of max Supplementary Figure 1 Control GST GST-RP 17 kda α2-mg 42 kda b-actin Gate: CD11c+ (DCs) Gate: F4/8+ (Mfs) IgG Cd11cCre + Lrp1 fl/fl LRP-1 Supplementary figure 1. () MDCs were pretreated with
SUPPLEMENTARY INFORMATION
 DOI: 10.1038/ncb2566 Figure S1 CDKL5 protein expression pattern and localization in mouse brain. (a) Multiple-tissue western blot from a postnatal day (P) 21 mouse probed with an antibody against CDKL5.
Supplementary Figure 1. Generation of knockin mice expressing L-selectinN138G. (a) Schematics of the Sellg allele (top), the targeting vector, the
 Schematics of the Sellg allele (top), the targeting vector, the") Supplementary Figure 1. Generation of knockin mice expressing L-selectinN138G. (a) Schematics of the Sellg allele (top), the targeting vector, the targeted allele in ES cells, and the mutant allele in
Supplementary Figure 1. Generation of knockin mice expressing L-selectinN138G. (a) Schematics of the Sellg allele (top), the targeting vector, the targeted allele in ES cells, and the mutant allele in
Supplementary Figure 1. Baf60c and baf180 are induced during cardiac regeneration in zebrafish. RNA in situ hybridization was performed on paraffin
 Supplementary Figure 1. Baf60c and baf180 are induced during cardiac regeneration in zebrafish. RNA in situ hybridization was performed on paraffin sections from sham-operated adult hearts (a and i) and