A Systems Biology Approach Identifies FUT8 as a Driver of Melanoma Metastasis
|
|
|
- Calvin Welch
- 6 years ago
- Views:
Transcription
, eva.hernando-monge@nyumc.org (E.H.) In Brief Using a systems-based approach to assess glycosylation in matched primary and metastatic melanoma samples, Agrawal et al.")
1 Article A Systems Biology Approach Identifies FUT8 as a Driver of Melanoma Metastasis Graphical Abstract Authors Praveen Agrawal, Barbara Fontanals-Cirera, Elena Sokolova,..., David Fenyö, Lara K. Mahal, Eva Hernando Correspondence lkmahal@nyu.edu (L.K.M.), eva.hernando-monge@nyumc.org (E.H.) In Brief Using a systems-based approach to assess glycosylation in matched primary and metastatic melanoma samples, Agrawal et al. find increased core fucosylation mediated by FUT8 in metastatic melanoma. FUT8 facilitates invasion and tumor dissemination, in part due to reduced cleavage of corefucosylated L1CAM. Highlights d d Primary and metastatic melanoma display distinct core and a-1,2 fucosylation FUT8 promotes melanoma metastasis Data Resources GSE8401 GSE15605 GSE46517 GSE7553 d d FUT8 is transcriptionally controlled by TGIF2 FUT8-mediated core fucosylation alters L1CAM proteolytic cleavage and cell invasion Agrawal et al., 2017, Cancer Cell 31, June 12, 2017 ª 2017 Elsevier Inc.
2 Cancer Cell Article A Systems Biology Approach Identifies FUT8 as a Driver of Melanoma Metastasis Praveen Agrawal, 1,2,3 Barbara Fontanals-Cirera, 1,2 Elena Sokolova, 1,2 Samson Jacob, 4,5 Christopher A. Vaiana, 3 Diana Argibay, 1,2 Veronica Davalos, 1,2 Meagan McDermott, 3 Shruti Nayak, 4 Farbod Darvishian, 1,2 Mireia Castillo, 7 Beatrix Ueberheide, 4 Iman Osman, 2,6 David Fenyö, 4,5 Lara K. Mahal, 2,3, * and Eva Hernando 1,2,8, * 1 Department of Pathology 2 Interdisciplinary Melanoma Cooperative Group, Perlmutter Cancer Center New York University School of Medicine, New York, NY 10016, USA 3 Biomedical Chemistry Institute, Department of Chemistry, New York University, New York, NY 10003, USA 4 Department of Biochemistry and Molecular Pharmacology 5 Institute for Systems Genetics 6 Department of Dermatology New York University School of Medicine, New York, NY 10016, USA 7 Department of Pathology, Icahn School of Medicine at Mount Sinai, Mount Sinai Health System, New York, NY 10029, USA 8 Lead Contact *Correspondence: lkmahal@nyu.edu (L.K.M.), eva.hernando-monge@nyumc.org (E.H.) SUMMARY Association of aberrant glycosylation with melanoma progression is based mainly on analyses of cell lines. Here we present a systems-based study of glycomic changes and corresponding enzymes associated with melanoma metastasis in patient samples. Upregulation of core fucosylation (FUT8) and downregulation of a-1,2 fucosylation (FUT1, FUT2) were identified as features of metastatic melanoma. Using both in vitro and in vivo studies, we demonstrate FUT8 is a driver of melanoma metastasis which, when silenced, suppresses invasion and tumor dissemination. Glycoprotein targets of FUT8 were enriched in cell migration proteins including the adhesion molecule L1CAM. Core fucosylation impacted L1CAM cleavage and the ability of L1CAM to support melanoma invasion. FUT8 and its targets represent therapeutic targets in melanoma metastasis. INTRODUCTION The incidence of melanoma in the western world doubles every 20 years (Giblin and Thomas, 2007). Despite recent approval of new therapies (i.e., BRAF, MEK, and immune checkpoint inhibitors), metastatic melanoma remains, for the most part, an incurable disease. Identification of determinants of melanoma metastasis is a key step toward effectively controlling tumor progression. Aberrant glycosylation is often observed as a hallmark of cancer and is not just a consequence, but also a driver of malignant phenotype, directly impacting key processes supporting tumor progression and metastasis, including cell adhesion, motility, invasion, and immune evasion (Bird-Lieberman et al., 2012; Christiansen et al., 2014; Meany and Chan, 2011; Pinho and Reis, 2015; Stowell et al., 2015) (Ciborowski and Finn, 2002; Gaziel-Sovran et al., 2011; Sackstein et al., 2008). Glycosylation is controlled by the actions of glycosyltransferases and glycosidases on glycoproteins and/or lipids. Differential expression of these enzymes in cancer produces glycoproteins with specific cancer-associated alterations in glycans. Alterations in glycosyltransferase expression have been associated with both pro-metastatic and metastasis suppressor functions (Christiansen et al., 2014). Currently, few systematic studies of glycans in cancer exist to sort out these roles, none related to melanoma. In general, glycomic studies on cancer to date fall short of pinpointing enzymes responsible for the biosynthesis Significance Our work, which is a systematic attempt to identify key glycosylation changes associated with metastasis in melanoma patient samples and map them onto enzymes, revealed the fucosyltransferase FUT8 as an anti-tumor target for the prevention and treatment of metastases. Using multiple state-of-the-art complementary approaches, we characterized the role of FUT8 in melanoma metastasis, cementing core fucosylation as a critical agent in adaptation of cancer cells to a new host environment, such as the metastatic site, and identifying specific target proteins whose aberrant core fucosylation confers aggressive behavior to melanoma cells. 804 Cancer Cell 31, , June 12, 2017 ª 2017 Elsevier Inc.

 Validation Lectin fluorescence, IHC")

 HAA CAA GNA GNA old AIA MNA-G MPA SNA TJA-I")


3 A Lectin microarray analysis of clinical melanoma samples paired primary:metastatic B MET Primary Mapping of glycans to identify candidates glycogenes Glycogenome analysis (melanoma GEO datasets) Validation Lectin fluorescence, IHC Upstream regulation In vitro mini-screen In vivo function Target identification SBA PSL PTA anti-sialyl Lewis SNA II α-1,2 fucose PNA TJA II α-1,2 fucose UEA-I HPA VVA CSA VVA (mann) HAA CAA GNA GNA old AIA MNA-G MPA SNA TJA-I α-2,6 sialic acid Calsepa MNA-M LcH PSA Core fucosylated DSA EY DSA Vector PolyLacNAc WGA EY WGA Vector C Lectinarray Glycogene expression TCGA Xu Riker Lectin/glycogene PSA/FUT8 LcH/FUT8 DSA/MGAT4A SNA/ST6GAL2 DSA/MGAT5 TJA-I/ST6GAL2 SNA/ST6GAL1 TJA-I/ST6GAL1 DSA/MGAT2 WGA/B3GNT2 DSA/B3GNT2 PSL/ST6GAL1 PSL/ST6GAL2 DSA/B3GNT3 WGA/B3GNT3 DSA/B3GNT4 WGA/B3GNT4 TJA-II/FUT1 UEA-I/FUT1 SNAII-FUT1 TJA-II/FUT2 UEA-I/FUT2 SNA-II/FUT2 High in MET Low in MET D E SkMel147 WM * * 300 * * * * # invading cells 5 R R 0 R sintc sifut8 FUT8 GDP simgat2 simgat4a sist6gal1 R sist6gal2 R R sifut1 sifut2 LcH PSA F # invading cells 0 sintc sifut8 sifut2 simgat2 simgat4a sist6gal1 sist6gal2 sifut1 G LcH UEA-I DAPI LcH UEA-I DAPI MET Primary R N-core fucosylation N-Acetylglucosamine N-Acetylgalactosamine R FUT1/ FUT2 GDP α-1,2 terminal fucosylation on Mannose Galactose UEA-I R Fucose TJA-II SNA-II R H MET Primary Fluorescence (x10 7, a.u.) LcH ** 0.0 Primary MET Fluorescence (x10 6, a.u.) UEA-I * c 2 0 Primary MET IHC score 200 ** Primary MET (legend on next page) Cancer Cell 31, , June 12,
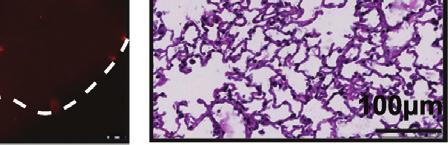
4 of observed aberrant glycan motifs and/or their relevant glycoprotein targets (Sugahara et al., 2012). Glycosylation remains an understudied portion of cancer biology due to issues including difficulties in glycan analysis and complex biosynthetic pathways (Agre et al., 2016; Rakus and Mahal, 2011). Although there has been much interest in the role of glycosylation in melanoma metastasis, the vast majority of glycan analyses in melanoma has been limited to mouse models and tumor cell lines, where aberrant glycosylation has been linked to cancer progression (Christiansen et al., 2014; Laidler et al., 2006). The relevance of these data to melanoma patient samples is unknown, as there is little data on glycosylation in clinical cohorts, mainly due to the small size of primary melanomas and limitations in the analytical techniques used (Christiansen et al., 2014; Kinoshita et al., 2014; Rakus and Mahal, 2011). Previously, our group reported on the role of aberrant glycosylation in promoting melanoma cell invasion and immunosuppression (Gaziel-Sovran et al., 2011). We found that mir-30b/d, upregulated in a patient-derived signature associated with metastasis, drives tumor dissemination by targeting both GALNT7 and GALNT1, enzymes that are initiators of canonical O-linked glycan biosynthesis. This suggests that aberrant glycosylation can drive melanoma metastasis and points to the need for a more systematic study of glycosylation in clinical samples of melanoma. RESULTS Systematic Dissection of the Melanoma Glycome and Associated Glycogenes in Clinical Samples Reveals Altered Protein Fucosylation Linked to Metastatic Behavior Although glycosylation has been studied in melanoma, these studies have focused on mouse models and tumor cell lines to the exclusion of clinical samples. The relevance of these studies to melanoma progression in patients is thus largely unknown (Christiansen et al., 2014). To examine the relationship between melanoma progression and altered glycosylation in a clinical cohort we utilized lectin microarrays (Figure 1A), our highthroughput technology for glycomic analysis (Bird-Lieberman et al., 2012; Pilobello et al., 2007). Our microarrays include 102 lectin and antibody probes, providing specific information on the glycan repertoire of cellular glycoproteins (Table S1) (Pilobello et al., 2013). We performed dual-color lectin microarray analysis on formalin-fixed paraffin-embedded (FFPE) patientmatched primary and metastasis tissues (n = 17 patients; n = 34 samples total). Samples were macrodissected to remove contamination of the melanoma sample by surrounding tissues such as skin. Glycomic profiles of the melanoma samples resolved into multiple clusters of primary and metastatic melanomas based on lectin binding (Figure S1A). A closer analysis of the data identified a subset of lectins whose binding differentiated between primary and metastatic melanoma (paired t test, p < 0.05; Figure 1B). In general, metastatic tumors showed higher levels of poly/multiantennary-n-acetyl-lactosamine (bound by lectins: DSA, WGA), a-2,6 sialic acids (SNA and TJA-I), and core fucose (a-1,6 fucose; PSA, LcH), and lower levels of a-1,2 fucose structures (UEA-I, TJA-II, and SNA-II), than the corresponding primary samples (Figure 1B). To gain insight into the biosynthetic underpinnings of these changes, we correlated our lectin microarray data with publicly available transcriptomic data, including The Cancer Genome Atlas (TCGA) (Riker et al., 2008; Xu et al., 2008), focusing on glycogenes (glycosyltransferases) known to be involved in the synthesis of glycan epitopes bound by lectins discriminating between primary and metastatic melanoma (Figure 1C). Consistent with our observed glycan changes, metastatic melanomas displayed higher expression levels of N-glycan branching enzymes (MGAT2, MGAT4A), polylactosamine extension enzymes (B3GNT2), sialyltransferases (ST6GAL1, ST6GAL2), and the core fucosyltransferase FUT8 than primary melanomas, and lower levels of enzymes responsible for a-1,2 fucosylation (FUT1, FUT2) across multiple datasets (Figure 1C). Altered expression of these glycogenes would explain the changes in glycan structures associated with melanoma progression revealed by our glycomic analysis. We hypothesized that the glycosylation patterns observed in metastasis could contribute to the aggressive behavior of melanoma. Therefore, we assessed the effects of silencing identified glycogenes on cellular invasion, a biological property required by tumors for metastasis. We conducted a small interfering RNA mini-screen for select glycosyltransferases identified as putative pro-metastatic (MGAT2, MGAT4A, FUT8, Figure 1. Systematic Dissection of the Melanoma Glycome and Associated Glycogenes in Clinical Samples Reveals Altered Protein Fucosylation Linked to Metastatic Behavior (A) Schematic illustration of our systems biology approach to identify glycosylation enzymes involved in melanoma metastasis and their corresponding targets. (B) Heatmap of lectin clustering of patient-matched primary and metastatic (MET) melanoma FFPE tissues (n = 17 pairs) by ratiometric lectin microarray, p < Pink, log2(s/r) > log2(smedian/rmedian); blue, log2(smedian/rmedian) > log2(s/r). (C) Correlation of lectin data with glycogene expression. Fold change in selected lectin binding in melanoma metastasis versus primary tissues using lectin microarray is shown. Fold change in expression of corresponding glycogenes is also shown, p < TCGA ( Xu (GSE8401) and Riker (GSE7553) datasets. (D) Trans-well invasion assay on SkMel147 and WM3211 cells transfected with non-targeting control (sintc) or smart pool small interfering RNAs (sirnas) (50 nm) against selected glycogenes (mean ± SD of three replicates), p < (E) N-linked a-1,6 core-fucosylated glycan structure generated by FUT8 and recognized by LcH and PSA lectins. (F) a-1,2 terminal-fucosylated glycan structure generated by FUT1 and FUT2 and recognized by UEA-I, TJA-II, and SNA-II lectins. (G) Representative images of LcH and UEA-I lectin multiplex fluorescence microscopy of primary and metastatic melanomas (n = 18 for LcH, n = 19 for UEA-I). Biotinylated LcH-DY-647-streptavidin- (red), FITC-UEA-I- (green) and DAPI-stained sections. Scale bar, 100 mm. Dot plots represent the average fluorescence intensity of five fields per image for each lectin. (H) Representative images of IHC staining with a-fut8 antibody in 17 paired primary and metastatic melanomas show a peri-nuclear staining pattern (Fast Red counterstaining). IHC score was calculated combining the signal intensity and percentage of positive cells within the section. Dot plot shows distribution of FUT8 IHC score in primary and metastatic melanoma. Scale bar, 10 mm. Two-tailed paired (B and H), and unpaired (C, D, and G) t test. *p = 0.01 to 0.05, **p = to See also Figure S Cancer Cell 31, , June 12, 2017
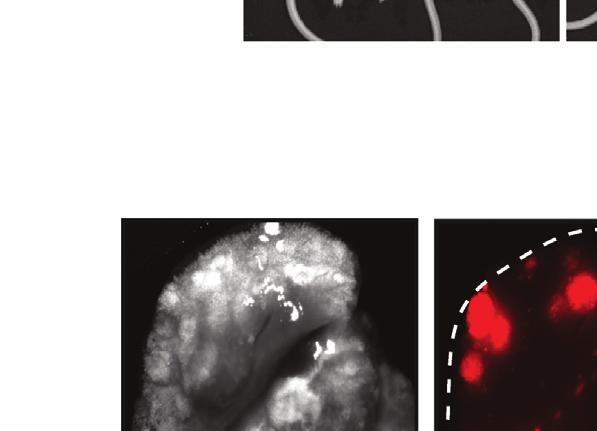
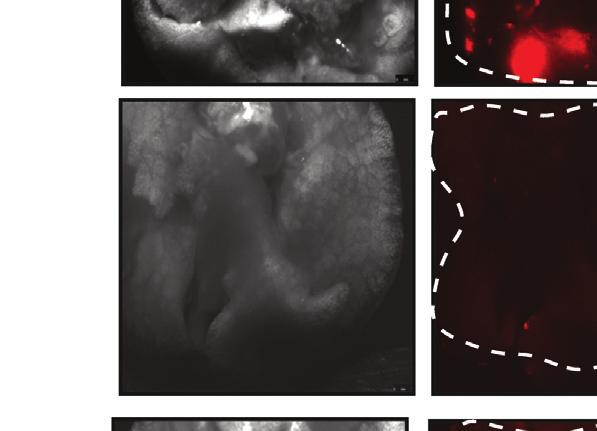
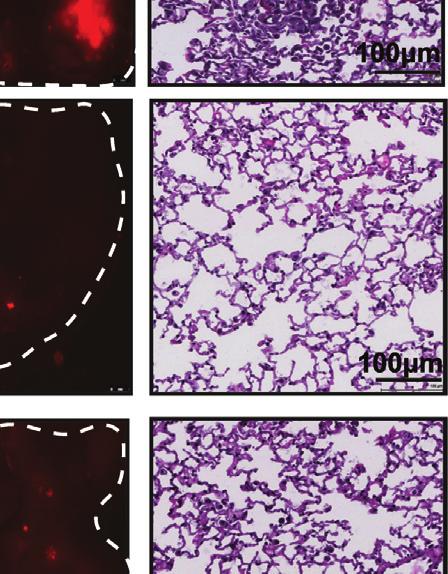
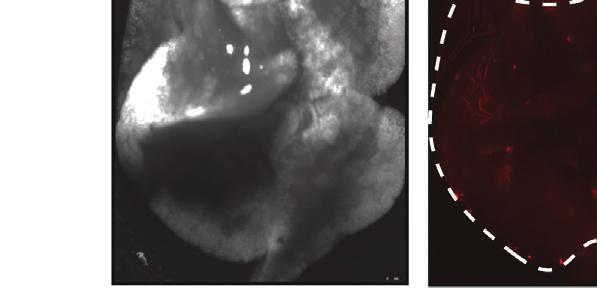
5 ST6GAL1, ST6GAL2, B3GNT2, B3GNT3) or anti-metastatic (FUT1, FUT2) factors based on lectin microarray or glycogene expression data. Studies were conducted in two human melanoma cell lines (SkMel147 and WM3211) (Figures 1D and S1B S1E). FUT8 knockdown consistently suppressed the invasion capacity of melanoma cells, while silencing of FUT1 or FUT2 had the opposite effect (Figure 1D). FUT8 is the only enzyme known to generate a-1,6-fucosylated structures on the core of N-glycans, the epitope recognized by the lectins LcH and PSA (Figure 1E). In contrast, FUT1 and FUT2 can generate a-1,2-fucosylated structures both at the termini of N-acetyllactosamine and on galactose linked with N-acetylgalactosamine, epitopes recognized by UEA-I and TJA-II/SNA-II lectins, respectively (Figure 1F). Data mining of publicly available transcriptomic datasets from five independent clinical cohorts, including TCGA (Kabbarah et al., 2010; Raskin et al., 2013; Riker et al., 2008; Xu et al., 2008), revealed consistently higher mrna levels for FUT8 and lower levels for FUT1 and FUT2 in metastatic melanoma tissues in comparison with primary (Figure S1F). The remarkable consistency of these findings supports an antithetical role for the two forms of fucosylation (a-1,6 or core fucose, pro-metastatic; a-1,2 fucose, anti-metastatic ) in clinical melanoma progression. We validated the differential presence of core-fucosylated and a-1,2-fucosylated structures in an independent cohort of primary and metastatic samples using an orthogonal method, fluorescent lectin staining. In agreement with our lectin microarray results, metastatic sections displayed significantly higher LcH binding (p < 0.01) and decreased UEA-I staining (p < 0.05) (Figure 1G). Consistent with the observed increase in LcH binding, immunohistochemistry (IHC) analysis of the paired tissues confirmed higher FUT8 expression in metastatic tissues as demonstrated by a perinuclear granular staining pattern (Figures 1H, S1G, and S1H). In sum, our systems-based analysis identified the core fucosyltransferase FUT8, which has no known role in melanoma, as a modulator of in vitro cellular invasion and potential mediator of melanoma metastasis. We focused our functional and mechanistic studies on FUT8, as a candidate pro-metastatic gene, which represents a more suitable therapeutic target than fucosyltransferases FUT1 and FUT2. FUT8 Silencing Decreases In Vitro Cell Invasion and In Vivo Melanoma Metastasis To further investigate the role of core fucosylation in melanoma metastasis, we silenced FUT8 in the human metastatic melanoma cell lines 113/6-4L (hereafter, 4L) and SkMel147, both of which express high endogenous levels of FUT8 (Figure S2A). In brief, 4L and SkMel147 cell lines were stably transduced with lentivirus carrying one of two independent short hairpin RNAs targeting FUT8 (FUT8 sha or shb) or a non-targeting control (shntc). As expected, FUT8 knockdown, confirmed by both qrt-pcr, western blot, and IHC (Figures 2A, 2B, and S2B), resulted in reduced core fucosylation (Figure 2C). FUT8 knockdown had no effect on cell proliferation (Figure 2D) but attenuated by 60% the ability of both 4L and SkMel147 cells to invade through Matrigel in a trans-well invasion assay (Figure 2E). We next determined whether aberrant FUT8 expression promotes melanoma aggressive behavior in vivo using a xenograft model of metastasis. We injected 4L cells stably transduced with lentiviral particles carrying an mcherry/luciferase reporter and one of the two independent small hairpin RNA (shrna) against FUT8 (FUT8 sha and shb) or control (shntc) into the flanks of immunocompromised NOD/Shi-scid/IL-2Rgamma null (NSG) mice, and monitored them for local tumor growth and metastasis (Figure 3A). All cell types started to form measurable tumors at primary implantation sites one week later. In concordance with our observations in vitro, there was no significant difference in tumor growth between shntc and either FUT8 sha- or FUT8 shb-transduced cells (Figure 3B). Lower FUT8 transcript (Figure 3C) and reduced core fucosylation levels (Figure S3) confirmed effective FUT8 knockdown by both shrnas in tumors. After surgically resecting the lateral tumors (28 days post-injection), we monitored metastatic dissemination by bioluminescence imaging (BLI). Silencing FUT8 consistently inhibited the metastatic potential of 4L cells, shown by reduced luminescence in both lung and lymph nodes (Figures 3D 3F). Forty-two days post-injection, we euthanized the mice and dissected lungs and lymph nodes for histology (Figures 3G 3I). Mice injected with FUT8 sha or FUT8 shb 4L cells exhibited significantly reduced lung tumor burden and total number of micrometastases per lung (p < 0.05) (Figures 3G 3I). Our findings provide compelling evidence that FUT8 silencing suppresses the ability of melanoma cells to colonize distal organs. FUT8 Silencing Impairs the Growth of Established Metastasis In Vivo Next we examined whether FUT8 is required for the maintenance or growth of existing metastasis using a model based on intracardiac instillation of tumor cells (Morsi et al., 2013). We generated 4L melanoma cells stably transduced with lentiviral particles carrying either a doxycycline (DOX)-inducible shrna targeting FUT8 (ptripz/fut8 shc) or a scrambled control (ptripz/shscr) and a luciferase reporter vector constitutively expressing GFP. This system couples DOX-regulated red fluorescent protein expression to shrna induction. In the presence of DOX, 4L FUT8 shc cells display decreased FUT8 mrna and protein (Figure 4A) and reduced cell invasion in comparison with shscr cells, without effects on cell proliferation (Figures 4B and 4C). We performed in vivo intracardiac injection of ptripz/ shscr or ptripz/fut8 shc in NSG mice and assessed for metastatic dissemination by BLI (Figure 4D). Established metastases were detected 16 days post-tumor cell instillation. At this point, mice within both groups (ptripz/shscr or ptripz/fut8 shc) were subdivided into two groups for +/ DOX feed (Figure 4D). DOX-fed mice injected with FUT8 shc-4l cells displayed significantly reduced metastatic burden in comparison with the corresponding DOX mice or mice injected with shscr (+/ DOX), as observed by BLI (p < 0.05) (Figures 4E and 4F). Mice were euthanized 27-days post-injection, and ex vivo fluorescence imaging revealed a considerably lower metastatic burden in multiple organs (i.e., liver, brain, kidney) in the group of DOX-fed mice injected with 4L FUT8 shc cells (Figures 4G and 4H). The DOX-induced FUT8 shc-4l injected mice showed much smaller liver metastatic foci and fewer metastatic lesions in the kidneys and brains (data not shown). Moreover, the fraction of mice that developed brain metastases or kidney metastases at termination of the experiment was lower in the DOX-induced FUT8 Cancer Cell 31, , June 12,
 FUT8 levels in 4L and SkMel147 cells stably expressing shrna targeting FUT8 (FUT8 sha or FUT8 shb) or shntc were assessed by")
 LcH fluorescence microscopy of 4L and SkMel147 cells transduced with FUT8 sha or FUT8 shb or shntc.")
 Cell proliferation assay of 4L and SkMel147 cells transduced with FUT8 sha or FUT8 shb or shntc and analyzed by CellTiter-Glo, three replicates per condition.")
6 A B C D E Figure 2. FUT8 Silencing Reduces Melanoma Cells Invasiveness In Vitro (A and B) FUT8 levels in 4L and SkMel147 cells stably expressing shrna targeting FUT8 (FUT8 sha or FUT8 shb) or shntc were assessed by real-time qpcr (A) and western blotting (B). qpcr graph shows average relative expression normalized to GAPDH, three replicates per condition. qpcr data and western blot images are representative of three independent experiments. (C) LcH fluorescence microscopy of 4L and SkMel147 cells transduced with FUT8 sha or FUT8 shb or shntc. Right panel shows quantitation of fluorescence intensity of representative images. Data from five random areas of two biological replicates were averaged to generate graphs. Scale bar, 100 mm. (D) Cell proliferation assay of 4L and SkMel147 cells transduced with FUT8 sha or FUT8 shb or shntc and analyzed by CellTiter-Glo, three replicates per condition. Data shown are representative of two independent experiments. (E) Trans-well Matrigel invasion by 4L and SkMel147 cells transduced with FUT8 sha or FUT8 shb or shntc. Invading cells were quantified by counting the number of 4L and SkMel147 cells that invaded into the basal side of Matrigel-coated trans-well inserts after 36 and 12 hr respectively, n = 5 fields per replicate; 3 replicates per condition, data shown are representative of three independent experiments. Scale bar, 100 mm. *p = 0.01 to Data are presented as mean ± SD. Two-tailed unpaired t test. See also Figure S2. shc group (3/9 for brain and 6/9 for kidney) than in the absence of DOX (8/9 for brain and 9/9 for kidney) (Figure 4H). These data demonstrate a requirement for FUT8 in metastatic colonization and supports FUT8 inhibition as a viable therapeutic strategy against advanced melanoma. TGIF2 Regulates FUT8 Transcription We sought to identify genomic or epigenetic changes or upstream transcriptional regulators of FUT8 potentially responsible for its upregulation in metastatic melanoma. Analysis of FUT8 mutations and amplifications showed a very low frequency of alterations in this gene (Figure S4A and data not shown). In addition, analysis of the methylation status showed that all the CpG islands in the FUT8 promoter are unmethylated in both primary and metastatic melanomas (b value 0; Figures S4B and S4C). We therefore turned our attention to transcriptional control. We identified a candidate list of transcriptional regulators based on both in silico analysis of transcription factors (TFs) predicted to bind the FUT8 promoter using the MatInspector software (Cartharius et al., 2005) and those shown to physically bind the FUT8 promoter in other cellular systems using the ChIP Enrichment Analysis database (Lachmann et al., 2010). From this list, we selected a subset of TFs whose expression correlated with FUT8 levels (p < 0.2, data not shown) in multiple melanoma datasets including TCGA (Raskin et al., 2013; Riker et al., 2008; Xu et al., 2008) (TGIF2, SMAD3, NFKB1, SOX10, IRF1, FOXA2, RUNX1, SOX2). We examined the effect of silencing these TFs on FUT8 expression in 4L and SkMel147 melanoma cell lines (Figures 5A, 5B, and S4D). Depletion of transforming growth factor b (TGF-b)-induced factor homeobox 2 (TGIF2) consistently resulted in a 4-fold reduction in FUT8 levels and concomitant loss of core fucosylation (Figures 5A 5D). We next tested if 808 Cancer Cell 31, , June 12, 2017


7 A D B C E F G H I (legend on next page) Cancer Cell 31, , June 12,
8 TGIF2 silencing would recapitulate the effect of FUT8 suppression on melanoma cell invasion. Indeed, sitgif2-transfected 4L melanoma cells exhibited a 5-fold reduction of in vitro cell invasion as compared with sintc-treated cells (Figure 5E). To determine whether the regulation of FUT8 expression by TGIF2 is direct, we assessed the binding of TGIF2 to the FUT8 promoter (Yamaguchi et al., 2000), which is predicted to contain a consensus-binding site in exon 1 (Figure 5F). Chromatin immunoprecipitation (ChIP) of TGIF2 followed by qpcr using three different sets of primers spanning the TGIF2 putative binding site in the FUT8 promoter showed a 6- to 10-fold enrichment in FUT8 signal over ChIP with non-specific IgG in 4L cells (Figure 5G). Meanwhile, negative controls, GAPDH, HPRT1, and primers spanning FUT8 distal regions at exons 5 and 8, showed no significant enrichment. TGIF2 binding to the FUT8 promoter was found to correlate with FUT8 expression, as low FUT8-expressing melanoma cell line SkMel85 showed no enrichment in TGIF2 ChIP compared with high FUT8-expressing SkMel147 and 4L cells (Figures S4E and S4F). To confirm the ability of TGIF2 to control FUT8 expression, we tested the effects of TGIF2 knockdown on luciferase activity driven by a FUT8 promoter construct encompassing the TGIF2 binding site in HEK293T cells. We observed a significant reduction in luciferase activity (p < 0.05) (Figure 5H) upon TGIF2 silencing, with concomitant reduction of FUT8 mrna levels measured by qpcr (Figure S4G). Moreover, TGIF2 and FUT8 mrna levels positively correlate (R = 0.57, p < ) in patient tissues (Figure 5I), and multiple GEO datasets revealed higher TGIF2 expression in metastatic melanoma compared with primary (Figure S4H). Overall, our data reveal TGIF2 as a key regulator of FUT8 transcriptional induction in melanoma metastasis and an upstream contributor to melanoma aggressive behavior. Identification of Core-Fucosylated Glycoproteins in Melanoma Reveals Regulators of Invasion and Metastasis To identify core-fucosylated proteins that could mediate the effects of FUT8 dysregulation in metastatic melanoma, we performed proteomic analysis of core-fucosylated membrane proteins. We prepared membrane extracts of three melanoma cell lines and enriched for core-fucosylated proteins using lectin chromatography with LcH (Figure 6A). Lectin blot analysis of affinity-enriched protein fractions confirmed an enrichment of core-fucosylated proteins (Figure S5A). Mass spectrometric analysis identified about 1,100 proteins in each enriched fraction, and a matrix of 471 overlapping proteins present in all three lines was created. After data filtration using median filtering and removal of contaminant proteins (known to be unglycosylated), such as ribosomal proteins, tubulins, and heat-shock proteins, 183, 221, and 152 candidate proteins were identified in the LcH enrichment of 4L, SkMel147 and MeWo membrane proteins respectively, 114 of which were common to all three cell lines (Figure 6B). Gene ontology analysis (DAVID) performed on the common proteins revealed enrichment in functional categories comprised of N-linked glycosylation, gangliosides, membrane and integrin (Figure S5B), and biological processes relevant to metastasis such as cell migration and locomotion control mechanisms (Figure 6C). Proteins identified as LcH bound that are involved in migration and adhesion include neural cell adhesion molecule L1 (L1CAM), integrins a4, 6, and V, integrin B1, ADAM10, laminins b1 (LAMB1) and g1 (LAMC1), pro-low-density lipoprotein receptor-related protein 1 (LRP1), cell surface glycoprotein MUC18 (MCAM), plexin-a1, plexin-b2, and neuropilin 2 (NRP2) (Table S2). To validate our proteomic analysis, we further examined the glycosylation state of L1CAM, NRP2, LAMB1, integrin B1, and ADAM10. LcH lectin enrichment followed by western blot showed reduced L1CAM, NRP2, LAMB1, integrin B1, and ADAM10 levels in sifut8- compared with sintc-transfected 4L and SkMel147 (Figures 6D, S5C, and S5D), consistent with lower core fucosylation on those proteins, while input show no differences in the expression of these proteins. Consistently, immunoprecipitation (IP) of L1CAM or NRP2 followed by LcH blot showed reduced LcH binding to L1CAM or NRP2 proteins in sifut8- compared with sintc-transfected 4L and SkMel147 (Figures 6E and S5E). The observed differences disappeared upon PNGase treatment, which removes all forms of N-linked glycosylation (Figure 6E). Western blots confirmed equal amounts of IP input in each condition (Figures 6E and S5E). Thus, both proteins were confirmed as core-fucosylated in line with our proteomic analysis. L1CAM Is a Mediator of the Pro-invasive Effects of FUT8 L1CAM is a highly glycosylated protein known to regulate cell attachment, invasion, and migration in several cancers (Altevogt et al., 2016; Valiente et al., 2014), and may promote melanoma progression (Meier et al., 2006). Thus, it is a plausible candidate as a mediator of the pro-invasive effects of FUT8. In keeping with the known impact of L1CAM on cell invasion, ectopic expression Figure 3. FUT8 Silencing Decreases In Vivo Melanoma Metastasis (A) Schematic representation of the in vivo xenograft experiment. (B) Primary tumor growth of 4L cells transduced with FUT8 sha, FUT8 shb, or shntc following subcutaneous injection into NSG mice (n = 9 mice per condition; ns, not significant). Data is presented as mean ± SD. (C) Real-time qpcr of FUT8 expression in flank tumors resected at day 25 post-injection. Data shown is representative of flank tumors from two mice per group, mean ± SD. (D) Representative images of whole-body in vivo BLI of mice injected with 4L cells transduced with FUT8 sha, FUT8 shb, or shntc at day 42 post-injection (17 days post-resection of lateral tumors). (E) Average radiance as measured by in vivo BLI at 27, 35, and 42 days post-injection of flank tumors (n = 9 mice per condition). (F) Quantitation of BLI at day 42 (n = 9). (G) Ex vivo bright-field (BF) and fluorescent (RFP) microscopic images of mouse lungs at termination of the experiment and corresponding H&E-stained sections. Scale bar, 100 mm. White dotted ovals mark whole organ. (H) Average fluorescence intensity of macrometastases per lung. Fluorescence intensity of whole lung was measured (n = 9/group). (I) Dot plots show the distribution of the number of metastases per section of lung (two sections per lung). Two-tailed unpaired t test. *p = 0.01 to 0.05 and **p = to See also Figure S Cancer Cell 31, , June 12, 2017

9 A B C D E F G H (legend on next page) Cancer Cell 31, , June 12,
10 of L1CAM in melanoma cells expressing low (WM3248) to moderate (MeWo) L1CAM levels triggered a modest but significant increase in in vitro cell invasion (p < 0.05) (Figures 7A, 7B, and S6A S6C). Concomitant FUT8 silencing, which resulted in reduced core-fucosylated L1CAM, counteracted the pro-invasive effects of L1CAM overexpression (Figures 7A, 7B, S6A, and S6B). These results suggest that core fucosylation is critical to L1CAM pro-invasive phenotype in melanoma. We next investigated whether FUT8 ectopic expression is able to promote melanoma cell invasion capacity and if core fucosylation of L1CAM contributes to that effect. FUT8 overexpression increased cell invasion 5-fold in a poorly invasive cell line (MeWo) and 2-fold in the highly invasive cell line 4L (Figures 7C and S6D). We confirmed that L1CAM exhibits increased core fucosylation in FUT8 overexpressing MeWo cells (Figure 7D). Silencing of L1CAM strongly counteracted the pro-invasive effects of FUT8 overexpression (Figures 7E, 7F, S6E, and S6F). As expected, FUT8 pro-invasive effects were also ablated by FUT8 silencing (Figures 7F and S6F). Overall, our data support core-fucosylated L1CAM as a key mediator of FUT8 pro-metastatic effects. Glycosylation can affect protein folding, activation and the access of proteases to cleavage sites (Cheng et al., 2015; Sola and Griebenow, 2009). L1CAM is cleaved by both ADAM10 and plasmin (Maretzky et al., 2005). In particular, cleavage of L1CAM by plasmin inhibits its ability to mediate cell invasion and metastatic outgrowth (Valiente et al., 2014). We hypothesized that altered core fucosylation might alter L1CAM cleavage by proteases, impacting melanoma invasive behavior. Indeed, we observed that MeWo cells overexpressing FUT8 show lower levels of a 85 kda L1CAM product when compared with controls (Figure 7G). This cleavage fragment disappears upon L1CAM knockdown, confirming it as a L1CAM-specific product. Silencing of FUT8 in SkMel147 cells (expressing high FUT8 levels) results in increased levels of the 85 kda L1CAM product compared with sintc (Figures 7H and 7I). Treatment of SkMel147 with a plasmin inhibitor, a-2 antiplasmin, resulted in a reduced, 85 kda, L1CAM fragment (Figures 7H and 7I). Silencing of plasminogen activator, which converts plasminogen into plasmin, reduced the levels of this 85 kda L1CAM fragment in SkMel147 cells (Figures S6G and S6H), confirming this fragment as a plasmin cleavage product. To further support that core fucosylation inhibits L1CAM cleavage, we performed in vitro plasmin treatment in control and FUT8-overexpressing MeWo cells. In the presence of plasmin, a significant increase in cleaved L1CAM (85 kda) was observed in control cells, while in FUT8-overexpressing MeWo cells L1CAM was protected against cleavage (Figures 7J and 7K). Overall, our results suggest that core fucosylation is critical to L1CAM function through modulation of plasmin cleavage and that L1CAM is a major mediator of the pro-metastatic role played by core fucosylation (i.e., FUT8) in melanoma. DISCUSSION Although it has long been speculated that glycosylation plays important roles in melanoma progression, there are no comprehensive glycomic analyses of clinical samples to support this assertion (Christiansen et al., 2014). The biosynthesis of glycans is an intricate process requiring the coordinated action of multiple glycosyltransferases and glycosidases to synthesize discrete structures (Cummings and Pierce, 2014; Moremen et al., 2012). There is currently little understanding of how glycan biosynthesis is controlled (Nairn et al., 2012), or which enzymes are important in the biosynthesis of specific epitopes underlying clinical pathologies, hindering the development of glycosylation-based therapeutic strategies (Dalziel et al., 2014; Dube and Bertozzi, 2005). Here we have taken a systematic, multidisciplinary approach to identify glycomic changes and the underlying glycosyltransferases associated with melanoma metastasis in patient samples. Our analysis revealed a-1,6 fucosylation, mediated by FUT8, is functionally important for melanoma invasion and provided insight into how core fucosylation impacts melanoma metastasis. Glycomic analysis of clinical melanoma has long been impaired by the small quantities of sample afforded by primary melanoma (Christiansen et al., 2014). Lectin microarray analysis requires as little as 50 mg of FFPE tissue, enabling a systematic analysis of glycosylation in clinical samples. Our analysis revealed strong discrimination between primary melanomas and metastases based on glycosylation, with several glycans (a-2,6 sialic acid, poly/multiantennary LacNAc) following predictions from model systems (Kinoshita et al., 2014; Pinho and Reis, 2015). However, the changes in fucosylation were surprising. In recent work it was reported that TF ATF2 promotes melanoma metastasis by suppressing global fucosylation (Lau et al., 2015). While we observed a loss of a-1,2 fucosylation (UEA-I, TJA-II), we saw a marked increase in core fucosylation (a-1,6 fucose, LcH, PSA), arguing that the effects of fucose on metastasis are linkage dependent. In the ATF2 study, UEA-I, specific for a-1,2 fucosylation, was used as a global marker for fucose, and loss of UEA-I binding Figure 4. FUT8 Silencing Impairs the Growth of Established Metastasis In Vivo (A) Real-time qpcr and western blot of FUT8 levels in 4L melanoma cells stably transduced with DOX-inducible ptripz-shscr or ptripz-fut8 shc. qpcr graph shows average relative expression normalized to GAPDH, three replicates per condition. Data shown are representative of three independent experiments. (B) Cell proliferation assay of FUT8 shc or shscr-transduced 4L cells in the presence (1 mg/ml) or absence of DOX. Cell growth was analyzed by CellTiter-Glo, three replicates per condition. Data shown is representative of two independent experiments. (C) Number of FUT8 shc or shscr-transduced 4L cells that invaded into the basal side of Matrigel-coated trans-well inserts after 36 hr. n = 5 fields per replicate; 3 replicates per condition. Data shown is representative of three independent experiments. (D) Schematic representation of the in vivo metastasis assay with 4L melanoma cells stably transduced with DOX-inducible ptripz-shscr or ptripz-fut8 shc instilled by intracardiac injection into NSG mice (n = 4 mice per group in DOX and + DOX shscr, n = 9 mice per group in DOX and + DOX FUT8 shc). (E) Representative images of whole-body in vivo imaging 12 days post-dox treatment. (F) Average radiance after intracardiac injection of 4L cells followed over time. DOX treatment was started 16 days post-injection. (G) Ex vivo fluorescent microscopic images of mouse liver, kidney, and brain metastases at termination of the experiment. White dotted ovals mark organs. (H) Histogram showing the percentage of mice that developed brain or kidney metastases in each group of mice. Data are presented as mean ± SD in (A, B, and C). Two-tailed unpaired t test. *p = 0.01 to 0.05; ns, not significant. 812 Cancer Cell 31, , June 12, 2017
 Real-time qpcr of FUT8 mrna levels after silencing of candidate transcription factors in 4L (A) and SkMel147 (B) cell lines.")
 Silencing of TGIF2 decreases FUT8, as shown by western blot. GAPDH is used as a loading control.")

11 A B C D E F G H I Figure 5. TGIF2 Regulates FUT8 Transcription (A and B) Real-time qpcr of FUT8 mrna levels after silencing of candidate transcription factors in 4L (A) and SkMel147 (B) cell lines. qpcr graph shows average relative expression normalized to GAPDH, three replicates per condition. Data shown is representative of two independent experiments. (C) Silencing of TGIF2 decreases FUT8, as shown by western blot. GAPDH is used as a loading control. (D) LcH fluorescence microscopy of 4L cells transfected with NTC or TGIF2 sirna (50 nm). Lower panel shows quantitation of fluorescence intensity of representative images. Data from five random images of two biological replicates were averaged to generate graphs. Scale bar, 100 mm. (E) Trans-well Matrigel invasion assay on 4L cells transfected with NTC or TGIF2 sirna. Scale bar, 100 mm. n = 5 fields per replicate; 3 replicates per condition. Data shown is representative of three independent experiments. (legend continued on next page) Cancer Cell 31, , June 12,
 Schematic illustration of the experimental approach showing affinity enrichment of")
12 A B C D E Figure 6. Identification of Core-Fucosylated Glycoproteins in Melanoma Reveals Regulators of Invasion and Metastasis (A) Schematic illustration of the experimental approach showing affinity enrichment of core-fucosylated proteins by LcH lectin affinity chromatography. (B) Number of proteins identified by mass spectrometry analysis of the LcH-enriched fractions of 4L, SkMel147, and MeWo membrane proteins. (C) Gene ontology enrichment analysis (category of biological processes) of common core-fucosylated proteins in three cell lines. Also see Table S2. (D) LcH affinity chromatography of whole-cell lysate of 4L cells transfected with NTC or FUT8 sirna followed by western blot with a-l1cam or a-nrp2 antibody. Input shows no effect of FUT8 knockdown on L1CAM or NRP2 expression. (E) L1CAM and NRP2 immunoprecipitation from whole-cell lysates of 4L cells transfected with NTC or FUT8 sirna. Anti-L1CAM or anti-nrp2 immunoprecipitates were treated with or without PNGase F and blotted with biotinylated LcH or a-l1cam Ab1 (also referred as a-l1cam) or a-l1cam Ab2 or a-nrp2. L1CAM Ab1 preferentially recognizes glycosylated L1CAM while Ab2 preferentially recognizes non-glycosylated L1CAM. Experiments in (D and E) were performed in triplicate and representative images are shown. See also Figure S5. correlated with lower survival rates (Lau et al., 2015). These data are consistent with our lectin microarray analysis in which binding to UEA-I is lost with progression to metastasis. Mapping of candidate glycogenes from clinical transcriptomic datasets onto our lectin microarray data provided further evidence for the linkage-specific effects of fucosylation in (F) Schematic of the FUT8 promoter indicating the MatInspector-predicted binding site of TGIF2, the regions flanked by ChIP qpcr primers (Exon 1A, 1B, and 1C) and the transcription start site (TSS). (G) TGIF2 ChIP qpcr of the FUT8 promoter at the indicated (A, B, and C) regions in 4L cells. IgG, immunoglobulin. GAPDH, HPRT1, FUT8 exon 5, and FUT8 exon 8 served as negative controls for ChIP qpcr (mean ± SD of three replicates). (H) Promoter luciferase reporter assay to show pls-fut8 activity. Activity of the human FUT8 promoter was examined by co-transfection of the luciferase reporter construct pls-fut8 (100 ng) containing a 1,000 bp long region of the human FUT8 promoter with NTC or TGIF2 sirna (50 nm) in HEK293T cells. Relative luciferase activities were measured 24 hr after transfection (mean ± SD of three replicates). (I) Scatterplot shows positive co-relation of TGIF2 and FUT8 mrna levels in a melanoma dataset, r = 0.57, p < (Riker et al., 2008). Data are presented as mean ± SD in (A, B, D, and E). Two-tailed unpaired t test, *p = 0.01 to 0.05 and **p = to See also Figure S Cancer Cell 31, , June 12, 2017
 Western blot of L1CAM or FUT8 in WM3248 cells stably overexpressing L1CAM or control vector and transfected with NTC or FUT8 sirna.")
 Trans-well Matrigel invasion assay on WM3248 melanoma cells stably overexpressing L1CAM or control vector and transfected with NTC or FUT8 sirna.")
 Trans-well Matrigel invasion by MeWo melanoma cells stably overexpressing FUT8 or control vector. Scale bar, 100 mm. Western blot of FUT8 is also shown.")
 Western blot of FUT8 and L1CAM in MeWo cells stably overexpressing FUT8 or control vector and transfected with NTC or L1CAM sirna.")
 Western blot of L1CAM in MeWo cell line overexpressing FUT8 or control vector, and transfected with NTC or L1CAM sirna. Samples were blotted with a-l1cam Ab1.")
13 A B C D E F G H I J K Figure 7. L1CAM Is a Mediator of the Pro-invasive Effects of FUT8 (A) Western blot of L1CAM or FUT8 in WM3248 cells stably overexpressing L1CAM or control vector and transfected with NTC or FUT8 sirna. L1CAM IP on WM3248 cells lysates stably overexpressing L1CAM or control vector and transfected with NTC or FUT8 sirna. Anti-L1CAM immunoprecipitates were blotted with biotinylated LcH or a-l1cam Ab1. (B) Trans-well Matrigel invasion assay on WM3248 melanoma cells stably overexpressing L1CAM or control vector and transfected with NTC or FUT8 sirna. n = 5 fields per replicate; 5 replicates per condition. Data shown is representative of three independent experiments. (C) Trans-well Matrigel invasion by MeWo melanoma cells stably overexpressing FUT8 or control vector. Scale bar, 100 mm. Western blot of FUT8 is also shown. n = 5 fields per replicate; 5 replicates per condition. Data shown is representative of three independent experiments. (D) L1CAM IP on whole-cell lysates of MeWo cells stably overexpressing FUT8 or control vector. Anti-L1CAM immunoprecipitates blotted with biotinylated LcH or a-l1cam Ab1. (E) Western blot of FUT8 and L1CAM in MeWo cells stably overexpressing FUT8 or control vector and transfected with NTC or L1CAM sirna. (F) Trans-well Matrigel invasion by MeWo melanoma cells stably overexpressing FUT8 or control vector and transfected with NTC, L1CAM, or FUT8 sirna. n = 5 fields per replicate; 5 replicates per condition. Data shown is representative of three independent experiments. (G) Western blot of L1CAM in MeWo cell line overexpressing FUT8 or control vector, and transfected with NTC or L1CAM sirna. Samples were blotted with a-l1cam Ab1. (H) Western blot of cleaved and full-length L1CAM on SkMel147 cells transfected with NTC or FUT8 sirna and treated with a2-antiplasmin. Cells were transfected with sirnas for 48 hr then incubated with a2-antiplasmin (5 mg/ml) for 16 hr. L1CAM Ab3 preferentially recognizes cleaved L1CAM fragment while L1CAM Ab1 preferentially recognizes full-length L1CAM. (I) Quantitation of cleaved L1CAM (85 kda) using ImageStudioLite software. Tubulin was used for normalization of loading (mean ± SD of three replicates). (J) Western blot of cleaved and full-length L1CAM on lysates from MeWo cells stably overexpressing FUT8 or control vector and treated with plasmin. Cells were cultured for 24 hr then incubated with plasmin (3 mg/ml) for 24 hr. (K) Quantitation of cleaved L1CAM. Tubulin was used for normalization of loading (mean ± SD of three replicates). All experiments were performed in triplicate and representative images are shown. Data are presented as mean ± SD. Two-tailed unpaired t test. *p = 0.01 to 0.05, **p = to 0.01 and ***p = to 0.001, ns: not significant. See also Figure S6. Cancer Cell 31, , June 12,
14 melanoma, identifying FUT8, the sole enzyme responsible for core fucosylation, as upregulated in metastatic cohorts, and FUT1 and FUT2, enzymes that create a-1,2-fucosylated epitopes, as high in primary melanoma (Kanehisa and Goto, 2000; Nairn et al., 2012). Lectin histochemistry on patient samples confirmed increased core fucose and loss of a-1,2 fucose in metastatic samples. In line with these data, we identified FUT8 as a positive regulator of, and FUT1 and FUT2, as potential suppressors of invasion. Although data in a mouse melanoma line and the recent work on ATF2 support a role for a-1,2 fucose in suppressing the metastatic potential of melanoma (Gorelik et al., 1997; Lau et al., 2015), there is no known role for core fucosylation in melanoma progression, and the importance of these enzymes to clinical melanoma is unknown. Our results support the value of a systems-based approach to identify specific glycogenes (and corresponding enzyme and glycan changes) that contribute to melanoma metastatic behavior. We focused our functional and mechanistic studies on FUT8 as a candidate pro-metastatic gene and potential therapeutic target. Core fucosylation is elevated in liver and ovarian cancerous tissues in comparison with normal tissues (Abbott et al., 2008; Mehta et al., 2016), and linked to EGFR dimerization and activation, TGF-b activation, and HGF and EGF signaling pathways (Gu et al., 2013; Liu et al., 2011; Wang et al., 2015). However, a role for this enzyme in melanoma and the specific core-fucosylated glycoproteins underlying its effects are unknown. FUT8 silencing in highly metastatic melanoma cell lines reduced their invasive capacity without affecting proliferation. This is in contrast to work in both nonsmall-cell lung (Chen et al., 2013) and hepatocellular carcinoma (Wang et al., 2015), where FUT8 silencing was anti-proliferative. Silencing FUT8 reduced metastatic dissemination of melanoma cells to the lungs and inhibited the growth of pre-seeded metastases in liver, brain, and kidney, suggesting that core fucosylation may be required for the adaptations that disseminated cancer cells undergo to survive in foreign tissues. FUT8 inhibition of pre-established metastases seems independent of any growth advantage conferred by FUT8, as FUT8 silencing did not impact the growth of primary melanoma tumors. Together our data point toward metastatic-specific promoting effects of FUT8, and provide compelling evidence that FUT8 silencing inhibits the processes underlying melanoma metastasis in vivo. We identified TGIF2 as a positive regulator of FUT8. This is in agreement with previous evidence that TGIF2 inhibition by mir- 34a blocks bone metastasis and melanoma invasive growth (Krzeszinski et al., 2014; Yamazaki et al., 2012). FUT8 has also been described as a mir-34a target (Bernardi et al., 2013; Cheng et al., 2016), opening the possibility that mir-34a controls FUT8, both directly and indirectly, via TGIF2 suppression. Multiple datasets of melanoma patient samples support TGIF2 upregulation in metastasis, highlighting the clinical relevance of the TGIF2-FUT8 axis. Core fucosylation is found on a myriad of proteins including adhesion molecules, receptors, and inflammatory molecules (Ohtsubo and Marth, 2006). Glycoproteomic analysis of metastatic melanoma cell lines identified 114 common core-fucosylated membrane proteins, with enrichment in proteins involved in cell invasion and migration. These proteins included NRP2, a cell surface receptor promoting extravasation and metastasis (Karpanen et al., 2006), multiple integrins, which play well-known roles in metastasis (Desgrosellier and Cheresh, 2010), and the neural cell adhesion molecule L1CAM. Overexpression of L1CAM contributes to the metastatic cascade in several cancers, including ovarian and pancreatic cancers (Altevogt et al., 2016). L1CAM transcripts are not upregulated in metastasis in melanoma datasets; however, L1CAM activity or interaction with other receptors or growth factors might be altered by core fucosylation. FUT8 ectopic expression conferred increased invasive capacity to the poorly invasive MeWo and moderately invasive 4L cell lines. Remarkably, this phenotype was mostly rescued by silencing of L1CAM. Taken together, the data suggest that core fucosylation enhances the ability of L1CAM to promote metastasis, altering either L1CAM activity or interactions with its counterparts (Kiefel et al., 2010). L1CAM is a 220 kda glycoprotein, and its cleavage by proteases such as ADAM10 and plasmin results in 32 and 85 kda cellular fragments, respectively (Kiefel et al., 2012; Silletti et al., 2000). Cleavage by plasmin impairs L1CAM ability to promote vascular co-option and metastatic outgrowth (Valiente et al., 2014), while ADAM10 cleavage renders a soluble L1CAM fragment important for invasion or migration of cancer cells (Altevogt et al., 2016). We observed lower amounts of cleaved 85 kda L1CAM in FUT8-overexpressing cells and increased cleaved L1CAM upon FUT8 silencing, suggesting that core fucosylation impairs L1CAM cleavage and providing a rationale for the pro-metastatic behavior of highly-fucosylated L1CAM. Our mass spectrometry analyses identified a L1CAM glycopeptide 842 GYNVTYWR 849 in close proximity to the plasmin cleavage site of L1CAM ( 851 GSQRKHSKRHIHKDHV 866 ). The molecular weight of the detected L1CAM cleavage product matched that of plasmin cleavage (Silletti et al., 2000). Treatment of melanoma cells with plasmin or a2-antiplasmin increased or decreased its levels, respectively, and plasmin-mediated cleavage of L1CAM was inhibited in FUT8-overexpressing cells. The ability of uncleaved L1CAM to co-opt the existing vasculature at distal organs could explain why FUT8 is required for the growth of established metastases without affecting intrinsic cell proliferation. Our data argue that manipulating the glycosylation status of L1CAM may provide a way to increase its cleavage and impair metastasis. Despite remarkable advances that have led to U.S. Food and Drug Administration approval of new compounds, outcomes for metastatic melanoma patients remain poor. Lack of response, initial response followed by relapse with treatment-refractory disease, and adverse side effects are common occurrences (Lo and Fisher, 2014; Zaretsky et al., 2016). Therefore, there is a clear need to identify new targets and develop innovative drugs that target molecules essential for metastatic melanoma. Our study highlights the therapeutic potential of targeting FUT8 to treat metastatic melanoma and other advanced tumors. Exemplifying the value of glycosylation enzymes as druggable targets are both glycosyltransferase (Zavesca for Gaucher s disease [Dwek et al., 2002; Gloster and Vocadlo, 2012]) and glycosidase inhibitors (zanamivir [Relenza] and oseltamivir [Tamiflu] for influenza [Dalziel et al., 2014], migalastat for Fabry s disease [Gloster and Vocadlo, 2012]), currently in use or in advanced clinical trials. Our 816 Cancer Cell 31, , June 12, 2017
(a) Significant biological processes (upper panel) and disease biomarkers (lower panel)
 Significant biological processes (upper panel) and disease biomarkers (lower panel)") Supplementary Figure 1. Functional enrichment analyses of secretomic proteins. (a) Significant biological processes (upper panel) and disease biomarkers (lower panel) 2 involved by hrab37-mediated secretory
Supplementary Figure 1. Functional enrichment analyses of secretomic proteins. (a) Significant biological processes (upper panel) and disease biomarkers (lower panel) 2 involved by hrab37-mediated secretory
Supplementary Figures
 Supplementary Figures Supplementary Figure 1 Characterization of stable expression of GlucB and sshbira in the CT26 cell line (a) Live cell imaging of stable CT26 cells expressing green fluorescent protein
Supplemental information
 Carcinoemryonic antigen-related cell adhesion molecule 6 (CEACAM6) promotes EGF receptor signaling of oral squamous cell carcinoma metastasis via the complex N-glycosylation y Chiang et al. Supplemental
Type of file: PDF Size of file: 0 KB Title of file for HTML: Supplementary Information Description: Supplementary Figures
 Type of file: PDF Size of file: 0 KB Title of file for HTML: Supplementary Information Description: Supplementary Figures Supplementary Figure 1 mir-128-3p is highly expressed in chemoresistant, metastatic
Nature Immunology: doi: /ni Supplementary Figure 1. Transcriptional program of the TE and MP CD8 + T cell subsets.
 Supplementary Figure 1 Transcriptional program of the TE and MP CD8 + T cell subsets. (a) Comparison of gene expression of TE and MP CD8 + T cell subsets by microarray. Genes that are 1.5-fold upregulated
BIOSYNTHESIS OF CANCER-RELATED CARBOHYDRATE ANTIGENS. Fabio Dall Olio Department of Experimental Pathology University of Bologna, Italy
 BIOSYNTHESIS OF CANCER-RELATED CARBOHYDRATE ANTIGENS Fabio Dall Olio Department of Experimental Pathology University of Bologna, Italy TOPICS OF THE LECTURE 1. Structure and function of some representative
Supplementary Figure 1 IL-27 IL
 Tim-3 Supplementary Figure 1 Tc0 49.5 0.6 Tc1 63.5 0.84 Un 49.8 0.16 35.5 0.16 10 4 61.2 5.53 10 3 64.5 5.66 10 2 10 1 10 0 31 2.22 10 0 10 1 10 2 10 3 10 4 IL-10 28.2 1.69 IL-27 Supplementary Figure 1.
Supplementary Figures
 Supplementary Figures Supplementary Fig. 1. Galectin-3 is present within tumors. (A) mrna expression levels of Lgals3 (galectin-3) and Lgals8 (galectin-8) in the four classes of cell lines as determined
mir-509-5p and mir-1243 increase the sensitivity to gemcitabine by inhibiting
 mir-509-5p and mir-1243 increase the sensitivity to gemcitabine by inhibiting epithelial-mesenchymal transition in pancreatic cancer Hidekazu Hiramoto, M.D. 1,3, Tomoki Muramatsu, Ph.D. 1, Daisuke Ichikawa,
Supplementary Table S1. Tumor samples used for analysis Tumor size (cm) BNG (grade) ERα PR. pn-
 BNG (grade) ERα PR. pn-") Supplementary Table S1. Tumor samples used for analysis Sample# Age Tumor size (cm) pn- Stage Stage BNG (grade) ERα PR HER2 (FISH) Triple negative T1 46 3 N1a III 2 Pos Neg N T2 58 1 N(i-) I 3 Pos Neg
Supplementary Table S1. Tumor samples used for analysis Sample# Age Tumor size (cm) pn- Stage Stage BNG (grade) ERα PR HER2 (FISH) Triple negative T1 46 3 N1a III 2 Pos Neg N T2 58 1 N(i-) I 3 Pos Neg
(A) RT-PCR for components of the Shh/Gli pathway in normal fetus cell (MRC-5) and a
 RT-PCR for components of the Shh/Gli pathway in normal fetus cell (MRC-5) and a") Supplementary figure legends Supplementary Figure 1. Expression of Shh signaling components in a panel of gastric cancer. (A) RT-PCR for components of the Shh/Gli pathway in normal fetus cell (MRC-5) and
Supplementary figure legends Supplementary Figure 1. Expression of Shh signaling components in a panel of gastric cancer. (A) RT-PCR for components of the Shh/Gli pathway in normal fetus cell (MRC-5) and
Supplementary Figure 1. HOPX is hypermethylated in NPC. (a) Methylation levels of HOPX in Normal (n = 24) and NPC (n = 24) tissues from the
 Methylation levels of HOPX in Normal (n = 24) and NPC (n = 24) tissues from the") Supplementary Figure 1. HOPX is hypermethylated in NPC. (a) Methylation levels of HOPX in Normal (n = 24) and NPC (n = 24) tissues from the genome-wide methylation microarray data. Mean ± s.d.; Student
Supplementary Figure 1. HOPX is hypermethylated in NPC. (a) Methylation levels of HOPX in Normal (n = 24) and NPC (n = 24) tissues from the genome-wide methylation microarray data. Mean ± s.d.; Student
SUPPLEMENTARY INFORMATION
 DOI:.38/ncb3399 a b c d FSP DAPI 5mm mm 5mm 5mm e Correspond to melanoma in-situ Figure a DCT FSP- f MITF mm mm MlanaA melanoma in-situ DCT 5mm FSP- mm mm mm mm mm g melanoma in-situ MITF MlanaA mm mm
SUPPLEMENTARY FIGURES AND TABLES
 SUPPLEMENTARY FIGURES AND TABLES Supplementary Figure S1: CaSR expression in neuroblastoma models. A. Proteins were isolated from three neuroblastoma cell lines and from the liver metastasis of a MYCN-non
Supplementary Figure 1.TRIM33 binds β-catenin in the nucleus. a & b, Co-IP of endogenous TRIM33 with β-catenin in HT-29 cells (a) and HEK 293T cells
 and HEK 293T cells") Supplementary Figure 1.TRIM33 binds β-catenin in the nucleus. a & b, Co-IP of endogenous TRIM33 with β-catenin in HT-29 cells (a) and HEK 293T cells (b). TRIM33 was immunoprecipitated, and the amount of
Supplementary Figure 1.TRIM33 binds β-catenin in the nucleus. a & b, Co-IP of endogenous TRIM33 with β-catenin in HT-29 cells (a) and HEK 293T cells (b). TRIM33 was immunoprecipitated, and the amount of
Supplementary Figure 1. PD-L1 is glycosylated in cancer cells. (a) Western blot analysis of PD-L1 in breast cancer cells. (b) Western blot analysis
 Western blot analysis of PD-L1 in breast cancer cells. (b) Western blot analysis") Supplementary Figure 1. PD-L1 is glycosylated in cancer cells. (a) Western blot analysis of PD-L1 in breast cancer cells. (b) Western blot analysis of PD-L1 in ovarian cancer cells. (c) Western blot analysis
Supplementary Figure 1. PD-L1 is glycosylated in cancer cells. (a) Western blot analysis of PD-L1 in breast cancer cells. (b) Western blot analysis of PD-L1 in ovarian cancer cells. (c) Western blot analysis
Supplementary Information Titles Journal: Nature Medicine
 Supplementary Information Titles Journal: Nature Medicine Article Title: Corresponding Author: Supplementary Item & Number Supplementary Fig.1 Fig.2 Fig.3 Fig.4 Fig.5 Fig.6 Fig.7 Fig.8 Fig.9 Fig. Fig.11
SUPPLEMENTARY INFORMATION
 DOI: 10.1038/ncb2607 Figure S1 Elf5 loss promotes EMT in mammary epithelium while Elf5 overexpression inhibits TGFβ induced EMT. (a, c) Different confocal slices through the Z stack image. (b, d) 3D rendering
7SK ChIRP-seq is specifically RNA dependent and conserved between mice and humans.
 Supplementary Figure 1 7SK ChIRP-seq is specifically RNA dependent and conserved between mice and humans. Regions targeted by the Even and Odd ChIRP probes mapped to a secondary structure model 56 of the
a) List of KMTs targeted in the shrna screen. The official symbol, KMT designation,
 List of KMTs targeted in the shrna screen. The official symbol, KMT designation,") Supplementary Information Supplementary Figures Supplementary Figure 1. a) List of KMTs targeted in the shrna screen. The official symbol, KMT designation, gene ID and specifities are provided. Those highlighted
Supplementary Information Supplementary Figures Supplementary Figure 1. a) List of KMTs targeted in the shrna screen. The official symbol, KMT designation, gene ID and specifities are provided. Those highlighted
Supplementary Figure 1: Digitoxin induces apoptosis in primary human melanoma cells but not in normal melanocytes, which express lower levels of the
 Supplementary Figure 1: Digitoxin induces apoptosis in primary human melanoma cells but not in normal melanocytes, which express lower levels of the cardiac glycoside target, ATP1A1. (a) The percentage
Supplementary Figure 1. SA-β-Gal positive senescent cells in various cancer tissues. Representative frozen sections of breast, thyroid, colon and
 Supplementary Figure 1. SA-β-Gal positive senescent cells in various cancer tissues. Representative frozen sections of breast, thyroid, colon and stomach cancer were stained with SA-β-Gal and nuclear fast
SUPPLEMENTARY INFORMATION
 doi:.38/nature8975 SUPPLEMENTAL TEXT Unique association of HOTAIR with patient outcome To determine whether the expression of other HOX lincrnas in addition to HOTAIR can predict patient outcome, we measured
Functional characterisation of hepatitis B viral X protein/microrna-21 interaction in HBVassociated hepatocellular carcinoma
 RESEARCH FUND FOR THE CONTROL OF INFECTIOUS DISEASES Functional characterisation of hepatitis B viral X protein/microrna-21 interaction in HBVassociated hepatocellular carcinoma CH Li, SC Chow, DL Yin,
EPIGENETIC RE-EXPRESSION OF HIF-2α SUPPRESSES SOFT TISSUE SARCOMA GROWTH
 EPIGENETIC RE-EXPRESSION OF HIF-2α SUPPRESSES SOFT TISSUE SARCOMA GROWTH Supplementary Figure 1. Supplementary Figure 1. Characterization of KP and KPH2 autochthonous UPS tumors. a) Genotyping of KPH2
injected subcutaneously into flanks of 6-8 week old athymic male nude mice (LNCaP SQ) and body
 and body") SUPPLEMENTAL FIGURE LEGENDS Figure S1: Generation of ENZR Xenografts and Cell Lines: (A) 1x10 6 LNCaP cells in matrigel were injected subcutaneously into flanks of 6-8 week old athymic male nude mice (LNCaP
SUPPLEMENTAL FIGURE LEGENDS Figure S1: Generation of ENZR Xenografts and Cell Lines: (A) 1x10 6 LNCaP cells in matrigel were injected subcutaneously into flanks of 6-8 week old athymic male nude mice (LNCaP
m 6 A mrna methylation regulates AKT activity to promote the proliferation and tumorigenicity of endometrial cancer
 SUPPLEMENTARY INFORMATION Articles https://doi.org/10.1038/s41556-018-0174-4 In the format provided by the authors and unedited. m 6 A mrna methylation regulates AKT activity to promote the proliferation
Supplementary Figure 1. Deletion of Smad3 prevents B16F10 melanoma invasion and metastasis in a mouse s.c. tumor model.
 A B16F1 s.c. Lung LN Distant lymph nodes Colon B B16F1 s.c. Supplementary Figure 1. Deletion of Smad3 prevents B16F1 melanoma invasion and metastasis in a mouse s.c. tumor model. Highly invasive growth
hexahistidine tagged GRP78 devoid of the KDEL motif (GRP78-His) on SDS-PAGE. This
 on SDS-PAGE. This") SUPPLEMENTAL FIGURE LEGEND Fig. S1. Generation and characterization of. (A) Coomassie staining of soluble hexahistidine tagged GRP78 devoid of the KDEL motif (GRP78-His) on SDS-PAGE. This protein was expressed
SUPPLEMENTAL FIGURE LEGEND Fig. S1. Generation and characterization of. (A) Coomassie staining of soluble hexahistidine tagged GRP78 devoid of the KDEL motif (GRP78-His) on SDS-PAGE. This protein was expressed
File Name: Supplementary Information Description: Supplementary Figures and Supplementary Tables. File Name: Peer Review File Description:
 File Name: Supplementary Information Description: Supplementary Figures and Supplementary Tables File Name: Peer Review File Description: Primer Name Sequence (5'-3') AT ( C) RT-PCR USP21 F 5'-TTCCCATGGCTCCTTCCACATGAT-3'
Supplementary Figure 1. Characterization of NMuMG-ErbB2 and NIC breast cancer cells expressing shrnas targeting LPP. NMuMG-ErbB2 cells (a) and NIC
 and NIC") Supplementary Figure 1. Characterization of NMuMG-ErbB2 and NIC breast cancer cells expressing shrnas targeting LPP. NMuMG-ErbB2 cells (a) and NIC cells (b) were engineered to stably express either a LucA-shRNA
Supplementary Figure 1. Characterization of NMuMG-ErbB2 and NIC breast cancer cells expressing shrnas targeting LPP. NMuMG-ErbB2 cells (a) and NIC cells (b) were engineered to stably express either a LucA-shRNA
Supplementary Figure 1 ITGB1 and ITGA11 increase with evidence for heterodimers following HSC activation. (a) Time course of rat HSC activation
 Time course of rat HSC activation") Supplementary Figure 1 ITGB1 and ITGA11 increase with evidence for heterodimers following HSC activation. (a) Time course of rat HSC activation indicated by the detection of -SMA and COL1 (log scale).
Supplementary Figure 1 ITGB1 and ITGA11 increase with evidence for heterodimers following HSC activation. (a) Time course of rat HSC activation indicated by the detection of -SMA and COL1 (log scale).
SUPPLEMENTARY INFORMATION
 DOI: 10.1038/ncb3021 Supplementary figure 1 Characterisation of TIMPless fibroblasts. a) Relative gene expression of TIMPs1-4 by real time quantitative PCR (RT-qPCR) in WT or ΔTimp fibroblasts (mean ±
Supplemental Figure 1
 Supplemental Figure 1 1a 1c PD-1 MFI fold change 6 5 4 3 2 1 IL-1α IL-2 IL-4 IL-6 IL-1 IL-12 IL-13 IL-15 IL-17 IL-18 IL-21 IL-23 IFN-α Mut Human PD-1 promoter SBE-D 5 -GTCTG- -1.2kb SBE-P -CAGAC- -1.kb
Supplementary Figure 1 Induction of cellular senescence and isolation of exosome. a to c, Pre-senescent primary normal human diploid fibroblasts
 Supplementary Figure 1 Induction of cellular senescence and isolation of exosome. a to c, Pre-senescent primary normal human diploid fibroblasts (TIG-3 cells) were rendered senescent by either serial passage
Supplementary Figure 1. The mir-182 binding site of SMAD7 3 UTR and the. mutated sequence.
 Supplementary Figure 1. The mir-182 binding site of SMAD7 3 UTR and the mutated sequence. 1 Supplementary Figure 2. Expression of mir-182 and SMAD7 in various cell lines. (A) Basal levels of mir-182 expression
microrna-200b and microrna-200c promote colorectal cancer cell proliferation via
 Supplementary Materials microrna-200b and microrna-200c promote colorectal cancer cell proliferation via targeting the reversion-inducing cysteine-rich protein with Kazal motifs Supplementary Table 1.
mtor Inhibition Specifically Sensitizes Colorectal Cancers with KRAS or BRAF Mutations to BCL-2/BCL-
 Supplementary Material for mtor Inhibition Specifically Sensitizes Colorectal Cancers with KRAS or BRAF Mutations to BCL-2/BCL- XL Inhibition by Suppressing MCL-1 Anthony C. Faber 1,2 *, Erin M. Coffee
Figure S1. Reduction in glomerular mir-146a levels correlate with progression to higher albuminuria in diabetic patients.
 Supplementary Materials Supplementary Figures Figure S1. Reduction in glomerular mir-146a levels correlate with progression to higher albuminuria in diabetic patients. Figure S2. Expression level of podocyte
Supplementary Figure 1. A. Bar graph representing the expression levels of the 19 indicated genes in the microarrays analyses comparing human lung
 Supplementary Figure 1. A. Bar graph representing the expression levels of the 19 indicated genes in the microarrays analyses comparing human lung immortalized broncho-epithelial cells (AALE cells) expressing
Bmi-1 regulates stem cell-like properties of gastric cancer cells via modulating mirnas
 Wang et al. Journal of Hematology & Oncology (2016) 9:90 DOI 10.1186/s13045-016-0323-9 RESEARCH Bmi-1 regulates stem cell-like properties of gastric cancer cells via modulating mirnas Open Access Xiaofeng
Supplemental Table S1
 Supplemental Table S. Tumorigenicity and metastatic potential of 44SQ cell subpopulations a Tumorigenicity b Average tumor volume (mm ) c Lung metastasis d CD high /4 8. 8/ CD low /4 6./ a Mice were injected
Supplementary Information
 Supplementary Information Supplementary Figure 1. Effect of mir mimics and anti-mirs on DTPs a, Representative fluorescence microscopy images of GFP vector control or mir mimicexpressing parental and DTP
Supplementary Figures
 Supplementary Figures Supplementary Figure 1. Confirmation of Dnmt1 conditional knockout out mice. a, Representative images of sorted stem (Lin - CD49f high CD24 + ), luminal (Lin - CD49f low CD24 + )
Soft Agar Assay. For each cell pool, 100,000 cells were resuspended in 0.35% (w/v)
") SUPPLEMENTARY MATERIAL AND METHODS Soft Agar Assay. For each cell pool, 100,000 cells were resuspended in 0.35% (w/v) top agar (LONZA, SeaKem LE Agarose cat.5004) and plated onto 0.5% (w/v) basal agar.
SUPPLEMENTARY MATERIAL AND METHODS Soft Agar Assay. For each cell pool, 100,000 cells were resuspended in 0.35% (w/v) top agar (LONZA, SeaKem LE Agarose cat.5004) and plated onto 0.5% (w/v) basal agar.
Nature Biotechnology: doi: /nbt Supplementary Figure 1. RNAseq expression profiling of selected glycosyltransferase genes in CHO.
 Supplementary Figure 1 RNAseq expression profiling of selected glycosyltransferase genes in CHO. RNAseq analysis was performed on two common CHO lines (CHO-K1, CHO-GS) and two independent CHO-GS triple
Supplementary Figure 1. Normal T lymphocyte populations in Dapk -/- mice. (a) Normal thymic development in Dapk -/- mice. Thymocytes from WT and Dapk
 Normal thymic development in Dapk -/- mice. Thymocytes from WT and Dapk") Supplementary Figure 1. Normal T lymphocyte populations in Dapk -/- mice. (a) Normal thymic development in Dapk -/- mice. Thymocytes from WT and Dapk -/- mice were stained for expression of CD4 and CD8.
Supplementary Figure 1. Normal T lymphocyte populations in Dapk -/- mice. (a) Normal thymic development in Dapk -/- mice. Thymocytes from WT and Dapk -/- mice were stained for expression of CD4 and CD8.
SUPPLEMENTARY FIGURES AND TABLE
 SUPPLEMENTARY FIGURES AND TABLE Supplementary Figure S1: Characterization of IRE1α mutants. A. U87-LUC cells were transduced with the lentiviral vector containing the GFP sequence (U87-LUC Tet-ON GFP).
SUPPLEMENTARY INFORMATION
 doi:10.1038/nature12652 Supplementary Figure 1. PRDM16 interacts with endogenous EHMT1 in brown adipocytes. Immunoprecipitation of PRDM16 complex by flag antibody (M2) followed by Western blot analysis
TEB. Id4 p63 DAPI Merge. Id4 CK8 DAPI Merge
 a Duct TEB b Id4 p63 DAPI Merge Id4 CK8 DAPI Merge c d e Supplementary Figure 1. Identification of Id4-positive MECs and characterization of the Comma-D model. (a) IHC analysis of ID4 expression in the
mirna Dr. S Hosseini-Asl
 mirna Dr. S Hosseini-Asl 1 2 MicroRNAs (mirnas) are small noncoding RNAs which enhance the cleavage or translational repression of specific mrna with recognition site(s) in the 3 - untranslated region
SUPPLEMENTARY FIGURES
 SUPPLEMENTARY FIGURES 1 Supplementary Figure 1, Adult hippocampal QNPs and TAPs uniformly express REST a-b) Confocal images of adult hippocampal mouse sections showing GFAP (green), Sox2 (red), and REST
SUPPLEMENTARY INFORMATION
 DOI: 1.138/ncb3355 a S1A8 + cells/ total.1.8.6.4.2 b S1A8/?-Actin c % T-cell proliferation 3 25 2 15 1 5 T cells Supplementary Figure 1 Inter-tumoral heterogeneity of MDSC accumulation in mammary tumor
HEK293FT cells were transiently transfected with reporters, N3-ICD construct and
 Supplementary Information Luciferase reporter assay HEK293FT cells were transiently transfected with reporters, N3-ICD construct and increased amounts of wild type or kinase inactive EGFR. Transfections
Supplementary Materials for
 www.sciencesignaling.org/cgi/content/full/7/308/ra4/dc1 Supplementary Materials for Antipsychotics Activate mtorc1-dependent Translation to Enhance Neuronal Morphological Complexity Heather Bowling, Guoan
Supplementary Fig. 1. GPRC5A post-transcriptionally down-regulates EGFR expression. (a) Plot of the changes in steady state mrna levels versus
 Plot of the changes in steady state mrna levels versus") Supplementary Fig. 1. GPRC5A post-transcriptionally down-regulates EGFR expression. (a) Plot of the changes in steady state mrna levels versus changes in corresponding proteins between wild type and Gprc5a-/-
Supplementary Fig. 1. GPRC5A post-transcriptionally down-regulates EGFR expression. (a) Plot of the changes in steady state mrna levels versus changes in corresponding proteins between wild type and Gprc5a-/-
Supplementary Figure 1. Prevalence of U539C and G540A nucleotide and E172K amino acid substitutions among H9N2 viruses. Full-length H9N2 NS
 Supplementary Figure 1. Prevalence of U539C and G540A nucleotide and E172K amino acid substitutions among H9N2 viruses. Full-length H9N2 NS nucleotide sequences (a, b) or amino acid sequences (c) from
(A) Cells grown in monolayer were fixed and stained for surfactant protein-c (SPC,
 Cells grown in monolayer were fixed and stained for surfactant protein-c (SPC,") Supplemental Figure Legends Figure S1. Cell line characterization (A) Cells grown in monolayer were fixed and stained for surfactant protein-c (SPC, green) and co-stained with DAPI to visualize the nuclei.
Supplemental Figure Legends Figure S1. Cell line characterization (A) Cells grown in monolayer were fixed and stained for surfactant protein-c (SPC, green) and co-stained with DAPI to visualize the nuclei.
SUPPLEMENTARY FIGURES
 SUPPLEMENTARY FIGURES Figure S1. Clinical significance of ZNF322A overexpression in Caucasian lung cancer patients. (A) Representative immunohistochemistry images of ZNF322A protein expression in tissue
Supplemental Figure 1. Intracranial transduction of a modified ptomo lentiviral vector in the mouse
 Supplemental figure legends Supplemental Figure 1. Intracranial transduction of a modified ptomo lentiviral vector in the mouse hippocampus targets GFAP-positive but not NeuN-positive cells. (A) Stereotaxic
(a) Schematic diagram of the FS mutation of UVRAG in exon 8 containing the highly instable
 Schematic diagram of the FS mutation of UVRAG in exon 8 containing the highly instable") Supplementary Figure 1. Frameshift (FS) mutation in UVRAG. (a) Schematic diagram of the FS mutation of UVRAG in exon 8 containing the highly instable A 10 DNA repeat, generating a premature stop codon
Supplementary Figure 1. Frameshift (FS) mutation in UVRAG. (a) Schematic diagram of the FS mutation of UVRAG in exon 8 containing the highly instable A 10 DNA repeat, generating a premature stop codon
Real-time imaging reveals the single steps of brain metastasis fo mation r
 Real-time imaging reveals the single steps of brain metastasis fo mation r Yvonne Kienast, Louisa von Baumgarten, Martin Fuhrmann, Wolfgang E.F. Klinkert, Roland Goldbrunner, Jochen Herms and Frank Winkler
Figure S1: Effects on haptotaxis are independent of effects on cell velocity A)
") Supplemental Figures Figure S1: Effects on haptotaxis are independent of effects on cell velocity A) Velocity of MV D7 fibroblasts expressing different GFP-tagged Ena/VASP family proteins in the haptotaxis
Supplemental Figures Figure S1: Effects on haptotaxis are independent of effects on cell velocity A) Velocity of MV D7 fibroblasts expressing different GFP-tagged Ena/VASP family proteins in the haptotaxis
Supplementary Materials for
 www.sciencesignaling.org/cgi/content/full/9/439/ra78/dc1 Supplementary Materials for Small heterodimer partner mediates liver X receptor (LXR) dependent suppression of inflammatory signaling by promoting
Cellecta Overview. Started Operations in 2007 Headquarters: Mountain View, CA
 Cellecta Overview Started Operations in 2007 Headquarters: Mountain View, CA Focus: Development of flexible, scalable, and broadly parallel genetic screening assays to expedite the discovery and characterization
SUPPLEMENTARY FIGURES
 SUPPLEMENTARY FIGURES Supplementary Figure S1: Fibroblast-induced elongation of cancer cells requires direct contact with living fibroblasts. A. Representative images of HT29-GFP cultured in the presence
Supplementary Figure S1 Expression of mir-181b in EOC (A) Kaplan-Meier
 Kaplan-Meier") Supplementary Figure S1 Expression of mir-181b in EOC (A) Kaplan-Meier curves for progression-free survival (PFS) and overall survival (OS) in a cohort of patients (N=52) with stage III primary ovarian
Supplementary Figure S1 Expression of mir-181b in EOC (A) Kaplan-Meier curves for progression-free survival (PFS) and overall survival (OS) in a cohort of patients (N=52) with stage III primary ovarian
SUPPLEMENTARY INFORMATION
 doi:10.1038/nature12215 Supplementary Figure 1. The effects of full and dissociated GR agonists in supporting BFU-E self-renewal divisions. BFU-Es were cultured in self-renewal medium with indicated GR
Table S1. Primer sequences used for qrt-pcr. CACCATTGGCAATGAGCGGTTC AGGTCTTTGCGGATGTCCACGT ACTB AAGTCCATGTGCTGGCAGCACT ATCACCACTCCGAAGTCCGTCT LCOR
 Table S1. Primer sequences used for qrt-pcr. ACTB LCOR KLF6 CTBP1 CDKN1A CDH1 ATF3 PLAU MMP9 TFPI2 CACCATTGGCAATGAGCGGTTC AGGTCTTTGCGGATGTCCACGT AAGTCCATGTGCTGGCAGCACT ATCACCACTCCGAAGTCCGTCT CGGCTGCAGGAAAGTTTACA
Supplementary Figures
 Supplementary Figures Supplementary Figure 1 DOT1L regulates the expression of epithelial and mesenchymal markers. (a) The expression levels and cellular localizations of EMT markers were confirmed by
Suppl Video: Tumor cells (green) and monocytes (white) are seeded on a confluent endothelial
 and monocytes (white) are seeded on a confluent endothelial") Supplementary Information Häuselmann et al. Monocyte induction of E-selectin-mediated endothelial activation releases VE-cadherin junctions to promote tumor cell extravasation in the metastasis cascade
Supplementary Information Häuselmann et al. Monocyte induction of E-selectin-mediated endothelial activation releases VE-cadherin junctions to promote tumor cell extravasation in the metastasis cascade
microrna Presented for: Presented by: Date:
 microrna Presented for: Presented by: Date: 2 micrornas Non protein coding, endogenous RNAs of 21-22nt length Evolutionarily conserved Regulate gene expression by binding complementary regions at 3 regions
Supplementary Materials. for Garmy-Susini, et al, Integrin 4 1 signaling is required for lymphangiogenesis and tumor metastasis
 Supplementary Materials for Garmy-Susini, et al, Integrin 4 1 signaling is required for lymphangiogenesis and tumor metastasis 1 Supplementary Figure Legends Supplementary Figure 1: Integrin expression
SSM signature genes are highly expressed in residual scar tissues after preoperative radiotherapy of rectal cancer.
 Supplementary Figure 1 SSM signature genes are highly expressed in residual scar tissues after preoperative radiotherapy of rectal cancer. Scatter plots comparing expression profiles of matched pretreatment
Lung Met 1 Lung Met 2 Lung Met Lung Met H3K4me1. Lung Met H3K27ac Primary H3K4me1
 a Gained Met-VELs 1.5 1.5 -.5 Lung Met 1 Lung Met Lung Met 3 1. Lung Met H3K4me1 Lung Met H3K4me1 1 Lung Met H3K4me1 Lung Met H3K7ac 1.5 Lung Met H3K7ac Lung Met H3K7ac.8 Primary H3K4me1 Primary H3K7ac
Supplementary Figure 1
 Supplementary Figure 1 Constitutive EGFR signaling does not activate canonical EGFR signals (a) U251EGFRInd cells with or without tetracycline exposure (24h, 1µg/ml) were treated with EGF for 15 minutes
Supplemental Figure S1. RANK expression on human lung cancer cells.
 Supplemental Figure S1. RANK expression on human lung cancer cells. (A) Incidence and H-Scores of RANK expression determined from IHC in the indicated primary lung cancer subgroups. The overall expression
Supplementary Figure 1. a. b. Relative cell viability. Nature Genetics: doi: /ng SCR shyap1-1 shyap
 Supplementary Figure 1. a. b. p-value for depletion in vehicle (DMSO) 1e-05 1e-03 1e-01 1 0 1000 2000 3000 4000 5000 Genes log2 normalized shrna counts in T0 0 2 4 6 8 sh1 shluc 0 2 4 6 8 log2 normalized
Supplementary Figure 1. AdipoR1 silencing and overexpression controls. (a) Representative blots (upper and lower panels) showing the AdipoR1 protein
 Representative blots (upper and lower panels) showing the AdipoR1 protein") Supplementary Figure 1. AdipoR1 silencing and overexpression controls. (a) Representative blots (upper and lower panels) showing the AdipoR1 protein content relative to GAPDH in two independent experiments.
Supplementary Figure 1. AdipoR1 silencing and overexpression controls. (a) Representative blots (upper and lower panels) showing the AdipoR1 protein content relative to GAPDH in two independent experiments.
Supplementary Fig. 1 eif6 +/- mice show a reduction in white adipose tissue, blood lipids and normal glycogen synthesis. The cohort of the original
 Supplementary Fig. 1 eif6 +/- mice show a reduction in white adipose tissue, blood lipids and normal glycogen synthesis. The cohort of the original phenotypic screening was n=40. For specific tests, the
Computer Science, Biology, and Biomedical Informatics (CoSBBI) Outline. Molecular Biology of Cancer AND. Goals/Expectations. David Boone 7/1/2015
 Outline. Molecular Biology of Cancer AND. Goals/Expectations. David Boone 7/1/2015") Goals/Expectations Computer Science, Biology, and Biomedical (CoSBBI) We want to excite you about the world of computer science, biology, and biomedical informatics. Experience what it is like to be a
Goals/Expectations Computer Science, Biology, and Biomedical (CoSBBI) We want to excite you about the world of computer science, biology, and biomedical informatics. Experience what it is like to be a
RNA interference induced hepatotoxicity results from loss of the first synthesized isoform of microrna-122 in mice
 SUPPLEMENTARY INFORMATION RNA interference induced hepatotoxicity results from loss of the first synthesized isoform of microrna-122 in mice Paul N Valdmanis, Shuo Gu, Kirk Chu, Lan Jin, Feijie Zhang,
Effects of UBL5 knockdown on cell cycle distribution and sister chromatid cohesion
 Supplementary Figure S1. Effects of UBL5 knockdown on cell cycle distribution and sister chromatid cohesion A. Representative examples of flow cytometry profiles of HeLa cells transfected with indicated
A263 A352 A204. Pan CK. pstat STAT3 pstat3 STAT3 pstat3. Columns Columns 1-6 Positive control. Omentum. Rectosigmoid A195.
 pstat3 75 Pan CK A A263 A352 A24 B Columns 1-6 Positive control A195 A22 A24 A183 Rectal Nodule STAT3 pstat3 STAT3 pstat3 Columns 7-12 Omentum Rectosigmoid Left Ovary Right Ovary Omentum Uterus Uterus
Supplementary Information Supplementary Fig. 1. Elevated Usp9x in melanoma and NRAS mutant melanoma cells are dependent on NRAS for 3D growth.
 Supplementary Information Supplementary Fig. 1. Elevated Usp9x in melanoma and NRAS mutant melanoma cells are dependent on NRAS for 3D growth. a. Immunoblot for Usp9x protein in NRAS mutant melanoma cells
Supplementary Figure 1. mrna targets were found in exosomes and absent in free-floating supernatant. Serum exosomes and exosome-free supernatant were
 Supplementary Figure 1. mrna targets were found in exosomes and absent in free-floating supernatant. Serum exosomes and exosome-free supernatant were separated via ultracentrifugation and lysed to analyze
(A) PCR primers (arrows) designed to distinguish wild type (P1+P2), targeted (P1+P2) and excised (P1+P3)14-
 PCR primers (arrows) designed to distinguish wild type (P1+P2), targeted (P1+P2) and excised (P1+P3)14-") 1 Supplemental Figure Legends Figure S1. Mammary tumors of ErbB2 KI mice with 14-3-3σ ablation have elevated ErbB2 transcript levels and cell proliferation (A) PCR primers (arrows) designed to distinguish
1 Supplemental Figure Legends Figure S1. Mammary tumors of ErbB2 KI mice with 14-3-3σ ablation have elevated ErbB2 transcript levels and cell proliferation (A) PCR primers (arrows) designed to distinguish
Supplementary Figure 1: STAT3 suppresses Kras-induced lung tumorigenesis
 Supplementary Figure 1: STAT3 suppresses Kras-induced lung tumorigenesis (a) Immunohistochemical (IHC) analysis of tyrosine 705 phosphorylation status of STAT3 (P- STAT3) in tumors and stroma (all-time
Supplementary. presence of the. (c) mrna expression. Error. in naive or
 mrna expression. Error. in naive or") Figure 1. (a) Naive CD4 + T cells were activated in the presence of the indicated cytokines for 3 days. Enpp2 mrna expression was measured by qrt-pcrhr, infected with (b, c) Naive CD4 + T cells were activated
Figure 1. (a) Naive CD4 + T cells were activated in the presence of the indicated cytokines for 3 days. Enpp2 mrna expression was measured by qrt-pcrhr, infected with (b, c) Naive CD4 + T cells were activated
Normal Skin. Tissue Samples and Melanoma Cell Lines. BRAF Mut. RAS Mut RAS WT /BRAF WT
 Supplemental Figure 1. MERTK gene expression in melanoma cell line panel from Cancer Cell Line Encyclopedia. A. Microarray analysis of melanoma cell lines from UNC collection grouped by oncogenic mutation.
ANGPTL2 increases bone metastasis of breast cancer cells through. Tetsuro Masuda, Motoyoshi Endo, Yutaka Yamamoto, Haruki Odagiri, Tsuyoshi
 Masuda et al. Supplementary information for ANGPTL2 increases bone metastasis of breast cancer cells through enhancing CXCR4 signaling Tetsuro Masuda, Motoyoshi Endo, Yutaka Yamamoto, Haruki Odagiri, Tsuyoshi
Supplementary Figure 1
 Supplementary Figure 1 14 12 SEM4C PLXN2 8 SEM4C C 3 Cancer Cell Non Cancer Cell Expression 1 8 6 6 4 log2 ratio Expression 2 1 4 2 2 p value.1 D Supplementary Figure 1. Expression of Sema4C and Plexin2
Supplemental Data. TGF-β-mediated mir-181a expression promotes breast cancer metastasis by targeting Bim.
 Supplemental Data TGF-β-mediated mir-181a expression promotes breast cancer metastasis by targeting Bim. Molly A. Taylor 1, Khalid Sossey-Alaoui 2, Cheryl L. Thompson 3, David Danielpour 4, and William
SREBP-2 promotes stem cell-like properties and metastasis by transcriptional activation of c-myc in prostate cancer
 SREBP-2 promotes stem cell-like properties and metastasis by transcriptional activation of c-myc in prostate cancer Supplementary Material Supplementary Methods Supplementary References Supplementary Figure
SHREE ET AL, SUPPLEMENTAL MATERIALS. (A) Workflow for tumor cell line derivation and orthotopic implantation.
 Workflow for tumor cell line derivation and orthotopic implantation.") SHREE ET AL, SUPPLEMENTAL MATERIALS SUPPLEMENTAL FIGURE AND TABLE LEGENDS Supplemental Figure 1. Derivation and characterization of TS1-TGL and TS2-TGL PyMT cell lines and development of an orthotopic
SHREE ET AL, SUPPLEMENTAL MATERIALS SUPPLEMENTAL FIGURE AND TABLE LEGENDS Supplemental Figure 1. Derivation and characterization of TS1-TGL and TS2-TGL PyMT cell lines and development of an orthotopic
Analysis of Massively Parallel Sequencing Data Application of Illumina Sequencing to the Genetics of Human Cancers
 Analysis of Massively Parallel Sequencing Data Application of Illumina Sequencing to the Genetics of Human Cancers Gordon Blackshields Senior Bioinformatician Source BioScience 1 To Cancer Genetics Studies
Supplemental Figure 1. Western blot analysis indicated that MIF was detected in the fractions of
 Supplemental Figure Legends Supplemental Figure 1. Western blot analysis indicated that was detected in the fractions of plasma membrane and cytosol but not in nuclear fraction isolated from Pkd1 null
Lentiviral Delivery of Combinatorial mirna Expression Constructs Provides Efficient Target Gene Repression.
 Supplementary Figure 1 Lentiviral Delivery of Combinatorial mirna Expression Constructs Provides Efficient Target Gene Repression. a, Design for lentiviral combinatorial mirna expression and sensor constructs.
Cells and reagents. Synaptopodin knockdown (1) and dynamin knockdown (2)
 and dynamin knockdown (2)") Supplemental Methods Cells and reagents. Synaptopodin knockdown (1) and dynamin knockdown (2) podocytes were cultured as described previously. Staurosporine, angiotensin II and actinomycin D were all obtained
Supplemental Methods Cells and reagents. Synaptopodin knockdown (1) and dynamin knockdown (2) podocytes were cultured as described previously. Staurosporine, angiotensin II and actinomycin D were all obtained