Supplementary Materials for
|
|
|
- Scarlett Miller
- 5 years ago
- Views:
Transcription
1 Supplementary Materials for The caspase-8 inhibitor emricasan combines with the SMAC mimetic birinapant to induce necroptosis and treat acute myeloid leukemia Gabriela Brumatti, Chunyan Ma, Najoua Lalaoui, Nhu-Y Nguyen, Mario Navarro, Maria C. Tanzer, Jennifer Richmond, Margherita Ghisi, Jessica M. Salmon, Natasha Silke, Giovanna Pomilio, Stefan P. Glaser, Elisha de Valle, Raffi Gugasyan, Mark A. Gurthridge, Stephen M. Condon, Ricky W. Johnstone, Richard Lock, Guy Salvesen, Andrew Wei, David L. Vaux, Paul G. Ekert,* John Silke* *Corresponding author. (J.S.); (P.G.E.) The PDF file includes: Published 18 May 2016, Sci. Transl. Med. 8, 339ra69 (2016) DOI: /scitranslmed.aad3099 Fig. S1. Endogenous protein expression in different AML subtypes. Fig. S2. Generation of single-gene knockout leukemias. Fig. S3. Generation of MLL-ENL birinapant-resistant cells. Fig. S4. IDN-6556 mediated TNF-dependent necroptosis in different AML subtypes. Fig. S5. Prevention of IDN-6556 induced cell death in human AML cells by inhibiting TNFR1 or RIPK1 kinase activity. Fig. S6. Generation of MLL-ENL double-gene knockout leukemias. Fig. S7. Biochemical comparison of caspase inhibitors IDN-6556, Z-VAD-FMK, and Q-VD-OPh. Fig. S8. Comparison of the ability of caspase inhibitors to induce or block cell death in leukemic cells. Fig. S9. Combined treatment with bir/idn in vivo. Fig. S10. Safety of combined bir/idn treatment in healthy human cells. Table S1. Deidentified patient data.


2 Supplementary Materials: Fig. S1: WB: α-ciap1 MLL-AF9 MLL-ENL HOXA9+Meis1 Nup98-HOXA9 (kd) 70 WB: α-xiap exposure s 50 α-xiap exposure L 50 WB: α-tnfr1 50 WB: α-casp 8 50 WB: α-ripk1 80 WB: α-ripk3 50 WB: α-mlkl 50 WB: α-p65 60 WB: α-actin 40 Fig. S1. Endogenous protein expression in the different AML subtypes. The expression of the indicated proteins was determined in total cell lysates of 2 to 3 independent leukemias from MLL-ENL, MLL-AF9, HoxA9+Meis1, and NUP98-HoxA9 models by Western blotting and probing with the indicated antibodies. Actin was used as a loading control.
3 Fig. S2:
4 Fig. S2. Generation of single-gene knockout leukemias. (A-B) All mice transplanted with MLL-ENL transformed cells presented with enlarged spleen (splenomegaly) and high white blood cell count (WBC) as indicators of AML development. (C-D) Genotype of MLL-ENL leukemias generated from knock-out mice was confirmed by protein and PCR analysis. (C) Western blots of lysates from 3 different AMLs of the indicated genotypes were probed with the indicated antibodies. Actin was used as a loading control. (D) AML and control samples were genotyped for Tnfr1 using a standard PCR-based assay that detects the knock-out and wild type alleles. (E) MLL-ENL leukemic cells derived from WT and Tnfr1 -/- cells were treated with indicated concentrations of birinapant for 16 hours. Mean ± SEM, n=3 independent tumors per genotype. Cell survival was determined by PI uptake and flow cytometry.
5 Fig. S3.
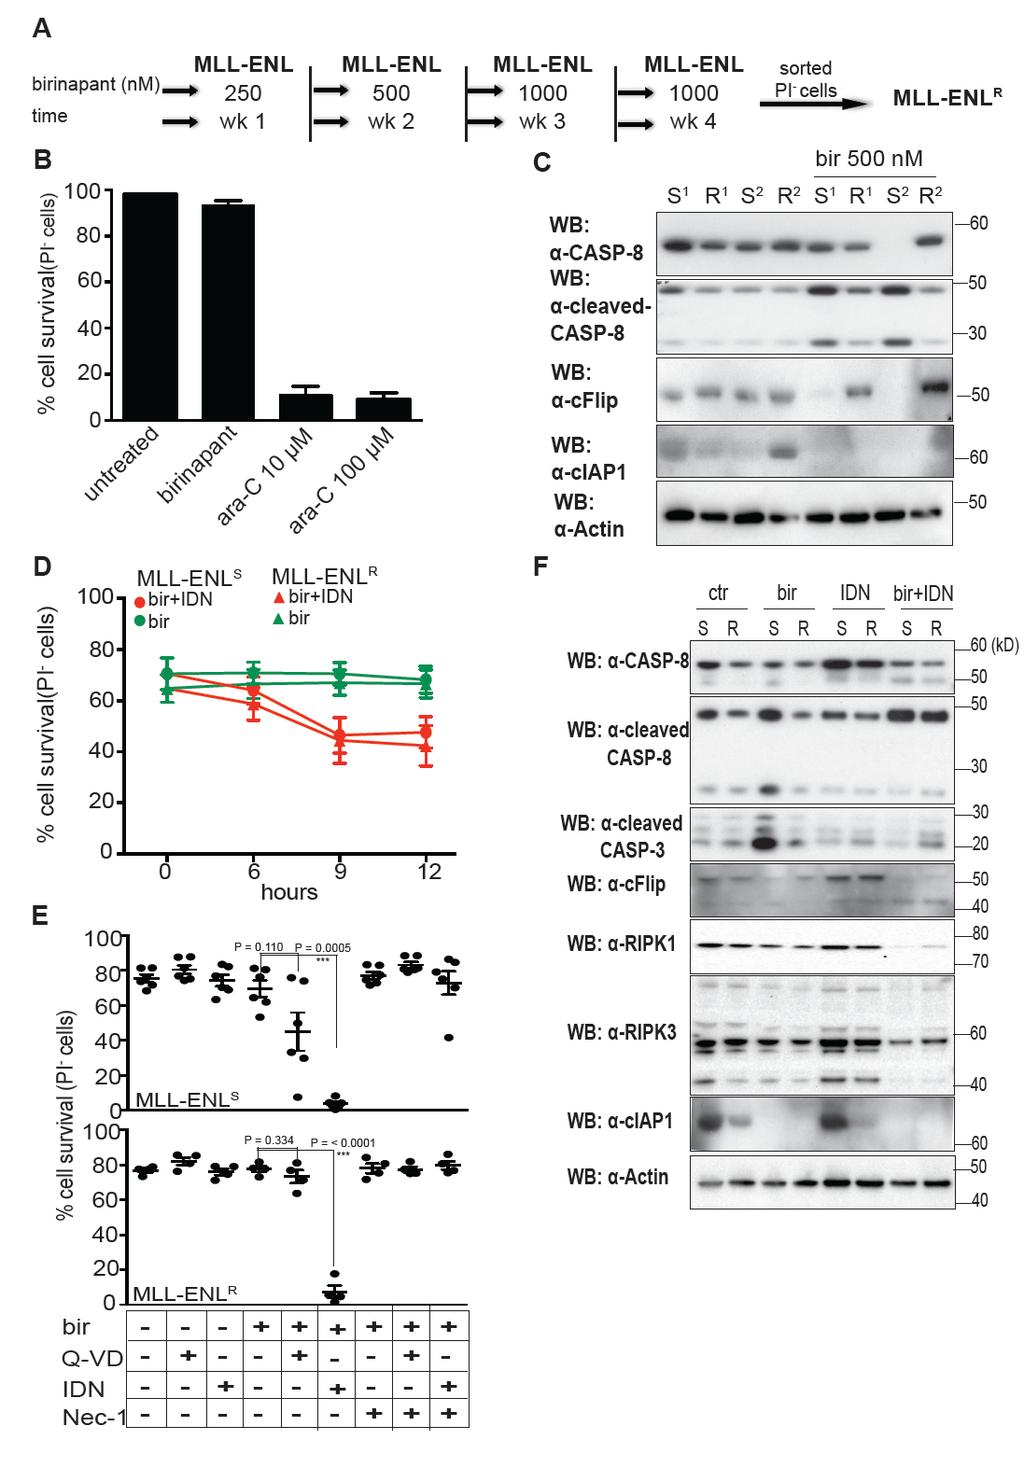
6 Fig. S3. Generation of MLL-ENL birinapant-resistant cells. (A) Schematic of generation of MLL-ENL birinapant-resistant cells. MLL-ENL sensitive cells were treated for 4 weeks with increasing concentrations of birinapant followed by sorting of surviving cells (PI-negative) after 16 hours of treatment with 2 μm birinapant. (B) MLL-ENL birinapant-treated PI-negative cells were tested for resistance to birinapant. Cells were cultured with 1000 nm birinapant or μm ara-c for 18 hours. Cell survival was determined by flow cytometry and PI staining. Data represent mean ± SEM of n=4 from 2 independent leukemias. (C) Comparison of protein expression in MLL-ENL sensitive and resistant leukemias after 8 hours of treatment with birinapant (500 nm). (D) Cell survival of MLL-ENL sensitive (S) and resistant (R) leukemias after treatment with birinapant (100 nm) or birinapant+idn-6556 (5 μm) for the indicated time period. Data represent mean ± SEM of n=3 from 3 independent tumors. (E) MLL-ENL sensitive (S) and resistant (R) leukemias were pre-treated for 30 min with IDN (5 μm) or Q-VD (10 μm) followed by birinapant (100 nm) ± Nec-1 (50 μm). Cell survival was determined after hours of treatment. Data represent mean ± SEM n=6. (F) Western blot analysis of birinapant sensitive (S) and resistant (R) MLL-ENL cells treated for 5 hours with birinapant (500 nm), IDN-6556 (5 μm), or the combination and probed with the indicated antibodies. Actin expression serves as loading control. Results are representative of 2 repeats.
7 Fig. S4.
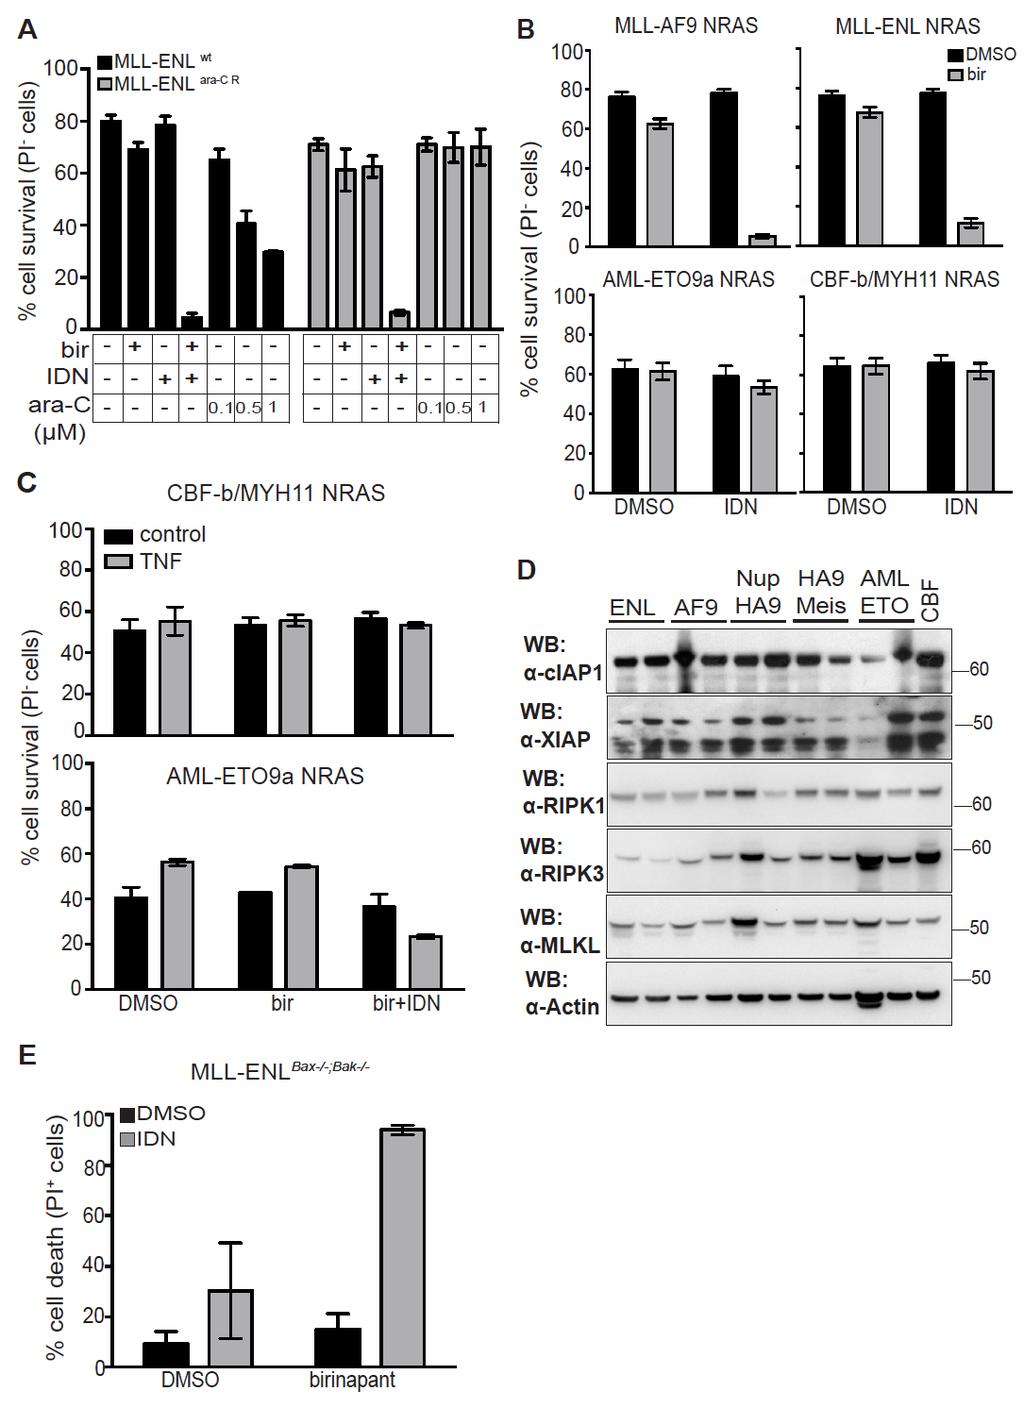
8 Fig. S4. IDN-6556 mediated TNF-dependent necroptosis in different AML subtypes. (A) MLL-ENL wild-type cells or those with acquired resistant to ara-c ( ara-c R ) were treated with 100 nm birinapant ± IDN-6556 (5 μm) or increasing concentrations of ara-c (100, 500, and 1000 nm). Cell viability was determined by PI staining 16 hours after treatment. Data represent mean ± SEM of n=5. (B) MLL-AF9, MLL-ENL, AML-ETO9a, and CBFß/MYH11 constitutively expressing activated NRAS were pre-treated for 30 min with IDN (5 μm) or vehicle followed by birinapant (500 nm) or vehicle. Cell survival was determined after 24 hours of treatment. Data represent mean ± SEM of n=3. (C) Bir/IDN resistant cells, AML- ETO9a and CBFß/MyH11, were treated with bir (1 μm) or bir+idn (10 μm) ± 100 ng/ml of recombinant TNF. Cell death was determined by PI exclusion at 24 hours after treatment. Data represent mean ± SD of n=2 from 2 independent experiments. (D) Comparison of protein expression in the bir/idn sensitive (MLL-ENL, MLL-AF9, Nup98HoxA9, HoxA9+Meis1) and resistant (AML-ETO9a and CBFß/MYH11) leukemias. Total cell lysates were analyzed for the indicated proteins. Actin was used as loading control. Western blot shown is representative of 3 repeats. (E) Bax -/- Bak -/- hematopoietic stem cells transduced with MLL- ENL were pre-treated or not with IDN (5 μm) followed by the addition of birinapant (100 nm) or vehicle. Cell survival was determined 16 hours after treatment. Data represent mean ± SEM of n=3.
 Survival of human leukemic cells, MV4-11 and U937, 24 and 48 hours after birinapant (500 nm) ± IDN (5 μm) treatment ± Nec-1 (50 μm).")
9 Fig. S5. Fig. S5. Prevention of IDN-6556 induced cell death in human AML cells by inhibiting TNFR1 or RIPK1 kinase activity. (A-B) Survival of human leukemic cells, MV4-11 and U937, 24 and 48 hours after birinapant (500 nm) ± IDN (5 μm) treatment ± Nec-1 (50 μm). (C-D) Survival of human leukemic cells, MV4-11 and U937, 24 hours after birinapant (500 nm) ± IDN (5 μm) treatment ± TNFR1 blocking antibody (100 ng/ml). All cell death was determined by PI exclusion. Data represent mean ± SM of n=3.
10 Fig. S6.
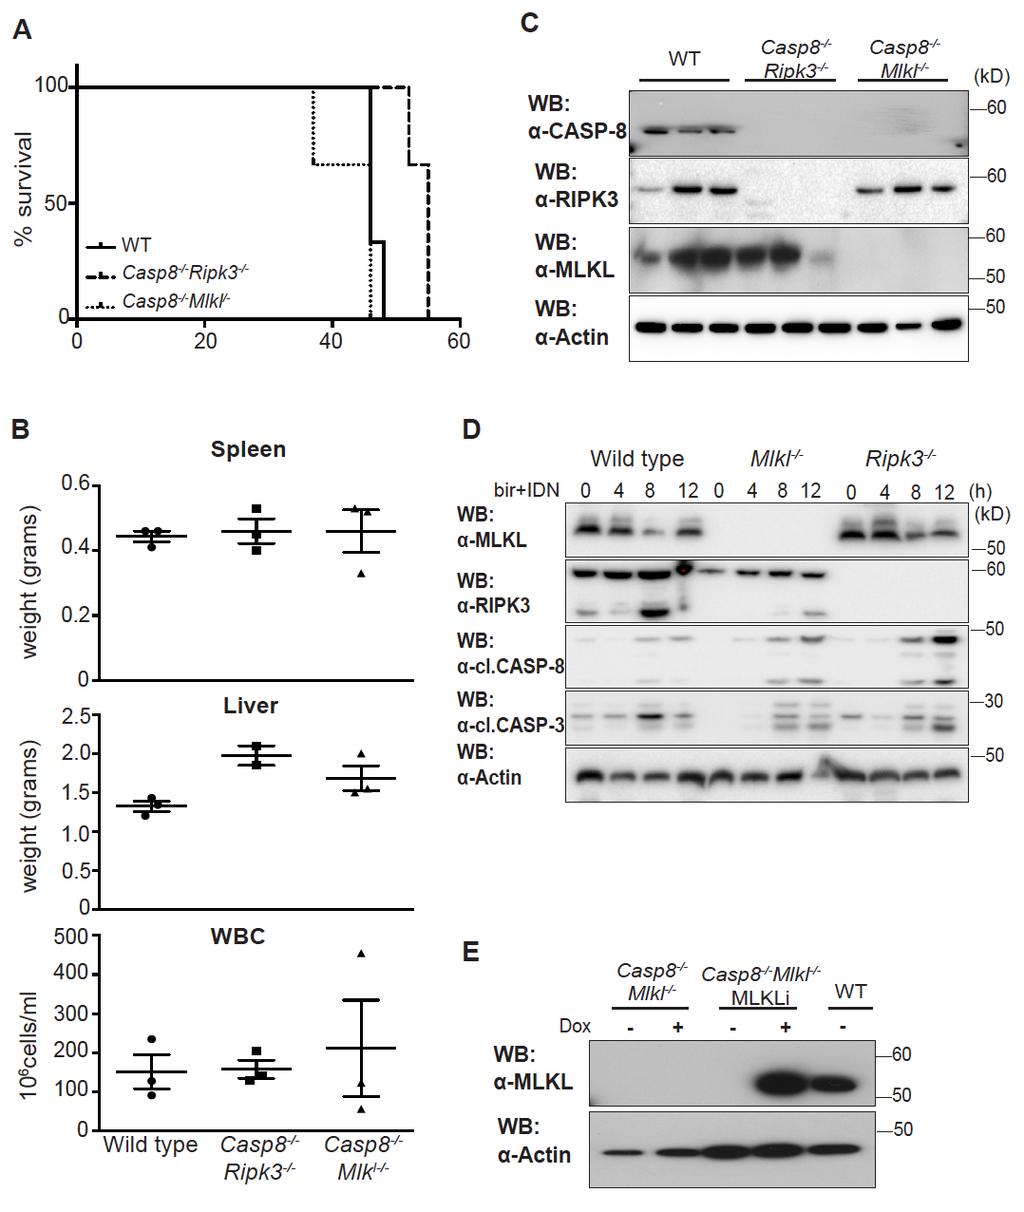
11 Fig. S6. Generation of MLL-ENL double-gene knockout leukemias. (A) Kaplan-Meier survival plot for MLL-ENL leukemias generated from wild type, Casp8 -/- Ripk3 -/-, and Casp8 -/- Mlkl -/- hematopoietic cells, n=3 from each genotype. (B) Spleen and liver weight and white blood cell count from mice reconstituted with MLL-ENL WT, Casp8 -/- Ripk3 -/-, and Casp8 -/- Mlkl -/- leukemic cells. (C) Expression of caspase-8, RIPK3, and MLKL in 3 biologically independent MLL-ENL leukemias derived from the indicated strains of mice. (D) Representative Western blot of MLKL, RIPK3, cleaved caspase-8 and -3 in WT, Mlkl -/-, and Ripk3 -/- MLL-ENL cells after bir (100 nm)+idn (5 μm) treatment for the indicated period of time. (E) Re-expression of MLKL in Casp8 -/- Mlkl -/- MLL-ENL leukemic cells. Cells were treated vehicle or 0.5 μg/ml doxycycline for 16 hours. Western blots of lysates were probed with antibody against MLKL. Actin was used as a loading control.
12 Fig. S7.
13 Fig. S7. Biochemical comparison of caspase inhibitors IDN-6556, Z-VAD-FMK, and Q- VD-OPh. The graphs show Kobs/[I] for caspase inhibitors Q-VD, Z-VAD, and IDN-6556 vs caspase-8 homodimers, caspase-8/cflip heterodimers, caspase-3, and caspase-9.
14 Fig. S8.
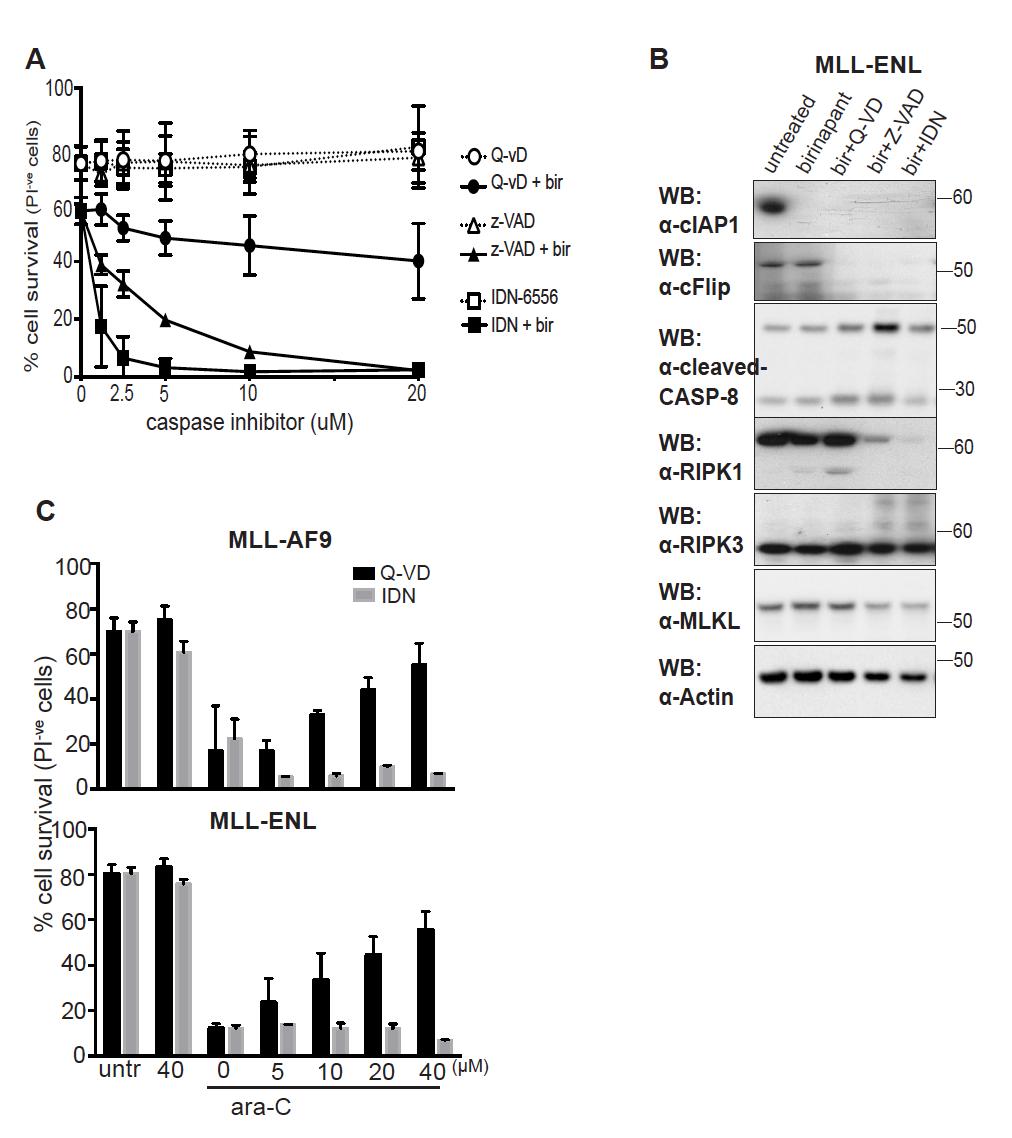
15 Fig. S8. Comparison of the ability of caspase inhibitors to induce or block cell death in leukemic cells. (A) MLL-ENL leukemic cells were pre-treated (30 min) with the indicated concentrations of Q-VD, Z-VAD, or IDN-6556 followed by birinapant (100 nm) or vehicle. Cell survival was assessed by PI staining and flow cytometry after 16 hours. Data represent mean ± SEM, n=6. (B) Protein expression in MLL-ENL leukemic cells pre-treated with 10 μm of each caspase inhibitor Q-VD, Z-VAD, or IDN-6656, followed by 100 nm of birinapant. Total cell lysates were prepared 5 hours after treatment and probed with the indicated antibodies. Representative data of 3 independent leukemias. (C) Comparison of the ability of the caspase inhibitors IDN-6556 and Q-VD to inhibit ara-c-mediated apoptotic cell death. MLL-ENL leukemic cells were pre-treated (30 min) with 10 μm of Q-VD or IDN-6556 followed by the indicated doses of ara-c. Cell survival was determined by PI staining and flow cytometry 16 hours after treatment. Data represent mean ± SEM, n=3.
16 Fig. S9. Fig. S9. Combined treatment with bir/idn in vivo. (A) No toxicity observed in vivo for combined birinapant plus IDN-6556 therapy. Measurements of body weight, spleen, and liver
17 from C57BL/6 female mice treated for 4 weeks (i.p. injections 2x/week) with birinapant (7.5 mg/kg or 10 mg/kg) + IDN-6556 (2.5 mg/kg). Organs and blood were analyzed 4-6 weeks after treatment stopped. (B-C) Kaplan-Meier survival curves of C57BL/6 mice transplanted with MLL-ENL birinapant-resistant or MLL-AF9 leukemic cells treated (i.p.) with the indicated drugs. Drugs were administered i.p. starting 3 days after retransplant for a period of 4 weeks with 2 injections a week. Mice were analyzed when signs of disease (anemia, enlarge spleen, hunched posture) were observed. P values were obtained by comparing mice from bir or bir+idn treated groups to vehicle.
18 Fig. S10.
19 Fig. S10. Safety of combined bir/idn treatment in healthy human cells. (A) CD34+ stem cells from 3 independent control patients, were treated for 48 hours with birinapant (0, 250, or 500 nm) ± IDN-6556 (5 µm) or conventional chemotherapies: cytarabine (10 µm) or daunorubicin (0.4 µm). Cell viability was determined by flow cytometry of PI-negative cells. Data represent means of 3 independent experiments. (B) Colony forming assays were performed on CD34+ mobilized peripheral blood progenitor cells from 2 independent patients. Birinapant and IDN were added to plates on day 0 at the indicated concentrations. Colony numbers were normalized to DMSO control after 14 days of incubation. (C) PBMC, CD3+CD4+ T cells, CD19+ B cells, and CD16+ NK cells from 3 independent control patients were treated for 48 hours with birinapant (1000 nm) ± IDN-6556 (5 µm) or conventional chemotherapies: cytarabine (10 µm), daunorubicin (0.4 µm), or idarubicin (0.4 µm). Cell viability was determined by flow cytometry of PI-negative cells. Data represent means of 3 independent experiments.
20 Patient Age Sex WHO classification 1 60 M AML with myelodysplastic related changes (progression from MDS) 2 44 M AML relapsing post-allograft Blasts Karyotype MLL WBC Other (x10 9 /L) 11q % del(7) Neg - (p13p15) % Normal Neg FLT3-ITD IDH1 R132C 3 28 F Acute myelomonocytic leukemia % Normal Neg FLT3-ITD DNMT3A R882H 4 57 F Acute myelomonocytic leukemia % Normal Neg FLT3-ITD NPM M AML with inv (3) % inv(3) (q21q26) Neg FLT3-ITD 6 51 M AML with inv (16) % inv(16) (p11.2q22) Neg - 7?? AML with MLL??? Pos M AML with inv (16) % inv(16) (p13q22) Neg FLT3-ITD Table S1 - Deidentified patient data.
Supplementary fig. 1. Crystals induce necroptosis does not involve caspases, TNF receptor or NLRP3. A. Mouse tubular epithelial cells were pretreated
 Supplementary fig. 1. Crystals induce necroptosis does not involve caspases, TNF receptor or NLRP3. A. Mouse tubular epithelial cells were pretreated with zvad-fmk (10µM) and exposed to calcium oxalate
SUPPLEMENTARY INFORMATION
 SUPPLEMENTARY INFORMATION doi:10.1038/nature11429 S1a 6 7 8 9 Nlrc4 allele S1b Nlrc4 +/+ Nlrc4 +/F Nlrc4 F/F 9 Targeting construct 422 bp 273 bp FRT-neo-gb-PGK-FRT 3x.STOP S1c Nlrc4 +/+ Nlrc4 F/F casp1
Nature Genetics: doi: /ng Supplementary Figure 1
 Supplementary Figure 1 MSI2 interactors are associated with the riboproteome and are functionally relevant. (a) Coomassie blue staining of FLAG-MSI2 immunoprecipitated complexes. (b) GO analysis of MSI2-interacting
Supplemental Figure 1. (A) Western blot for the expression of RIPK1 in HK-2 cells treated with or without LPS (1 µg/ml) for indicated times.
 Western blot for the expression of RIPK1 in HK-2 cells treated with or without LPS (1 µg/ml) for indicated times.") Supplemental Figure 1. (A) Western blot for the expression of RIPK1 in HK-2 cells treated with or without LPS (1 µg/ml) for indicated times. Western blots shown are representative results from 3 independent
Supplemental Figure 1. (A) Western blot for the expression of RIPK1 in HK-2 cells treated with or without LPS (1 µg/ml) for indicated times. Western blots shown are representative results from 3 independent
SUPPLEMENTARY INFORMATION
 doi:10.1038/nature11095 Supplementary Table 1. Summary of the binding between Angptls and various Igdomain containing receptors as determined by flow cytometry analysis. The results were summarized from
Samali A Figure S1.
 Deegan S, Saveljeva S, Logue SE, Pakos-Zebrucka K, Gupta S, Vandenabeele P, Bertrand MJ,Samali A. (2014) Deficiency in the mitochondrial apoptotic pathway reveals the toxic potential of autophagy under
Effective Targeting of Quiescent Chronic Myelogenous
 Cancer Cell, Volume 7 Supplemental Information Effective Targeting of Quiescent Chronic Myelogenous Leukemia Stem Cells by Histone Deacetylase Inhibitors in Combination with Imatinib Mesylate Bin Zhang,
SUPPLEMENTARY FIG. S3. Kaplan Meier survival analysis followed with log-rank test of de novo acute myeloid leukemia patients selected by age <60, IA
 Supplementary Data Supplementary Appendix A: Treatment Protocols Treatment protocols of 123 cases patients were treated with the protocols as follows: 110 patients received standard DA (daunorubicin 45
Prolonged mitotic arrest induces a caspase-dependent DNA damage
 SUPPLEMENTARY INFORMATION Prolonged mitotic arrest induces a caspase-dependent DNA damage response at telomeres that determines cell survival Karolina O. Hain, Didier J. Colin, Shubhra Rastogi, Lindsey
SUPPLEMENTARY INFORMATION
 a. Smo+/+ b. Smo+/+ 5.63 5.48 c. Lin- d. e. 6 5 4 3 Ter119 Mac B T Sca1 Smo+/+ 25 15 2 o BMT 2 1 5 * Supplementary Figure 1: Deletion of Smoothened does not alter the frequency of hematopoietic lineages
Table S1. New colony formation 7 days after stimulation with doxo and VCR in JURKAT cells
 Table S1. New colony formation 7 days after stimulation with and in JURKAT cells drug co + number of colonies 7±14 4±7 48±11 JURKAT cells were stimulated and analyzed as in Table 1. Drug concentrations
Supplementary Figure 1. Successful excision of genes from WBM lysates and
 Supplementary Information: Supplementary Figure 1. Successful excision of genes from WBM lysates and survival of mice with different genotypes. (a) The proper excision of Pten, p110α, p110α and p110δ was
Supplementary Figure 1. A. Bar graph representing the expression levels of the 19 indicated genes in the microarrays analyses comparing human lung
 Supplementary Figure 1. A. Bar graph representing the expression levels of the 19 indicated genes in the microarrays analyses comparing human lung immortalized broncho-epithelial cells (AALE cells) expressing
SHREE ET AL, SUPPLEMENTAL MATERIALS. (A) Workflow for tumor cell line derivation and orthotopic implantation.
 Workflow for tumor cell line derivation and orthotopic implantation.") SHREE ET AL, SUPPLEMENTAL MATERIALS SUPPLEMENTAL FIGURE AND TABLE LEGENDS Supplemental Figure 1. Derivation and characterization of TS1-TGL and TS2-TGL PyMT cell lines and development of an orthotopic
SHREE ET AL, SUPPLEMENTAL MATERIALS SUPPLEMENTAL FIGURE AND TABLE LEGENDS Supplemental Figure 1. Derivation and characterization of TS1-TGL and TS2-TGL PyMT cell lines and development of an orthotopic
Molecular Markers in Acute Leukemia. Dr Muhd Zanapiah Zakaria Hospital Ampang
 Molecular Markers in Acute Leukemia Dr Muhd Zanapiah Zakaria Hospital Ampang Molecular Markers Useful at diagnosis Classify groups and prognosis Development of more specific therapies Application of risk-adjusted
Type of file: PDF Title of file for HTML: Supplementary Information Description: Supplementary Figures
 Type of file: PDF Title of file for HTML: Supplementary Information Description: Supplementary Figures Type of file: MOV Title of file for HTML: Supplementary Movie 1 Description: NLRP3 is moving along
Plasma exposure levels from individual mice 4 hours post IP administration at the
 Supplemental Figure Legends Figure S1. Plasma exposure levels of MKC-3946 in mice. Plasma exposure levels from individual mice 4 hours post IP administration at the indicated dose mg/kg. Data represent
Programmed necrosis, not apoptosis, is a key mediator of cell loss and DAMP-mediated inflammation in dsrna-induced retinal degeneration
 Programmed necrosis, not apoptosis, is a key mediator of cell loss and DAMP-mediated inflammation in dsrna-induced retinal degeneration The Harvard community has made this article openly available. Please
Supplementary Figure 1: Expression of NFAT proteins in Nfat2-deleted B cells (a+b) Protein expression of NFAT2 (a) and NFAT1 (b) in isolated splenic
 Protein expression of NFAT2 (a) and NFAT1 (b) in isolated splenic") Supplementary Figure 1: Expression of NFAT proteins in Nfat2-deleted B cells (a+b) Protein expression of NFAT2 (a) and NFAT1 (b) in isolated splenic B cells from WT Nfat2 +/+, TCL1 Nfat2 +/+ and TCL1 Nfat2
Supplementary Figure 1: Expression of NFAT proteins in Nfat2-deleted B cells (a+b) Protein expression of NFAT2 (a) and NFAT1 (b) in isolated splenic B cells from WT Nfat2 +/+, TCL1 Nfat2 +/+ and TCL1 Nfat2
BL-8040: BEST-IN-CLASS CXCR4 ANTAGONIST FOR TREATMENT OF ONCOLOGICAL MALIGNANCIES. Overview and Mechanism of Action Dr.
 BL-8040: BEST-IN-CLASS CXCR4 ANTAGONIST FOR TREATMENT OF ONCOLOGICAL MALIGNANCIES Overview and Mechanism of Action Dr. Leah Klapper, CSO 88 BL-8040: Novel CXCR4 Antagonist For Hematological Cancers Indications:
Page 39 of 44. 8h LTA & AT h PepG & AT h LTA
 Page 39 of 44 Fig. S1 A: B: C: D: 8h LTA 8h LTA & AT7519 E: F: 8h PepG G: 8h PepG & AT7519 Fig. S1. AT7519 overrides the survival effects of lipoteichoic acid (LTA) and peptidoglycan (PepG). (A) Human
Jeanne Palmer February 26, 2017 Mayo Clinic, Phoenix, AZ
 Jeanne Palmer February 26, 2017 Mayo Clinic, Phoenix, AZ What is acute leukemia? Cancer of the white blood cells Acute leukemia- Acute myelogenous leukemia Acute myeloid leukemia Myelofibrosis- Blast phase
Acute myeloid leukemia. M. Kaźmierczak 2016
 Acute myeloid leukemia M. Kaźmierczak 2016 Acute myeloid leukemia Malignant clonal disorder of immature hematopoietic cells characterized by clonal proliferation of abnormal blast cells and impaired production
NUP214-ABL1 Fusion: A Novel Discovery in Acute Myelomonocytic Leukemia
 Case 0094 NUP214-ABL1 Fusion: A Novel Discovery in Acute Myelomonocytic Leukemia Jessica Snider, MD Medical University of South Carolina Case Report - 64 year old Caucasian Male Past Medical History Osteoarthritis
Sunitinib, an orally available receptor tyrosine kinase inhibitor, induces monocytic
 Sunitinib, an orally available receptor tyrosine kinase inhibitor, induces monocytic differentiation of acute myeogenouse leukemia cells that is enhanced by 1,25-dihydroxyviatmin D 3. To the Editor: Sunitinib,
5/21/2018. Disclosures. Objectives. Normal blood cells production. Bone marrow failure syndromes. Story of DNA
 AML: Understanding your diagnosis and current and emerging treatments Nothing to disclose. Disclosures Mohammad Abu Zaid, MD Assistant Professor of Medicine Indiana University School of Medicine Indiana
X P. Supplementary Figure 1. Nature Medicine: doi: /nm Nilotinib LSK LT-HSC. Cytoplasm. Cytoplasm. Nucleus. Nucleus
 a b c Supplementary Figure 1 c-kit-apc-eflu780 Lin-FITC Flt3-Linc-Kit-APC-eflu780 LSK Sca-1-PE-Cy7 d e f CD48-APC LT-HSC CD150-PerCP-cy5.5 g h i j Cytoplasm RCC1 X Exp 5 mir 126 SPRED1 SPRED1 RAN P SPRED1
Supplementary Appendix
 Supplementary Appendix This appendix has been provided by the authors to give readers additional information about their work. Supplement to: Patel JP, Gönen M, Figueroa ME, et al. Prognostic relevance
Appendix Figure S1 A B C D E F G H
 ppendix Figure S1 C D E F G H ppendix Figure S1. RT and chemotherapy alter PD-L1 expression in PDC cells. Flow cytometric analysis of PD-L1 expression in () KPC and () Pan02 cells following treatment with
Supporting Information
 Copyright WILEY-VCH Verlag GmbH & Co. KGaA, 69469 Weinheim, Germany, 212. Supporting Information for Adv. Funct. Mater., DOI:.2/adfm.2122233 MnO Nanocrystals: A Platform for Integration of MRI and Genuine
a b G75 G60 Sw-2 Sw-1 Supplementary Figure 1. Structure predictions by I-TASSER Server.
 a b G75 2 2 G60 Sw-2 Sw-1 Supplementary Figure 1. Structure predictions by I-TASSER Server. a. Overlay of top 10 models generated by I-TASSER illustrates the potential effect of 7 amino acid insertion
CHALLENGING CASES PRESENTATION
 CHALLENGING CASES PRESENTATION Michael C. Wiemann, MD, FACP Program Co-Chair and Vice President Indy Hematology Education President, Clinical St. John Providence Physician Network Detroit, Michigan 36
Nature Immunology: doi: /ni Supplementary Figure 1. Huwe1 has high expression in HSCs and is necessary for quiescence.
 Supplementary Figure 1 Huwe1 has high expression in HSCs and is necessary for quiescence. (a) Heat map visualizing expression of genes with a known function in ubiquitin-mediated proteolysis (KEGG: Ubiquitin
Test Name Results Units Bio. Ref. Interval. Positive
 LL - LL-ROHINI (NATIONAL REFERENCE 135091534 Age 36 Years Gender Female 1/9/2017 120000AM 1/9/2017 105316AM 2/9/2017 104147AM Ref By Final LEUKEMIA GENETIC ROFILE ANY SIX MARKERS, CR QUALITATIVE AML ETO
Impact of Biomarkers in the Management of Patients with Acute Myeloid Leukemia
 Impact of Biomarkers in the Management of Patients with Acute Myeloid Leukemia Hartmut Döhner Medical Director, Department of Internal Medicine III Director, Comprehensive Cancer Center Ulm Ulm University,
Dual PI3K/mTOR inhibition shows antileukemic activity in MLL rearranged acute. Supplemental method S1: Confirmation of RAS mutations
 Supplementary information Dual PI3K/mTOR inhibition shows antileukemic activity in MLL rearranged acute myeloid leukemia Sandhöfer N. et al. Supplemental methods S1-S4: Supplemental method S1: Confirmation
c Ischemia (30 min) Reperfusion (8 w) Supplementary Figure bp 300 bp Ischemia (30 min) Reperfusion (4 h) Dox 20 mg/kg i.p.
 Reperfusion (8 w) Supplementary Figure bp 300 bp Ischemia (30 min) Reperfusion (4 h) Dox 20 mg/kg i.p.") a Marker Ripk3 +/ 5 bp 3 bp b Ischemia (3 min) Reperfusion (4 h) d 2 mg/kg i.p. 1 w 5 w Sacrifice for IF size A subset for echocardiography and morphological analysis c Ischemia (3 min) Reperfusion (8
a Marker Ripk3 +/ 5 bp 3 bp b Ischemia (3 min) Reperfusion (4 h) d 2 mg/kg i.p. 1 w 5 w Sacrifice for IF size A subset for echocardiography and morphological analysis c Ischemia (3 min) Reperfusion (8
Intrinsic and chemo-sensitizing activity of SMAC-mimetics on high-risk childhood acute lymphoblastic leukemia
 SUPPLEMENTARY INFORMATION Intrinsic and chemo-sensitizing activity of SMAC-mimetics on high-risk childhood acute lymphoblastic leukemia Melanie Schirmer, Luca Trentin, Manon Queudeville, Felix Seyfried,
Supplementary Information
 Supplementary Information Targeted Disruption of the EZH2/EED Complex Inhibits EZH2- dependent Cancer Woojin Kim 1,2,3, Gregory H. Bird 2,3,4, Tobias Neff 5, Guoji Guo 1,2,3, Marc A. Kerenyi 1,2,3, Loren
Supplementary Figures and Tables
 Supplementary Figures and Tables Supplementary Figure S1. CNTRL-FGFR1 fusion kinase induces both T-cell lymphoma and AML. A) Peripheral blood smears from a CNTRL-FGFR1 mouse, showing predominance of immature
RCPA Research Award Final Progress Review
 RCPA Research Award 2010-2011 Final Progress Review Name: Dr Craig Wallington-Beddoe Degree/Institution/Year: PhD, The University of Sydney, Year 2 Research Project Title: New Therapeutic Strategies for
HEMATOLOGIC MALIGNANCIES BIOLOGY
 HEMATOLOGIC MALIGNANCIES BIOLOGY Failure of terminal differentiation Failure of differentiated cells to undergo apoptosis Failure to control growth Neoplastic stem cell FAILURE OF TERMINAL DIFFERENTIATION
New concepts in the management of elderly patients with AML
 New concepts in the management of elderly patients with AML Martha L. Arellano, MD Associate Professor of Hematology/Oncology Director, Hematology & Medical Oncology Fellowship Program Winship Cancer Institute
Supplementary Figure S1. TRAIL-induced necroptosis at acidic phe is dependent on
 Online supplementary information Supplementary Figure S1. TRAIL-induced necroptos at acidic phe is dependent on RIPK1 and RIPK3. (a) HT29 cells were tranently transfected with RIPK1, RIPK3, RIPK1/ RIPK3
Supplementary Figures
 Supplementary Figures Figure S1. Validation of kinase regulators of ONC201 sensitivity. Validation and screen results for changes in cell viability associated with the combination of ONC201 treatment (1
Welcome and Introductions
 Information for Patients With Acute Myeloid Leukemia (AML) Welcome and Introductions Information for Patients With Acute Myeloid Leukemia (AML) Mark B. Juckett, MD Vice Chair for Clinical Affairs and Quality
Nature Neuroscience: doi: /nn Supplementary Figure 1
 Supplementary Figure 1 EGFR inhibition activates signaling pathways (a-b) EGFR inhibition activates signaling pathways (a) U251EGFR cells were treated with erlotinib (1µM) for the indicated times followed
Supplementary Figure 1. DNA methylation of the adiponectin promoter R1, Pparg2, and Tnfa promoter in adipocytes is not affected by obesity.
 Supplementary Figure 1. DNA methylation of the adiponectin promoter R1, Pparg2, and Tnfa promoter in adipocytes is not affected by obesity. (a) Relative amounts of adiponectin, Ppar 2, C/ebp, and Tnf mrna
N Engl J Med Volume 373(12): September 17, 2015
: September 17, 2015") Review Article Acute Myeloid Leukemia Hartmut Döhner, M.D., Daniel J. Weisdorf, M.D., and Clara D. Bloomfield, M.D. N Engl J Med Volume 373(12):1136-1152 September 17, 2015 Acute Myeloid Leukemia Most
Review Article Acute Myeloid Leukemia Hartmut Döhner, M.D., Daniel J. Weisdorf, M.D., and Clara D. Bloomfield, M.D. N Engl J Med Volume 373(12):1136-1152 September 17, 2015 Acute Myeloid Leukemia Most
Nature Immunology: doi: /ni Supplementary Figure 1. Cellularity of leukocytes and their progenitors in naive wild-type and Spp1 / mice.
 Supplementary Figure 1 Cellularity of leukocytes and their progenitors in naive wild-type and Spp1 / mice. (a, b) Gating strategies for differentiated cells including PMN (CD11b + Ly6G hi and CD11b + Ly6G
SUPPLEMENTARY INFORMATION
 SUPPLEMENTARY INFORMATION doi:1.138/nature9814 a A SHARPIN FL B SHARPIN ΔNZF C SHARPIN T38L, F39V b His-SHARPIN FL -1xUb -2xUb -4xUb α-his c Linear 4xUb -SHARPIN FL -SHARPIN TF_LV -SHARPINΔNZF -SHARPIN
New drugs in Acute Leukemia. Cristina Papayannidis, MD, PhD University of Bologna
 New drugs in Acute Leukemia Cristina Papayannidis, MD, PhD University of Bologna Challenges to targeted therapy in AML Multiple subtypes based upon mutations/cytogenetic aberrations No known uniform genomic
A pediatric patient with acute leukemia of ambiguous lineage with a NUP98-NSD1 rearrangement SH
 A pediatric patient with acute leukemia of ambiguous lineage with a NUP98NSD1 rearrangement SH20170203 Rebecca LeemanNeill, Ronald Rice, Anita Malek, Patricia Raciti, Susan Hsiao, Mahesh Mansukhani, Bachir
All patients with FLT3 mutant AML should receive midostaurin-based induction therapy. Not so fast!
 All patients with FLT3 mutant AML should receive midostaurin-based induction therapy Not so fast! Harry P. Erba, M.D., Ph.D. Professor, Internal Medicine Director, Hematologic Malignancy Program University
Test Name Results Units Bio. Ref. Interval. Positive
 LL - LL-ROHINI (NATIONAL REFERENCE 135091533 Age 28 Years Gender Male 1/9/2017 120000AM 1/9/2017 105415AM 4/9/2017 23858M Ref By Final LEUKEMIA DIAGNOSTIC COMREHENSIVE ROFILE, ANY 6 MARKERS t (1;19) (q23
Supplemental Figure 1. Signature gene expression in in vitro differentiated Th0, Th1, Th2, Th17 and Treg cells. (A) Naïve CD4 + T cells were cultured
 Naïve CD4 + T cells were cultured") Supplemental Figure 1. Signature gene expression in in vitro differentiated Th0, Th1, Th2, Th17 and Treg cells. (A) Naïve CD4 + T cells were cultured under Th0, Th1, Th2, Th17, and Treg conditions. mrna
Supplemental Figure 1. Signature gene expression in in vitro differentiated Th0, Th1, Th2, Th17 and Treg cells. (A) Naïve CD4 + T cells were cultured under Th0, Th1, Th2, Th17, and Treg conditions. mrna
Reporting cytogenetics Can it make sense? Daniel Weisdorf MD University of Minnesota
 Reporting cytogenetics Can it make sense? Daniel Weisdorf MD University of Minnesota Reporting cytogenetics What is it? Terminology Clinical value What details are important Diagnostic Tools for Leukemia
How the Treatment of Acute Myeloid Leukemia is Changing in 2019
 How the Treatment of Acute Myeloid Leukemia is Changing in 2019 Guido Marcucci, M.D. Director, Gehr Family Center for Leukemia Research Chair, Dept. Hematologic Malignancies Translational Science City
Pharmacologic inhibition of histone demethylation as a therapy for pediatric brainstem glioma
 Supplementary information for: Pharmacologic inhibition of histone demethylation as a therapy for pediatric brainstem glioma Rintaro Hashizume 1, Noemi Andor 2, Yuichiro Ihara 2, Robin Lerner 2, Haiyun
Juan Ma 1, Jennifer Dunlap 2, Lisong Shen 1, Guang Fan 2 1
 Juan Ma 1, Jennifer Dunlap 2, Lisong Shen 1, Guang Fan 2 1 Xin Hua Hospital, Shanghai, China 2 Oregon Health & Science University, Portland, OR, United States AML is a hematopoietic neoplasms characterized
Acute Myeloid Leukemia
 Acute Myeloid Leukemia Guido Marcucci, M.D. Director, Gehr Family Center for Leukemia Research Hematologic Malignancies and Stem Cell Transplantation Institute City of Hope Acute Myeloid Leukemia Gene
(a) Significant biological processes (upper panel) and disease biomarkers (lower panel)
 Significant biological processes (upper panel) and disease biomarkers (lower panel)") Supplementary Figure 1. Functional enrichment analyses of secretomic proteins. (a) Significant biological processes (upper panel) and disease biomarkers (lower panel) 2 involved by hrab37-mediated secretory
Supplementary Figure 1. Functional enrichment analyses of secretomic proteins. (a) Significant biological processes (upper panel) and disease biomarkers (lower panel) 2 involved by hrab37-mediated secretory
Krishna Reddy CH and Ashwin Dalal. Diagnostics Division, Centre for DNA Fingerprinting and Diagnostics, Hyderabad
 Clinical Cytogenetics in the Diagnosis and Prognosis of Leukemias Krishna Reddy CH and Ashwin Dalal Diagnostics Division, Centre for DNA Fingerprinting and Diagnostics, Hyderabad Email: krishnareddy.chr@gmail.com
Supplemental information
 Supplemental information PI(3)K p11δ controls the sucellular compartmentalization of TLR4 signaling and protects from endotoxic shock Ezra Aksoy, Salma Taoui, David Torres, Sandrine Delauve, Aderrahman
Supplementary Figures for TSC1 controls macrophage polarization to prevent inflammatory disorder by Linnan Zhu et al
 Supplementary Figures for TSC1 controls macrophage polarization to prevent inflammatory disorder by Linnan Zhu et al Suppl. Fig. 1 Tissue DN C Proteins kd TSC1-17 TSC 1 loxp bp -48-285 ctin PEMs Neutrophils
Molecularly Targeted Therapies - Strategies of the AMLSG
 Molecularly Targeted Therapies - Strategies of the AMLSG Richard Schlenk Department of Internal Medicine III Ulm University, Germany Genotype-adapted Leukemia Program NAPOLEON GIMEMA/AMLSG/SAL APL [t(15;17)]
Supporting Information. FADD regulates NF-кB activation and promotes ubiquitination of cflip L to induce. apoptosis
 1 2 Supporting Information 3 4 5 FADD regulates NF-кB activation and promotes ubiquitination of cflip L to induce apoptosis 6 7 Kishu Ranjan and Chandramani Pathak* 8 9 Department of Cell Biology, School
Description of Supplementary Files. File Name: Supplementary Information Description: Supplementary Figures and Supplementary Tables
 Description of Supplementary Files File Name: Supplementary Information Description: Supplementary Figures and Supplementary Tables Supplementary Figure 1: (A), HCT116 IDH1-WT and IDH1-R132H cells were
Concomitant WT1 mutations predicted poor prognosis in CEBPA double-mutated acute myeloid leukemia
 Concomitant WT1 mutations predicted poor prognosis in CEBPA double-mutated acute myeloid leukemia Feng-Ming Tien, Hsin-An Hou, Jih-Luh Tang, Yuan-Yeh Kuo, Chien-Yuan Chen, Cheng-Hong Tsai, Ming Yao, Chi-Cheng
Corporate Medical Policy. Policy Effective February 23, 2018
 Corporate Medical Policy Genetic Testing for FLT3, NPM1 and CEBPA Mutations in Acute File Name: Origination: Last CAP Review: Next CAP Review: Last Review: genetic_testing_for_flt3_npm1_and_cebpa_mutations_in_acute_myeloid_leukemia
BRaf V600E cooperates with Pten silencing to elicit metastatic melanoma (Nature Genetics Supplementary Information)
") BRaf V600E cooperates with Pten silencing to elicit metastatic melanoma (Nature Genetics Supplementary Information) David Dankort, David P. Curley, Robert A. Cartlidge, Betsy Nelson, Anthony N. Karnezis,
BRaf V600E cooperates with Pten silencing to elicit metastatic melanoma (Nature Genetics Supplementary Information) David Dankort, David P. Curley, Robert A. Cartlidge, Betsy Nelson, Anthony N. Karnezis,
Supplementary Materials for
 www.sciencesignaling.org/cgi/content/full/7/318/ra29/dc1 Supplementary Materials for Antagonism of EGFR and HER3 Enhances the Response to Inhibitors of the PI3K-Akt Pathway in Triple-Negative Breast Cancer
5K ALDEFLUOR-positive/ CXCR1-negative. 5K ALDEFLUOR-positive/ CXCR1-positive BAAA BAAA CXCR1-APC BAAA BAAA CXCR1-APC
 A +DEAB -DEAB K ALDEFLUOR-positive/ CXCR-negative BAAA BAAA CXCR-APC B +DEAB -DEAB K ALDEFLUOR-positive/ CXCR-positive BAAA BAAA CXCR-APC C Supplemental Figure. Tumorigenicity of the ALDEFLUOR-positive/CXCR-positive
L1 on PyMT tumor cells but Py117 cells are more responsive to IFN-γ. (A) Flow
 Flow") A MHCI B PD-L1 Fold expression 8 6 4 2 Fold expression 3 2 1 No tx 1Gy 2Gy IFN Py117 Py117 Supplementary Figure 1. Radiation and IFN-γ enhance MHCI expression and PD- L1 on PyMT tumor cells but Py117 cells
A MHCI B PD-L1 Fold expression 8 6 4 2 Fold expression 3 2 1 No tx 1Gy 2Gy IFN Py117 Py117 Supplementary Figure 1. Radiation and IFN-γ enhance MHCI expression and PD- L1 on PyMT tumor cells but Py117 cells
AML Genomics 11/27/17. Normal neutrophil maturation. Acute Myeloid Leukemia (AML) = block in differentiation. Myelomonocy9c FAB M5
 = block in differentiation. Myelomonocy9c FAB M5") AML Genomics 1 Normal neutrophil maturation Acute Myeloid Leukemia (AML) = block in differentiation AML with minimal differen9a9on FAB M1 Promyelocy9c leukemia FAB M3 Myelomonocy9c FAB M5 2 1 Principle
AML Genomics 1 Normal neutrophil maturation Acute Myeloid Leukemia (AML) = block in differentiation AML with minimal differen9a9on FAB M1 Promyelocy9c leukemia FAB M3 Myelomonocy9c FAB M5 2 1 Principle
Problem Set 8 Key 1 of 8
 7.06 2003 Problem Set 8 Key 1 of 8 7.06 2003 Problem Set 8 Key 1. As a bright MD/PhD, you are interested in questions about the control of cell number in the body. Recently, you've seen three patients
Safety and Efficacy of Venetoclax Plus Low-Dose Cytarabine in Treatment-Naïve Patients Aged 65 Years With Acute Myeloid Leukemia
 Safety and Efficacy of Venetoclax Plus Low-Dose Cytarabine in Treatment-Naïve Patients Aged 65 Years With Acute Myeloid Leukemia Abstract 102 Wei AH, Strickland SA, Roboz GJ, Hou J-Z, Fiedler W, Lin TL,
Control shrna#9 shrna#12. shrna#12 CD14-PE CD14-PE
 a Control shrna#9 shrna#12 c Control shrna#9 shrna#12 e Control shrna#9 shrna#12 h 14 12 CFU-E BFU-E GEMM GM b Colony number 7 6 5 4 3 2 1 6 pm A pa pc CFU-E BFU-E GEMM GM pu pgm A p pg B d f CD11b-APC
Supplementary Figure 1. Characterization of basophils after reconstitution of SCID mice
 Supplementary figure legends Supplementary Figure 1. Characterization of after reconstitution of SCID mice with CD4 + CD62L + T cells. (A-C) SCID mice (n = 6 / group) were reconstituted with 2 x 1 6 CD4
Supplementary Figure 1. Confocal immunofluorescence showing mitochondrial translocation of Drp1. Cardiomyocytes treated with H 2 O 2 were prestained
 Supplementary Figure 1. Confocal immunofluorescence showing mitochondrial translocation of Drp1. Cardiomyocytes treated with H 2 O 2 were prestained with MitoTracker (red), then were immunostained with
Signaling changes in the stem cell factor AKT-S6 pathway in diagnostic AML samples are associated with disease relapse
 LETTER TO THE EDITOR Citation: (2011) 1, e3; doi:10.1038/bcj.2010.2 & 2011 Macmillan Publishers Limited All rights reserved 2044-5385/11 www.nature.com/bcj Signaling changes in the stem cell factor AKT-S6
Supplemental Figure 1. Western blot analysis indicated that MIF was detected in the fractions of
 Supplemental Figure Legends Supplemental Figure 1. Western blot analysis indicated that was detected in the fractions of plasma membrane and cytosol but not in nuclear fraction isolated from Pkd1 null
Figure S1: Effects on haptotaxis are independent of effects on cell velocity A)
") Supplemental Figures Figure S1: Effects on haptotaxis are independent of effects on cell velocity A) Velocity of MV D7 fibroblasts expressing different GFP-tagged Ena/VASP family proteins in the haptotaxis
Supplemental Figures Figure S1: Effects on haptotaxis are independent of effects on cell velocity A) Velocity of MV D7 fibroblasts expressing different GFP-tagged Ena/VASP family proteins in the haptotaxis
Molecular Characterization of Leukemia Stem Cell Development. Scott A. Armstrong MD, Ph.D.
 Molecular Characterization of Leukemia Stem Cell Development Scott A. Armstrong MD, Ph.D. Normal and Leukemic Hierarchies NORMAL HSC (SRC) Myeloid progenitor LTC-IC CFU AML LSC (SL-IC) Leukemic LTC-IC
Supplementary Materials
 Supplementary Materials Figure S1. MTT Cell viability assay. To measure the cytotoxic potential of the oxidative treatment, the MTT [3-(4,5-dimethylthiazol- 2-yl)-2,5-diphenyl tetrazolium bromide] assay
Supplementary Figure 1 IMQ-Induced Mouse Model of Psoriasis. IMQ cream was
 Supplementary Figure 1 IMQ-Induced Mouse Model of Psoriasis. IMQ cream was painted on the shaved back skin of CBL/J and BALB/c mice for consecutive days. (a, b) Phenotypic presentation of mouse back skin
Recommended Timing for Transplant Consultation
 REFERRAL GUIDELINES Recommended Timing for Transplant Consultation Published jointly by the National Marrow Donor Program /Be The Match and the American Society for Blood and Marrow Transplantation BeTheMatchClinical.org
Supplementary Materials for
 www.sciencetranslationalmedicine.org/cgi/content/full/8/333/333ra47/dc1 Supplementary Materials for Androgen receptor antagonists compromise T cell response against prostate cancer leading to early tumor
Integrin CD11b negatively regulates TLR-triggered inflammatory responses by. activating Syk and promoting MyD88 and TRIF degradation via cbl-b
 Integrin CD11b negatively regulates TLR-triggered inflammatory responses by activating Syk and promoting MyD88 and TRIF degradation via cbl-b Chaofeng Han, Jing Jin, Sheng Xu, Haibo Liu, Nan Li, and Xuetao
Pearson r = P (one-tailed) = n = 9
 = n = 9") 8F4-Specific Lysis, % 1 UPN1 UPN3 8 UPN7 6 Pearson r =.69 UPN2 UPN5 P (one-tailed) =.192 4 UPN8 n = 9 2 UPN9 UPN4 UPN6 5 1 15 2 25 8 8F4, % Max MFI Supplementary Figure S1. AML samples UPN1-UPN9 show variable
8F4-Specific Lysis, % 1 UPN1 UPN3 8 UPN7 6 Pearson r =.69 UPN2 UPN5 P (one-tailed) =.192 4 UPN8 n = 9 2 UPN9 UPN4 UPN6 5 1 15 2 25 8 8F4, % Max MFI Supplementary Figure S1. AML samples UPN1-UPN9 show variable
Figure S1. Reduction in glomerular mir-146a levels correlate with progression to higher albuminuria in diabetic patients.
 Supplementary Materials Supplementary Figures Figure S1. Reduction in glomerular mir-146a levels correlate with progression to higher albuminuria in diabetic patients. Figure S2. Expression level of podocyte
Supplementary Fig. 1 No relative growth advantage of Foxp3 negative cells.
 Supplementary Fig. 1 Supplementary Figure S1: No relative growth advantage of Foxp3 negative cells. itreg were induced from WT (A) or FIR (B) CD4 + T cells. FIR itregs were then removed from the TCR signal
Acute Myeloid and Lymphoid Leukemias
 Acute Myeloid and Lymphoid Leukemias Hugo F. Fernandez, MD Department of Malignant Hematology & Cellular Therapy Moffitt at Memorial Healthcare System April 29, 2018 15 th Annual Miami Cancer Meeting Objectives
Acute Myeloid Leukemia
 Acute Myeloid Leukemia Pimjai Niparuck Division of Hematology, Department of Medicine Ramathibodi Hospital, Mahidol University Outline Molecular biology Chemotherapy and Hypomethylating agent Novel Therapy
Acute Myeloid Leukemia Progress at last
 Acute Myeloid Leukemia Progress at last Bruno C. Medeiros, MD September 9, 217 Introduction Mechanisms of leukemogenesis Emerging therapies in AML Previously untreated AML Relapsed and refractory patients
Minimal Residual Disease as a Surrogate Endpoint in Acute Myeloid Leukemia Clinical Trials
 Minimal Residual Disease as a Surrogate Endpoint in Acute Myeloid Leukemia Clinical Trials Fda.gov Adriano Venditti Hematology, University Tor Vergata, Rome, Italy Minimal Residual Disease 10 12 Relapse
Supplement Material. Spleen weight (mg) LN cells (X106) Acat1-/- Acat1-/- Mouse weight (g)
 LN cells (X106) Acat1-/- Acat1-/- Mouse weight (g)") Supplement Material A Spleen weight (mg) C Mouse weight (g) 1 5 1 2 9 6 3 2 5 2 1 5 Male LN cells (X16) 4 ** ** Female B 3 2 1 Supplemental Figure I. Spleen weight (A), Inguinal lymph node (LN) cell number
Supplement Material A Spleen weight (mg) C Mouse weight (g) 1 5 1 2 9 6 3 2 5 2 1 5 Male LN cells (X16) 4 ** ** Female B 3 2 1 Supplemental Figure I. Spleen weight (A), Inguinal lymph node (LN) cell number
Supplementary Figure 1
 Supplementary Figure 1 Supplementary Figure 1 Schematic depiction of the tandem Fc GDF15. Supplementary Figure 2 Supplementary Figure 2 Gfral mrna levels in the brains of both wild-type and knockout Gfral
Kinase-independent functions of RIPK1 regulate hepatocyte survival and liver carcinogenesis
 The Journal of Clinical Investigation Kinase-independent functions of RIPK1 regulate hepatocyte survival and liver carcinogenesis Trieu-My Van, 1,2,3 Apostolos Polykratis, 1,2,3 Beate Katharina Straub,
Nature Genetics: doi: /ng Supplementary Figure 1. Details of sequencing analysis.
 Supplementary Figure 1 Details of sequencing analysis. (a) Flow chart showing which patients fall into each category and were used for analysis. (b) Graph showing the average and median coverage for all