Supplementary Table 1 Clinicopathological characteristics of 35 patients with CRCs
|
|
|
- Blake Stone
- 5 years ago
- Views:
Transcription
1 Supplementary Table Clinicopathological characteristics of 35 patients with CRCs Characteristics Type-A CRC Type-B CRC P value Sex Male / Female 9 / / 8.5 Age (years) Median (range) 6. (9 86) 6.5 (9 76).95 Location Right / Left / Rectum 3 / 5 / 5 5 / / 6.75 T status T / T / T3 / T / / / / / 6 / 5. N status N / N / N / 6 / 3 9 / 5 / 8.35 M status M / M / 5 / 7.8 TNM Stage I / II / III / IV / / 7 / / 6 / 8 / 7.38 Diameter (mm) Median (range). (7 75) 53.5 (3 5). Nature Medicine: doi:.38/nm.86
2 Supplementary Table Clinicopathological characteristics of 9 patients with CRCs Characteristics ILA lo TGFB lo ILA hi TGFB lo ILA lo TGFB hi ILA hi TGFB hi Sex Male / Female 6 / 9 8 / 9 / 7 / Age (years) Median (range) 6. (5 8) 66. ( 8) 63.5 ( 8) 6. (37 7) Location Right / Left / Rectum 3 / 9 / 3 / 6 / 7 9 / 8 / 3 3 / 7 / 7 T status T / T / T3 / T / 3 / 8 / / / / 7 / / 5 / 5 / / 7 / 9 N status N / N / N / 3 / 9 / 3 / 5 6 / 5 / 9 9 / / 7 M status M / M 3 / 5 / 7 / 3 5 / TNM Stage I / II / III / IV / / / / 9 / 6 / / 6 / / 3 / 9 / 6 / Nature Medicine: doi:.38/nm.86
3 Supplementary Figure legends: Supplementary Figure. FOXP3 CD + T cells in CRCs and CD + T-cell infiltration in melanoma tissues. (a) The frequency of FOXP3 CD5RA (Fr-IV) and FOXP3 CD5RA + (Fr-V) T cells among CD + T cells in PBMCs, colonic mucosa, and type-a and -B CRCs as in Fig. b. (b) Representative staining of TILs from melanoma tissues for CD, CD5RA and FOXP3. (c) The frequency of each CD + T-cell fraction (Fr-I V) in melanoma tissues (n = 5). Horizontal lines in (a and c) indicate medians. *P <.5, **P <. by the one-way ANOVA with Tukey test (a). Supplementary Figure. Surface marker expression and cytokine production by CRC TILs and PBMCs. (a and b) Surface TIGIT and CTLA- expression by Fr-II, -III, -IV CD + T cells in TILs and PBMCs from CRCs. Representative staining of PBMCs (n = ) and TILs from type-a (n = 5) and -B CRCs (n = ) (a), and summary for MFI of TIGIT and CTLA- staining in each fraction of these samples (b). Error bars indicate mean ± s.e.m. (c) IFN-γ and IL-7 production by CD + T cells from TILs with or without in vitro PMA and ionomycin stimulation assessed by intracellular cytokine staining. Representative staining of TILs from type-a (n = ) and -B CRCs (n = ). (d) IL- and TNF-α production of two PBMC and TIL samples assessed by intracellular cytokine staining after in vitro PMA and ionomycin stimulation. Representative staining of PBMCs (n = 8) and TILs from type-a (n = 6) and -B CRCs (n = 3). *P <.5, **P <., ***P <. by the one-way ANOVA with Tukey test (b). 3 Nature Medicine: doi:.38/nm.86
4 Supplementary Figure 3. Global mrna expression profile. Type-A and -B CRCs were subjected to microarray analyses (n = each) as in Fig a. Expression of genes classified as immune (959 genes) or inflammatory genes (69 genes) by GO term was visualized as volcano plots. Supplementary Figure. mrna expression in normal colonic tissues. Expression of mrna for TGFB, TNF, IFNG, ILA, IL6, IL8, IL, IL7, ILA, ILB and FOXP3 in paired normal colonic tissues from type-a (n = ) and -B CRC patients (n = ) was examined by quantitative RT-PCR. Horizontal lines indicate medians. *P <.5 by the Mann-Whitney U test. Supplementary Figure 5. TGF-β, TNF-α and IL- mrna expression in CRC tissues. TGF-β, TNF-α and IL- mrna expression was detected by RNA in situ hybridization as brown dots in formalin-fixed paraffin-embedded tissue specimens. Representative of three independent experiments. Bars indicate µm. Supplementary Figure 6. Effects of TGF-β, TNF-α and IL- on induction of FOXP3 + CD + T cells from naïve CD + T cells and suppressive activity of in vitro generated FOXP3 + CD + T cells. (a) Percentages of generated FOXP3 hi CD5RA T cells and FOXP3 lo CD5RA T cells from CD5RA + CD5 naïve CD + T cells in PBMCs of healthy donors by anti-cd3 and CD8 mab stimulation for 7 d with or without indicated cytokines. Summary of three independent experiments. (b and c) CD5 or CD5 hi CD + T cells prepared from the cultures of CD5RA + CD5 naïve Nature Medicine: doi:.38/nm.86
5 CD + T cells stimulated with anti-cd3 and CD8 mab in the presence of IL- and TGF-β (b, top) were co-cultured with an equal number of CFSE-labeled CD5 CD + responder T cells from PBMCs of the same donors, and stimulated with anti-cd3 mab for 5 d in the presence of APCs (b). CD5 hi CD + T-cell suppressive activity was assessed in the presence of anti-ifn-γ mab (c). Fr-II etreg cells from PBMCs of the same donors were served as control. Error bars in (a) indicate mean ± s.e.m. Representative of three independent experiments (b and c). Supplementary Figure 7. Failure to produce FOXP3 lo non-suppressive T cells from ntreg or etreg cells. (a) Fr-I ntreg cells from PBMCs of healthy donors were stimulated with anti-cd3 and CD8 mab for 7 d with or without indicated cytokines. The percentages of FOXP3 hi CD5RA and FOXP3 lo CD5RA T cells among total CD + T cells are shown. (b) Fr-II etreg cells from PBMCs of healthy donors were stimulated with anti-cd3 and CD8 mab for 6 and d with or without IL-. In (a and b), FOXP3 hi and FOXP3 lo cells among generated CD5RA CD + T cells were demarcated as shown by the line delineating FOXP3 + cells derived from ntreg cells after anti-cd3 and CD8 mab stimulation without cytokines. The percentages of FOXP3 hi CD5RA T cells and FOXP3 lo CD5RA T cells among total CD + T cells are shown. Representative of three independent experiments (a and b). Supplementary Figure 8. Effects of IL- on induction of FOXP3 + CD + T cells from naïve CD + T cells. (a) A representative result of inducing FOXP3 + CD + T cells from CD5RA + CD5 naïve CD + T cells in PBMCs of healthy donors by anti-cd3 and 5 Nature Medicine: doi:.38/nm.86
6 CD8 mab stimulation for 7 d with or without indicated cytokines. (b) Percentages of generated FOXP3 hi CD5RA T cells and FOXP3 lo CD5RA T cells in three independent experiments. Error bars in (b) indicate mean ± s.e.m. Supplementary Figure 9. Prognosis of patients with CRCs in relation to tumor-infiltrating FOXP3 + CD + Treg cells. (a and b) mrna expression (a: ILA and TNF, b: TGFB and TNF) of type-a (red) and -B (blue) CRCs defined by flowcytometry data as in Fig. a. The cut-off value of each mrna expression was based on Youden s index (J): J = sensitivity + specificity (ILA =.6, TGFB =.6, TNF =.5). (c and d) Kaplan-Meier curves for DFS in ILA lo TNF lo (left) and ILA hi TNF hi (right) groups (c), and TGFB lo TNF lo (left) and TGFB hi TNF hi (right) groups (d) by classifying CRCs in each group into FOXP-high or -low by the levels of FOXP3 mrna expression above or below the median. Supplementary Figure. Prognostic value of CD8 + T-cell and NK-cell infiltration into CRCs. (a) mrna expression of CD8A, KLRG and B3GAT measured by quantitative RT-PCR in each group classified by ILA and TGFB mrna expression levels. (b d) Kaplan-Meier curves for DFS of CRC patients classified by CD8A (b), KLRG (c), or B3GAT expression levels (d) in total (n = 9, left), ILA lo TGFB lo (n = 35, middle) or ILA hi TGFB hi (n = 7, right) CRC patients. High or low group of CD8A, KLRG, or B3GAT expression was defined by mrna levels above or below the median as shown in (a). Horizontal lines in (a) indicate medians. ***P <. by the Mann-Whitney U test (a). 6 Nature Medicine: doi:.38/nm.86
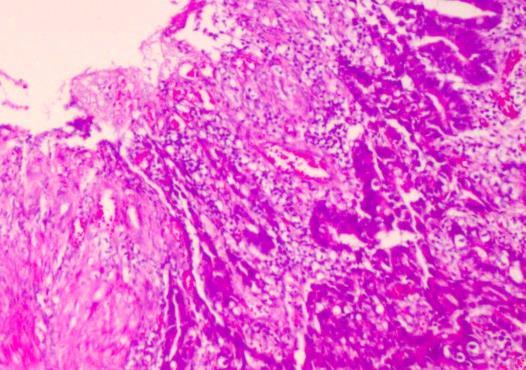
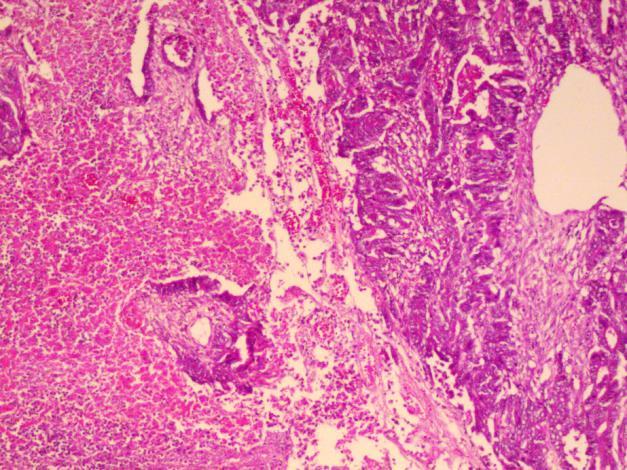
7 Supplementary Figure. Prognostic values of the ratios of expression levels of various immune-related molecules relative to FOXP3 expression levels in 9 patients with CRCs. (a and b) Expression levels of mrna for ITGAM, ITGAX, KLRG, B3GAT, CD3D, CD8A, CD, CD9, GZMB, PRF, IFNG and IL7 (encoding CDb, CDc, KLRG, CD57, CD3d, CD8a, CD, CD9, Granzyme B, Perforin, IFN-γ and IL-7A, respectively) were measured by quantitative RT-PCR. The values were divided by FOXP3 mrna expression to assess possible prognostic significance of each gene expression relative to FOXP3 expression. Kaplan-Meier curves for DFS were compared between the groups with high or low ratio, defined as above or below, respectively, the median of the ratios, in ILA lo TGFB lo (a) or ILA hi TGFB hi (b) CRC patients. Supplementary Figure. Bacterial infiltration into CRC tissues. (a) Representative staining of ILA lo TGFB lo (n = 8) and ILA hi TGFB hi (n = 7) CRC tissues in Fig. a with EUB338 probe for bacteria (green) is shown. (b) High magnification images of type-b CRC tissues with EUB338 probe for bacteria (green) and FUSO7 probe for Fusobacterium spp. (red) are shown together with corresponding hematoxylin and eosin staining. Dotted lines in (b) show the border between tumor and normal tissue. Bars indicate µm (a), µm (b, left) and 5 µm (b, right). Supplementary Figure 3. Immunohistochemical analysis of TILs in CRCs. (a and b) Formalin-fixed paraffin-embedded sections from representative type-a and -B CRCs were collected and subjected to immunohistochemical staining for FOXP3 and CD8. 7 Nature Medicine: doi:.38/nm.86
8 Representative pictures of type-a (n = 3) and -B CRCs (n = ), together with flow cytometry staining for FOXP3 and CD5RA (a), and the number of FOXP3 + T cells in each type of CRC tissues (b). Horizontal lines in (b) indicate medians. Bars in (a) indicate µm (low power field) and 5 µm (high power field). 8 Nature Medicine: doi:.38/nm.86
9 a Percentage in CD + T cells * ** Fr-IV Fr-V b CD5RA 5 3 Melanoma TIL FOXP3 c Percentage in CD + T cells Fr- I II III IV V Supplementary Figure Nature Medicine: doi:.38/nm.86

 CTLA- (MFI) *** ** ***")


10 Cell number Cell number a 3 PBMC TIGIT PBMC 3 CTLA Type-A 5 3 Type-B 3 3 Type-A Type-B Fr-II Fr-III Fr- II III IV Fr-IV PBMC b TIGIT (MFI) CTLA- (MFI) *** ** *** ** *** ** ** Fr- II III IV II III IV II III IV ** * * * II III IV II III IV Type-A Type-B c Type-A 8.3. Type-B d PBMC # PBMC # With stimulation Type-A Type-B.7.. Without stimulation IFN-γ.3. TNF-α.. IL7 IL Supplementary Figure Nature Medicine: doi:.38/nm.86
11 P value 8 6 Immune response related genes P value 8 6 Inflammatory response related genes Type-A Fold change Type-B Supplementary Figure 3 Nature Medicine: doi:.38/nm.86
12 Relative quantity Type- A B A B A B TGFB TNF IFNG..5 *. Type- A B IL Type- A B ILA A B IL A B ILB A B IL A B FOXP A B ILA A B IL7 Supplementary Figure Nature Medicine: doi:.38/nm.86

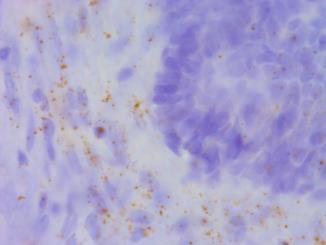
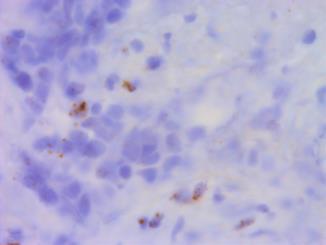
13 TGF-β TNF-α IL- Supplementary Figure 5 Nature Medicine: doi:.38/nm.86


14 a Percentage in CD + T cells FOXP3 hi FOXP3 lo b 5 IL- + TGF-β 5 CD5RA 3 CD5RA FOXP3 3 5 CD5 Responder alone + CD5 + CD5 hi + PBMC Fr-II Cell number 87.7% 85.6% 8.6% 9.7% c CFSE Responder alone + CD5 hi + CD5 hi + Anti-IFN-γ mab + PBMC Fr-II Cell number 98.6% 88.6% 85.9% 7.5% CFSE Supplementary Figure 6 Nature Medicine: doi:.38/nm.86
15 a CD5RA 5 3 CD5 CD5RA control IL- TGF-β FOXP3 IL- + TGF-β b CD5RA 5 3 CD5 CD5RA control IL day6 day FOXP3 Supplementary Figure 7 Nature Medicine: doi:.38/nm.86
16 a 5 Control. 6.5 IL TGF-β CD5RA CD5 CD5RA IL- + TGF-β 7. FOXP3 58. IL- + TGF-β IL- + IL- + TGF-β b Percentage in CD + T cells FOXP3 hi FOXP3 lo Supplementary Figure 8 Nature Medicine: doi:.38/nm.86
17 a Relative quantity of TNF Type-A (n = ) Type-B (n = ) b Relative quantity of TNF Type-A (n = ) Type-B (n = ) 3 Relative quantity of ILA 3 5 Relative quantity of TGFB c FOXP3 low (n = ) 8 FOXP3 low (n = ) 6 FOXP3 high (n = ) P =.5 HR =. ( ) FOXP3 high (n = ) P =.36 HR =.78 (.9 6.8) d FOXP3 low (n = 9) 8 6 FOXP3 high (n = 9) P =.9 HR =.9 ( ) FOXP3 low (n = 5) FOXP3 high (n = ) P =.6 HR =.3 ( ) Supplementary Figure 9 Nature Medicine: doi:.38/nm.86
18 b c d CD8A-low (n = 55) CD8A-high (n = 5) P =.67 HR =.6 (.58.33) KLRG-low (n = 55) 6 KLRG-high (n = 5) P =. HR =.59 (.78 3.) a Relative quantity Total *** ILA lo TGFB lo ILA hi TGFB hi B3GAT-low (n = 55) 6 B3GAT-high (n = 5) P =.79 HR =. (.55.) CD8A KLRG B3GAT Relative quantity 8 6 high (n = 7) P =.69 HR =. ( ) 6 *** Relative quantity low (n = 8) low (n = 8) 6 high (n = 7) P =.9 HR =. (.36.97) Total ILA lo TGFB lo ILA hi TGFB hi low (n = 8) 6 high (n = 7) P =.7 HR =. ( ) P =.3 HR =.33 (. 3.) 8 *** Total ILA lo TGFB lo ILA hi TGFB hi high (n = 3) low (n = ) high (n = 3) low (n = ) 6 P =.36 HR =.36 (. 3.6) low (n = ) high (n = 3) 6 P =.5 HR = 3.5 ( ) Supplementary Figure Nature Medicine: doi:.38/nm.86
19 a ITGAM / FOXP3 ITGAX / FOXP3 KLRG / FOXP3 B3GAT / FOXP3 hi (n = 7) low (n = 8) P =.8 P =.38 P =.66 P =.57 CD3D / FOXP3 CD8A / FOXP3 CD / FOXP3 CD9 / FOXP3 P =.55 P =.66 P =.3 P =.7 GZMB / FOXP3 PRF / FOXP3 IFNG / FOXP3 IL7 / FOXP3 P =.6 P =.3 P =. P = b ITGAM / FOXP3 ITGAX / FOXP3 KLRG / FOXP3 B3GAT / FOXP3 hi (n = 3) low (n = ) P =.9 P =. P =.9 P =.6 CD3D / FOXP3 CD8A / FOXP3 CD / FOXP3 CD9 / FOXP3 P =.3 P =. P =.9 P =.3 GZMB / FOXP3 PRF / FOXP3 IFNG / FOXP3 IL7 / FOXP3 P =. P =.9 P =.9 P = Nature Medicine: doi:.38/nm.86 Supplementary Figure


 FISH (")


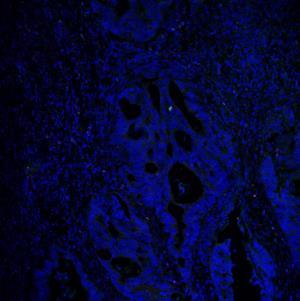
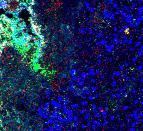
20 a Pt. Pt. Pt.3 Pt. ILA lo TGFB lo Pt.5 Pt.6 Pt.7 Pt.8 ILA hi TGFB hi EUB338 b H. E. ( 5) FISH ( ) Tumor Tumor EUB338 FUSO Nature Medicine: doi:.38/nm.86 Supplementary Figure


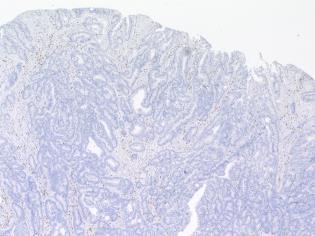
21 a FOXP3 + T cells CD8 + T cells Type-A CD5RA FOXP3 Type-B CD5RA FOXP3 b FOXP3 + T cells (cells / mm ) Supplementary Figure 3 Nature Medicine: doi:.38/nm.86
Supplementary Figure 1
 Supplementary Figure 1 Identification of IFN-γ-producing CD8 + and CD4 + T cells with naive phenotype by alternative gating and sample-processing strategies. a. Contour 5% probability plots show definition
Supplemental Figure 1. Signature gene expression in in vitro differentiated Th0, Th1, Th2, Th17 and Treg cells. (A) Naïve CD4 + T cells were cultured
 Naïve CD4 + T cells were cultured") Supplemental Figure 1. Signature gene expression in in vitro differentiated Th0, Th1, Th2, Th17 and Treg cells. (A) Naïve CD4 + T cells were cultured under Th0, Th1, Th2, Th17, and Treg conditions. mrna
Supplemental Figure 1. Signature gene expression in in vitro differentiated Th0, Th1, Th2, Th17 and Treg cells. (A) Naïve CD4 + T cells were cultured under Th0, Th1, Th2, Th17, and Treg conditions. mrna
Supplementary Figure 1.
 Supplementary Figure 1. Female Pro-ins2 -/- mice at 5-6 weeks of age were either inoculated i.p. with a single dose of CVB4 (1x10 5 PFU/mouse) or PBS and treated with αgalcer or control vehicle. On day
Supplementary Figure 1. ETBF activate Stat3 in B6 and Min mice colons
 Supplementary Figure 1 ETBF activate Stat3 in B6 and Min mice colons a pstat3 controls Pos Neg ETBF 1 2 3 4 b pstat1 pstat2 pstat3 pstat4 pstat5 pstat6 Actin Figure Legend: (a) ETBF induce predominantly
Supplemental Materials for. Effects of sphingosine-1-phosphate receptor 1 phosphorylation in response to. FTY720 during neuroinflammation
 Supplemental Materials for Effects of sphingosine-1-phosphate receptor 1 phosphorylation in response to FTY7 during neuroinflammation This file includes: Supplemental Table 1. EAE clinical parameters of
Supplemental materials
 Supplemental materials 1 Supplemental Fig. 1 Immunogram This immunogram summarizes patient clinical data and immune parameters at corresponding time points for Patient IMF-32. The top panel illustrates
Nature Immunology: doi: /ni Supplementary Figure 1. RNA-Seq analysis of CD8 + TILs and N-TILs.
 Supplementary Figure 1 RNA-Seq analysis of CD8 + TILs and N-TILs. (a) Schematic representation of the tumor and cell types used for the study. HNSCC, head and neck squamous cell cancer; NSCLC, non-small
SUPPLEMENTARY INFORMATION
 doi:1.138/nature1554 a TNF-α + in CD4 + cells [%] 1 GF SPF 6 b IL-1 + in CD4 + cells [%] 5 4 3 2 1 Supplementary Figure 1. Effect of microbiota on cytokine profiles of T cells in GALT. Frequencies of TNF-α
Supplemental Materials
 Supplemental Materials Programmed death one homolog maintains the pool size of regulatory T cells by promoting their differentiation and stability Qi Wang 1, Jianwei He 1, Dallas B. Flies 2, Liqun Luo
Supplementary Figure 1. IL-12 serum levels and frequency of subsets in FL patients. (A) IL-12
 IL-12") 1 Supplementary Data Figure legends Supplementary Figure 1. IL-12 serum levels and frequency of subsets in FL patients. (A) IL-12 serum levels measured by multiplex ELISA (Luminex) in FL patients before
1 Supplementary Data Figure legends Supplementary Figure 1. IL-12 serum levels and frequency of subsets in FL patients. (A) IL-12 serum levels measured by multiplex ELISA (Luminex) in FL patients before
Supplemental Figure 1
 Supplemental Figure 1 1a 1c PD-1 MFI fold change 6 5 4 3 2 1 IL-1α IL-2 IL-4 IL-6 IL-1 IL-12 IL-13 IL-15 IL-17 IL-18 IL-21 IL-23 IFN-α Mut Human PD-1 promoter SBE-D 5 -GTCTG- -1.2kb SBE-P -CAGAC- -1.kb
Defective STAT1 activation associated with impaired IFN-g production in NK and T lymphocytes from metastatic melanoma patients treated with IL-2
 Defective STAT1 activation associated with impaired IFN-g production in NK and T lymphocytes from metastatic melanoma patients treated with IL-2 SUPPLEMENTARY FIGURES AND TABLES Supplementary Figure S1:
Supplemental Table I.
 Supplemental Table I Male / Mean ± SEM n Mean ± SEM n Body weight, g 29.2±0.4 17 29.7±0.5 17 Total cholesterol, mg/dl 534.0±30.8 17 561.6±26.1 17 HDL-cholesterol, mg/dl 9.6±0.8 17 10.1±0.7 17 Triglycerides,
<10. IL-1β IL-6 TNF + _ TGF-β + IL-23
 3 ns 25 ns 2 IL-17 (pg/ml) 15 1 ns ns 5 IL-1β IL-6 TNF
SUPPLEMENTAL INFORMATIONS
 1 SUPPLEMENTAL INFORMATIONS Figure S1 Cumulative ZIKV production by testis explants over a 9 day-culture period. Viral titer values presented in Figure 1B (viral release over a 3 day-culture period measured
Blocking antibodies and peptides. Rat anti-mouse PD-1 (29F.1A12, rat IgG2a, k), PD-
, PD-") Supplementary Methods Blocking antibodies and peptides. Rat anti-mouse PD-1 (29F.1A12, rat IgG2a, k), PD- L1 (10F.9G2, rat IgG2b, k), and PD-L2 (3.2, mouse IgG1) have been described (24). Anti-CTLA-4 (clone
Supplementary Methods Blocking antibodies and peptides. Rat anti-mouse PD-1 (29F.1A12, rat IgG2a, k), PD- L1 (10F.9G2, rat IgG2b, k), and PD-L2 (3.2, mouse IgG1) have been described (24). Anti-CTLA-4 (clone
Supplementary Figure 1. mrna expression of chitinase and chitinase-like protein in splenic immune cells. Each splenic immune cell population was
 Supplementary Figure 1. mrna expression of chitinase and chitinase-like protein in splenic immune cells. Each splenic immune cell population was sorted by FACS. Surface markers for sorting were CD11c +
Human and mouse T cell regulation mediated by soluble CD52 interaction with Siglec-10. Esther Bandala-Sanchez, Yuxia Zhang, Simone Reinwald,
 Human and mouse T cell regulation mediated by soluble CD52 interaction with Siglec-1 Esther Bandala-Sanchez, Yuxia Zhang, Simone Reinwald, James A. Dromey, Bo Han Lee, Junyan Qian, Ralph M Böhmer and Leonard
of whole cell cultures in U-bottomed wells of a 96-well plate are shown. 2
 Supplementary online material Supplementary figure legends Supplementary Figure 1 Exposure to T reg cells causes loss of T resp cells in co-cultures. T resp cells were stimulated with CD3+CD28 alone or
Nature Medicine doi: /nm.3957
 Supplementary Fig. 1. p38 alternative activation, IL-21 expression, and T helper cell transcription factors in PDAC tissue. (a) Tissue microarrays of pancreatic tissue from 192 patients with pancreatic
Supplemental Information. Checkpoint Blockade Immunotherapy. Induces Dynamic Changes. in PD-1 CD8 + Tumor-Infiltrating T Cells
 Immunity, Volume 50 Supplemental Information Checkpoint Blockade Immunotherapy Induces Dynamic Changes in PD-1 CD8 + Tumor-Infiltrating T Cells Sema Kurtulus, Asaf Madi, Giulia Escobar, Max Klapholz, Jackson
Supplementary Figure 1. Example of gating strategy
 Supplementary Figure 1. Example of gating strategy Legend Supplementary Figure 1: First, gating is performed to include only single cells (singlets) (A) and CD3+ cells (B). After gating on the lymphocyte
Supplementary Figure 1. Normal T lymphocyte populations in Dapk -/- mice. (a) Normal thymic development in Dapk -/- mice. Thymocytes from WT and Dapk
 Normal thymic development in Dapk -/- mice. Thymocytes from WT and Dapk") Supplementary Figure 1. Normal T lymphocyte populations in Dapk -/- mice. (a) Normal thymic development in Dapk -/- mice. Thymocytes from WT and Dapk -/- mice were stained for expression of CD4 and CD8.
Supplementary Figure 1. Normal T lymphocyte populations in Dapk -/- mice. (a) Normal thymic development in Dapk -/- mice. Thymocytes from WT and Dapk -/- mice were stained for expression of CD4 and CD8.
Supplementary Figure 1. Deletion of Smad3 prevents B16F10 melanoma invasion and metastasis in a mouse s.c. tumor model.
 A B16F1 s.c. Lung LN Distant lymph nodes Colon B B16F1 s.c. Supplementary Figure 1. Deletion of Smad3 prevents B16F1 melanoma invasion and metastasis in a mouse s.c. tumor model. Highly invasive growth
Supplementary Figure 1. Efficiency of Mll4 deletion and its effect on T cell populations in the periphery. Nature Immunology: doi: /ni.
 Supplementary Figure 1 Efficiency of Mll4 deletion and its effect on T cell populations in the periphery. Expression of Mll4 floxed alleles (16-19) in naive CD4 + T cells isolated from lymph nodes and
Supplementary Figure S1. PTPN2 levels are not altered in proliferating CD8+ T cells. Lymph node (LN) CD8+ T cells from C57BL/6 mice were stained with
 CD8+ T cells from C57BL/6 mice were stained with") Supplementary Figure S1. PTPN2 levels are not altered in proliferating CD8+ T cells. Lymph node (LN) CD8+ T cells from C57BL/6 mice were stained with CFSE and stimulated with plate-bound α-cd3ε (10µg/ml)
Supplementary Figure S1. PTPN2 levels are not altered in proliferating CD8+ T cells. Lymph node (LN) CD8+ T cells from C57BL/6 mice were stained with CFSE and stimulated with plate-bound α-cd3ε (10µg/ml)
The encephalitogenicity of TH17 cells is dependent on IL-1- and IL-23- induced production of the cytokine GM-CSF
 CORRECTION NOTICE Nat.Immunol. 12, 568 575 (2011) The encephalitogenicity of TH17 cells is dependent on IL-1- and IL-23- induced production of the cytokine GM-CSF Mohamed El-Behi, Bogoljub Ciric, Hong
Supplementary information. The proton-sensing G protein-coupled receptor T-cell death-associated gene 8
 1 Supplementary information 2 3 The proton-sensing G protein-coupled receptor T-cell death-associated gene 8 4 (TDAG8) shows cardioprotective effects against myocardial infarction 5 Akiomi Nagasaka 1+,
L1 on PyMT tumor cells but Py117 cells are more responsive to IFN-γ. (A) Flow
 Flow") A MHCI B PD-L1 Fold expression 8 6 4 2 Fold expression 3 2 1 No tx 1Gy 2Gy IFN Py117 Py117 Supplementary Figure 1. Radiation and IFN-γ enhance MHCI expression and PD- L1 on PyMT tumor cells but Py117 cells
A MHCI B PD-L1 Fold expression 8 6 4 2 Fold expression 3 2 1 No tx 1Gy 2Gy IFN Py117 Py117 Supplementary Figure 1. Radiation and IFN-γ enhance MHCI expression and PD- L1 on PyMT tumor cells but Py117 cells
SUPPLEMENTARY INFORMATION
 Supplemental Figure 1. Furin is efficiently deleted in CD4 + and CD8 + T cells. a, Western blot for furin and actin proteins in CD4cre-fur f/f and fur f/f Th1 cells. Wild-type and furin-deficient CD4 +
SUPPLEMENTARY METHODS
 SUPPLEMENTARY METHODS Histological analysis. Colonic tissues were collected from 5 parts of the middle colon on day 7 after the start of DSS treatment, and then were cut into segments, fixed with 4% paraformaldehyde,
Interferon-dependent IL-10 production by Tregs limits tumor Th17 inflammation
 Interferon-dependent IL-10 production by Tregs limits tumor Th17 inflammation C. Andrew Stewart,, Werner Müller, Giorgio Trinchieri J Clin Invest. 2013;123(11):4859-4874. https://doi.org/10.1172/jci65180.
Supplementary Figure 1. Characterization of basophils after reconstitution of SCID mice
 Supplementary figure legends Supplementary Figure 1. Characterization of after reconstitution of SCID mice with CD4 + CD62L + T cells. (A-C) SCID mice (n = 6 / group) were reconstituted with 2 x 1 6 CD4
ankylosing spondylitis Department of Clinical Immunology, Xijing Hospital, The Fourth Military
 Functional defects in CD4 + CD25 high FoxP3 + regulatory cells in ankylosing spondylitis Huifang Guo 1, 2, 3, Ming Zheng 1, 2, 3, Kui Zhang 1, 3, Fengfan Yang 1, 3, Xin Zhang 1, 3, Qing Han 1, 3, Zhi-Nan
Nature Immunology: doi: /ni Supplementary Figure 1. Gene expression profile of CD4 + T cells and CTL responses in Bcl6-deficient mice.
 Supplementary Figure 1 Gene expression profile of CD4 + T cells and CTL responses in Bcl6-deficient mice. (a) Gene expression profile in the resting CD4 + T cells were analyzed by an Affymetrix microarray
Supplementary information CD4 T cells are required for both development and maintenance of disease in a new model of reversible colitis
 Supplementary information CD4 T cells are required for both development and maintenance of disease in a new model of reversible colitis rasseit and Steiner et al. .. Supplementary Figure 1 % of initial
W/T Itgam -/- F4/80 CD115. F4/80 hi CD115 + F4/80 + CD115 +
 F4/8 % in the peritoneal lavage 6 4 2 p=.15 n.s p=.76 CD115 F4/8 hi CD115 + F4/8 + CD115 + F4/8 hi CD115 + F4/8 + CD115 + MHCII MHCII Supplementary Figure S1. CD11b deficiency affects the cellular responses
Supplementary Figure 1. Ex vivo IFNγ production by Tregs. Nature Medicine doi: /nm % CD127. Empty SSC 98.79% CD25 CD45RA.
 SSC CD25 1.8% CD127 Empty 98.79% FSC CD45RA CD45RA Foxp3 %IFNγ + cells 4 3 2 1 + IL-12 P =.3 IFNγ p=.9 %IL-4+ cells 3 2 1 IL-4 P =.4 c %IL-1 + cells IFNγ 4 3 2 1 Control Foxp3 IL-1 P =.41.64 4.76 MS 2.96
pplementary Figur Supplementary Figure 1. a.
 pplementary Figur Supplementary Figure 1. a. Quantification by RT-qPCR of YFV-17D and YFV-17D pol- (+) RNA in the supernatant of cultured Huh7.5 cells following viral RNA electroporation of respective
Supplementary Figure 1. Enhanced detection of CTLA-4 on the surface of HIV-specific
 SUPPLEMENTARY FIGURE LEGEND Supplementary Figure 1. Enhanced detection of CTLA-4 on the surface of HIV-specific CD4 + T cells correlates with intracellular CTLA-4 levels. (a) Comparative CTLA-4 levels
Generation of ST2-GFP reporter mice and characterization of ILC1 cells following infection
 Supplementary Figure 1 Generation of ST2-GFP reporter mice and characterization of ILC1 cells following infection with influenza virus. (a) ST2-GFP reporter mice were generated as described in Methods.
Supplementary Figure 1. Double-staining immunofluorescence analysis of invasive colon and breast cancers. Specimens from invasive ductal breast
 Supplementary Figure 1. Double-staining immunofluorescence analysis of invasive colon and breast cancers. Specimens from invasive ductal breast carcinoma (a) and colon adenocarcinoma (b) were staining
HD1 (FLU) HD2 (EBV) HD2 (FLU)
 HD2 (EBV) HD2 (FLU)") ramer staining + anti-pe beads ramer staining a HD1 (FLU) HD2 (EBV) HD2 (FLU).73.11.56.46.24 1.12 b CD127 + c CD127 + d CD127 - e CD127 - PD1 - PD1 + PD1 + PD1-1 1 1 1 %CD127 + PD1-8 6 4 2 + anti-pe %CD127
ramer staining + anti-pe beads ramer staining a HD1 (FLU) HD2 (EBV) HD2 (FLU).73.11.56.46.24 1.12 b CD127 + c CD127 + d CD127 - e CD127 - PD1 - PD1 + PD1 + PD1-1 1 1 1 %CD127 + PD1-8 6 4 2 + anti-pe %CD127
Supplementary Information:
 Supplementary Information: Follicular regulatory T cells with Bcl6 expression suppress germinal center reactions by Yeonseok Chung, Shinya Tanaka, Fuliang Chu, Roza Nurieva, Gustavo J. Martinez, Seema
Supplementary Figure 1. H-PGDS deficiency does not affect GI tract functions and anaphylactic reaction. (a) Representative pictures of H&E-stained
 Representative pictures of H&E-stained") 1 2 3 4 5 6 7 8 9 10 11 Supplementary Figure 1. H-PGDS deficiency does not affect GI tract functions and anaphylactic reaction. (a) Representative pictures of H&E-stained jejunum sections ( 200 magnification;
1 2 3 4 5 6 7 8 9 10 11 Supplementary Figure 1. H-PGDS deficiency does not affect GI tract functions and anaphylactic reaction. (a) Representative pictures of H&E-stained jejunum sections ( 200 magnification;
Supplemental Figure 1. IL-3 blockade with Fab CSL362 depletes plasmacytoid dendritic cells (pdcs), but not basophils, at higher doses.
, but not basophils, at higher doses.") Supplemental Figure 1. IL-3 blockade with Fab CSL362 depletes plasmacytoid dendritic cells (pdcs), but not basophils, at higher doses. Percentage of viable (A) pdcs (Sytox Blue-, Lin1-, HLADR+, BDCA2++)
Supplemental Figure 1. IL-3 blockade with Fab CSL362 depletes plasmacytoid dendritic cells (pdcs), but not basophils, at higher doses. Percentage of viable (A) pdcs (Sytox Blue-, Lin1-, HLADR+, BDCA2++)
Spleen. mlns. E Spleen 4.1. mlns. Spleen. mlns. Mock 17. Mock CD8 HIV-1 CD38 HLA-DR. Ki67. Spleen. Spleen. mlns. Cheng et al. Fig.
 C D E F Mock 17 Mock 4.1 CD38 57 CD8 23.7 HLA-DR Ki67 G H I Cheng et al. Fig.S1 Supplementary Figure 1. persistent infection leads to human T cell depletion and hyper-immune activation. Humanized mice
Supplemental Table 1. Primers used for RT-PCR analysis of inflammatory cytokines Gene Primer Sequence
 Supplemental Table 1. Primers used for RT-PCR analysis of inflammatory cytokines Gene Primer Sequence IL-1α Forward primer 5 -CAAGATGGCCAAAGTTCGTGAC-3' Reverse primer 5 -GTCTCATGAAGTGAGCCATAGC-3 IL-1β
Optimizing Intracellular Flow Cytometry:
 Optimizing Intracellular Flow Cytometry: Simultaneous Detection of Cytokines and Transcription Factors An encore presentation by Jurg Rohrer, PhD, BD Biosciences 10.26.10 Outline Introduction Cytokines
Supplementary Figure 1
 Supplementary Figure 1 Expression of apoptosis-related genes in tumor T reg cells. (a) Identification of FOXP3 T reg cells by FACS. CD45 + cells were gated as enriched lymphoid cell populations with low-granularity.
Supplementary Information. Tissue-wide immunity against Leishmania. through collective production of nitric oxide
 Supplementary Information Tissue-wide immunity against Leishmania through collective production of nitric oxide Romain Olekhnovitch, Bernhard Ryffel, Andreas J. Müller and Philippe Bousso Supplementary
Simultaneous correlation of cytokine production with Treg and Th17 cell proliferation
 Simultaneous correlation of cytokine production with Treg and Th17 cell proliferation Jurg Rohrer, PhD Director, R&D BD Biosciences 23-11773-00 For Research Use Only. Not for use in diagnostic or therapeutic
Supplemental Information. T Cells Enhance Autoimmunity by Restraining Regulatory T Cell Responses via an Interleukin-23-Dependent Mechanism
 Immunity, Volume 33 Supplemental Information T Cells Enhance Autoimmunity by Restraining Regulatory T Cell Responses via an Interleukin-23-Dependent Mechanism Franziska Petermann, Veit Rothhammer, Malte
Supplementary Figures
 Supplementary Figures Supplementary Figure 1 Characterization of stable expression of GlucB and sshbira in the CT26 cell line (a) Live cell imaging of stable CT26 cells expressing green fluorescent protein
Cover Page. The handle holds various files of this Leiden University dissertation.
 Cover Page The handle http://hdl.handle.net/1887/23854 holds various files of this Leiden University dissertation. Author: Marel, Sander van der Title: Gene and cell therapy based treatment strategies
Supplementary Materials for
 www.sciencetranslationalmedicine.org/cgi/content/full/8/352/352ra110/dc1 Supplementary Materials for Spatially selective depletion of tumor-associated regulatory T cells with near-infrared photoimmunotherapy
B220 CD4 CD8. Figure 1. Confocal Image of Sensitized HLN. Representative image of a sensitized HLN
 B220 CD4 CD8 Natarajan et al., unpublished data Figure 1. Confocal Image of Sensitized HLN. Representative image of a sensitized HLN showing B cell follicles and T cell areas. 20 µm thick. Image of magnification
Supplementary Figures
 Supplementary Figures Supplementary Figure 1. NKT ligand-loaded tumour antigen-presenting B cell- and monocyte-based vaccine induces NKT, NK and CD8 T cell responses. (A) The cytokine profiles of liver
well for 2 h at rt. Each dot represents an individual mouse and bar is the mean ±
 Supplementary data: Control DC Blimp-1 ko DC 8 6 4 2-2 IL-1β p=.5 medium 8 6 4 2 IL-2 Medium p=.16 8 6 4 2 IL-6 medium p=.3 5 4 3 2 1-1 medium IL-1 n.s. 25 2 15 1 5 IL-12(p7) p=.15 5 IFNγ p=.65 4 3 2 1
Table S1. Viral load and CD4 count of HIV-infected patient population
 Table S1. Viral load and CD4 count of HIV-infected patient population Subject ID Viral load (No. of copies per ml of plasma) CD4 count (No. of cells/µl of blood) 28 7, 14 29 7, 23 21 361,99 94 217 7, 11
Supplementary Figure 1. IDH1 and IDH2 mutation site sequences on WHO grade III
 Supplementary Materials: Supplementary Figure 1. IDH1 and IDH2 mutation site sequences on WHO grade III patient samples. Genomic DNA samples extracted from punch biopsies from either FFPE or frozen tumor
Supplementary Figures
 Inhibition of Pulmonary Anti Bacterial Defense by IFN γ During Recovery from Influenza Infection By Keer Sun and Dennis W. Metzger Supplementary Figures d a Ly6G Percentage survival f 1 75 5 1 25 1 5 1
New insights into CD8+ T cell function and regulation. Pam Ohashi Princess Margaret Cancer Centre
 New insights into CD8+ T cell function and regulation Pam Ohashi Princess Margaret Cancer Centre New insights into CD8+ T cell function and regulation Pam Ohashi Princess Margaret Cancer Centre No Disclosures
Nature Immunology: doi: /ni Supplementary Figure 1. Cytokine pattern in skin in response to urushiol.
 Supplementary Figure 1 Cytokine pattern in skin in response to urushiol. Wild-type (WT) and CD1a-tg mice (n = 3 per group) were sensitized and challenged with urushiol (uru) or vehicle (veh). Quantitative
Nature Medicine: doi: /nm.3922
 Title: Glucocorticoid-induced tumor necrosis factor receptor-related protein co-stimulation facilitates tumor regression by inducing IL-9-producing helper T cells Authors: Il-Kyu Kim, Byung-Seok Kim, Choong-Hyun
Supplementary Figures
 MiR-29 controls innate and adaptive immune responses against intracellular bacterial infection by targeting IFN-γ Feng Ma 1,2,5, Sheng Xu 1,5, Xingguang Liu 1, Qian Zhang 1, Xiongfei Xu 1, Mofang Liu 3,
Supplemental Information. CD4 + CD25 + Foxp3 + Regulatory T Cells Promote. Th17 Cells In Vitro and Enhance Host Resistance
 Immunity, Volume 34 Supplemental Information D4 + D25 + + Regulatory T ells Promote Th17 ells In Vitro and Enhance Host Resistance in Mouse andida albicans Th17 ell Infection Model Pushpa Pandiyan, Heather
Eosinophils! 40! 30! 20! 10! 0! NS!
 A Macrophages Lymphocytes Eosinophils Neutrophils Percentage (%) 1 ** 4 * 1 1 MMA SA B C Baseline FEV1, % predicted 15 p = 1.11 X 10⁻⁹ 5 CD4:CD8 ratio 1 Supplemental Figure 1. Cellular infiltrate in the
Categorical analysis of human T cell heterogeneity with One-SENSE
 1 2 3 4 Supplementary Information Categorical analysis of human T cell heterogeneity with One-SENSE 5 6 Running title: T cell Analysis by One-SENSE 7 8 9 1 11 12 13 14 15 16 17 18 19 2 21 22 23 24 25 26
Pair-fed % inkt cells 0.5. EtOH 0.0
 MATERIALS AND METHODS Histopathological analysis Liver tissue was collected 9 h post-gavage, and the tissue samples were fixed in 1% formalin and paraffin-embedded following a standard procedure. The embedded
hemodynamic stress. A. Echocardiographic quantification of cardiac dimensions and function in
 SUPPLEMENTAL FIGURE LEGENDS Supplemental Figure 1. Fbn1 C1039G/+ hearts display normal cardiac function in the absence of hemodynamic stress. A. Echocardiographic quantification of cardiac dimensions and
Supporting Information
 Supporting Information Desnues et al. 10.1073/pnas.1314121111 SI Materials and Methods Mice. Toll-like receptor (TLR)8 / and TLR9 / mice were generated as described previously (1, 2). TLR9 / mice were
Supplementary Fig. 1 p38 MAPK negatively regulates DC differentiation. (a) Western blot analysis of p38 isoform expression in BM cells, immature DCs
 Western blot analysis of p38 isoform expression in BM cells, immature DCs") Supplementary Fig. 1 p38 MAPK negatively regulates DC differentiation. (a) Western blot analysis of p38 isoform expression in BM cells, immature DCs (idcs) and mature DCs (mdcs). A myeloma cell line expressing
Supplementary Fig. 1 p38 MAPK negatively regulates DC differentiation. (a) Western blot analysis of p38 isoform expression in BM cells, immature DCs (idcs) and mature DCs (mdcs). A myeloma cell line expressing
NKTR-214 plus NKTR-262, a Scientifically-Guided Rational Combination Approach for Immune Oncology
 plus NKTR-262, a Scientifically-Guided Rational Combination Approach for Immune Oncology Jonathan Zalevsky SVP, Biology and Preclinical Development Nektar Therapeutics World Preclinical Congress, 2017
NMED-A65251A. Supplementary Figures.
 NMED-A65251A Supplementary Figures. Sup. Fig. 1. ILC3 cells are the main source of in obese mice a. We gated on T cells (upper panels) or T cells (lower panels), and examined production. b. CD45 + - IL-13
Supplementary Figure 1. Antibiotic partially rescues mice from sepsis. (ab) BALB/c mice under CLP were treated with antibiotic or PBS.
 BALB/c mice under CLP were treated with antibiotic or PBS.") 1 Supplementary Figure 1. Antibiotic partially rescues mice from sepsis. (ab) BALB/c mice under CLP were treated with antibiotic or PBS. (a) Survival curves. WT Sham (n=5), WT CLP or WT CLP antibiotic
1 Supplementary Figure 1. Antibiotic partially rescues mice from sepsis. (ab) BALB/c mice under CLP were treated with antibiotic or PBS. (a) Survival curves. WT Sham (n=5), WT CLP or WT CLP antibiotic
Supplementary Material
 Supplementary Material Supplementary Figure 1. NOS2 -/- mice develop an analogous Ghon complex after infection in the ear dermis and show dissemination of Mtb to the lung. (A) WT and NOS2 -/- mice were
(A) RT-PCR for components of the Shh/Gli pathway in normal fetus cell (MRC-5) and a
 RT-PCR for components of the Shh/Gli pathway in normal fetus cell (MRC-5) and a") Supplementary figure legends Supplementary Figure 1. Expression of Shh signaling components in a panel of gastric cancer. (A) RT-PCR for components of the Shh/Gli pathway in normal fetus cell (MRC-5) and
Supplementary figure legends Supplementary Figure 1. Expression of Shh signaling components in a panel of gastric cancer. (A) RT-PCR for components of the Shh/Gli pathway in normal fetus cell (MRC-5) and
and follicular helper T cells is Egr2-dependent. (a) Diagrammatic representation of the
 Diagrammatic representation of the") Supplementary Figure 1. LAG3 + Treg-mediated regulation of germinal center B cells and follicular helper T cells is Egr2-dependent. (a) Diagrammatic representation of the experimental protocol for the
Supplementary Figure 1. LAG3 + Treg-mediated regulation of germinal center B cells and follicular helper T cells is Egr2-dependent. (a) Diagrammatic representation of the experimental protocol for the
Intracellular MHC class II molecules promote TLR-triggered innate. immune responses by maintaining Btk activation
 Intracellular MHC class II molecules promote TLR-triggered innate immune responses by maintaining Btk activation Xingguang Liu, Zhenzhen Zhan, Dong Li, Li Xu, Feng Ma, Peng Zhang, Hangping Yao and Xuetao
Histological and immunological characteristics of colitis associated with anti-ctla 4 antibody therapy
 Histological and immunological characteristics of colitis associated with anti-ctla 4 antibody therapy M. Perdiki 2, G. Bamias 1, D. Pouloudi 2, H. Gogas 3, I. Delladetsima 2 1 Academic Dpt. of Gastroenterology,
Akt and mtor pathways differentially regulate the development of natural and inducible. T H 17 cells
 Akt and mtor pathways differentially regulate the development of natural and inducible T H 17 cells Jiyeon S Kim, Tammarah Sklarz, Lauren Banks, Mercy Gohil, Adam T Waickman, Nicolas Skuli, Bryan L Krock,
Cancer Biometrics: Results of the 2003 isbtc Workshop. Theresa L. Whiteside, Ph.D., ABMLI University of Pittsburgh Cancer Institute
 Cancer Biometrics: Results of the 2003 isbtc Workshop Theresa L. Whiteside, Ph.D., ABMLI University of Pittsburgh Cancer Institute The workshop objective The objective was to consider state-of-theart approaches
Interferon-dependent IL-10 production by Tregs limits tumor Th17 inflammation
 Research article Interferon-dependent IL-10 production by Tregs limits tumor Th17 inflammation C. Andrew Stewart, 1 Hannah Metheny, 1 Noriho Iida, 1 Loretta Smith, 1 Miranda Hanson, 1 Folkert Steinhagen,
for six pairs of mice. (b) Representative FACS analysis of absolute number of T cells (CD4 + and
 Representative FACS analysis of absolute number of T cells (CD4 + and") SUPPLEMENTARY DATA Supplementary Figure 1: Peripheral lymphoid organs of SMAR1 -/- mice have an effector memory phenotype. (a) Lymphocytes collected from MLNs and Peyer s patches (PPs) of WT and SMAR1
SUPPLEMENTARY DATA Supplementary Figure 1: Peripheral lymphoid organs of SMAR1 -/- mice have an effector memory phenotype. (a) Lymphocytes collected from MLNs and Peyer s patches (PPs) of WT and SMAR1
SUPPLEMENTARY FIGURE 1
 SUPPLEMENTARY FIGURE 1 A LN Cell count (1 ) 1 3 1 CD+ 1 1 CDL lo CD hi 1 CD+FoxP3+ 1 1 1 7 3 3 3 % of cells 9 7 7 % of cells CD+ 3 1 % of cells CDL lo CD hi 1 1 % of CD+ cells CD+FoxP3+ 3 1 % of CD+ T
Fluorochrome Panel 1 Panel 2 Panel 3 Panel 4 Panel 5 CTLA-4 CTLA-4 CD15 CD3 FITC. Bio) PD-1 (MIH4, BD) ICOS (C398.4A, Biolegend) PD-L1 (MIH1, BD)
 PD-1 (MIH4, BD) ICOS (C398.4A, Biolegend) PD-L1 (MIH1, BD)") Additional file : Table S. Antibodies used for panel stain to identify peripheral immune cell subsets. Panel : PD- signaling; Panel : CD + T cells, CD + T cells, B cells; Panel : Tregs; Panel :, -T, cdc,
Additional file : Table S. Antibodies used for panel stain to identify peripheral immune cell subsets. Panel : PD- signaling; Panel : CD + T cells, CD + T cells, B cells; Panel : Tregs; Panel :, -T, cdc,
Supplementalgfigureg1gSchematicgdiagramgofgtumor1modellingg
 SChinjectionh F:LuchLCLsh IVhinjectionh T:cellsh Monitorhforhtumorh growthhandhxeno: reactivehgvhd GVLgexperimentg kcbgvsgpbgt1cellse Xeno1reactiveg experimentg kcbgvsgpbgt1cellse IVhinjectionh 5xh,N^6
January 25, 2017 Scientific Research Process Name of Journal: ESPS Manuscript NO: Manuscript Type: Title: Authors: Correspondence to
 January 25, 2017 Scientific Research Process Name of Journal: World Journal of Gastroenterology ESPS Manuscript NO: 31928 Manuscript Type: ORIGINAL ARTICLE Title: Thiopurine use associated with reduced
Supplementary Figure 1: Expression of NFAT proteins in Nfat2-deleted B cells (a+b) Protein expression of NFAT2 (a) and NFAT1 (b) in isolated splenic
 Protein expression of NFAT2 (a) and NFAT1 (b) in isolated splenic") Supplementary Figure 1: Expression of NFAT proteins in Nfat2-deleted B cells (a+b) Protein expression of NFAT2 (a) and NFAT1 (b) in isolated splenic B cells from WT Nfat2 +/+, TCL1 Nfat2 +/+ and TCL1 Nfat2
Supplementary Figure 1: Expression of NFAT proteins in Nfat2-deleted B cells (a+b) Protein expression of NFAT2 (a) and NFAT1 (b) in isolated splenic B cells from WT Nfat2 +/+, TCL1 Nfat2 +/+ and TCL1 Nfat2
Supplementary Figure 1 IMQ-Induced Mouse Model of Psoriasis. IMQ cream was
 Supplementary Figure 1 IMQ-Induced Mouse Model of Psoriasis. IMQ cream was painted on the shaved back skin of CBL/J and BALB/c mice for consecutive days. (a, b) Phenotypic presentation of mouse back skin
x Lymphocyte count /µl CD8+ count/µl 800 Calculated
 % Lymphocyte in CBC A. 50 40 30 20 10 Lymphocyte count /µl B. x10 3 2.5 1.5 C. 50 D. 1000 % CD3+CD8+ Cells 40 30 20 Calculated CD8+ count/µl 800 600 400 200 10 0 #61 #63 #64 #65 #68 #71 #72 #75 Figure
ILC1 and ILC3 isolation and culture Following cell sorting, we confirmed that the recovered cells belonged to the ILC1, ILC2 and
 Supplementary Methods and isolation and culture Following cell sorting, we confirmed that the recovered cells belonged to the, ILC2 and subsets. For this purpose we performed intracellular flow cytometry
Reviewers' comments: Reviewer #1 (Remarks to the Author):
:") Reviewers' comments: Reviewer #1 (Remarks to the Author): In the manuscript Rational Combination of CXCL11-Expressing Oncolytic Virus and PD-L1 Blockade Works Synergistically to Enhance Therapeutic Efficacy
Reviewers' comments: Reviewer #1 (Remarks to the Author): In the manuscript Rational Combination of CXCL11-Expressing Oncolytic Virus and PD-L1 Blockade Works Synergistically to Enhance Therapeutic Efficacy
Supplementary Figure 1
 d f a IL7 b IL GATA RORγt h HDM IL IL7 PBS Ilra R7 PBS HDM Ilra R7 HDM Foxp Foxp Ilra R7 HDM HDM Ilra R7 HDM. 9..79. CD + FOXP + T reg cell CD + FOXP T conv cell PBS Ilra R7 PBS HDM Ilra R7 HDM CD + FOXP
NKTR-255: Accessing The Immunotherapeutic Potential Of IL-15 for NK Cell Therapies
 NKTR-255: Accessing The Immunotherapeutic Potential Of IL-15 for NK Cell Therapies Saul Kivimäe Senior Scientist, Research Biology Nektar Therapeutics NK Cell-Based Cancer Immunotherapy, September 26-27,
Scott Abrams, Ph.D. Professor of Oncology, x4375 Kuby Immunology SEVENTH EDITION
 Scott Abrams, Ph.D. Professor of Oncology, x4375 scott.abrams@roswellpark.org Kuby Immunology SEVENTH EDITION CHAPTER 11 T-Cell Activation, Differentiation, and Memory Copyright 2013 by W. H. Freeman and
Supplementary. presence of the. (c) mrna expression. Error. in naive or
 mrna expression. Error. in naive or") Figure 1. (a) Naive CD4 + T cells were activated in the presence of the indicated cytokines for 3 days. Enpp2 mrna expression was measured by qrt-pcrhr, infected with (b, c) Naive CD4 + T cells were activated
Figure 1. (a) Naive CD4 + T cells were activated in the presence of the indicated cytokines for 3 days. Enpp2 mrna expression was measured by qrt-pcrhr, infected with (b, c) Naive CD4 + T cells were activated
Supplementary Figure 1. NAFL enhanced immunity of other vaccines (a) An over-the-counter, hand-held non-ablative fractional laser (NAFL).
 An over-the-counter, hand-held non-ablative fractional laser (NAFL).") Supplementary Figure 1. NAFL enhanced immunity of other vaccines (a) An over-the-counter, hand-held non-ablative fractional laser (NAFL). (b) Depiction of a MTZ array generated by NAFL. (c-e) IgG production
Supplementary Figure 1. NAFL enhanced immunity of other vaccines (a) An over-the-counter, hand-held non-ablative fractional laser (NAFL). (b) Depiction of a MTZ array generated by NAFL. (c-e) IgG production
Nature Immunology doi: /ni.2771
 Supplementary Figure 1. Lymphadenopathy, mitogen response, effector cells, and serum Ig assessment. (a) Computerized Tomography (CT) images demonstrating lymphadenopathy (arrows) in patient F.II.1 and