Supplementary Figure 1 a
|
|
|
- Philomena Elliott
- 5 years ago
- Views:
Transcription
1 Supplementary Figure 1 a b d c
2 Supplementary Figure 1. Poor sensitivity for mutation detection using established single-cell RNA-sequencing methods. (a) Representative bioanalyzer trace showing expected single-cell library concentration from K562 cells. (b) Detection of BCR-ABL and GAPDH by QPCR in libraries from single K562 cells processed using the standard C1 protocol (b). Values shown are the gene expression levels relative to the limit of detection (LOD), indicated by the dashed horizontal line. The box plot shows median and quartile values and whiskers show outlier values within 1.5 interquartile range of the quartiles. Numbers below each plot show the frequency of cells showing expression above the LOD. (c) Violin plot shows the expression level (log2 RPKM) measured by RNA-sequencing of specific mutation hotspots within genes that are frequently mutated in myeloproliferative diseases (K562, n=15). (d) Detection of BCR-ABL and GAPDH by QPCR in libraries from single K562 cells processed with the C1 protocol with targeted BCR-ABL amplification.

3 Supplementary Figure 2 a b c d
4 Supplementary Figure 2. BCR-ABL tss2 method. (a) Scheme illustrating the workflow for single-cell detection of BCR-ABL with parallel whole transcriptome analysis. Single-cells are sorted into individual wells of a 96- well plate containing lysis buffer. BCR-ABL specific primers are multiplexed during both reverse transcription (RT) and PCR amplification steps to improve detection of BCR-ABL transcripts. The quality, size and concentration of the resulting cdna libraries are assessed by Agilent High Sensitivity bioanalyzer chips. Single-cell derived cdna libraries are then genotyped for BCR-ABL expression relatively to GAPDH housekeeping gene by QPCR and each library is assigned with a score of BCR-ABL positive or negative. cdna libraries are then indexed with Illumina Nextera XT kit and 40 to 50 singlecells are pooled together to be sequenced on a single lane of a HiSeq2000. (b) Table summarizing the BCR-ABL primers used for BCR-ABL tss2. Primer set #2 contains the Smart-seq2 ISPCR oligo sequences in the 5 end of each oligo. (c) Table illustrating the optimization of the protocol for BCR-ABL tss2 in single K562 cells. In addition to standard Smart-seq2 (condition 0), different combinations for tss2 multiplexing primers sets #1 and #2 during RT and PCR amplification are shown (conditions 1-6). For each of the combinations tested, primer sets and their relative concentration in the RT and PCR steps are shown. For each of the conditions used (0-6) we show the frequencies of BCR-ABL detection by QPCR in single K562 cells, the average CT value at which BCR-ABL gene was detected by QPCR and (d) a representative bioanalyzer trace of the cdna libraries obtained. Absence of BCR-ABLspecific primers in the RT step (conditions 0,1,2) led to poor detection of the fusion transcript in single K562 (29%, 0% and 33%, respectively). The presence of primer set #1 in both RT and PCR (condition 3), brought the frequency of BCR-ABL detection up to 100% but with QPCR CT values above 30. When primer set #2 was used in both RT and PCR stages (conditions 4 and 5), the presence of ISPCR sequences during the RT step caused the formation of concatamers at an extent that was proportional to their concentration in the reaction mix. Optimal BCR-ABL tss2 conditions (condition 6), were with primer set #1 during RT and primer set #2 during PCR
5 step, allowing 100% of BCR-ABL detection in single K562 with BCR-ABL detection by QPCR at CT values below 30 and with no concatamer formation in the cdna libraries.
6 Supplementary Figure 3
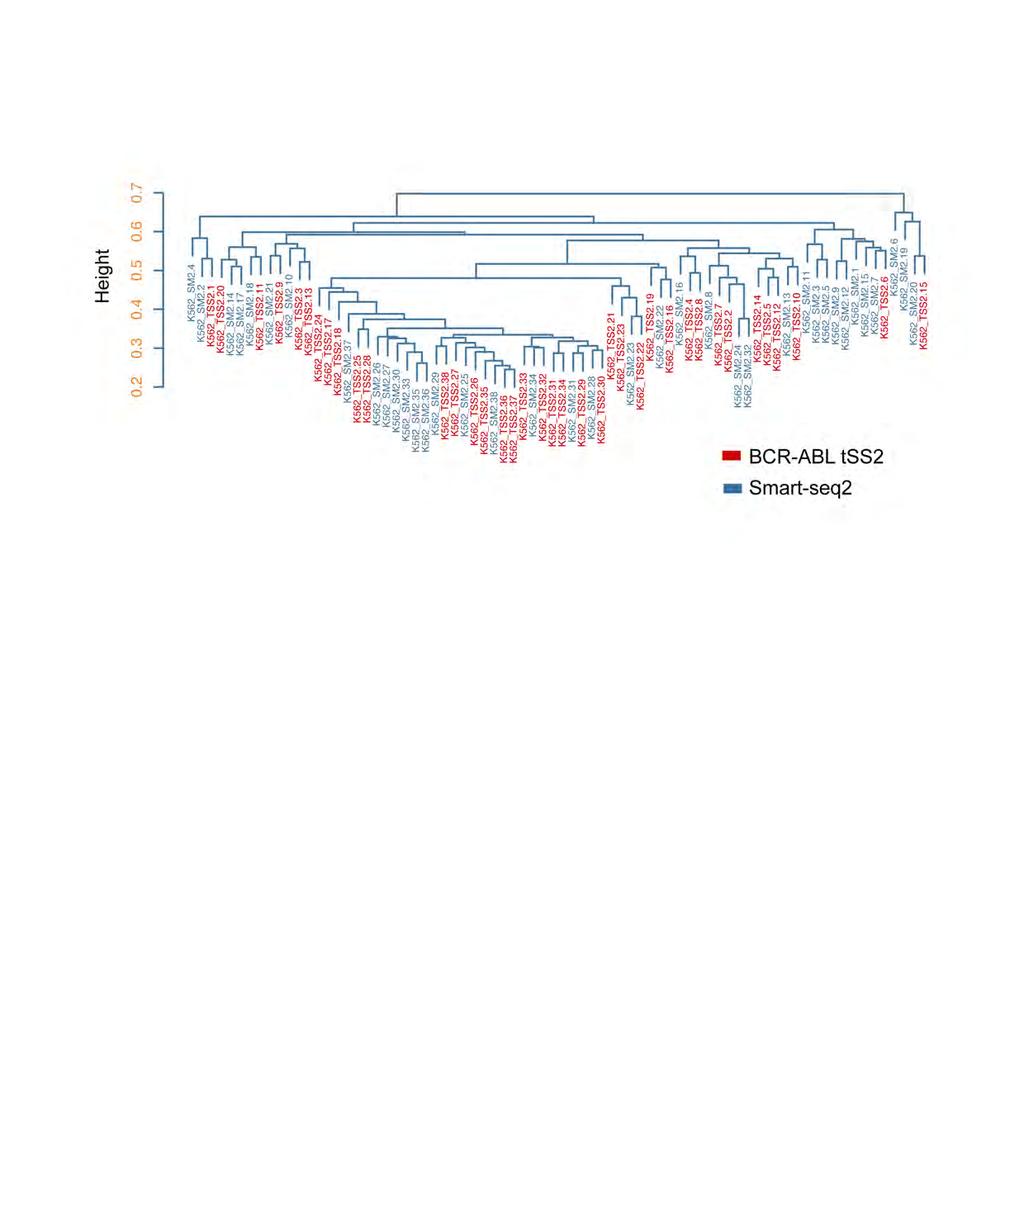
7 Supplementary Figure 3. Unbiased libraries are generated using the BCR- ABL tss2 method. Pearson s hierarchical clustering of RNA-sequencing results from single K562 cells processed by Smart-seq2 (blue n=38) or by BCR-ABL tss2 (red n=38).
8 Supplementary Figure 4 a b c Ensemble of single cells (n=42) d RPKM (Mean Log2) Bulk (100 cells) ERCC concentration (Log2) e
9 Supplementary Figure 4. BCR-ABL tss2 detects transcriptional heterogeneity in normal human HSCs. (a) Representative bioanalyzer traces of cdna libraries generated from single human Lin - CD34 + CD38 - HSCs using the BCR-ABL tss2 protocol. (b) Histogram showing the numbers of genes detected with RPKM 1 in HSCs (n=232) from 5 normal donors. (c) Correlation between the merged data from 42 single-cells from a normal donor ( ensemble ) and the bulk (100 cells) RNA-sequencing measurement of gene expression from the same donor. The ensemble was created by computationally pooling all the reads obtained from the 42 single Lin - CD34 + CD38 - cells the same normal BM donor. (d) Correlation between measured expression level by single-cell BCR-ABL tss2 RNA-sequencing (yaxis) and actual numbers of artificial ERCC RNA genes spiked-in per reaction (x-axis). (e) Pearson correlation coefficient of single-cell BCR-ABL tss2 RNAsequencing libraries showing increased heterogeneity of gene expression between human HSCs than between K562 cells.
10 Supplementary Figure 5 a b 2.03E-02 BCR-ABL- SCs 8.82E E E-01 BCR-ABL+ SCs Normal HSC 7.50E E E E-01 c BCR-ABL- SCs BCR-ABL+ SCs Normal HSC
11 Supplementary Figure 5. Comparison of gene expression by BCR-ABL tss2 RNA-sequencing and QPCR. We selected 12 genes of potential biologic interest showing over 10-fold differential expression for further validation by QPCR, along with 12 non-differentially expressed controls. (a) Correlation between level of expression measured by RNA-sequencing and Q-PCR for 24 selected genes. Differentially expressed genes between BCR-ABL + and BCR- ABL SCs (red dots, n=12) were selected by setting a fold change cutoff >10 and among those 12 genes of potential biologic interest were picked. Nondifferentially expressed control genes (grey dots, n=12) were selected as housekeeping genes or relevant genes for the cell type analyzed (b, c) Beeswarm plots for selected control genes not differentially expressed between BCR-ABL + and BCR-ABL SCs by both RNA-sequencing (b) and QPCR (c) data. Numbers of cells analyzed and numbers of cells showing amplification for the selected gene are shown below the plot. Nonparametric Wilcoxon test p-values are shown on top of each bar graph. Fisher s exact test p-values are shown below the graph. The average gene expression levels are indicated by red squares, the median and quartiles of gene expression levels are represented by the boxes. The dashed lines represent the LOD.


12 Lineage CD38 CD90 CD123 CP-CML CML on TKI Supplementary Figure 6 Live Lineage- Lin-CD34+CD38- Lin-CD34+CD38+ 49, Normal Bone Marrow FSC-A CD34 CD45RA CD45RA
13 Supplementary Figure 6. The composition of the Lin - CD34 + CD38 - HSC compartment is relatively preserved in CML. Representative FACS profile and gating strategy of BM cells from the analyzed normal donors (n=5) and CP- CML patients at diagnosis (n=18) and during TKI therapy (patients n=16; timepoints on TKI n=20). Figures show the mean percentage of parent gate for stem and progenitor populations across all analyzed donors/patients. The parent gate is indicated on top of the FACS plots.
14 Supplementary Figure 7 a b c d e f h g
15 Supplementary Figure 7. Overexpression of proliferation associated genes in BCR-ABL + CML-SCs. (a) Histogram showing the numbers of genes detected with RPKM 1 in 854 single-cells from 18 CML patients at diagnosis (mean=3,591). (b, c) Read depth (b) and mapped reads (c) per cell of normal-hscs (n=232), BCR-ABL SCs (n=377) and BCR-ABL + SCs (n=477) (d). Beeswarm plot showing comparable gene expression level of B2M in normal-hscs (n=232), BCR-ABL SCs (n=377) and BCR-ABL + SCs (n=477). (e) Number of detected genes in normal-hscs, BCR-ABL SCs and BCR- ABL + SCs. (f, g) Gene-set enrichment analysis comparing expression of proliferation- (f) and quiescence- (g) associated gene expression signatures in BCR-ABL SCs in comparison with normal-hscs. (h) The box plot illustrates the frequency of co-expression of G2/M associated genes among normal-hscs (black, n=232), BCR-ABL SCs (blue, n=377) and BCR-ABL + SCs (red, n=477). The frequency of co-expression of G2/M transition genes was higher in BCR-ABL + SCs when compared to either BCR-ABL SCs or normal-hscs (p=1.52e-07 and p=2.67e-06, respectively).

16 Supplementary Figure 8 a 5.77E E E E-09 Normal HSC BCR-ABL- SCs BCR-ABL+ SCs 3.35E E E E E E E E E E E-09 b 3.78E E E E E E E E E E E E E E E E E E E E E E E E E-21 c A: C: E: B: D: Normal HSC BCR-ABL- SCs BCR-ABL+ SCs
17 Supplementary Figure 8. Single-cell analysis enhances resolution for detection of aberrant gene expression in BCR-ABL + and BCR-ABL SCs. Beeswarm plots for selected differentially expressed genes between normal- HSCs, BCR-ABL and BCR-ABL + SCs showing log2(rpkm) for differentially expressed genes previously related to CML pathogenesis (a) and uniquely identified by this study (b). Numbers of cells analyzed and numbers of cells showing expression of the selected gene are shown below the plot. Nonparametric Wilcoxon test p-values (normal-hscs vs BCR-ABL + SCs) are shown on top of each bar graph. Fisher s exact test p-values (normal-hscs vs BCR-ABL + SCs) are shown below the graph. The average gene expression levels are indicated by red squares, the median and quartiles of gene expression levels are represented by the boxes. (c) Venn diagram showing differentially expressed genes detected using data analyzed as an ensemble of single-cells (in silico bulk) in comparison with differentially expressed genes detected using single-cell analysis (232 normal-hscs; n=5 subjects versus 477 BCR-ABL + SCs and 377 BCR-ABL SCs CP-CML; n=18 patients). Five groups of genes are highlighted in the Venn diagram: A) genes differentially expressed only in single BCR-ABL + SCs vs single normal-hscs, B) genes differentially expressed only in single BCR-ABL SCs vs single normal-hscs, C) genes differentially expressed in both single BCR-ABL + and single BCR- ABL SCs vs single normal-hscs, D) genes differentially expressed between CML SCs and normal-hscs only in bulk analysis (typically very low level expressed genes), E) genes differentially expressed in both single-cell analysis and in silico bulk analysis. For each group an example gene is shown.
18 Supplementary Figure 9 a b
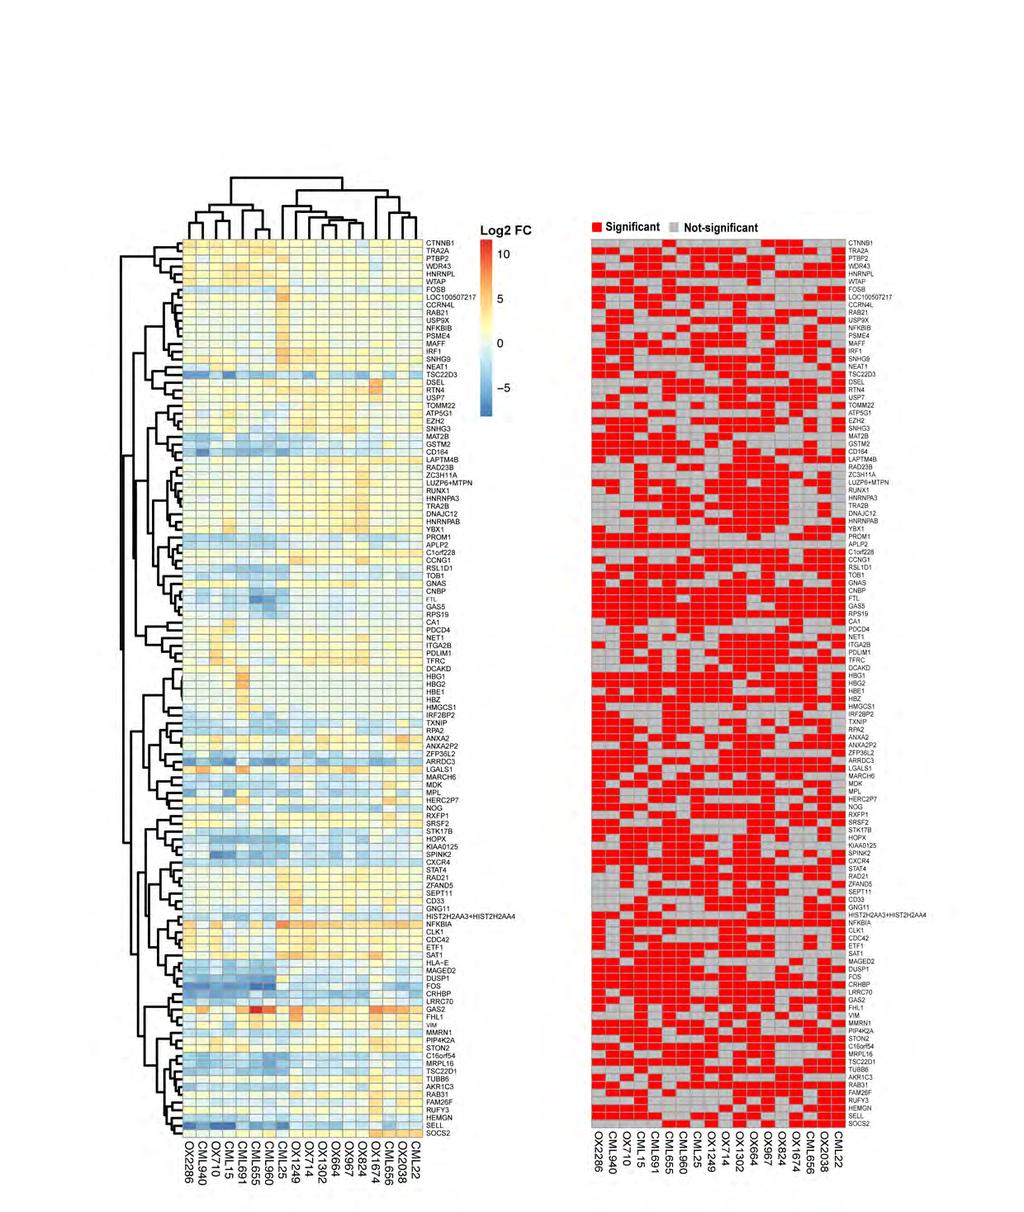
19 Supplementary Figure 9. Differentially expressed genes between normal- HSCs and BCR-ABL + SCs in individual CML patients. (a) Heatmap showing degree of up- or down-regulation for 116 differentially expressed genes between normal-hscs and BCR-ABL + SCs, according to the indicated log2(fc) scale. Each column represents an individual diagnostic patient. (b) The same genes as for panel (a), now showing whether differential expression was significant (P< 0.05 Fisher s test) in each patient.
20 Supplementary Figure 10
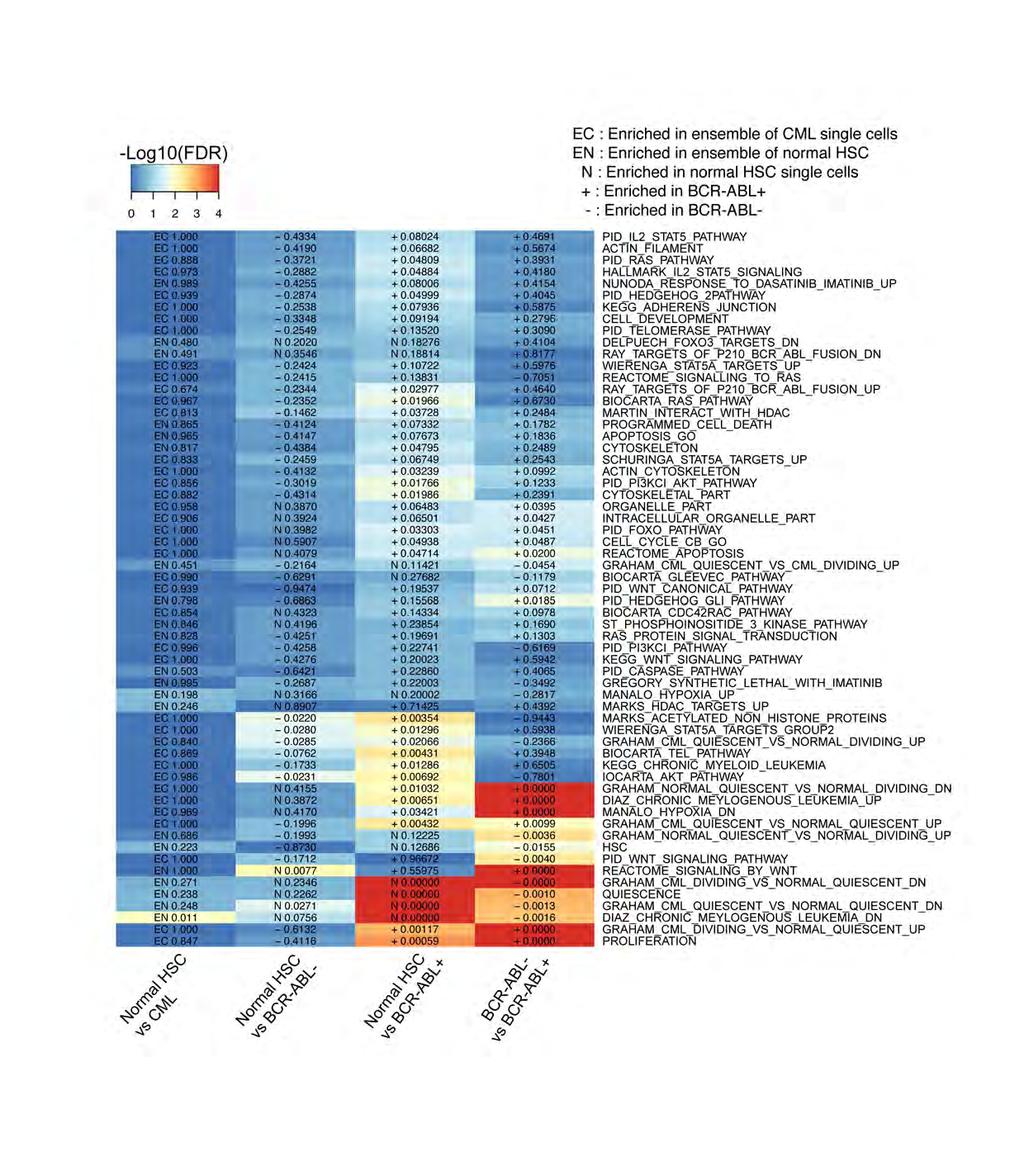
21 Supplementary Figure 10. Single-cell whole transcriptome analysis of BCR- ABL + SCs confirms aberrant gene-expression derived from previous CML stem/progenitor cell datasets. GSEA performed using selected gene-sets previously described in CML related literature for 1) Normal-HSCs (n=6) vs total (BCR-ABL and BCR-ABL + SCs combined) CML-SCs (n=18) as an in silico bulk analysis; 2) Single-cell analysis of normal-hscs from 5 normal donors (n=232) vs BCR-ABL SCs from 18 patients (n=377); 3) Single-cell analysis of normal-hscs (n=232) vs BCR-ABL + SCs (n=477) from 18 CML patients; 4) Single-cell analysis of BCR-ABL SCs (n=377) vs BCR-ABL + SCs (n=477) from 18 CML patients. A false discovery rate (FDR) cut-off of 0.25 was used.
22 Supplementary Figure 11 p=0.006 p< p< p<0.0001
23 Supplementary Figure 11. Measurement of time required by CML-SCs to undergo first cell division upon stimulation with TNF and TGF. The dot plot shows the number of single Lin - CD34 + CD38 - cells having undergone the first cell division after 96 hours in culture in standard cytokine condition and in the presence of TNF (20ng/ml) or TGF (20ng/ml). The result is shown for Lin - CD34 + CD38 - isolated from the BM of healthy controls (n=2) or CP-CML (n=4). The number is expressed as divided cells per teraski plate (60 wells). Chi-square p-values are shown in the box plot. Whiskers represent minimum and maximum values, the line represents the mean.

24 Supplementary Figure 12 a b OX1570 CML656 CML22 OX1902 CML2286
25 Supplementary Figure 12. Single-cell analysis reveals distinct molecular signatures of quiescent BCR-ABL + CML-SCs persisting during TKI therapy. (a,b) tsne visualization of normal-hscs and BCR-ABL + SCs at diagnosis and remission, generated using top 500 genes (Supplementary Table 7). In the background, normal-hscs (dim grey circles, n=232; 5 subjects) and BCR- ABL + SCs from all patients at diagnosis (dim grey triangles, n=477; 18 patients) and remission (dim red circles, n=245, 16 patients) are shown. In each plot single BCR-ABL + SCs from individual patients are highlighted by bright color-coding specific for each time-point. Panel (a) shows patients with relative enrichment for group-a remission cells during TKI therapy who subsequently achieved MMR and (b) shows two patients with predominantly group-b remission CML-SCs; the upper panel shows a patient who failed to achieve therapeutic Imatinib levels and the lower panel shows a patient who had temporarily interrupted TKI therapy at the time the sample was taken.
26 Supplementary Figure 13
27 Supplementary Figure 13. Single-cell analysis reveals distinct molecular signatures of BCR-ABL + CML-SCs during TKI therapy. GSEA heatmaps generated using normal-hscs (n=232, 5 normal subjects) vs group-a BCR- ABL + SCs at remission (n=122, 16 patients) vs BCR-ABL SCs at remission (n=420, 16 patients).

28 Supplementary Figure 14 a b
29 Supplementary Figure 14. Single-cell analysis reveals distinct molecular signatures of BCR-ABL + SCs at BC. (a) tsne visualization as shown in Fig.6a but with cells from patient 1266 highlighted. The color code highlights cells from paired pre-bc sample (taken at diagnosis when patient was in CP; green diamonds, n=53), and BC sample (taken at the time of myeloid blast crisis transformation; bright purple squares, n=63) of patient In the background are shown normal-hscs from 5 donors (dim grey circles; n=232), BCR-ABL + SCs from 18 CP-CML patients (dim red triangles; n=477) BCR- ABL + SCs from other blast crisis patients (OX1931 pre-bc, dim orange diamonds, n=132; OX1931 BC, dim light-blue squares, n=85; CML1203 BC, dim pink squares, n=7) and K562 cells (dim brown circles, n=53). (b) Heatmap showing the QPCR validation of selected genes in single BCR- ABL + SCs from two typical CP-CML patients at diagnosis in single BCR- ABL + SCs (OX664 n=32; OX2038 n=27) and BCR-ABL SCs (OX664 n=12; OX2038 n=17), and from the pre-bc sample from patient OX1931 (n=125).

30 CD38 CD90 CD123 Supplementary Figure 15 Live Lineage - Lin-CD34+CD38- Lin-CD34+CD Pre-BC CML BC CML Pre-BC OX BC OX Lineage BC CML FSC-A CD34 CD45RA CD45RA
31 Supplementary Figure 15. FACS profiles and gating strategy of BM cells from BC patients. The figure shows the BM composition of pre-bc samples (n=2; OX1931 and CML1266), lymphoid BC samples (n=2; OX1931 and CML1203) and myeloid BC samples (n=1; CML1266) analyzed. Numbers are percentages of parent gate for each gated stem and progenitor population. The parent gate is indicated on top of the FACS plots.

32 Supplementary Figure 16 a b Pre-BC OX1931 BC OX1931 c
33 Supplementary Figure 16. Tracking clonal evolution in single CML SCs. (a) Exome sequencing analysis identifies RUNX1 c.g521a mutation in both pre- BC and BC single SCs from patient OX1931. (b) The dot plot shows the index sort results corresponding to individual BCR-ABL + SCs from pre-bc sample. The color indicates if cells were in the CML CP-cluster (blue) or in the BC cluster (red). The values are expressed as mean fluorescent intensity (MFI) for CD90 and CD45RA antigens (y and x axis, respectively). (c) Heatmap showing QPCR validation in single BCR-ABL + SCs from pre-bc OX1931. The heatmap shows a panel of genes selected as differentially expressed between CP-CML cluster and BC-CML cluster (as shown in Fig. 6a), together with a SNP assays specific for RUNX1 WT or RUNX1 c.g521a (RUNX1 mut).
34 Supplementary Tables Supplementary Table 1. Patient demographics and characteristics Supplementary Table 2. Differentially expressed genes between normal HSCs, BCR-ABL + and BCR-ABL SCs from CP-CML patients at diagnosis. (a) References for some differentially expressed genes between BCR-ABL + CML SCs and normal HSCs. Both genes that have been previously implicated in CML and novel candidates identified by this study have been included; (b) Differentially expressed genes between normal HSCs and BCR-ABL + SCs from CP-CML patients at diagnosis; (c) Differentially expressed genes between normal HSCs and BCR-ABL SCs from CP-CML patients at diagnosis; (d) Differentially expressed genes between BCR-ABL SCs and BCR-ABL + SCs from CP-CML patients at diagnosis. Supplementary Table 3. Gene-sets from previous studies on CML stem and progenitor cells Supplementary Table 4. Results from GSEA comparing normal HSCs to BCR-ABL + SCs and BCR-ABL SCs from CP-CML patients at diagnosis and using gene-sets from previous studies on CML stem and progenitor cells (Supplementary Table 3). (a) GSEA of BCR-ABL + SCs and BCR-ABL SCs from CP-CML patients at diagnosis; (b) GSEA of BCR-ABL + SCs from CP- CML patients at diagnosis against normal HSCs; (c) GSEA of BCR-ABL SCs from CP-CML patients at diagnosis against normal HSCs. Supplementary Table 5. Results from GSEA comparing normal HSCs to BCR-ABL + SCs and BCR-ABL SCs from CP-CML patients at diagnosis and using HALLMARK gene-sets. (a) HALLMARK gene-sets; (b) GSEA on HALLMARK gene-sets of BCR-ABL + SCs and BCR-ABL SCs from CP-CML patients at diagnosis; (c) GSEA on HALLMARK gene-sets of BCR-ABL + SCs from CP-CML patients at diagnosis against normal HSCs; (d) GSEA on
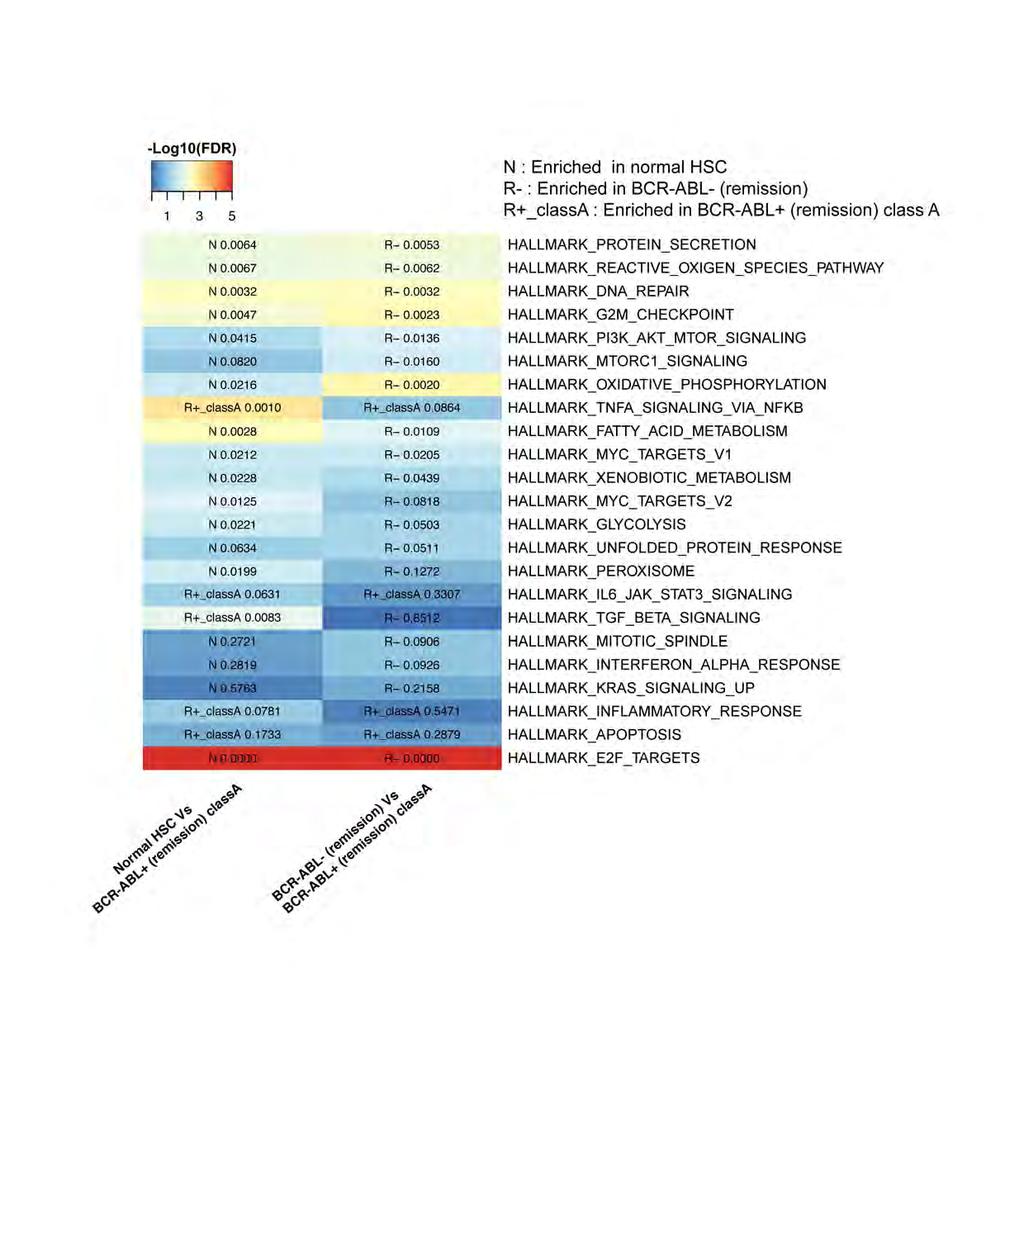
35 HALLMARK gene-sets of BCR-ABL SCs from CP-CML patients at diagnosis against normal HSCs. Supplementary Table 6. Results from GSEA comparing diagnostic samples from good and poor responder CML patients. (a) GSEA on HALLMARK genesets comparing BCR-ABL SCs from good responders to BCR-ABL SCs from poor responders; (b) GSEA on HALLMARK gene-sets comparing BCR- ABL + SCs from good responders to BCR-ABL + SCs from poor responders; (c) GSEA on CML-related gene-sets (Supplementary Table 3) comparing BCR- ABL SCs from good responders to BCR-ABL - SCs from poor responders; (d) GSEA on CML-related gene-sets (Supplementary Table 3) comparing BCR- ABL + SCs from good responders to BCR-ABL + SCs from poor responders. Supplementary Table 7. Top 500 informative genes for distinguishing normal-hscs from BCR-ABL + SCs at diagnosis and during remission. Supplementary Table 8. Results from GSEA on HALLMARK gene-sets comparing remission group-a BCR-ABL + SCs to remission group-b BCR- ABL + SCs. Supplementary Table 9. Differentially expressed genes between normal HSCs, BCR-ABL+ SCs from diagnosis, remission group-a and remission group-b. (a) Differentially expressed genes between normal HSCs and BCR- ABL + SCs remission group-a; (b) differentially expressed genes between BCR-ABL + SCs remission group-a versus BCR-ABL + SCs remission group-b; (c) differentially expressed genes between BCR-ABL - SCs from CP-CML patients at diagnosis and BCR-ABL + SCs remission group-a; (d) differentially expressed genes between BCR-ABL + SCs from CP-CML patients at diagnosis and BCR-ABL + SCs remission group-a. Supplementary Table 10. Results from GSEA comparing remission group-a BCR-ABL + SCs to normal HSCs and remission BCR-ABL SCs. (a) GSEA on
36 HALLMARK gene-sets comparing remission group-a BCR-ABL + SCs to normal-hscs; (b) GSEA on CML-related gene-sets comparing remission group-a BCR-ABL + SCs to normal-hscs; (c) GSEA on HALLMARK gene-sets comparing remission group-a BCR-ABL + SCs to remission BCR-ABL SCs; (d) GSEA on CML-related gene-sets comparing remission group-a BCR- ABL + SCs to remission BCR-ABL SCs. Supplementary Table 11. Differentially expressed genes between single BCR-ABL + SCs falling in CP-CML cluster and BCR-ABL + SCs falling in BC- CML cluster (related to Fig. 6a).
37 Supplementary Table 12. Anti-human FACS Antibodies. Antigen Clone Conjugate Company CD34 8G12 APC Biolegend CD38 HIT2 PETXR Life Technologies CD90 5E10 PE Biolegend CD45RA MEM56 FITC Life Technologies CD123 6H6 PECy7 Biolegend CD2 RPA-2.10 PECy5 Biolegend CD3 HIT3a PECy5 Biolegend CD4 RPA-T4 PECy5 Biolegend CD7 CD7-6B7 PECy5 Biolegend CD8a RPA-T8 PECy5 Biolegend CD10 HI10a PECy5 Biolegend CD11b ICRF44 PECy5 Biolegend CD14 RMO52 PECy5 Biolegend CD19 HIB19 PECy5 Biolegend CD20 2H7 PECy5 Biolegend CD56 B159 PECy5 BD CD235ab HIR2 PECy5 Biolegend
38 Supplementary Table 13. Reagents mixes for generation of single-cell cdna libraries using BCR-ABL tss2 protocol. Lysis Mix reagents Reagent Volume for 1 cell (μl) 0.4% Triton X + RNAse Inhibitor (1:20) 2 dntps (10 mm) 1 Oligo dt (10 μm) 1 ERCC (pre-diluted 1:400,000) 0.1 TOTAL 4 (4.1 with ERCC) RT mix reagents Reagent Volume for 1 cell (μl) Superscript II first strand buffer (5x) 2 DTT (100 mm) 0.5 Betaine (5 M) 2 MgCl2 (1 M) 0.1 RNAse Inhibitor (40 U/μL) 0.25 TSO (100 μm) 0.1 BCR-ABL Primer set #1 F+R (200 μm) 0.07 Superscript II (200 U/μL) 0.25 Water 0.33 TOTAL 5.6 PCR mix reagents Reagent Volume for 1 cell (μl) KAPA Hifi HS Ready Mix (2x) 12.5 ISPCR oligo (10 μm) BCR-ABL Primer set#2 F+R (20 μm) 0.07 Water TOTAL 15
39 Supplementary Table 14. Modified C1 PCR MIX for BCR-ABL targeted amplification. Reagent Volume (μl) PCR Water (Advantage 2 Kit) X Advantage 2 PCR Buffer 10 (Advantage 2 Kit) 50X dntp Mix (Advantage 2 Kit) 4 IS PCR primer (Clontech SMARTer) 4 50X Advantage 2 Polymerase Mix 4 (Advantage 2 Kit) C1 Loading Reagent (Fluidigm) 4.5 BCR-ABL Taqman assay pre-diluted 4 1:22 (Hs _ft)
40 Supplementary Table 15. Taqman assays used for Fluidigm Dynamic Array. Gene Symbol ABL1 ATG3 B2M BCL2 BCR BCR-ABL BLNK CD33 CD34 CD79A CD79B CD164 CDK6 CKLF CLU CSF1R CTNNB1 CXCR4 DNTT FCER1A GAPDH GAS2 GOLGA8A HPRT HSP90A1 IFITM1 IGF1R IGJ ITGA6 MEIS1 MLLT3 MMRN1 MPL MZB1 PTRF RGS2 RXFP1 SAT1 SELL SELP SOD2 TESPA1 VWF Taqman Assay ID Hs _m1 Hs _m1 Hs _m1 Hs _m1 Hs _m1 Hs _ft Hs _m1 Hs _m1 Hs _m1 Hs _m1 Hs _g1 Hs _m1 Hs _m1 Hs _s1 Hs _m1 Hs _m1 Hs _m1 Hs _s1 Hs _m1 Hs _m1 Hs _g1 Hs _m1 Hs _m1 Hs _m1 Hs _g1 Hs _s1 Hs _m1 Hs _m1 Hs _m1 Hs _m1 Hs _m1 Hs _m1 Hs _m1 Hs _m1 Hs _m1 Hs _g1 Hs _m1 Hs _m1 Hs _m1 Hs _m1 Hs _m1 Hs _m1 Hs _m1
Supplemental Information. Aryl Hydrocarbon Receptor Controls. Monocyte Differentiation. into Dendritic Cells versus Macrophages
 Immunity, Volume 47 Supplemental Information Aryl Hydrocarbon Receptor Controls Monocyte Differentiation into Dendritic Cells versus Macrophages Christel Goudot, Alice Coillard, Alexandra-Chloé Villani,
sequences of a styx mutant reveals a T to A transversion in the donor splice site of intron 5
 sfigure 1 Styx mutant mice recapitulate the phenotype of SHIP -/- mice. (A) Analysis of the genomic sequences of a styx mutant reveals a T to A transversion in the donor splice site of intron 5 (GTAAC
Nature Immunology: doi: /ni Supplementary Figure 1. Transcriptional program of the TE and MP CD8 + T cell subsets.
 Supplementary Figure 1 Transcriptional program of the TE and MP CD8 + T cell subsets. (a) Comparison of gene expression of TE and MP CD8 + T cell subsets by microarray. Genes that are 1.5-fold upregulated
Nature Immunology: doi: /ni Supplementary Figure 1. Huwe1 has high expression in HSCs and is necessary for quiescence.
 Supplementary Figure 1 Huwe1 has high expression in HSCs and is necessary for quiescence. (a) Heat map visualizing expression of genes with a known function in ubiquitin-mediated proteolysis (KEGG: Ubiquitin
fl/+ KRas;Atg5 fl/+ KRas;Atg5 fl/fl KRas;Atg5 fl/fl KRas;Atg5 Supplementary Figure 1. Gene set enrichment analyses. (a) (b)
 (b)") KRas;At KRas;At KRas;At KRas;At a b Supplementary Figure 1. Gene set enrichment analyses. (a) GO gene sets (MSigDB v3. c5) enriched in KRas;Atg5 fl/+ as compared to KRas;Atg5 fl/fl tumors using gene set
KRas;At KRas;At KRas;At KRas;At a b Supplementary Figure 1. Gene set enrichment analyses. (a) GO gene sets (MSigDB v3. c5) enriched in KRas;Atg5 fl/+ as compared to KRas;Atg5 fl/fl tumors using gene set
Supplementary Materials
 Supplementary Materials 43 Figure S1. CD123 in acute lymphoblastic leukemia and leukemia-initiating cells. A. CD123 (histograms) is highly and homogenously expressed in B-ALL blasts (as defined by live,
Supplementary Figures
 Supplementary Figures Supplementary Figure 1. Heatmap of GO terms for differentially expressed genes. The terms were hierarchically clustered using the GO term enrichment beta. Darker red, higher positive
activation with anti-cd3/cd28 beads and 3d following transduction. Supplemental Figure 2 shows
 Supplemental Data Supplemental Figure 1 compares CXCR4 expression in untreated CD8 + T cells, following activation with anti-cd3/cd28 beads and 3d following transduction. Supplemental Figure 2 shows the
Supplementary Figure S1. Gene expression analysis of epidermal marker genes and TP63.
 Supplementary Figure Legends Supplementary Figure S1. Gene expression analysis of epidermal marker genes and TP63. A. Screenshot of the UCSC genome browser from normalized RNAPII and RNA-seq ChIP-seq data
Supplemental Information. Genomic Characterization of Murine. Monocytes Reveals C/EBPb Transcription. Factor Dependence of Ly6C Cells
 Immunity, Volume 46 Supplemental Information Genomic Characterization of Murine Monocytes Reveals C/EBPb Transcription Factor Dependence of Ly6C Cells Alexander Mildner, Jörg Schönheit, Amir Giladi, Eyal
Molecular Detection of BCR/ABL1 for the Diagnosis and Monitoring of CML
 Molecular Detection of BCR/ABL1 for the Diagnosis and Monitoring of CML Imran Mirza, MD, MS, FRCPC Pathology & Laboratory Medicine Institute Sheikh Khalifa Medical City, Abu Dhabi, UAE. imirza@skmc.ae
Nature Biotechnology: doi: /nbt Supplementary Figure 1. Binding capacity of DNA-barcoded MHC multimers and recovery of antigen specificity
 Supplementary Figure 1 Binding capacity of DNA-barcoded MHC multimers and recovery of antigen specificity (a, b) Fluorescent-based determination of the binding capacity of DNA-barcoded MHC multimers (+barcode)
AbSeq on the BD Rhapsody system: Exploration of single-cell gene regulation by simultaneous digital mrna and protein quantification
 BD AbSeq on the BD Rhapsody system: Exploration of single-cell gene regulation by simultaneous digital mrna and protein quantification Overview of BD AbSeq antibody-oligonucleotide conjugates. High-throughput
Supplementary Figures
 Supplementary Figures Supplementary Figure 1. Confirmation of Dnmt1 conditional knockout out mice. a, Representative images of sorted stem (Lin - CD49f high CD24 + ), luminal (Lin - CD49f low CD24 + )
Nature Immunology: doi: /ni.3412
 Supplementary Figure 1 Gata1 expression in heamatopoietic stem and progenitor populations. (a) Unsupervised clustering according to 100 top variable genes across single pre-gm cells. The two main cell
SUPPLEMENTARY INFORMATION
 doi:10.1038/nature10866 a b 1 2 3 4 5 6 7 Match No Match 1 2 3 4 5 6 7 Turcan et al. Supplementary Fig.1 Concepts mapping H3K27 targets in EF CBX8 targets in EF H3K27 targets in ES SUZ12 targets in ES
Supplementary Figure 1. Using DNA barcode-labeled MHC multimers to generate TCR fingerprints
 Supplementary Figure 1 Using DNA barcode-labeled MHC multimers to generate TCR fingerprints (a) Schematic overview of the workflow behind a TCR fingerprint. Each peptide position of the original peptide
SUPPLEMENTARY INFORMATION
 DOI: 1.138/ncb3355 a S1A8 + cells/ total.1.8.6.4.2 b S1A8/?-Actin c % T-cell proliferation 3 25 2 15 1 5 T cells Supplementary Figure 1 Inter-tumoral heterogeneity of MDSC accumulation in mammary tumor
Simple, rapid, and reliable RNA sequencing
 Simple, rapid, and reliable RNA sequencing RNA sequencing applications RNA sequencing provides fundamental insights into how genomes are organized and regulated, giving us valuable information about the
BCR-ABL - LSK BCR-ABL + LKS - (%)
") Marker Clone BCR-ABL + LSK (%) BCR-ABL + LKS - (%) BCR-ABL - LSK (%) P value vs. BCR-ABL + LKS - P value vs. BCR-ABL - LSK CD2 RM2-5 12.9 ± 3.6 36.7 ± 6.5 19.3 ± 2.4 0.01 0.10 CD5 53-7.3 13.9 ± 3.2 20.8
Marker Clone BCR-ABL + LSK (%) BCR-ABL + LKS - (%) BCR-ABL - LSK (%) P value vs. BCR-ABL + LKS - P value vs. BCR-ABL - LSK CD2 RM2-5 12.9 ± 3.6 36.7 ± 6.5 19.3 ± 2.4 0.01 0.10 CD5 53-7.3 13.9 ± 3.2 20.8
Lentiviral Delivery of Combinatorial mirna Expression Constructs Provides Efficient Target Gene Repression.
 Supplementary Figure 1 Lentiviral Delivery of Combinatorial mirna Expression Constructs Provides Efficient Target Gene Repression. a, Design for lentiviral combinatorial mirna expression and sensor constructs.
Supplemental Information. Granulocyte-Monocyte Progenitors and. Monocyte-Dendritic Cell Progenitors Independently
 Immunity, Volume 47 Supplemental Information Granulocyte-Monocyte Progenitors and Monocyte-endritic ell Progenitors Independently Produce Functionally istinct Monocytes lberto Yáñez, Simon G. oetzee, ndre
Nature Structural & Molecular Biology: doi: /nsmb Supplementary Figure 1
 Supplementary Figure 1 U1 inhibition causes a shift of RNA-seq reads from exons to introns. (a) Evidence for the high purity of 4-shU-labeled RNAs used for RNA-seq. HeLa cells transfected with control
Nature Genetics: doi: /ng Supplementary Figure 1. SEER data for male and female cancer incidence from
 Supplementary Figure 1 SEER data for male and female cancer incidence from 1975 2013. (a,b) Incidence rates of oral cavity and pharynx cancer (a) and leukemia (b) are plotted, grouped by males (blue),
<10. IL-1β IL-6 TNF + _ TGF-β + IL-23
 3 ns 25 ns 2 IL-17 (pg/ml) 15 1 ns ns 5 IL-1β IL-6 TNF
HD1 (FLU) HD2 (EBV) HD2 (FLU)
 HD2 (EBV) HD2 (FLU)") ramer staining + anti-pe beads ramer staining a HD1 (FLU) HD2 (EBV) HD2 (FLU).73.11.56.46.24 1.12 b CD127 + c CD127 + d CD127 - e CD127 - PD1 - PD1 + PD1 + PD1-1 1 1 1 %CD127 + PD1-8 6 4 2 + anti-pe %CD127
ramer staining + anti-pe beads ramer staining a HD1 (FLU) HD2 (EBV) HD2 (FLU).73.11.56.46.24 1.12 b CD127 + c CD127 + d CD127 - e CD127 - PD1 - PD1 + PD1 + PD1-1 1 1 1 %CD127 + PD1-8 6 4 2 + anti-pe %CD127
Nature Immunology: doi: /ni Supplementary Figure 1. RNA-Seq analysis of CD8 + TILs and N-TILs.
 Supplementary Figure 1 RNA-Seq analysis of CD8 + TILs and N-TILs. (a) Schematic representation of the tumor and cell types used for the study. HNSCC, head and neck squamous cell cancer; NSCLC, non-small
TEB. Id4 p63 DAPI Merge. Id4 CK8 DAPI Merge
 a Duct TEB b Id4 p63 DAPI Merge Id4 CK8 DAPI Merge c d e Supplementary Figure 1. Identification of Id4-positive MECs and characterization of the Comma-D model. (a) IHC analysis of ID4 expression in the
VUmc Basispresentatie
 Clinical diagnostic cytometry Gerrit J Schuurhuis Dept of Hematology VU University Medical Center Amsterdam, Netherlands Use of immunophenotyping at diagnosis to trace residual disease after therapy 1.
X P. Supplementary Figure 1. Nature Medicine: doi: /nm Nilotinib LSK LT-HSC. Cytoplasm. Cytoplasm. Nucleus. Nucleus
 a b c Supplementary Figure 1 c-kit-apc-eflu780 Lin-FITC Flt3-Linc-Kit-APC-eflu780 LSK Sca-1-PE-Cy7 d e f CD48-APC LT-HSC CD150-PerCP-cy5.5 g h i j Cytoplasm RCC1 X Exp 5 mir 126 SPRED1 SPRED1 RAN P SPRED1
Eosinophils are required. for the maintenance of plasma cells in the bone marrow
 Eosinophils are required for the maintenance of plasma cells in the bone marrow Van Trung Chu, Anja Fröhlich, Gudrun Steinhauser, Tobias Scheel, Toralf Roch, Simon Fillatreau, James J. Lee, Max Löhning
SUPPLEMENTARY INFORMATION
 DOI:.38/ncb3399 a b c d FSP DAPI 5mm mm 5mm 5mm e Correspond to melanoma in-situ Figure a DCT FSP- f MITF mm mm MlanaA melanoma in-situ DCT 5mm FSP- mm mm mm mm mm g melanoma in-situ MITF MlanaA mm mm
SUPPLEMENTARY INFORMATION
 Supplementary text Collectively, we were able to detect ~14,000 expressed genes with RPKM (reads per kilobase per million) > 1 or ~16,000 with RPKM > 0.1 in at least one cell type from oocyte to the morula
Supplementary Figure 1: Features of IGLL5 Mutations in CLL: a) Representative IGV screenshot of first
 Representative IGV screenshot of first") Supplementary Figure 1: Features of IGLL5 Mutations in CLL: a) Representative IGV screenshot of first intron IGLL5 mutation depicting biallelic mutations. Red arrows highlight the presence of out of phase
Supplementary Figure 1: Features of IGLL5 Mutations in CLL: a) Representative IGV screenshot of first intron IGLL5 mutation depicting biallelic mutations. Red arrows highlight the presence of out of phase
Supplemental Figure 1
 Supplemental Figure 1 1a 1c PD-1 MFI fold change 6 5 4 3 2 1 IL-1α IL-2 IL-4 IL-6 IL-1 IL-12 IL-13 IL-15 IL-17 IL-18 IL-21 IL-23 IFN-α Mut Human PD-1 promoter SBE-D 5 -GTCTG- -1.2kb SBE-P -CAGAC- -1.kb
Frequency(%) KRAS G12 KRAS G13 KRAS A146 KRAS Q61 KRAS K117N PIK3CA H1047 PIK3CA E545 PIK3CA E542K PIK3CA Q546. EGFR exon19 NFS-indel EGFR L858R
 KRAS G12 KRAS G13 KRAS A146 KRAS Q61 KRAS K117N PIK3CA H1047 PIK3CA E545 PIK3CA E542K PIK3CA Q546. EGFR exon19 NFS-indel EGFR L858R") Frequency(%) 1 a b ALK FS-indel ALK R1Q HRAS Q61R HRAS G13R IDH R17K IDH R14Q MET exon14 SS-indel KIT D8Y KIT L76P KIT exon11 NFS-indel SMAD4 R361 IDH1 R13 CTNNB1 S37 CTNNB1 S4 AKT1 E17K ERBB D769H ERBB
Frequency(%) 1 a b ALK FS-indel ALK R1Q HRAS Q61R HRAS G13R IDH R17K IDH R14Q MET exon14 SS-indel KIT D8Y KIT L76P KIT exon11 NFS-indel SMAD4 R361 IDH1 R13 CTNNB1 S37 CTNNB1 S4 AKT1 E17K ERBB D769H ERBB
RNA-Seq Preparation Comparision Summary: Lexogen, Standard, NEB
 RNA-Seq Preparation Comparision Summary: Lexogen, Standard, NEB CSF-NGS January 22, 214 Contents 1 Introduction 1 2 Experimental Details 1 3 Results And Discussion 1 3.1 ERCC spike ins............................................
Supplemental Methods RNA sequencing experiment
 Supplemental Methods RNA sequencing experiment Mice were euthanized as described in the Methods and the right lung was removed, placed in a sterile eppendorf tube, and snap frozen in liquid nitrogen. RNA
Supplementary Figure 1. Metabolic landscape of cancer discovery pipeline. RNAseq raw counts data of cancer and healthy tissue samples were downloaded
 Supplementary Figure 1. Metabolic landscape of cancer discovery pipeline. RNAseq raw counts data of cancer and healthy tissue samples were downloaded from TCGA and differentially expressed metabolic genes
Supplemental Figure S1. Expression of Cirbp mrna in mouse tissues and NIH3T3 cells.
 SUPPLEMENTAL FIGURE AND TABLE LEGENDS Supplemental Figure S1. Expression of Cirbp mrna in mouse tissues and NIH3T3 cells. A) Cirbp mrna expression levels in various mouse tissues collected around the clock
Supplementary Information Titles Journal: Nature Medicine
 Supplementary Information Titles Journal: Nature Medicine Article Title: Corresponding Author: Supplementary Item & Number Supplementary Fig.1 Fig.2 Fig.3 Fig.4 Fig.5 Fig.6 Fig.7 Fig.8 Fig.9 Fig. Fig.11
SUPPLEMENTARY METHODS
 SUPPLEMENTARY METHODS Histological analysis. Colonic tissues were collected from 5 parts of the middle colon on day 7 after the start of DSS treatment, and then were cut into segments, fixed with 4% paraformaldehyde,
Broad H3K4me3 is associated with increased transcription elongation and enhancer activity at tumor suppressor genes
 Broad H3K4me3 is associated with increased transcription elongation and enhancer activity at tumor suppressor genes Kaifu Chen 1,2,3,4,5,10, Zhong Chen 6,10, Dayong Wu 6, Lili Zhang 7, Xueqiu Lin 1,2,8,
Cancer Informatics Lecture
 Cancer Informatics Lecture Mayo-UIUC Computational Genomics Course June 22, 2018 Krishna Rani Kalari Ph.D. Associate Professor 2017 MFMER 3702274-1 Outline The Cancer Genome Atlas (TCGA) Genomic Data Commons
well for 2 h at rt. Each dot represents an individual mouse and bar is the mean ±
 Supplementary data: Control DC Blimp-1 ko DC 8 6 4 2-2 IL-1β p=.5 medium 8 6 4 2 IL-2 Medium p=.16 8 6 4 2 IL-6 medium p=.3 5 4 3 2 1-1 medium IL-1 n.s. 25 2 15 1 5 IL-12(p7) p=.15 5 IFNγ p=.65 4 3 2 1
(a) Significant biological processes (upper panel) and disease biomarkers (lower panel)
 Significant biological processes (upper panel) and disease biomarkers (lower panel)") Supplementary Figure 1. Functional enrichment analyses of secretomic proteins. (a) Significant biological processes (upper panel) and disease biomarkers (lower panel) 2 involved by hrab37-mediated secretory
Supplementary Figure 1. Functional enrichment analyses of secretomic proteins. (a) Significant biological processes (upper panel) and disease biomarkers (lower panel) 2 involved by hrab37-mediated secretory
Nature Methods: doi: /nmeth.3115
 Supplementary Figure 1 Analysis of DNA methylation in a cancer cohort based on Infinium 450K data. RnBeads was used to rediscover a clinically distinct subgroup of glioblastoma patients characterized by
Nature Genetics: doi: /ng Supplementary Figure 1
 Supplementary Figure 1 MSI2 interactors are associated with the riboproteome and are functionally relevant. (a) Coomassie blue staining of FLAG-MSI2 immunoprecipitated complexes. (b) GO analysis of MSI2-interacting
Supplementary Figure S1. Flow cytometric analysis of the expression of Thy1 in NH cells. Flow cytometric analysis of the expression of T1/ST2 and
 Supplementary Figure S1. Flow cytometric analysis of the expression of Thy1 in NH cells. Flow cytometric analysis of the expression of T1/ST2 and Thy1 in NH cells derived from the lungs of naïve mice.
Supplementary Fig. 1: Ex vivo tetramer enrichment with anti-c-myc beads
 Supplementary Fig. 1: Ex vivo tetramer enrichment with anti-c-myc beads Representative example of comparative ex vivo tetramer enrichment performed in three independent experiments with either conventional
Nature Immunology: doi: /ni Supplementary Figure 1. Characteristics of SEs in T reg and T conv cells.
 Supplementary Figure 1 Characteristics of SEs in T reg and T conv cells. (a) Patterns of indicated transcription factor-binding at SEs and surrounding regions in T reg and T conv cells. Average normalized
Nature Immunology: doi: /ni Supplementary Figure 1. DNA-methylation machinery is essential for silencing of Cd4 in cytotoxic T cells.
 Supplementary Figure 1 DNA-methylation machinery is essential for silencing of Cd4 in cytotoxic T cells. (a) Scheme for the retroviral shrna screen. (b) Histogram showing CD4 expression (MFI) in WT cytotoxic
Supplementary Figure 1: Tissue of Origin analysis on 152 cell lines. (a) Heatmap representation of the 30 Tissue scores for the 152 cell lines.
 Heatmap representation of the 30 Tissue scores for the 152 cell lines.") Supplementary Figure 1: Tissue of Origin analysis on 152 cell lines. (a) Heatmap representation of the 30 Tissue scores for the 152 cell lines. The scores summarize the global expression of the tissue
Supplementary Figure 1: Tissue of Origin analysis on 152 cell lines. (a) Heatmap representation of the 30 Tissue scores for the 152 cell lines. The scores summarize the global expression of the tissue
Supplementary Figure 1. BMS enhances human T cell activation in vitro in a
 Supplementary Figure 1. BMS98662 enhances human T cell activation in vitro in a concentration-dependent manner. Jurkat T cells were activated with anti-cd3 and anti-cd28 antibody in the presence of titrated
Human and mouse T cell regulation mediated by soluble CD52 interaction with Siglec-10. Esther Bandala-Sanchez, Yuxia Zhang, Simone Reinwald,
 Human and mouse T cell regulation mediated by soluble CD52 interaction with Siglec-1 Esther Bandala-Sanchez, Yuxia Zhang, Simone Reinwald, James A. Dromey, Bo Han Lee, Junyan Qian, Ralph M Böhmer and Leonard
Supplementary Information
 Supplementary Information Supplementary Figure 1! a! b! Nfatc1!! Nfatc1"! P1! P2! pa1! pa2! ex1! ex2! exons 3-9! ex1! ex11!!" #" Nfatc1A!!" Nfatc1B! #"!" Nfatc1C! #" DN1! DN2! DN1!!A! #A!!B! #B!!C! #C!!A!
Supplementary Figure 1. Ex vivo IFNγ production by Tregs. Nature Medicine doi: /nm % CD127. Empty SSC 98.79% CD25 CD45RA.
 SSC CD25 1.8% CD127 Empty 98.79% FSC CD45RA CD45RA Foxp3 %IFNγ + cells 4 3 2 1 + IL-12 P =.3 IFNγ p=.9 %IL-4+ cells 3 2 1 IL-4 P =.4 c %IL-1 + cells IFNγ 4 3 2 1 Control Foxp3 IL-1 P =.41.64 4.76 MS 2.96
7SK ChIRP-seq is specifically RNA dependent and conserved between mice and humans.
 Supplementary Figure 1 7SK ChIRP-seq is specifically RNA dependent and conserved between mice and humans. Regions targeted by the Even and Odd ChIRP probes mapped to a secondary structure model 56 of the
Normal & Leukaemic haematopoiesis. Dr. Liu Te Chih Dept of Haematology / Oncology National University Health Services Singapore
 Normal & Leukaemic haematopoiesis 2010 Dr. Liu Te Chih Dept of Haematology / Oncology National University Health Services Singapore Use of Immunophenotyping today Lineage assignment Differentiation of
Supplemental Figures Supplemental Figure 1:
 Supplemental Figures Supplemental Figure 1: Representative FACS data showing Concurrent Brain cell type Acquisition using either Percoll PLUS (top row) or myelin removal beads (bottom two rows). Debris
MATERIALS AND METHODS. Neutralizing antibodies specific to mouse Dll1, Dll4, J1 and J2 were prepared as described. 1,2 All
 MATERIALS AND METHODS Antibodies (Abs), flow cytometry analysis and cell lines Neutralizing antibodies specific to mouse Dll1, Dll4, J1 and J2 were prepared as described. 1,2 All other antibodies used
pplementary Figur Supplementary Figure 1. a.
 pplementary Figur Supplementary Figure 1. a. Quantification by RT-qPCR of YFV-17D and YFV-17D pol- (+) RNA in the supernatant of cultured Huh7.5 cells following viral RNA electroporation of respective
Supplemental Information. Checkpoint Blockade Immunotherapy. Induces Dynamic Changes. in PD-1 CD8 + Tumor-Infiltrating T Cells
 Immunity, Volume 50 Supplemental Information Checkpoint Blockade Immunotherapy Induces Dynamic Changes in PD-1 CD8 + Tumor-Infiltrating T Cells Sema Kurtulus, Asaf Madi, Giulia Escobar, Max Klapholz, Jackson
Nature Immunology: doi: /ni Supplementary Figure 1. Gene expression profile of CD4 + T cells and CTL responses in Bcl6-deficient mice.
 Supplementary Figure 1 Gene expression profile of CD4 + T cells and CTL responses in Bcl6-deficient mice. (a) Gene expression profile in the resting CD4 + T cells were analyzed by an Affymetrix microarray
Supplementary Materials for
 www.sciencemag.org/content/355/6332/eaai8478/suppl/dc1 Supplementary Materials for Decoupling genetics, lineages, and microenvironment in IDH-mutant gliomas by single-cell RNA-seq Andrew S. Venteicher,
SUPPLEMENTARY FIGURES
 SUPPLEMENTARY FIGURES Figure S1. Clinical significance of ZNF322A overexpression in Caucasian lung cancer patients. (A) Representative immunohistochemistry images of ZNF322A protein expression in tissue
Single Cell Quantitative Polymer Chain Reaction (sc-qpcr)
") Single Cell Quantitative Polymer Chain Reaction (sc-qpcr) Analyzing gene expression profiles from a bulk population of cells provides an average profile which may obscure important biological differences
Single Cell Quantitative Polymer Chain Reaction (sc-qpcr) Analyzing gene expression profiles from a bulk population of cells provides an average profile which may obscure important biological differences
Supplementary Materials for
 www.sciencesignaling.org/cgi/content/full/8/375/ra41/dc1 Supplementary Materials for Actin cytoskeletal remodeling with protrusion formation is essential for heart regeneration in Hippo-deficient mice
Nature Immunology: doi: /ni Supplementary Figure 1. Cytokine pattern in skin in response to urushiol.
 Supplementary Figure 1 Cytokine pattern in skin in response to urushiol. Wild-type (WT) and CD1a-tg mice (n = 3 per group) were sensitized and challenged with urushiol (uru) or vehicle (veh). Quantitative
MRD in CML (BCR-ABL1)
") MRD in CML (BCR-ABL1) Moleculaire Biologie en Cytometrie cursus Barbara Denys LAbo Hematologie UZ Gent 6 mei 2011 2008 Universitair Ziekenhuis Gent 1 Myeloproliferative Neoplasms o WHO classification 2008:
MRD in CML (BCR-ABL1) Moleculaire Biologie en Cytometrie cursus Barbara Denys LAbo Hematologie UZ Gent 6 mei 2011 2008 Universitair Ziekenhuis Gent 1 Myeloproliferative Neoplasms o WHO classification 2008:
Ayako Suzuki 1, Koutatsu Matsushima 2, Hideki Makinoshima 2, Sumio Sugano 1, Takashi Kohno 3,4, Katsuya Tsuchihara 2 and Yutaka Suzuki 1,5*
 Suzuki et al. Genome Biology (2015) 16:66 DOI 10.1186/s13059-015-0636-y RESEARCH Open Access Single-cell analysis of lung adenocarcinoma cell lines reveals diverse expression patterns of individual cells
Online supplement. Phenotypic, functional and plasticity features of classical and alternatively activated
 Online supplement Phenotypic, functional and plasticity features of classical and alternatively activated human macrophages Abdullah Al Tarique*, Jayden Logan *, Emma Thomas *, Patrick G Holt *, Peter
Iso-Seq Method Updates and Target Enrichment Without Amplification for SMRT Sequencing
 Iso-Seq Method Updates and Target Enrichment Without Amplification for SMRT Sequencing PacBio Americas User Group Meeting Sample Prep Workshop June.27.2017 Tyson Clark, Ph.D. For Research Use Only. Not
Cluster Dendrogram. dist(cor(na.omit(tss.exprs.chip[, c(1:10, 24, 27, 30, 48:50, dist(cor(na.omit(tss.exprs.chip[, c(1:99, 103, 104, 109, 110,
 A Transcriptome (RNA-seq) Transcriptome (RNA-seq) 3. 2.5 2..5..5...5..5 2. 2.5 3. 2.5 2..5..5...5..5 2. 2.5 Cluster Dendrogram RS_ES3.2 RS_ES3. RS_SHS5.2 RS_SHS5. PS_SHS5.2 PS_SHS5. RS_LJ3 PS_LJ3..4 _SHS5.2
SUPPLEMENTARY INFORMATION
 a. Smo+/+ b. Smo+/+ 5.63 5.48 c. Lin- d. e. 6 5 4 3 Ter119 Mac B T Sca1 Smo+/+ 25 15 2 o BMT 2 1 5 * Supplementary Figure 1: Deletion of Smoothened does not alter the frequency of hematopoietic lineages
Nature Genetics: doi: /ng Supplementary Figure 1. Somatic coding mutations identified by WES/WGS for 83 ATL cases.
 Supplementary Figure 1 Somatic coding mutations identified by WES/WGS for 83 ATL cases. (a) The percentage of targeted bases covered by at least 2, 10, 20 and 30 sequencing reads (top) and average read
Chronic variable stress activates hematopoietic stem cells
 SUPPLEMENTARY INFORMATION Chronic variable stress activates hematopoietic stem cells Timo Heidt *, Hendrik B. Sager *, Gabriel Courties, Partha Dutta, Yoshiko Iwamoto, Alex Zaltsman, Constantin von zur
SUPPLEMENTARY INFORMATION
 doi:10.1038/nature10134 Supplementary Figure 1. Anti-inflammatory activity of sfc. a, Autoantibody immune complexes crosslink activating Fc receptors, promoting activation of macrophages, and WWW.NATURE.COM/NATURE
SUPPLEMENTARY INFORMATION
 DOI: 10.1038/ncb2607 Figure S1 Elf5 loss promotes EMT in mammary epithelium while Elf5 overexpression inhibits TGFβ induced EMT. (a, c) Different confocal slices through the Z stack image. (b, d) 3D rendering
Chronic Myeloid Leukemia Outlook: The Future of CML Therapy
 Chronic Myeloid Leukemia Outlook: The Future of CML Therapy Neil Shah, MD PhD Edward S. AgenoDistinguished Professor in Hematology/Oncology UCSF School of Medicine San Francisco, California Progression
Supplementary Figure 1. Immune profiles of untreated and PD-1 blockade resistant EGFR and Kras mouse lung tumors (a) Total lung weight of untreated
 Total lung weight of untreated") 1 Supplementary Figure 1. Immune profiles of untreated and PD-1 blockade resistant EGFR and Kras mouse lung tumors (a) Total lung weight of untreated (U) EGFR TL mice (n=7), Kras mice (n=7), PD-1 blockade
1 Supplementary Figure 1. Immune profiles of untreated and PD-1 blockade resistant EGFR and Kras mouse lung tumors (a) Total lung weight of untreated (U) EGFR TL mice (n=7), Kras mice (n=7), PD-1 blockade
Supplementary Figure 1. Nature Neuroscience: doi: /nn.4547
 Supplementary Figure 1 Characterization of the Microfetti mouse model. (a) Gating strategy for 8-color flow analysis of peripheral Ly-6C + monocytes from Microfetti mice 5-7 days after TAM treatment. Living
Fluorochrome Panel 1 Panel 2 Panel 3 Panel 4 Panel 5 CTLA-4 CTLA-4 CD15 CD3 FITC. Bio) PD-1 (MIH4, BD) ICOS (C398.4A, Biolegend) PD-L1 (MIH1, BD)
 PD-1 (MIH4, BD) ICOS (C398.4A, Biolegend) PD-L1 (MIH1, BD)") Additional file : Table S. Antibodies used for panel stain to identify peripheral immune cell subsets. Panel : PD- signaling; Panel : CD + T cells, CD + T cells, B cells; Panel : Tregs; Panel :, -T, cdc,
Additional file : Table S. Antibodies used for panel stain to identify peripheral immune cell subsets. Panel : PD- signaling; Panel : CD + T cells, CD + T cells, B cells; Panel : Tregs; Panel :, -T, cdc,
SUPPLEMENTARY INFORMATION. Divergent TLR7/9 signaling and type I interferon production distinguish
 SUPPLEMENTARY INFOATION Divergent TLR7/9 signaling and type I interferon production distinguish pathogenic and non-pathogenic AIDS-virus infections Judith N. Mandl, Ashley P. Barry, Thomas H. Vanderford,
RASA: Robust Alternative Splicing Analysis for Human Transcriptome Arrays
 Supplementary Materials RASA: Robust Alternative Splicing Analysis for Human Transcriptome Arrays Junhee Seok 1*, Weihong Xu 2, Ronald W. Davis 2, Wenzhong Xiao 2,3* 1 School of Electrical Engineering,
Hematopathology Case Study
 Hematopathology Case Study AMP Outreach Course 2009 AMP Annual Meeting John Greg Howe Ph.D. Department of Laboratory Medicine Yale University School of Medicine November 19, 2009 HISTORY Case History An
Nature Neuroscience: doi: /nn Supplementary Figure 1
 Supplementary Figure 1 Illustration of the working of network-based SVM to confidently predict a new (and now confirmed) ASD gene. Gene CTNND2 s brain network neighborhood that enabled its prediction by
Nature Medicine: doi: /nm.4439
 Figure S1. Overview of the variant calling and verification process. This figure expands on Fig. 1c with details of verified variants identification in 547 additional validation samples. Somatic variants
Transduction of lentivirus to human primary CD4+ T cells
 Transduction of lentivirus to human primary CD4 + T cells Human primary CD4 T cells were stimulated with anti-cd3/cd28 antibodies (10 µl/2 5 10^6 cells of Dynabeads CD3/CD28 T cell expander, Invitrogen)
Molecular Markers. Marcie Riches, MD, MS Associate Professor University of North Carolina Scientific Director, Infection and Immune Reconstitution WC
 Molecular Markers Marcie Riches, MD, MS Associate Professor University of North Carolina Scientific Director, Infection and Immune Reconstitution WC Overview Testing methods Rationale for molecular testing
Molecular Profiling of Tumor Microenvironment Alex Chenchik, Ph.D. Cellecta, Inc.
 Molecular Profiling of Tumor Microenvironment Alex Chenchik, Ph.D. Cellecta, Inc. Cellecta, Inc. Founded: April 2006 Headquarters: Mountain View, CA 12 SBIR Grants Custom Service Provider for Functional
Single-strand DNA library preparation improves sequencing of formalin-fixed and paraffin-embedded (FFPE) cancer DNA
 cancer DNA") www.impactjournals.com/oncotarget/ Oncotarget, Supplementary Materials 2016 Single-strand DNA library preparation improves sequencing of formalin-fixed and paraffin-embedded (FFPE) DNA Supplementary Materials
www.impactjournals.com/oncotarget/ Oncotarget, Supplementary Materials 2016 Single-strand DNA library preparation improves sequencing of formalin-fixed and paraffin-embedded (FFPE) DNA Supplementary Materials
York criteria, 6 RA patients and 10 age- and gender-matched healthy controls (HCs).
.") MATERIALS AND METHODS Study population Blood samples were obtained from 15 patients with AS fulfilling the modified New York criteria, 6 RA patients and 10 age- and gender-matched healthy controls (HCs).
MATERIALS AND METHODS Study population Blood samples were obtained from 15 patients with AS fulfilling the modified New York criteria, 6 RA patients and 10 age- and gender-matched healthy controls (HCs).
Online Appendix Material and Methods: Pancreatic RNA isolation and quantitative real-time (q)rt-pcr. Mice were fasted overnight and killed 1 hour (h)
rt-pcr. Mice were fasted overnight and killed 1 hour (h)") Online Appendix Material and Methods: Pancreatic RNA isolation and quantitative real-time (q)rt-pcr. Mice were fasted overnight and killed 1 hour (h) after feeding. A small slice (~5-1 mm 3 ) was taken
Online Appendix Material and Methods: Pancreatic RNA isolation and quantitative real-time (q)rt-pcr. Mice were fasted overnight and killed 1 hour (h) after feeding. A small slice (~5-1 mm 3 ) was taken
Supplementary Materials for
 www.sciencemag.org/content/348/6241/aaa825/suppl/dc1 Supplementary Materials for A mucosal vaccine against Chlamydia trachomatis generates two waves of protective memory T cells Georg Stary,* Andrew Olive,
A complete next-generation sequencing workfl ow for circulating cell-free DNA isolation and analysis
 APPLICATION NOTE Cell-Free DNA Isolation Kit A complete next-generation sequencing workfl ow for circulating cell-free DNA isolation and analysis Abstract Circulating cell-free DNA (cfdna) has been shown
Nature Genetics: doi: /ng Supplementary Figure 1. Clinical timeline for the discovery WES cases.
 Supplementary Figure 1 Clinical timeline for the discovery WES cases. This illustrates the timeline of the disease events during the clinical course of each patient s disease, further indicating the available
Supplementary Figure 1. Gating strategy for leukemic blasts and normal developing B
 Supplementary Information Supplementary Figure 1. Gating strategy for leukemic blasts and normal developing B cells. (a) Gating strategy for lineage-negative blasts (B + Lin - cells), the starting population
SSM signature genes are highly expressed in residual scar tissues after preoperative radiotherapy of rectal cancer.
 Supplementary Figure 1 SSM signature genes are highly expressed in residual scar tissues after preoperative radiotherapy of rectal cancer. Scatter plots comparing expression profiles of matched pretreatment
qpcr-array Analysis Service
 qpcr-array Analysis Service Customer Name Institute Telephone Address E-mail PO Number Service Code Report Date Service Laboratory Department Phalanx Biotech Group, Inc 6 Floor, No.6, Technology Road 5,