SUPPLEMENTARY INFORMATION
|
|
|
- James Preston
- 5 years ago
- Views:
Transcription

1 DOI: /ncb3076 Supplementary Figure 1 btrcp targets Cep68 for degradation during mitosis. a) Cep68 immunofluorescence in interphase and metaphase. U-2OS cells were transfected with control sirna or Cep68 sirna and analyzed 48 hours post-transfection. Cells were fixed and analyzed by immunofluorescence using Cep68 antibodies (red) and g-tubulin antibodies (green). The areas in the white boxes are shown at higher magnification directly below the corresponding image. Cep68 is absent from mitotic centrosomes. Depletion of Cep68 by sirna demonstrates that the Cep68 antibody specifically recognizes Cep68. Scale bars represent 1 µm. b) Cep68 levels during a release from prometaphase. HeLa cells stably expressing FLAG-HA-Cep68 were synchronized in prometaphase with nocodazole. Round, prometaphase cells were collected by mitotic shake-off and released into fresh media. Cells were collected at the indicated times and lysed for immunoblotting as indicated. c) Cep68 degradation is mediated by btrcp. HeLa cells stably expressing FLAG-HA-Cep68 were transfected with btrcp sirna. Cells were synchronized by double-thymidine arrest and released into fresh media for the indicated times, before processing as in Figure 1a. d) Multidimensional Protein Identification Technology analysis of a FLAG-Cep68 immunopurification from HEK293T cells, listing the number of spectra, peptides, and the dnsaf (distributed normalized spectra abundance factor) for the indicated co-purifying proteins. e) btrcp interacts with Cep68. HEK293T cells were transfected with FLAG-tagged centrosomal proteins (CEPs). Cell lysates were immunoprecipitated with an anti-flag resin, and immunoprecipitates were probed with antibodies to btrcp1. PLK1 and PLK4 are known btrcp-interacting proteins. Asterisks denote expression of FLAG-tagged CEPs. f) Different sirna sequences targeting btrcp prevent the downregulation of Cep68 in prometaphase, while sirna targeting Cdc does not. HeLa cells were transfected with the indicated sirna sequences. Prometaphase cells (PM) were harvested by mitotic shake-off after overnight nocodazole treatment. NS, non-synchronized. Please note that Cdc silencing synchronizes cells in PM, as shown by the phosphorylation state of Cdc27 (see lane 8) Macmillan Publishers Limited. All rights reserved.
 Schematic representation of Cep68 mutants used in mapping experiments. Cep68 mutants found to interact with btrcp or Cep215 are indicated by the symbol (+). -/+ denotes reduced binding.")
2 Supplementary Figure 2 Mapping of the btrcp degron in Cep68 and identification of PLK1 as the kinase phosphorylating Cep68 degron. a) Schematic representation of Cep68 mutants used in mapping experiments. Cep68 mutants found to interact with btrcp or Cep215 are indicated by the symbol (+). -/+ denotes reduced binding. b) Mapping the btrcp binding region in Cep68 with Cep68 truncation mutants. HEK293T cells were transfected with empty vector (EV), FLAG-tagged Cep68, or the indicated FLAG-tagged Cep68 constructs. Whole cell extracts were immunoprecipitated with an anti-flag resin, and immunoprecipitates were immunoblotted with the indicated antibodies. c) Alignment of the btrcp binding motif in Cep68 orthologs and previously reported btrcp substrates. Critical amino acids required for btrcp binding are highlighted in red. d) Ser332 is required for binding to btrcp1. HEK293T cells were transfected with empty vector (EV), FLAG-tagged Cep68, or the indicated FLAG-tagged Cep68 mutants. Cell lysates were immunoprecipitated with an anti-flag resin, and immunoprecipitates were probed with the indicated antibodies. e) PLK1 inhibition prevents Cep68 degradation in prometaphase. HeLa cells expressing FLAG-HA-Cep68 were synchronized by double-thymidine arrest, as in Figure 1b. Where indicated, cells were treated with a PLK1 inhibitor (BI36), an Aurora kinase inhibitor (VX680), or an Eg5 inhibitor (monastrol) for three hours prior to their collection and analysis by immunoblotting. f) PLK1 phosphorylates Cep68 on Ser332 in vitro. Recombinant, purified GST-Cep68, GST-Cep68(S332A), or GST alone were incubated with ATP and increasing amounts of purified PLK1. Proteins were detected by immunoblotting as indicated. g) PLK1 inhibition prevents the in vivo phosphorylation of Cep68 on Ser332. HeLa cells expressing either inducible FLAG-Cep68 or FLAG-Cep68(S332A) were released from a double-thymidine arrest. Seven hours after release, cells were treated with nocodazole and, where indicated, either BI36 (a PLK1 inhibitor) or MLN4924 (a CRL inhibitor). Cells were then harvested at the indicated time points. Cep68 or Cep68(S332A) was immunoprecipitated from cell lysates using an anti-flag resin. Whole cell lysates (WCL) and immunoprecipitates were immunoblotted as indicated. h) Analysis of Cep68 binding to PLK1 following BI36 treatment by Multidimensional Protein Identification Technology. The table lists the total number of spectral counts and the dnsaf values for Cep68 and PLK1 in the untreated and the treated samples Macmillan Publishers Limited. All rights reserved.
, or Cep68(D331-3) were synchronized by a double-thymidine arrest and harvested at the G1/S transition, in G2 phase")
3 Supplementary Figure 3 Cep68 degradation does not promote centrosome separation and bipolar spindle assembly. a) HA-Cep68 is expressed at near to physiological levels. HeLa cells or HeLa cells stably expressing pbabe- HA-tagged Cep68, Cep68(S332A), or Cep68(D331-3) were synchronized by a double-thymidine arrest and harvested at the G1/S transition, in G2 phase (eight hours after release), or in prometaphase (PM). Cell lysates were immunoblotted as shown. b) Bipolar spindles assemble in the presence of Cep68(S332A). Cells expressing inducible FLAG-tagged Cep68 or Cep68(S332A) were fixed and stained with anti-flag and anti-a-tubulin antibodies. Cells in metaphase were analyzed by immunofluorescence. This experiment was reproduced twice. c) Expression of FLAG-Cep68(S332A) does not prevent centrosome separation in early mitosis. Cells expressing inducible FLAG-tagged Cep68 or Cep68(S332A) were fixed and analyzed by immunofluorescence. The percentage of cells with separated centrosomes in prophase or prometaphase was scored. cells were counted for each condition from one experiment. n=cell number. d) Time spent in mitosis for cells expressing Cep68 or Cep68(S332A). Cells expressing inducible FLAG-tagged Cep68 or Cep68(Δ ) were synchronized by double thymidine release. Live cell microscopy was used to calculate time in mitosis (judged from rounded cell morphology). Where indicated, monastrol ( μm) was added to cells eight hours after release. Bars represent mean ± standard deviation (S.D.). n=30 cells per condition. ns=not significant. This experiment was performed once. e) Centrosome disjunction is not inhibited by expression of Cep68(S332A). Cells expressing inducible FLAG- Cep68 or FLAG-Cep68(S332A) were arrested with monopolar spindles in prometaphase with µm monastrol. The distance between g-tubulin foci was measured using Softworx software. Cep68: n=28; Cep68(S332A): n=27. Bars represent mean ± standard deviation (S.D.). ns=not significant Macmillan Publishers Limited. All rights reserved.

4 Supplementary Figure 4 Cep215 levels are reduced at the intercentrosomal linker in Cep68 depleted cells. a) Cep68 depletion results in removal of Cep215 from the intercentrosomal linker in interphase. U-2OS cells were transfected for 72 hours with sirnas targeting Cep68 or a non-targeting control sequence. Cells were fixed and stained with antibodies to g-tubulin (green) and the specified centrosome cohesion factors (red). After Cep68 silencing, only a small amount of Cep215 is observed on interphase centrioles. The graph represents the relative intensity of Cep215 after Cep68 depletion. Bars represent mean ± standard deviation (S.D.). Control sirna: n=10 cells; Cep68 sirna: n=11 cells. ***P= b) Cep68 knockdown does not affect the total levels of Cep215. U-2OS cells were transfected with sirnas targeting Cep68 or Cep215. Seventy-two hours post-transfection, cells were lysed for immunoblotting as indicated Macmillan Publishers Limited. All rights reserved.
-inducible FLAG-tagged Cep68 or Cep68(S332A) were transfected with the indicated sirna sequences.")
5 Supplementary Figure 5 The interaction between Cep215 and Cep68 is not mediated by PCNT. a) Cep68 interacts with Cep215 and PCNT independently. Cells expressing doxycycline (DOX)-inducible FLAG-tagged Cep68 or Cep68(S332A) were transfected with the indicated sirna sequences. Cep68 or Cep68(S332A) were immunoprecipitated from whole cell lysates (WCL) with anti-flag resin, and both immunoprecipitates and WCLs were immunoblotted with the indicated antibodies. Cep215 interacts with Cep68 when PCNT is depleted in interphase and mitosis. Likewise, PCNT interacts with Cep68(S332A) when Cep215 is depleted. AS, asynchronous. PM, prometaphase. The asterisk denotes a non-specific band. b) PCNT and PCNT(R2231A) localization in cytokinesis. HeLa cells were transiently transfected with FLAG-tagged PCNT or PCNT(R2231A). Cells in cytokinesis were stained for immunofluorescence using antibodies recognizing FLAG (red) and CP110 (green). Scale bars represent 1 µm Macmillan Publishers Limited. All rights reserved.
 using conventional microscopy.")
6 Supplementary Figure 6 Cep68 degradation is required for centriole separation after disengagement. Quantification of cells containing 1 c-nap1 dot in cells expressing Cep68(S332A) using conventional microscopy. HeLa cells expressing HA-tagged Cep68 or Cep68(S332A) were synchronized by double-thymidine arrest and allowed to progress into the next G1 phase (15 hours after release). Where indicated, cells were transfected with Cep215 sirna during the first release from doublethymidine arrest. G1 cells were fixed and stained for c-nap1 (green), centrin 2 (red), and Cep68 (a-ha) (blue) to determine their engagement status. The magnification bar represents 1 mm. The areas in the white boxes are shown at higher magnification directly above the corresponding image. The graph shows the quantification of disengagement. G1 cells with 1: 2 ratio of c-nap1:centrin 2 foci were scored as engaged. n cells for each experiment from three independent experiments were analysed. **P Bars represent the mean ± standard deviation (S.D.) from n= three experiments Macmillan Publishers Limited. All rights reserved.

 βtrcp Cep68 15")


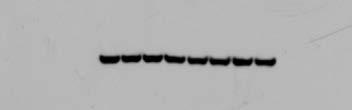
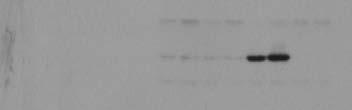
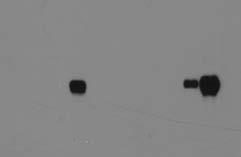
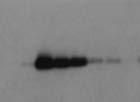
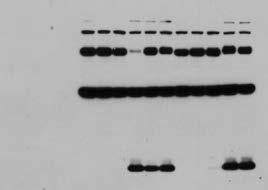
7 Figure 1a Figure 1b Figure 1d Figure 1e Cep68 HA 2 1 (Fbxo11 long exp.) βtrcp Cep68 15 phh3(ser10) γ-tubulin 2 Cep215 βtrcp1 2 Cep215 Skp1 15 phh3(ser10) 2 1 Fbxo11 (βtrcp short exp.) CdcA Fbxo5 Cdc Fbxo FLAG Skp1 Supplementary Figure 7 Scans of immunoblots used in the figures Macmillan Publishers Limited. All rights reserved.
 phh3(ser10) Nek2 FLAG (WCL) βtrcp α-tubulin (WCL) Figure 2b 2 Cep68 (IP) Cep215")
 8 WWW.NATURE.COM/NATURECELLBIOLOGY 14 Macmillan Publishers Limited.")
8 Figure 2a Figure 2c Figure 2d FLAG Cep68 p-cep68(s332a) (IP) γ-tubulin PLK1 FLAG (IP) phh3 (Ser10) phh3(ser10) Nek2 FLAG (WCL) βtrcp α-tubulin (WCL) Figure 2b 2 Cep68 (IP) Cep215 (IP) phh3 (Ser10) Cdc27 (WCL) Centrin 3 (IP) γ-tubulin Cep68 (WCL) 2 Cep215 (WCL) Centrin 3 (WCL) Macmillan Publishers Limited. All rights reserved.
 2 1")
")
 2")
")
 15 PHH3")

9 Figure 5b 1 FLAG (IP) 2 1 Cep215 (IP) 2 PCNT (IP) γ-tubulin(ip) 1 FLAG (WCL) 2 1 Cep215 (WCL) 2 1 PCNT (WCL) γ-tubulin (WCL) 15 PHH3 (Ser10) (WCL) Macmillan Publishers Limited. All rights reserved.

")


10 Figure S1b Figure S1c HA HA γ-tubulin phh3(ser10) phh3(ser10) γ-tubulin βtrcp1 CdcA Figure S1e Figure S1f βtrcp Cep68 CdcA 2 1 βtrcp1 FLAG Cdc Cdc27 Skp Macmillan Publishers Limited. All rights reserved.

 2")

 1")

")

11 Figure S2b Figure S2d Figure S2e βtrcp1 2 1 βtrcp1 HA phh3 (Ser10) 2 Cep215 FLAG 2 1 FLAG Figure S2g Centrin 3 Figure S2f 1 FLAG (IP) 1 p-cep68 (IP) 1 p-cep68 1 FLAG (WCL) α-tubulin 1 GST PHH3(Ser10) Macmillan Publishers Limited. All rights reserved.
 2")
 Cdc27 γ-tubutlin 2 Cep215")
 Cdc27 12 WWW.")

12 Figure S3a Figure S4b Figure S5b 1 Cep68 Cep68 2 Cep215 (IP) 2 Cep215 PCNT (IP) 1 HA 2 PCNT FLAG (IP) Cdc27 γ-tubutlin 2 Cep215 (WCL) PCNT (WCL) α-tubulin γ-tubutlin (WCL) Cdc Macmillan Publishers Limited. All rights reserved.
13 Table 1. Identification of Cep68 phosphorylation sites in vivo by mass spectrometry. Residue and modification Untreated PLK inhibition Surrounding Sequence T106 1/664 0/972 S G L P P A T M G S G D L S109 17/664 17/972 P P A T M G S G D L L L S S126 1/128 3/286 T K L S S S E E F P Q T S136 0/128 4/286 L S S S E E F P Q T L S L P R S186 0/279 1/482 S V L S P G S A A Q P S S C S S249 0/61 8/113 G L G P R P Q W S P Q P V F S G S268 3/ 6/40 R R L S F Q A E Y W A C V L P D Y273 0/ 8/40 R R L S F Q A E Y W A C V L P D S S285 0/ 5/40 C V L P D S L P P S P D R S332 1/147 0/215 Q D S G V D L D S F S V S P A S T S340 0/147 2/215 Q D S G V D L D S F S V S P A S T S342 9/147 12/215 Q D S G V D L D S F S V S P A S T S354 3/3 6/188 S P T N V S P N C P P A E A T S4 0/144 1/89 S G P R E P S L K Q W P S R S435 2/419 8/4 H L D M G S P Q L R S472 4/ 2/47 W K S E E E V E S D D E Y L A S478 23/ 32/47 W K S E E E V E S D D E Y L A Table 1 Identification of Cep68 phosphorylation sites in vivo by mass spectrometry. FLAG-tagged Cep68 was immunoprecipitated from HEK293T cells that were either untreated or treated with BI36 (a PLK1 inhibitor) for 16 hours. Note that PLK1 inhibition results in prometaphase arrest. The table lists the number of spectra matching phosphorylated peptides as a fraction of total spectra detected for peptides bearing each residue and their corresponding modification percentage. Ser332 was identified as a phosphorylated residue in untreated cells, but not in cells treated with BI Macmillan Publishers Limited. All rights reserved.
T H E J O U R N A L O F C E L L B I O L O G Y
 T H E J O U R N A L O F C E L L B I O L O G Y Supplemental material Posch et al., http://www.jcb.org/cgi/content/full/jcb.200912046/dc1 Figure S1. Biochemical characterization of the interaction between
SUPPLEMENTARY INFORMATION
 DOI: 1.138/ncb222 / b. WB anti- WB anti- ulin Mitotic index (%) 14 1 6 2 T (h) 32 48-1 1 2 3 4 6-1 4 16 22 28 3 33 e. 6 4 2 Time (min) 1-6- 11-1 > 1 % cells Figure S1 depletion leads to mitotic defects
Supplementary Figure 1. Mother centrioles can reduplicate while in the close association
 C1-GFP distance (nm) C1-GFP distance (nm) a arrested HeLa cell expressing C1-GFP and Plk1TD-RFP -3 s 1 2 3 4 5 6 7 8 9 11 12 13 14 16 17 18 19 2 21 22 23 24 26 27 28 29 3 b 9 8 7 6 5 4 3 2 arrested HeLa
Figure S1. HP1α localizes to centromeres in mitosis and interacts with INCENP. (A&B) HeLa
 HeLa") SUPPLEMENTARY FIGURES Figure S1. HP1α localizes to centromeres in mitosis and interacts with INCENP. (A&B) HeLa tet-on cells that stably express HP1α-CFP, HP1β-CFP, or HP1γ-CFP were monitored with livecell
SUPPLEMENTARY FIGURES Figure S1. HP1α localizes to centromeres in mitosis and interacts with INCENP. (A&B) HeLa tet-on cells that stably express HP1α-CFP, HP1β-CFP, or HP1γ-CFP were monitored with livecell
Supplementary Figure S1
 Supplementary Figure S1 Supplementary Figure S1. PARP localization patterns using GFP-PARP and PARP-specific antibody libraries GFP-PARP localization in non-fixed (A) and formaldehyde fixed (B) GFP-PARPx
Supplementary information. The Light Intermediate Chain 2 Subpopulation of Dynein Regulates Mitotic. Spindle Orientation
 Supplementary information The Light Intermediate Chain 2 Subpopulation of Dynein Regulates Mitotic Spindle Orientation Running title: Dynein LICs distribute mitotic functions. Sagar Mahale a, d, *, Megha
 Supplementary Figure Legends Supplementary Figure S1. Aurora-A is essential for SAC establishment in early mitosis. (a-c) RPE cells were treated with DMSO (a), MLN8237 (b) or BI2536 (c) for Two hours.
Nature Structural and Molecular Biology: doi: /nsmb Supplementary Figure 1
 Supplementary Figure 1 Mutational analysis of the SA2-Scc1 interaction in vitro and in human cells. (a) Autoradiograph (top) and Coomassie stained gel (bottom) of 35 S-labeled Myc-SA2 proteins (input)
T H E J O U R N A L O F C E L L B I O L O G Y
 T H E J O U R N A L O F C E L L B I O L O G Y Supplemental material Krenn et al., http://www.jcb.org/cgi/content/full/jcb.201110013/dc1 Figure S1. Levels of expressed proteins and demonstration that C-terminal
SUPPLEMENTAL FIGURE LEGENDS
 SUPPLEMENTAL FIGURE LEGENDS Supplemental Figure S1: Endogenous interaction between RNF2 and H2AX: Whole cell extracts from 293T were subjected to immunoprecipitation with anti-rnf2 or anti-γ-h2ax antibodies
A. List of selected proteins with high SILAC (H/L) ratios identified in mass
 ratios identified in mass") Supplementary material Figure S1. Interaction between UBL5 and FANCI A. List of selected proteins with high SILAC (H/L) ratios identified in mass spectrometry (MS)-based analysis of UBL5-interacting proteins,
Supplementary material Figure S1. Interaction between UBL5 and FANCI A. List of selected proteins with high SILAC (H/L) ratios identified in mass spectrometry (MS)-based analysis of UBL5-interacting proteins,
Effects of UBL5 knockdown on cell cycle distribution and sister chromatid cohesion
 Supplementary Figure S1. Effects of UBL5 knockdown on cell cycle distribution and sister chromatid cohesion A. Representative examples of flow cytometry profiles of HeLa cells transfected with indicated
SUPPLEMENTARY INFORMATION
 DOI: 10.1038/ncb2988 Supplementary Figure 1 Kif7 L130P encodes a stable protein that does not localize to cilia tips. (a) Immunoblot with KIF7 antibody in cell lysates of wild-type, Kif7 L130P and Kif7
Supplementary Figure 1.TRIM33 binds β-catenin in the nucleus. a & b, Co-IP of endogenous TRIM33 with β-catenin in HT-29 cells (a) and HEK 293T cells
 and HEK 293T cells") Supplementary Figure 1.TRIM33 binds β-catenin in the nucleus. a & b, Co-IP of endogenous TRIM33 with β-catenin in HT-29 cells (a) and HEK 293T cells (b). TRIM33 was immunoprecipitated, and the amount of
Supplementary Figure 1.TRIM33 binds β-catenin in the nucleus. a & b, Co-IP of endogenous TRIM33 with β-catenin in HT-29 cells (a) and HEK 293T cells (b). TRIM33 was immunoprecipitated, and the amount of
Supplementary figures
 Supplementary figures Supplementary Figure 1. B cells stimulated with pokeweed mitogen display normal mitotic figures but not cells infected with B95-8. The figures show cells stimulated with pokeweed
a" b" 2N c" d" e" f" !!Aurora!A!!!CP110!
 DLD1/Reference a" 2N 2N 2N/DLD1 2N/ /DLD1 c" d" e" f" TargetID 2N.AVG_Sig 2N.Det Pval.AVG_Sig.Det Pval Diff Pval DiffScore SYMBOL ILMN_26396 18.35238 0.0080058 44.81118 0.0021834 0.000323 34.90542 KRTHA4
SUPPLEMENTARY INFORMATION
 SUPPLEENTRY INFORTION DOI: 1.138/ncb2577 Early Telophase Late Telophase B icrotubules within the ICB (percent of total cells in telophase) D G ultinucleate cells (% total) 8 6 4 2 2 15 1 5 T without gaps
(a) Schematic diagram of the FS mutation of UVRAG in exon 8 containing the highly instable
 Schematic diagram of the FS mutation of UVRAG in exon 8 containing the highly instable") Supplementary Figure 1. Frameshift (FS) mutation in UVRAG. (a) Schematic diagram of the FS mutation of UVRAG in exon 8 containing the highly instable A 10 DNA repeat, generating a premature stop codon
Supplementary Figure 1. Frameshift (FS) mutation in UVRAG. (a) Schematic diagram of the FS mutation of UVRAG in exon 8 containing the highly instable A 10 DNA repeat, generating a premature stop codon
Supporting Information
 Supporting Information ou et al..73/pnas.08791112 dd Thymidine Release & transfection dd Thymidine Release dd MG132 Fix and IF -14 h 0 h 8 h 24 h 34 h 36 h siontrol simps1-1 simps1-1 simps1-1 simps1-2
SUPPLEMENTARY INFORMATION
 DOI: 10.1038/ncb2566 Figure S1 CDKL5 protein expression pattern and localization in mouse brain. (a) Multiple-tissue western blot from a postnatal day (P) 21 mouse probed with an antibody against CDKL5.
Supplementary Materials
 Supplementary Materials Supplementary Figure S1 Regulation of Ubl4A stability by its assembly partner A, The translation rate of Ubl4A is not affected in the absence of Bag6. Control, Bag6 and Ubl4A CRISPR
klp-18 (RNAi) Control. supplementary information. starting strain: AV335 [emb-27(g48); GFP::histone; GFP::tubulin] bleach
![klp-18 (RNAi) Control. supplementary information. starting strain: AV335 [emb-27(g48); GFP::histone; GFP::tubulin] bleach](/thumbs/91/104639484.jpg "klp-18 (RNAi) Control. supplementary information. starting strain: AV335 [emb-27(g48); GFP::histone; GFP::tubulin] bleach") DOI: 10.1038/ncb1891 A. starting strain: AV335 [emb-27(g48); GFP::histone; GFP::tubulin] bleach embryos let hatch overnight transfer to RNAi plates; incubate 5 days at 15 C RNAi food L1 worms adult worms
DOI: 10.1038/ncb1891 A. starting strain: AV335 [emb-27(g48); GFP::histone; GFP::tubulin] bleach embryos let hatch overnight transfer to RNAi plates; incubate 5 days at 15 C RNAi food L1 worms adult worms
Supplementary Figure 1. Normal T lymphocyte populations in Dapk -/- mice. (a) Normal thymic development in Dapk -/- mice. Thymocytes from WT and Dapk
 Normal thymic development in Dapk -/- mice. Thymocytes from WT and Dapk") Supplementary Figure 1. Normal T lymphocyte populations in Dapk -/- mice. (a) Normal thymic development in Dapk -/- mice. Thymocytes from WT and Dapk -/- mice were stained for expression of CD4 and CD8.
Supplementary Figure 1. Normal T lymphocyte populations in Dapk -/- mice. (a) Normal thymic development in Dapk -/- mice. Thymocytes from WT and Dapk -/- mice were stained for expression of CD4 and CD8.
RAW264.7 cells stably expressing control shrna (Con) or GSK3b-specific shrna (sh-
 or GSK3b-specific shrna (sh-") 1 a b Supplementary Figure 1. Effects of GSK3b knockdown on poly I:C-induced cytokine production. RAW264.7 cells stably expressing control shrna (Con) or GSK3b-specific shrna (sh- GSK3b) were stimulated
1 a b Supplementary Figure 1. Effects of GSK3b knockdown on poly I:C-induced cytokine production. RAW264.7 cells stably expressing control shrna (Con) or GSK3b-specific shrna (sh- GSK3b) were stimulated
 a Control IgG Intestine c Testis b Thymus 1 3 2 S S 2 1 3 4 4 Figure S1 The wild-type mouse (C57BL/6J) organs (intestine, thymus and testis) were frozen in liquid nitrogen and sectioned at 5 µm on a cryostat.
Supplementary Figure 1
 Supplementary Figure 1 a γ-h2ax MDC1 RNF8 FK2 BRCA1 U2OS Cells sgrna-1 ** 60 sgrna 40 20 0 % positive Cells (>5 foci per cell) b ** 80 sgrna sgrna γ-h2ax MDC1 γ-h2ax RNF8 FK2 MDC1 BRCA1 RNF8 FK2 BRCA1
Supplemental Materials. STK16 regulates actin dynamics to control Golgi organization and cell cycle
 Supplemental Materials STK16 regulates actin dynamics to control Golgi organization and cell cycle Juanjuan Liu 1,2,3, Xingxing Yang 1,3, Binhua Li 1, Junjun Wang 1,2, Wenchao Wang 1, Jing Liu 1, Qingsong
Supplementary Figure 1. The CagA-dependent wound healing or transwell migration of gastric cancer cell. AGS cells transfected with vector control or
 Supplementary Figure 1. The CagA-dependent wound healing or transwell migration of gastric cancer cell. AGS cells transfected with vector control or 3xflag-CagA expression vector were wounded using a pipette
Supplementary Materials for
 www.sciencesignaling.org/cgi/content/full/10/471/eaah5085/dc1 Supplementary Materials for Phosphorylation of the exocyst protein Exo84 by TBK1 promotes insulin-stimulated GLUT4 trafficking Maeran Uhm,
SUPPLEMENTARY INFORMATION
 Supplementary Discussion The cell cycle machinery and the DNA damage response network are highly interconnected and co-regulated in assuring faithful duplication and partition of genetic materials into
Identification of non-ser/thr-pro consensus motifs for Cdk1 and their roles in mitotic regulation of C2H2 zinc finger proteins and Ect2
 SUPPLEMENTARY INFORMATION Identification of non-ser/thr-pro consensus motifs for Cdk1 and their roles in mitotic regulation of C2H2 zinc finger proteins and Ect2 Kazuhiro Suzuki, Kosuke Sako, Kazuhiro
Supplementary table 1
 Supplementary table 1 S. pombe strain list Fig. 1A JX38 h + ade6-m216 nda3-km311 PX476 PW775 PX545 PX546 h- ade6-m216 sgo2::ura4 + nda3-km311 h 9 mad2::ura4 + nda3-km311 h + ade6-m21 nda3-km311 rad21 +
supplementary information
 DOI: 1.138/ncb1 Control Atg7 / NAC 1 1 1 1 (mm) Control Atg7 / NAC 1 1 1 1 (mm) Lamin B Gstm1 Figure S1 Neither the translocation of into the nucleus nor the induction of antioxidant proteins in autophagydeficient
Supplementary Figure 1. Characterization of NMuMG-ErbB2 and NIC breast cancer cells expressing shrnas targeting LPP. NMuMG-ErbB2 cells (a) and NIC
 and NIC") Supplementary Figure 1. Characterization of NMuMG-ErbB2 and NIC breast cancer cells expressing shrnas targeting LPP. NMuMG-ErbB2 cells (a) and NIC cells (b) were engineered to stably express either a LucA-shRNA
Supplementary Figure 1. Characterization of NMuMG-ErbB2 and NIC breast cancer cells expressing shrnas targeting LPP. NMuMG-ErbB2 cells (a) and NIC cells (b) were engineered to stably express either a LucA-shRNA
TRAF6 ubiquitinates TGFβ type I receptor to promote its cleavage and nuclear translocation in cancer
 Supplementary Information TRAF6 ubiquitinates TGFβ type I receptor to promote its cleavage and nuclear translocation in cancer Yabing Mu, Reshma Sundar, Noopur Thakur, Maria Ekman, Shyam Kumar Gudey, Mariya
William C. Comb, Jessica E. Hutti, Patricia Cogswell, Lewis C. Cantley, and Albert S. Baldwin
 Molecular Cell, Volume 45 Supplemental Information p85 SH2 Domain Phosphorylation by IKK Promotes Feedback Inhibition of PI3K and Akt in Response to Cellular Starvation William C. Comb, Jessica E. Hutti,
supplementary information
 DOI: 10.1038/ncb1875 Figure S1 (a) The 79 surgical specimens from NSCLC patients were analysed by immunohistochemistry with an anti-p53 antibody and control serum (data not shown). The normal bronchi served
T H E J O U R N A L O F C E L L B I O L O G Y
 Supplemental material Jewell et al., http://www.jcb.org/cgi/content/full/jcb.201007176/dc1 T H E J O U R N A L O F C E L L B I O L O G Y Figure S1. IR Munc18c association is independent of IRS-1. (A and
Supplementary Figure 1. PD-L1 is glycosylated in cancer cells. (a) Western blot analysis of PD-L1 in breast cancer cells. (b) Western blot analysis
 Western blot analysis of PD-L1 in breast cancer cells. (b) Western blot analysis") Supplementary Figure 1. PD-L1 is glycosylated in cancer cells. (a) Western blot analysis of PD-L1 in breast cancer cells. (b) Western blot analysis of PD-L1 in ovarian cancer cells. (c) Western blot analysis
Supplementary Figure 1. PD-L1 is glycosylated in cancer cells. (a) Western blot analysis of PD-L1 in breast cancer cells. (b) Western blot analysis of PD-L1 in ovarian cancer cells. (c) Western blot analysis
SUPPLEMENTARY INFORMATION
 Supplementary Table 1. Cell sphingolipids and S1P bound to endogenous TRAF2. Sphingolipid Cell pmol/mg TRAF2 immunoprecipitate pmol/mg Sphingomyelin 4200 ± 250 Not detected Monohexosylceramide 311 ± 18
T H E J O U R N A L O F C E L L B I O L O G Y
 T H E J O U R N A L O F C E L L B I O L O G Y Supplemental material Dunsch et al., http://www.jcb.org/cgi/content/full/jcb.201202112/dc1 Figure S1. Characterization of HMMR and CHICA antibodies. (A) HeLa
Supplementary Figure 1. MAT IIα is Acetylated at Lysine 81.
 IP: Flag a Mascot PTM Modified Mass Error Position Gene Names Score Score Sequence m/z [ppm] 81 MAT2A;AMS2;MATA2 35.6 137.28 _AAVDYQK(ac)VVR_ 595.83-2.28 b Pre-immu After-immu Flag- WT K81R WT K81R / Flag
Prolonged mitotic arrest induces a caspase-dependent DNA damage
 SUPPLEMENTARY INFORMATION Prolonged mitotic arrest induces a caspase-dependent DNA damage response at telomeres that determines cell survival Karolina O. Hain, Didier J. Colin, Shubhra Rastogi, Lindsey
Supplementary Materials for
 www.sciencesignaling.org/cgi/content/full/8/398/rs12/dc1 Supplementary Materials for Quantitative phosphoproteomics reveals new roles for the protein phosphatase PP6 in mitotic cells Scott F. Rusin, Kate
(A) SW480, DLD1, RKO and HCT116 cells were treated with DMSO or XAV939 (5 µm)
 SW480, DLD1, RKO and HCT116 cells were treated with DMSO or XAV939 (5 µm)") Supplementary Figure Legends Figure S1. Tankyrase inhibition suppresses cell proliferation in an axin/β-catenin independent manner. (A) SW480, DLD1, RKO and HCT116 cells were treated with DMSO or XAV939
Supplementary Figure Legends Figure S1. Tankyrase inhibition suppresses cell proliferation in an axin/β-catenin independent manner. (A) SW480, DLD1, RKO and HCT116 cells were treated with DMSO or XAV939
Predictive PP1Ca binding region in BIG3 : 1,228 1,232aa (-KAVSF-) HEK293T cells *** *** *** KPL-3C cells - E E2 treatment time (h)
 HEK293T cells *** *** *** KPL-3C cells - E E2 treatment time (h)") Relative expression ERE-luciferase activity activity (pmole/min) activity (pmole/min) activity (pmole/min) activity (pmole/min) MCF-7 KPL-3C ZR--1 BT-474 T47D HCC15 KPL-1 HBC4 activity (pmole/min) a d
Relative expression ERE-luciferase activity activity (pmole/min) activity (pmole/min) activity (pmole/min) activity (pmole/min) MCF-7 KPL-3C ZR--1 BT-474 T47D HCC15 KPL-1 HBC4 activity (pmole/min) a d
SUPPLEMENTARY INFORMATION
 doi: 10.1038/nature05732 SUPPLEMENTARY INFORMATION Supplemental Data Supplement Figure Legends Figure S1. RIG-I 2CARD undergo robust ubiquitination a, (top) At 48 h posttransfection with a GST, GST-RIG-I-2CARD
WDR62 is associated with the spindle pole and mutated in human microcephaly
 WDR62 is associated with the spindle pole and mutated in human microcephaly Adeline K. Nicholas, Maryam Khurshid, Julie Désir, Ofélia P. Carvalho, James J. Cox, Gemma Thornton, Rizwana Kausar, Muhammad
Supplementary Figure 1. Prevalence of U539C and G540A nucleotide and E172K amino acid substitutions among H9N2 viruses. Full-length H9N2 NS
 Supplementary Figure 1. Prevalence of U539C and G540A nucleotide and E172K amino acid substitutions among H9N2 viruses. Full-length H9N2 NS nucleotide sequences (a, b) or amino acid sequences (c) from
Supplementary Figure 1
 S U P P L E M E N TA R Y I N F O R M AT I O N DOI: 10.1038/ncb2896 Supplementary Figure 1 Supplementary Figure 1. Sequence alignment of TERB1 homologs in vertebrates. M. musculus TERB1 was derived from
File Name: Supplementary Information Description: Supplementary Figures and Supplementary Tables. File Name: Peer Review File Description:
 File Name: Supplementary Information Description: Supplementary Figures and Supplementary Tables File Name: Peer Review File Description: Primer Name Sequence (5'-3') AT ( C) RT-PCR USP21 F 5'-TTCCCATGGCTCCTTCCACATGAT-3'
The subcortical maternal complex controls symmetric division of mouse zygotes by
 The subcortical maternal complex controls symmetric division of mouse zygotes by regulating F-actin dynamics Xing-Jiang Yu 1,2, Zhaohong Yi 1, Zheng Gao 1,2, Dan-dan Qin 1,2, Yanhua Zhai 1, Xue Chen 1,
SUPPLEMENTARY INFORMATION
 SUPPLEMENTARY INFORMATION doi:1.138/nature9814 a A SHARPIN FL B SHARPIN ΔNZF C SHARPIN T38L, F39V b His-SHARPIN FL -1xUb -2xUb -4xUb α-his c Linear 4xUb -SHARPIN FL -SHARPIN TF_LV -SHARPINΔNZF -SHARPIN
p = formed with HCI-001 p = Relative # of blood vessels that formed with HCI-002 Control Bevacizumab + 17AAG Bevacizumab 17AAG
 A.. Relative # of ECs associated with HCI-001 1.4 1.2 1.0 0.8 0.6 0.4 0.2 0.0 ol b p < 0.001 Relative # of blood vessels that formed with HCI-001 1.4 1.2 1.0 0.8 0.6 0.4 0.2 0.0 l b p = 0.002 Control IHC:
Polo-like kinase 1 regulates the stability of the mitotic centromere-associated kinesin in mitosis
 /, Vol. 5, No. 10 Polo-like kinase 1 regulates the stability of the mitotic centromere-associated kinesin in mitosis Mourad Sanhaji 1*, Andreas Ritter 1, Hannah R. Belsham 2, Claire T. Friel 2, Susanne
Tankyrase 1 regulates centrosome function by controlling CPAP stability
 Manuscript EMBOR-2011-35655 Tankyrase 1 regulates centrosome function by controlling CPAP stability Mi Kyung Kim, Charles Dudognon and Susan Smith Corresponding author: Susan Smith, The Skirball Institute
Supplementary Materials for
 www.sciencesignaling.org/cgi/content/full/6/283/ra57/dc1 Supplementary Materials for JNK3 Couples the Neuronal Stress Response to Inhibition of Secretory Trafficking Guang Yang,* Xun Zhou, Jingyan Zhu,
UNC-Duke Biology Course for Residents Fall Cell Cycle Effects of Radiation
 UNC-Duke Biology Course for Residents Fall 2018 1 Cell Cycle: Sequence of changes in a cell starting with the moment the cell is created by cell division, continuing through the doubling of the DNA and
SUPPLEMENTARY INFORMATION
 DOI: 0.038/ncb33 a b c 0 min 6 min 7 min (fixed) DIC -GFP, CenpF 3 µm Nocodazole Single optical plane -GFP, CenpF Max. intensity projection d µm -GFP, CenpF, -GFP CenpF 3-D rendering e f 0 min 4 min 0
Supplementary Figure 1. Procedures for p38 activity imaging in living cells. (a) Schematic model of the p38 activity reporter. The reporter consists
 Schematic model of the p38 activity reporter. The reporter consists") Supplementary Figure 1. Procedures for p38 activity imaging in living cells. (a) Schematic model of the p38 activity reporter. The reporter consists of: (i) the YPet domain (an enhanced YFP); (ii) the
Supplementary Figure 1. Procedures for p38 activity imaging in living cells. (a) Schematic model of the p38 activity reporter. The reporter consists of: (i) the YPet domain (an enhanced YFP); (ii) the
Tel: ; Fax: ;
 Tel.: +98 216 696 9291; Fax: +98 216 696 9291; E-mail: mrasadeghi@pasteur.ac.ir Tel: +98 916 113 7679; Fax: +98 613 333 6380; E-mail: abakhshi_e@ajums.ac.ir A Soluble Chromatin-bound MOI 0 1 5 0 1 5 HDAC2
Type of file: PDF Title of file for HTML: Supplementary Information Description: Supplementary Figures
 Type of file: PDF Title of file for HTML: Supplementary Information Description: Supplementary Figures Type of file: MOV Title of file for HTML: Supplementary Movie 1 Description: NLRP3 is moving along
Supplementary Figure 1 Induction of cellular senescence and isolation of exosome. a to c, Pre-senescent primary normal human diploid fibroblasts
 Supplementary Figure 1 Induction of cellular senescence and isolation of exosome. a to c, Pre-senescent primary normal human diploid fibroblasts (TIG-3 cells) were rendered senescent by either serial passage
T H E J O U R N A L O F C E L L B I O L O G Y
 Supplemental material Chairoungdua et al., http://www.jcb.org/cgi/content/full/jcb.201002049/dc1 T H E J O U R N A L O F C E L L B I O L O G Y Figure S1. Expression of CD9 and CD82 inhibits Wnt/ -catenin
S1a S1b S1c. S1d. S1f S1g S1h SUPPLEMENTARY FIGURE 1. - si sc Il17rd Il17ra bp. rig/s IL-17RD (ng) -100 IL-17RD
 -100 IL-17RD") SUPPLEMENTARY FIGURE 1 0 20 50 80 100 IL-17RD (ng) S1a S1b S1c IL-17RD β-actin kda S1d - si sc Il17rd Il17ra rig/s15-574 - 458-361 bp S1f S1g S1h S1i S1j Supplementary Figure 1. Knockdown of IL-17RD enhances
SUPPLEMENTARY FIGURE 1 0 20 50 80 100 IL-17RD (ng) S1a S1b S1c IL-17RD β-actin kda S1d - si sc Il17rd Il17ra rig/s15-574 - 458-361 bp S1f S1g S1h S1i S1j Supplementary Figure 1. Knockdown of IL-17RD enhances
SUPPLEMENTARY FIGURES
 SUPPLEMENTARY FIGURES Supplementary Figure 1. (A) Left, western blot analysis of ISGylated proteins in Jurkat T cells treated with 1000U ml -1 IFN for 16h (IFN) or left untreated (CONT); right, western
Supplementary Figure 1. Spatial distribution of LRP5 and β-catenin in intact cardiomyocytes. (a) and (b) Immunofluorescence staining of endogenous
 and (b) Immunofluorescence staining of endogenous") Supplementary Figure 1. Spatial distribution of LRP5 and β-catenin in intact cardiomyocytes. (a) and (b) Immunofluorescence staining of endogenous LRP5 in intact adult mouse ventricular myocytes (AMVMs)
Supplementary Figure 1. Spatial distribution of LRP5 and β-catenin in intact cardiomyocytes. (a) and (b) Immunofluorescence staining of endogenous LRP5 in intact adult mouse ventricular myocytes (AMVMs)
SUPPLEMENTARY FIGURES AND TABLE
 SUPPLEMENTARY FIGURES AND TABLE Supplementary Figure S1: Characterization of IRE1α mutants. A. U87-LUC cells were transduced with the lentiviral vector containing the GFP sequence (U87-LUC Tet-ON GFP).
SUPPLEMENTARY INFORMATION
 DOI:.38/ncb2822 a MTC02 FAO cells EEA1 b +/+ MEFs /DAPI -/- MEFs /DAPI -/- MEFs //DAPI c HEK 293 cells WCE N M C P AKT TBC1D7 Lamin A/C EEA1 VDAC d HeLa cells WCE N M C P AKT Lamin A/C EEA1 VDAC Figure
A Hepatocyte Growth Factor Receptor (Met) Insulin Receptor hybrid governs hepatic glucose metabolism SUPPLEMENTARY FIGURES, LEGENDS AND METHODS
 Insulin Receptor hybrid governs hepatic glucose metabolism SUPPLEMENTARY FIGURES, LEGENDS AND METHODS") A Hepatocyte Growth Factor Receptor (Met) Insulin Receptor hybrid governs hepatic glucose metabolism Arlee Fafalios, Jihong Ma, Xinping Tan, John Stoops, Jianhua Luo, Marie C. DeFrances and Reza Zarnegar
A Hepatocyte Growth Factor Receptor (Met) Insulin Receptor hybrid governs hepatic glucose metabolism Arlee Fafalios, Jihong Ma, Xinping Tan, John Stoops, Jianhua Luo, Marie C. DeFrances and Reza Zarnegar
293T cells were transfected with indicated expression vectors and the whole-cell extracts were subjected
 SUPPLEMENTARY INFORMATION Supplementary Figure 1. Formation of a complex between Slo1 and CRL4A CRBN E3 ligase. (a) HEK 293T cells were transfected with indicated expression vectors and the whole-cell
SUPPLEMENTARY INFORMATION
 doi:10.1038/nature10962 Supplementary Figure 1. Expression of AvrAC-FLAG in protoplasts. Total protein extracted from protoplasts described in Fig. 1a was subjected to anti-flag immunoblot to detect AvrAC-FLAG
Supplemental Information. NRF2 Is a Major Target of ARF. in p53-independent Tumor Suppression
 Molecular Cell, Volume 68 Supplemental Information NRF2 Is a Major Target of ARF in p53-independent Tumor Suppression Delin Chen, Omid Tavana, Bo Chu, Luke Erber, Yue Chen, Richard Baer, and Wei Gu Figure
Recruitment of HBO1 Histone Acetylase and Blocks
 Molecular Cell, Volume 44 Supplemental Information JNK1 Phosphorylation of Cdt1 Inhibits Recruitment of HO1 Histone cetylase and locks Replication Licensing in Response to Stress enoit Miotto and Kevin
SUPPLEMENTARY INFORMATION
 Supplementary Figures Supplementary Figure S1. Binding of full-length OGT and deletion mutants to PIP strips (Echelon Biosciences). Supplementary Figure S2. Binding of the OGT (919-1036) fragments with
Supplementary Figure 1
 Supplementary Figure 1 YAP negatively regulates IFN- signaling. (a) Immunoblot analysis of Yap knockdown efficiency with sh-yap (#1 to #4 independent constructs) in Raw264.7 cells. (b) IFN- -Luc and PRDs
SUPPLEMENTARY INFORMATION
 SUPPLEMENTARY INFORMATION doi:10.1038/nature11429 S1a 6 7 8 9 Nlrc4 allele S1b Nlrc4 +/+ Nlrc4 +/F Nlrc4 F/F 9 Targeting construct 422 bp 273 bp FRT-neo-gb-PGK-FRT 3x.STOP S1c Nlrc4 +/+ Nlrc4 F/F casp1
Yan Ma 1.,XiYuan 1., William R. Wyatt 2, Joseph R. Pomerening 1 * Abstract. Introduction
 Expression of Constitutively Active CDK1 Stabilizes APC- Cdh1 Substrates and Potentiates Premature Spindle Assembly and Checkpoint Function in G1 Cells Yan Ma 1.,XiYuan 1., William R. Wyatt 2, Joseph R.
Relative Rates. SUM159 CB- 839-Resistant *** n.s Intracellular % Labeled by U- 13 C-Asn 0.
 A Relative Growth Rates 1.2 1.8.6.4.2 B Relative Rates 1.6 1.4 1.2 1.8.6.4.2 LPS2 Parental LPS2 Q-Independent SUM159 Parental SUM159 CB-839-Resistant LPS2 Parental LPS2 Q- Independent SUM159 Parental SUM159
Dramatic increase in SHP2 binding activity of Helicobacter. pylori Western CagA by EPIYA-C duplication: its
 Supplementary Information Dramatic increase in SHP2 binding activity of Helicobacter pylori Western CagA by EPIYA-C duplication: its implications in gastric carcinogenesis Lisa Nagase, Takeru Hayashi,
The clathrin adaptor Numb regulates intestinal cholesterol. absorption through dynamic interaction with NPC1L1
 The clathrin adaptor Numb regulates intestinal cholesterol absorption through dynamic interaction with NPC1L1 Pei-Shan Li 1, Zhen-Yan Fu 1,2, Ying-Yu Zhang 1, Jin-Hui Zhang 1, Chen-Qi Xu 1, Yi-Tong Ma
Interleukin-6 promotes pancreatic cancer cell migration by rapidly activating the small GTPase CDC42
 Interleukin-6 promotes pancreatic cancer cell migration by rapidly activating the small GTPase CDC42 Gina L. Razidlo, Kevin M. Burton, and Mark A. McNiven SUPPORTING INFORMATION Figure S1. IL-6 promotes
Supplementary Fig. 1. GPRC5A post-transcriptionally down-regulates EGFR expression. (a) Plot of the changes in steady state mrna levels versus
 Plot of the changes in steady state mrna levels versus") Supplementary Fig. 1. GPRC5A post-transcriptionally down-regulates EGFR expression. (a) Plot of the changes in steady state mrna levels versus changes in corresponding proteins between wild type and Gprc5a-/-
Supplementary Fig. 1. GPRC5A post-transcriptionally down-regulates EGFR expression. (a) Plot of the changes in steady state mrna levels versus changes in corresponding proteins between wild type and Gprc5a-/-
Cell Cycle, Mitosis, and Microtubules. LS1A Final Exam Review Friday 1/12/07. Processes occurring during cell cycle
 Cell Cycle, Mitosis, and Microtubules LS1A Final Exam Review Friday 1/12/07 Processes occurring during cell cycle Replicate chromosomes Segregate chromosomes Cell divides Cell grows Cell Growth 1 The standard
Supplementary Figure 1. Confocal immunofluorescence showing mitochondrial translocation of Drp1. Cardiomyocytes treated with H 2 O 2 were prestained
 Supplementary Figure 1. Confocal immunofluorescence showing mitochondrial translocation of Drp1. Cardiomyocytes treated with H 2 O 2 were prestained with MitoTracker (red), then were immunostained with
A. Generation and characterization of Ras-expressing autophagycompetent
 Supplemental Material Supplemental Figure Legends Fig. S1 A. Generation and characterization of Ras-expressing autophagycompetent and -deficient cell lines. HA-tagged H-ras V12 was stably expressed in
p47 negatively regulates IKK activation by inducing the lysosomal degradation of polyubiquitinated NEMO
 Supplementary Information p47 negatively regulates IKK activation by inducing the lysosomal degradation of polyubiquitinated NEMO Yuri Shibata, Masaaki Oyama, Hiroko Kozuka-Hata, Xiao Han, Yuetsu Tanaka,
scientificreport The PITSLRE/CDK11 p58 protein kinase promotes centrosome maturation and bipolar spindle formation scientific report
 scientificreport The PITSLRE/ p58 protein kinase promotes centrosome maturation and bipolar spindle formation Clotilde Petretti 1, Matthew Savoian 2, Emilie Montembault 1,DavidM.Glover 2,ClaudePrigent
Phosphorylation of Mcl-1 by CDK1 cyclin B1 initiates its Cdc20-dependent destruction during mitotic arrest
 The EMO Journal (2010) 29, 2407 2420 & 2010 European Molecular iology Organization ll Rights Reserved 0261-4189/10 www.embojournal.org Phosphorylation of by cyclin 1 initiates its Cdc20-dependent destruction
Supplementary information. MARCH8 inhibits HIV-1 infection by reducing virion incorporation of envelope glycoproteins
 Supplementary information inhibits HIV-1 infection by reducing virion incorporation of envelope glycoproteins Takuya Tada, Yanzhao Zhang, Takayoshi Koyama, Minoru Tobiume, Yasuko Tsunetsugu-Yokota, Shoji
Supplementary information
 Supplementary information Human Cytomegalovirus MicroRNA mir-us4-1 Inhibits CD8 + T Cell Response by Targeting ERAP1 Sungchul Kim, Sanghyun Lee, Jinwook Shin, Youngkyun Kim, Irini Evnouchidou, Donghyun
Supplemental Figures
 Supplemental Figures Supplemental Figure 1. Fasting-dependent regulation of the SREBP ortholog SBP-1 and lipid homeostasis mediated by the SIRT1 ortholog SIR-2.1 in C. elegans. (A) Wild-type or sir-2.1(lof)
SUPPLEMENTARY INFORMATION
 doi:10.1038/nature12652 Supplementary Figure 1. PRDM16 interacts with endogenous EHMT1 in brown adipocytes. Immunoprecipitation of PRDM16 complex by flag antibody (M2) followed by Western blot analysis
supplementary information
 DOI: 10.1038/ncb2153 Figure S1 Ectopic expression of HAUSP up-regulates REST protein. (a) Immunoblotting showed that ectopic expression of HAUSP increased REST protein levels in ENStemA NPCs. (b) Immunofluorescent
Supplementary Material
 Supplementary Material accompanying the manuscript Interleukin 37 is a fundamental inhibitor of innate immunity Marcel F Nold, Claudia A Nold-Petry, Jarod A Zepp, Brent E Palmer, Philip Bufler & Charles
Supplementary Figure S1. Venn diagram analysis of mrna microarray data and mirna target analysis. (a) Western blot analysis of T lymphoblasts (CLS)
 Western blot analysis of T lymphoblasts (CLS)") Supplementary Figure S1. Venn diagram analysis of mrna microarray data and mirna target analysis. (a) Western blot analysis of T lymphoblasts (CLS) and their exosomes (EXO) in resting (REST) and activated
Supplementary Figure S1. Venn diagram analysis of mrna microarray data and mirna target analysis. (a) Western blot analysis of T lymphoblasts (CLS) and their exosomes (EXO) in resting (REST) and activated
Nature Immunology: doi: /ni Supplementary Figure 1. IC261 inhibits a virus-induced type I interferon response.
 Supplementary Figure 1 IC261 inhibits a virus-induced type I interferon response. (a) HEK293T cells were cultured in 384 wells and transiently transfected with 50 ng of the IFN-β promoter-luc construct
hexahistidine tagged GRP78 devoid of the KDEL motif (GRP78-His) on SDS-PAGE. This
 on SDS-PAGE. This") SUPPLEMENTAL FIGURE LEGEND Fig. S1. Generation and characterization of. (A) Coomassie staining of soluble hexahistidine tagged GRP78 devoid of the KDEL motif (GRP78-His) on SDS-PAGE. This protein was expressed
SUPPLEMENTAL FIGURE LEGEND Fig. S1. Generation and characterization of. (A) Coomassie staining of soluble hexahistidine tagged GRP78 devoid of the KDEL motif (GRP78-His) on SDS-PAGE. This protein was expressed
University of Bristol - Explore Bristol Research
 Shandilya, J., Medler, K., & Roberts, S. G. E. (2016). Regulation of AURORA B function by mitotic checkpoint protein MAD2. Cell Cycle, 15(16), 2196-2201. https://doi.org/10.1080/15384101.2016.1200773 Peer
EMBO. BubR1 acetylation at prometaphase is required for modulating APC/C activity and timing of mitosis EMBO. open
 The EMO Journal (2009) 28, 20772089 & 2009 European Molecular iology Organization Some Rights Reserved 0261-4189/09 www.embojournal.org ubr1 acetylation at prometaphase is required for modulating P/ activity