Supplementary Figure 1 Induction of cellular senescence and isolation of exosome. a to c, Pre-senescent primary normal human diploid fibroblasts
|
|
|
- Rosalyn Clark
- 5 years ago
- Views:
Transcription

 were rendered senescent by either serial passage")
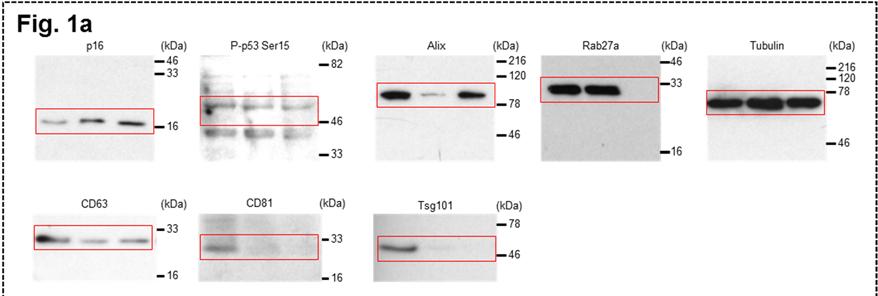
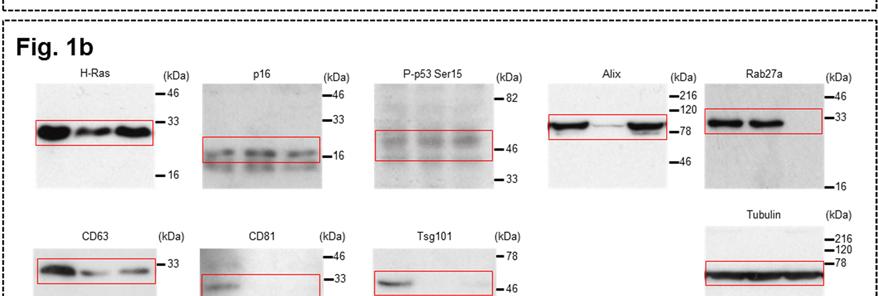
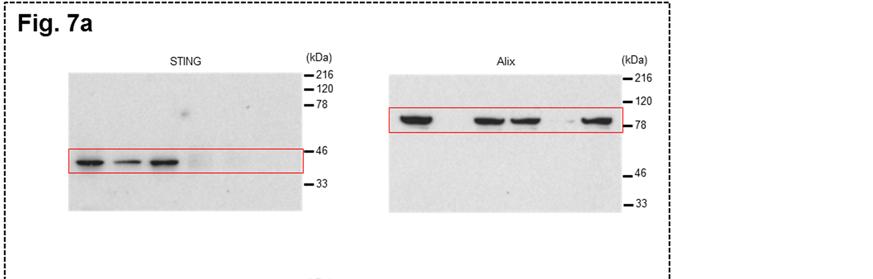
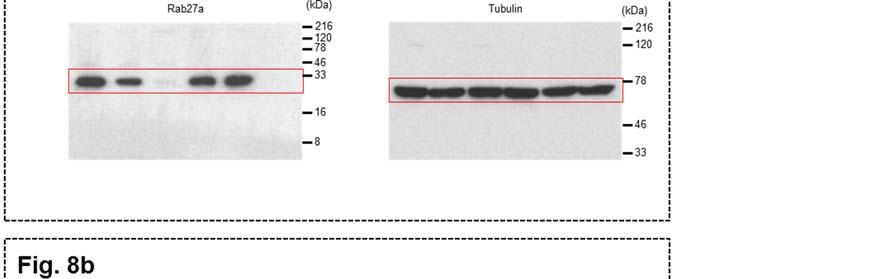
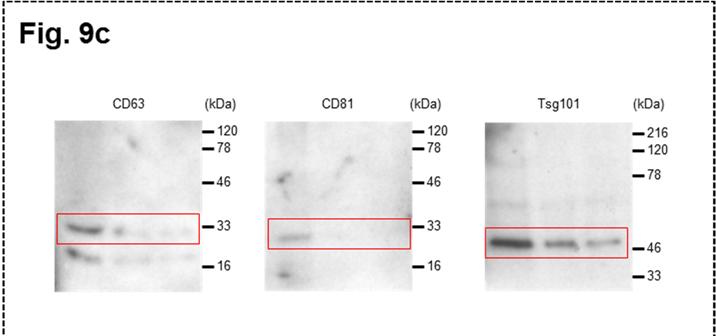
1 Supplementary Figure 1 Induction of cellular senescence and isolation of exosome. a to c, Pre-senescent primary normal human diploid fibroblasts (TIG-3 cells) were rendered senescent by either serial passage (lane 2) or ectopic expression of oncogenic
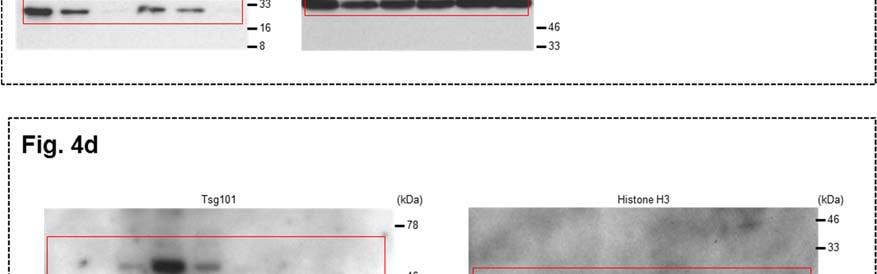
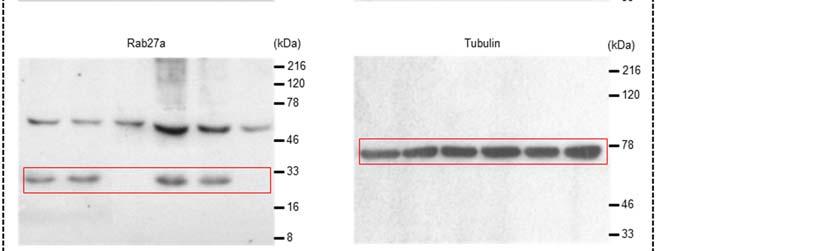
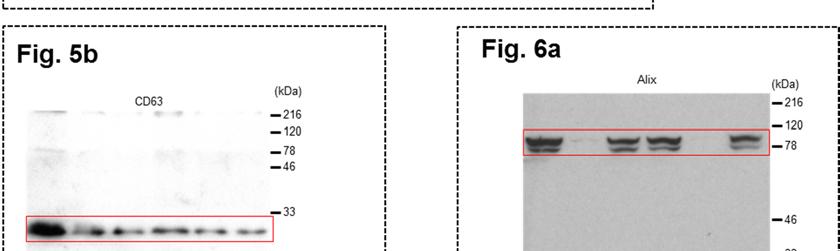
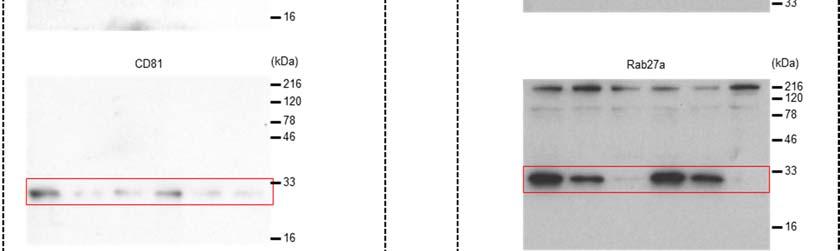
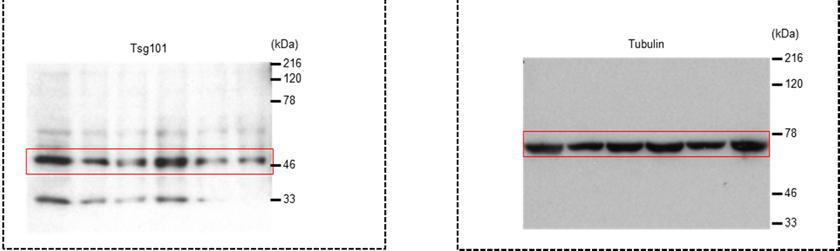
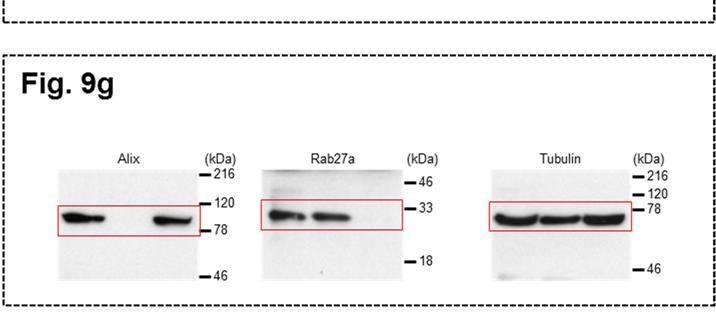
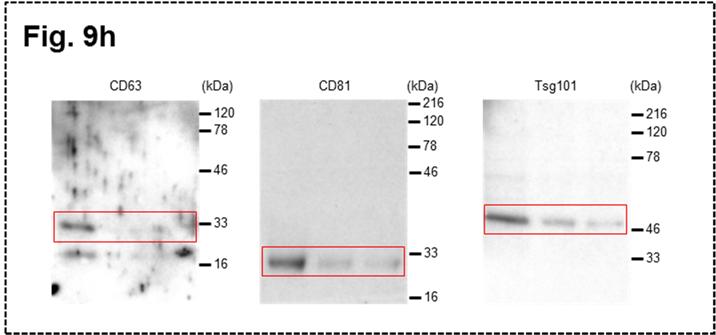
2 ras (lane 4), the most established ways to induce cellular senescence in culture 1-6. These cells were then subjected to western blotting using antibodies shown right (a), qpcr analysis of SASP factor expression (b) or to immunofluorescence staining for markers of DNA damage ( -H2AX [red], phosphor- Ser/Thr ATM/ATR (pst/q) substrate [green] and DAPI [blue]) (c). The histograms indicate the percentage of nuclei that contain more than 3 foci positive for both -H2AX and pst/q staining (c). At least 100 cells were scored per group (c). Tubulin was used as a loading control (a). The representative data from three independent experiments are shown. d to f, Isolated EVs from each cells population were confirmed to be exosomes based on the nanoparticle tracking (NanoSight) analysis (NTA) (d) and immuno-gold labelling for CD63, a well-known exosome-associated protein, followed by transmission electron microscopy (TEM) (e). Note that the same number of EVs from each samples were subjected to NTA (d). Relative amount of exosomes isolated from each cells population were examined by NTA and western blotting using antibodies against canonical exosome markers shown right (f). The representative data from three independent experiments were shown. For all graphs, error bars indicate mean +standard deviation (s.d.) of triplicate measurements. (***P<0.001; one-way ANOVA). (WCL: whole cell lysates).
 or with indicated chemical inhibitors (10 M GW4869; 10 M Spiroepoxide).")
3 Supplementary Figure 2 Inhibition of exosome secretion by chemical inhibitors in pre-senescent HDFs. Pre-senescent TIG-3 cells were treated for 48 h with control vehicle (DMSO) or with indicated chemical inhibitors (10 M GW4869; 10 M Spiroepoxide). These cells were then subjected to NanoSight (NTA) analysis and western blotting using antibodies against canonical exosome markers shown right for quantitative measurement of isolated exosome particles (a), cell proliferation analysis (b), apoptosis analysis at day 2 (c), or to immunofluorescence staining for markers of DNA damage ( -H2AX [red], pst/q [green] and DAPI [blue]) (d). The histograms indicate the percentage of nuclei that contain more than 3 foci positive for both -H2AX and pst/q staining (d). At least 100 cells were scored per group (d). The representative data from three independent experiments are shown. For all graphs, error bars indicate mean +standard deviation (s.d.) of triplicate measurements. (**P<0.01. ***P<0.001; one-way ANOVA).
 cells (a to d) or pre-senescent normal human epidermal keratinocytes (HEK) (e to h) were treated for 48 h with control vehicle")
, cell proliferation analysis (b and f), apoptosis analysis at day 2 (c and")
4 Supplementary Figure 3 Inhibition of exosome secretion in primary normal human epithelial cells. Pre-senescent primary normal human retinal pigment epithelial (HRPE) cells (a to d) or pre-senescent normal human epidermal keratinocytes (HEK) (e to h) were treated for 48 h with control vehicle (DMSO) or with 5 M (HEK) or 10 M (HRPE) of GW4869. These cells were then subjected to NanoSight analysis for quantitative measurement of isolated exosome particles (a and e), cell proliferation analysis (b and f), apoptosis analysis at day 2 (c and g) or to immunofluorescence staining for markers of DNA damage ( -H2AX [red], pst/q [green] and DAPI [blue]) (d and h). The histograms indicate the percentage of nuclei that contain more than 3 foci positive for both -H2AX and pst/q staining (d and h). At least 100 cells were scored per group (d and f). The representative data from three independent experiments are shown. For all graphs, error bars indicate mean +standard deviation (s.d.) of triplicate measurements. (***P<0.001; one-way ANOVA).
5 Supplementary Figure 4 Inhibition of exosome secretion in human cancer cell lines. Human cancer cell lines indicated at the top of the panel were treated for 48 h with control vehicle (DMSO) or with 5 M (for 293T cells) or 10 M (for HeLa cell and U2OS cells) of GW4869. These cells were then subjected to NanoSight analysis for quantitative measurement of isolated exosome particles (a, c and e), or to cell proliferation analysis (b, d and f). The representative data from three independent experiments are shown. For all graphs, error bars indicate mean +standard deviation (s.d.) of triplicate measurements. (***P<0.001; one-way ANOVA).

6 Supplementary Figure 5 Exosome has the potential to provoke the DDR in recipient cells. Pre-senescent TIG-3 cells were treated with increasing amounts of exosomes released from pre-senescent TIG-3 cells for 24h, and then subjected to immunofluorescence staining for markers of DNA damage ( -H2AX [red], pst/q [green] and DAPI [blue]). The representative data from three independent experiments are shown. The histograms indicate the percentage of nuclei that contain more than 3 foci positive for both -H2AX and pst/q staining. Exosome concentrations used are as follows: Lanes 1 (0/ml), 2 (1.125 x 10 7 /ml), 3 (2.25 x 10 7 /ml), 4 (4.5 x 10 7 /ml). At least 100 cells were scored per group. For all graphs, error bars indicate mean +standard deviation (s.d.) of triplicate measurements. (***P<0.001; one-way ANOVA).
7 Supplementary Figure 6 DNA damage provokes cytoplasmic accumulation of nuclear DNA in HDFs. a to e, Pre-senescent TIG-3 cells were treated with control vehicle or 0.25 g/ml of doxorubicin (DXR) for 10 days. These cells were then subjected to immunofluorescence staining for markers of DNA damage ( -H2AX [red], pst/q [green] and DAPI [blue]) (a), NanoSight analysis for quantitative measurement of isolated exosome particles (b), quantitative measurement of isolated exosomal DNA
8 using QuantiFluor dsdna staining system (c), qpcr analysis of IFN gene expression (d) or to qpcr analysis of chromosomal DNA in cytoplasmic fraction (e). The histograms indicate the percentage of nuclei that contain more than 3 foci positive for both -H2AX and pst/q staining (a). At least 100 cells were scored per group (a). The representative data from three independent experiments are shown. f and g, Pre-senescent TIG-3 cells were rendered senescent by either serial passage (late passage) or ectopic expression of oncogenic ras (+H-RasV12). These cells were then subjected to quantitative measurement of isolated exosomal DNA using QuantiFluor dsdna staining (f), or to qpcr analysis of chromosomal DNA in cytoplasmic fraction (g). The representative data from three independent experiments are shown. For all graphs, error bars indicate mean +standard deviation (s.d.) of triplicate measurements. (**P<0.01. ***P<0.001; one-way ANOVA).
9 Supplementary Figure 7 Inhibition of exosome secretion provokes cytoplasmic accumulation of nuclear DNA in HDFs. Exosome secretion was inhibited using indicated sirna oligos (a) or chemicals (b) in pre-senescent TIG-3 cells as described in Fig.2a and Supplementary Fig. 2. These cells were then subjected to isolation of cytoplasmic fraction followed by qpcr analysis of chromosomal DNA. The representative data from three independent experiments are shown. For all graphs, error bars indicate mean +standard deviation (s.d.) of triplicate measurements. (**P<0.01. ***P<0.001; one-way ANOVA).

10 Supplementary Figure 8 Depletion of cgas attenuated the effects of Alix or Rab27a knockdown in HDFs. Pre-senescent TIG-3 cells were transfected with two different sets of validated sirna oligos indicated at the top of the panel for three times at 2 day intervals. These cells were then subjected to western blotting using antibodies shown right (a), cell proliferation analysis (b). The representative data from three independent experiments are shown. For graph, error bars indicate mean +standard deviation (s.d.) of triplicate measurements. (WCL: whole cell lysates).
 were infected with retrovirus encoding shrna against Alix or control three times.")
11 Supplementary Figure 9 Inhibition of exosome secretion in primary MEFs. Early passage primary mouse embryonic fibroblasts (MEFs) were infected with retrovirus encoding shrna against Alix or control three times. After puromycin selection, these cells were then subjected to western blotting using antibodies shown right (a), NanoSight analysis for quantitative measurement of isolated exosome particles and western blotting using antibodies against canonical exosome markers shown right (Exosome) (b), qpcr analysis of IFN gene expression (c) or to immunofluorescence staining for markers of DNA damage ( -H2AX [red], 53BP1 [green] and DAPI [blue]) (d). The representative data from three independent experiments are shown. The histograms indicate the percentage of nuclei that contain more than 3 foci positive for both -H2AX and pst/q staining. At least 100 cells were scored per group. For all graphs, error bars indicate mean +standard deviation (s.d.) of triplicate measurements. (**P<0.01. ***P<0.001; one-way ANOVA).
.")
, followed by immunofluorescence staining for markers of DNA damage ( -H2AX [red], phosphor-ser/thr ATM/ATR (pst/q) substrate [green] and DAPI")
12 Supplementary Figure 10 Inhibition of exosome secretion by knocking down Tsg101, Rab27b or Slp4 in HDFs. Pre-senescent TIG-3 cells were subjected to transfection with indicated sirna oligos twice (at 2day intervals). These cells were then subjected to western blotting using antibodies shown right or to exosome isolation followed by NanoSight analysis (NTA) for quantitative measurement of isolated exosome particles (a, c, e), followed by immunofluorescence staining for markers of DNA damage ( -H2AX [red], phosphor-ser/thr ATM/ATR (pst/q) substrate [green] and DAPI [blue]) (b, d, f). Tubulin was used as a loading control. The representative data from three independent experiments are shown. The histograms indicate the
13 percentage of nuclei that contain more than 3 foci positive for both -H2AX and pst/q staining (b, d, f). At least 100 cells were scored per group (b, d, f). (WCL: whole cell lysates).

14 Supplementary Figure 11 Depletion of Alix does not cause cytokinetic failure in HDFs. Pre-senescent TIG-3 cells were subjected to transfection with indicated sirna oligos twice (at 2day intervals). These cells were then subjected to DAPI staining and multinucleated cells were counted. The representative data from three independent experiments are shown. The histograms indicate the percentage of cells that contain more than 2 nuclei. At least 100 cells were scored per group. For all graphs, error bars indicate mean +standard deviation (s.d.) of triplicate measurements. (n.s. = not significant; one-way ANOVA)
15 Supplementary Figure 12 Inhibition of apoptosis does not have any impact on the appearance of DDR in cells with exosome inhibitors. Pre-senescent TIG-3 cells were treated for 48 h with control vehicle (DMSO), GW4869 (10 M) or Spiroepoxide (10 M) in the presence or absence of 20 M Z-VAD. These cells were then subjected to western blotting using antibodies shown right (a), apoptosis analysis (b), immunofluorescence staining for markers of DNA damage ( -H2AX [red], pst/q [green] and DAPI [blue]) (c). The histograms indicate the percentage of nuclei that contain more than 3 foci positive for both -H2AX and pst/q staining (c). At least 100 cells were scored per group (c). The representative data from three independent experiments are shown. For all graphs, error bars indicate mean +standard deviation (s.d.) of triplicate measurements. (**P<0.01. ***P< n.s. = not significant; one-way ANOVA). (WCL: whole cell lysates).
16 Supplementary Figure 13 Cells in G0 phase are more resistant to inhibition of exosome secretion in HDFs. Asynchronously proliferating TIG-3 cells or TIG-3 cells rendered quiescent (G0 phase) by contact inhibition were transfected with validated sirna oligos indicated at the top of the panel for two times at 2 day intervals. These cells were then subjected to western blotting using antibodies shown right (a), apoptosis analysis (b), immunofluorescence staining for markers of DNA damage ( -H2AX [red], pst/q [green] and DAPI [blue]) (c). The histograms indicate the percentage of nuclei that contain more than 3 foci positive for both -H2AX and pst/q staining (c). At least 100 cells were scored per group (c). The representative data from three independent experiments are shown. For all graphs, error bars indicate mean +standard deviation (s.d.) of triplicate measurements. (***P<0.001; one-way ANOVA). (WCL: whole cell lysates).
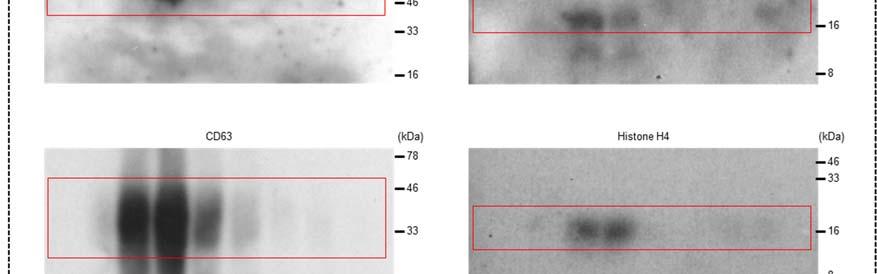
17 Supplementary Figure 14 Exosomal DNAs were bound to histones. Exosome components prepared from pre-senescent TIG-3 cells were subjected to DNA-protein cross-linking followed by immuno-precipitation using antibodies against Histone H3, Histone H4 or control IgG. The presence of indicated genomic DNA fragments in the immuno-precipitated complexes were measured by qpcr. The representative data from three independent experiments are shown. Error bars indicate mean +standard deviation (s.d.) of triplicate measurements. (**P<0.01; one-way ANOVA)

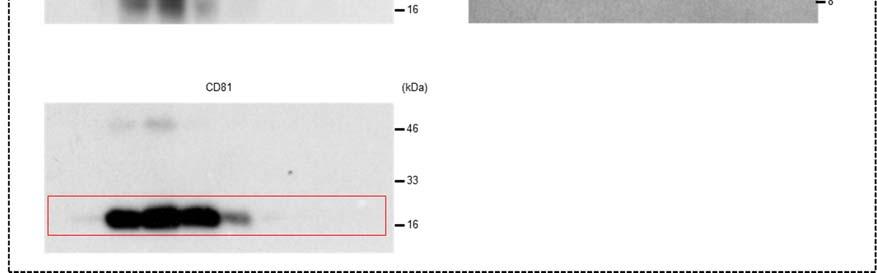
18 Supplementary Figure 15 The original immunoblot images.
19 Supplementary Figure 15 continued.
20 Supplementary Figure 15 continued.
21 Supplementary Figure 15 continued.
22 Supplementary Figure 15 continued.
23 Gene human GAPDH human IL-1 human IL-8 human CXCL10 human IFN- human GRM7 human FGFR2 human GPC6 Adenovirus GFP mouse GAPDH mouse IFN- *Supplementary references Quantitative Real-Time PCR primers Reference Primer No. F 5 -CAACTACATGGTTTACATGTTC-3 5, 42 R 5 -GCCAGTGGACTCCACGAC-3 F 5 -AACCAGTGCTGCTGAAGGA-3 42 R 5 -TTCTTAGTGCCGTGAGTTTCC-3 F 5 -AAGGAAAACTGGGTGCAGAG-3 42 R 5 -ATTGCATCTGGCAACCCTAC-3 F 5 -CCAGAATCGAAGGCCATCAA-3 1* R 5 -CATTTCCTTGCTAACTGCTTTCAG-3 F 5 -AAACTCATGAGCAGTCTGCA-3 66 R 5 -AGGAGATCTTCAGTTTCGGAGG-3 F 5 -TCAAGTGCCACATCCTATGC-3 R 5 -ATTTTTCTAGCCAGGCACCA-3 F 5 -ACCTGGAAATGGCTGAAATG-3 R 5 -AAGTCCTCGCAGAGGTTTCA-3 F 5 -CGCCAGTGTGTGTAGCACTT-3 R 5 -TCGGCCTCTCTCAGTTCTGT-3 F 5 -TTCCCCATGGCTCACAACAC-3 R 5 -TGACGGCTCATGGGCTGGAAGTT-3 F 5 -CAACAGCCACAACGTCTATATCATG-3 2* R 5 -ATGTTGTGGCGGATCTTGAAG-3 F 5 - CAACTACATGGTCTACATGTTC-3 14, 42 R 5 - CGCCAGTAGACTCCACGAC-3 F 5 - CAGCTCCAAGAAAGGACGAAC-3 3* R 5 - GGCAGTGTAACTCTTCTGCAT-3 Supplementary Table 1 List of Quantitative Real-Time PCR primers
24 Supplementary References 1 Khan, S. et al. Differential gene expression of chemokines in KRAS and BRAF mutated colorectal cell lines: role of cytokines. World J. Gastroenterol. 20, (2014). 2 Ghosh, M., Liu, G., Randall, G., Bevington, J. & Leffak, M. Transcription factor binding and induced transcription alter chromosomal c-myc replicator activity. Mol. Cell. Biol. 24, (2004). 3 Turer, E. E. et al. Homeostatic MyD88-dependent signals cause lethal inflammation in the absence of A20. J. Exp. Med. 205, (2008).
SUPPLEMENTARY FIGURES
 SUPPLEMENTARY FIGURES Supplementary Figure 1. (A) Left, western blot analysis of ISGylated proteins in Jurkat T cells treated with 1000U ml -1 IFN for 16h (IFN) or left untreated (CONT); right, western
SUPPLEMENTAL FIGURE LEGENDS
 SUPPLEMENTAL FIGURE LEGENDS Supplemental Figure S1: Endogenous interaction between RNF2 and H2AX: Whole cell extracts from 293T were subjected to immunoprecipitation with anti-rnf2 or anti-γ-h2ax antibodies
Supplementary Figure 1: si-craf but not si-braf sensitizes tumor cells to radiation.
 Supplementary Figure 1: si-craf but not si-braf sensitizes tumor cells to radiation. (a) Embryonic fibroblasts isolated from wildtype (WT), BRAF -/-, or CRAF -/- mice were irradiated (6 Gy) and DNA damage
Supplementary Figure 1
 Supplementary Figure 1 YAP negatively regulates IFN- signaling. (a) Immunoblot analysis of Yap knockdown efficiency with sh-yap (#1 to #4 independent constructs) in Raw264.7 cells. (b) IFN- -Luc and PRDs
Supplementary Figure 1.TRIM33 binds β-catenin in the nucleus. a & b, Co-IP of endogenous TRIM33 with β-catenin in HT-29 cells (a) and HEK 293T cells
 and HEK 293T cells") Supplementary Figure 1.TRIM33 binds β-catenin in the nucleus. a & b, Co-IP of endogenous TRIM33 with β-catenin in HT-29 cells (a) and HEK 293T cells (b). TRIM33 was immunoprecipitated, and the amount of
Supplementary Figure 1.TRIM33 binds β-catenin in the nucleus. a & b, Co-IP of endogenous TRIM33 with β-catenin in HT-29 cells (a) and HEK 293T cells (b). TRIM33 was immunoprecipitated, and the amount of
Supplementary Figure S1: Defective heterochromatin repair in HGPS progeroid cells
 Supplementary Figure S1: Defective heterochromatin repair in HGPS progeroid cells Immunofluorescence staining of H3K9me3 and 53BP1 in PH and HGADFN003 (HG003) cells at 24 h after γ-irradiation. Scale bar,
RAW264.7 cells stably expressing control shrna (Con) or GSK3b-specific shrna (sh-
 or GSK3b-specific shrna (sh-") 1 a b Supplementary Figure 1. Effects of GSK3b knockdown on poly I:C-induced cytokine production. RAW264.7 cells stably expressing control shrna (Con) or GSK3b-specific shrna (sh- GSK3b) were stimulated
1 a b Supplementary Figure 1. Effects of GSK3b knockdown on poly I:C-induced cytokine production. RAW264.7 cells stably expressing control shrna (Con) or GSK3b-specific shrna (sh- GSK3b) were stimulated
Supplementary Figure 1
 Supplementary Figure 1 a γ-h2ax MDC1 RNF8 FK2 BRCA1 U2OS Cells sgrna-1 ** 60 sgrna 40 20 0 % positive Cells (>5 foci per cell) b ** 80 sgrna sgrna γ-h2ax MDC1 γ-h2ax RNF8 FK2 MDC1 BRCA1 RNF8 FK2 BRCA1
Supplementary Figures
 Supplementary Figures Supplementary Figure 1 Characterization of stable expression of GlucB and sshbira in the CT26 cell line (a) Live cell imaging of stable CT26 cells expressing green fluorescent protein
p = formed with HCI-001 p = Relative # of blood vessels that formed with HCI-002 Control Bevacizumab + 17AAG Bevacizumab 17AAG
 A.. Relative # of ECs associated with HCI-001 1.4 1.2 1.0 0.8 0.6 0.4 0.2 0.0 ol b p < 0.001 Relative # of blood vessels that formed with HCI-001 1.4 1.2 1.0 0.8 0.6 0.4 0.2 0.0 l b p = 0.002 Control IHC:
Expanded View Figures
 PEX13 functions in selective autophagy Ming Y Lee et al Expanded View Figures Figure EV1. PEX13 is required for Sindbis virophagy. A, B Quantification of mcherry-capsid puncta per cell (A) and GFP-LC3
(a) Schematic diagram of the FS mutation of UVRAG in exon 8 containing the highly instable
 Schematic diagram of the FS mutation of UVRAG in exon 8 containing the highly instable") Supplementary Figure 1. Frameshift (FS) mutation in UVRAG. (a) Schematic diagram of the FS mutation of UVRAG in exon 8 containing the highly instable A 10 DNA repeat, generating a premature stop codon
Supplementary Figure 1. Frameshift (FS) mutation in UVRAG. (a) Schematic diagram of the FS mutation of UVRAG in exon 8 containing the highly instable A 10 DNA repeat, generating a premature stop codon
Supplementary Figure S1
 Supplementary Figure S1 Supplementary Figure S1. PARP localization patterns using GFP-PARP and PARP-specific antibody libraries GFP-PARP localization in non-fixed (A) and formaldehyde fixed (B) GFP-PARPx
Prolonged mitotic arrest induces a caspase-dependent DNA damage
 SUPPLEMENTARY INFORMATION Prolonged mitotic arrest induces a caspase-dependent DNA damage response at telomeres that determines cell survival Karolina O. Hain, Didier J. Colin, Shubhra Rastogi, Lindsey
Supplementary Figure 1. Effect of cellular glycolysis on tumor cell exosome secretion. A549 cells were cultured in medium containing different
 Supplementary Figure 1. Effect of cellular glycolysis on tumor cell exosome secretion. A549 cells were cultured in medium containing different concentration of glucose (a) or treated the inhibitor of glycolysis
(a) Significant biological processes (upper panel) and disease biomarkers (lower panel)
 Significant biological processes (upper panel) and disease biomarkers (lower panel)") Supplementary Figure 1. Functional enrichment analyses of secretomic proteins. (a) Significant biological processes (upper panel) and disease biomarkers (lower panel) 2 involved by hrab37-mediated secretory
Supplementary Figure 1. Functional enrichment analyses of secretomic proteins. (a) Significant biological processes (upper panel) and disease biomarkers (lower panel) 2 involved by hrab37-mediated secretory
Supplementary Figures
 Supplementary Figures Supplementary Figure 1 DOT1L regulates the expression of epithelial and mesenchymal markers. (a) The expression levels and cellular localizations of EMT markers were confirmed by
Supplemental Figure 1. Western blot analysis indicated that MIF was detected in the fractions of
 Supplemental Figure Legends Supplemental Figure 1. Western blot analysis indicated that was detected in the fractions of plasma membrane and cytosol but not in nuclear fraction isolated from Pkd1 null
Supplementary Figure 1. Normal T lymphocyte populations in Dapk -/- mice. (a) Normal thymic development in Dapk -/- mice. Thymocytes from WT and Dapk
 Normal thymic development in Dapk -/- mice. Thymocytes from WT and Dapk") Supplementary Figure 1. Normal T lymphocyte populations in Dapk -/- mice. (a) Normal thymic development in Dapk -/- mice. Thymocytes from WT and Dapk -/- mice were stained for expression of CD4 and CD8.
Supplementary Figure 1. Normal T lymphocyte populations in Dapk -/- mice. (a) Normal thymic development in Dapk -/- mice. Thymocytes from WT and Dapk -/- mice were stained for expression of CD4 and CD8.
SUPPLEMENTARY INFORMATION
 DOI:.38/ncb3399 a b c d FSP DAPI 5mm mm 5mm 5mm e Correspond to melanoma in-situ Figure a DCT FSP- f MITF mm mm MlanaA melanoma in-situ DCT 5mm FSP- mm mm mm mm mm g melanoma in-situ MITF MlanaA mm mm
Supplementary Information
 Supplementary Information Supplementary Figure 1. EBV-gB 23-431 mainly exists as trimer in HEK 293FT cells. (a) Western blotting analysis for DSS crosslinked FLAG-gB 23-431. HEK 293FT cells transfected
File Name: Supplementary Information Description: Supplementary Figures and Supplementary Tables. File Name: Peer Review File Description:
 File Name: Supplementary Information Description: Supplementary Figures and Supplementary Tables File Name: Peer Review File Description: Primer Name Sequence (5'-3') AT ( C) RT-PCR USP21 F 5'-TTCCCATGGCTCCTTCCACATGAT-3'
SUPPLEMENTARY LEGENDS...
 TABLE OF CONTENTS SUPPLEMENTARY LEGENDS... 2 11 MOVIE S1... 2 FIGURE S1 LEGEND... 3 FIGURE S2 LEGEND... 4 FIGURE S3 LEGEND... 5 FIGURE S4 LEGEND... 6 FIGURE S5 LEGEND... 7 FIGURE S6 LEGEND... 8 FIGURE
Supplementary Information
 Supplementary Information mediates STAT3 activation at retromer-positive structures to promote colitis and colitis-associated carcinogenesis Zhang et al. a b d e g h Rel. Luc. Act. Rel. mrna Rel. mrna
SUPPLEMENTARY INFORMATION
 SUPPLEMENTARY INFORMATION doi:10.1038/nature11429 S1a 6 7 8 9 Nlrc4 allele S1b Nlrc4 +/+ Nlrc4 +/F Nlrc4 F/F 9 Targeting construct 422 bp 273 bp FRT-neo-gb-PGK-FRT 3x.STOP S1c Nlrc4 +/+ Nlrc4 F/F casp1
Supplementary information. The Light Intermediate Chain 2 Subpopulation of Dynein Regulates Mitotic. Spindle Orientation
 Supplementary information The Light Intermediate Chain 2 Subpopulation of Dynein Regulates Mitotic Spindle Orientation Running title: Dynein LICs distribute mitotic functions. Sagar Mahale a, d, *, Megha
Nature Structural and Molecular Biology: doi: /nsmb Supplementary Figure 1
 Supplementary Figure 1 Mutational analysis of the SA2-Scc1 interaction in vitro and in human cells. (a) Autoradiograph (top) and Coomassie stained gel (bottom) of 35 S-labeled Myc-SA2 proteins (input)
SUPPLEMENTARY FIGURES
 SUPPLEMENTARY FIGURES Supplementary Figure S1: Fibroblast-induced elongation of cancer cells requires direct contact with living fibroblasts. A. Representative images of HT29-GFP cultured in the presence
Supplementary Figure 1. Spatial distribution of LRP5 and β-catenin in intact cardiomyocytes. (a) and (b) Immunofluorescence staining of endogenous
 and (b) Immunofluorescence staining of endogenous") Supplementary Figure 1. Spatial distribution of LRP5 and β-catenin in intact cardiomyocytes. (a) and (b) Immunofluorescence staining of endogenous LRP5 in intact adult mouse ventricular myocytes (AMVMs)
Supplementary Figure 1. Spatial distribution of LRP5 and β-catenin in intact cardiomyocytes. (a) and (b) Immunofluorescence staining of endogenous LRP5 in intact adult mouse ventricular myocytes (AMVMs)
Irf1 fold changes (D) 24h 48h. p-p65. t-p65. p-irf3. t-irf3. β-actin SKO TKO 100% 80% 60% 40% 20%
 24h 48h. p-p65. t-p65. p-irf3. t-irf3. β-actin SKO TKO 100% 80% 60% 40% 20%") Irf7 Fold changes 3 1 Irf1 fold changes 3 1 8h h 8h 8h h 8h p-p6 p-p6 t-p6 p-irf3 β-actin p-irf3 t-irf3 β-actin TKO TKO STKO (E) (F) TKO TKO % of p6 nuclear translocation % % 1% 1% % % p6 TKO % of IRF3
Irf7 Fold changes 3 1 Irf1 fold changes 3 1 8h h 8h 8h h 8h p-p6 p-p6 t-p6 p-irf3 β-actin p-irf3 t-irf3 β-actin TKO TKO STKO (E) (F) TKO TKO % of p6 nuclear translocation % % 1% 1% % % p6 TKO % of IRF3
Supplemental Materials. STK16 regulates actin dynamics to control Golgi organization and cell cycle
 Supplemental Materials STK16 regulates actin dynamics to control Golgi organization and cell cycle Juanjuan Liu 1,2,3, Xingxing Yang 1,3, Binhua Li 1, Junjun Wang 1,2, Wenchao Wang 1, Jing Liu 1, Qingsong
Supplementary information
 Supplementary information Exosomes mediate the cell-to-cell transmission of interferon alpha-induced antiviral activity Jianhua Li, Kuancheng Liu, Yang Liu, Yan Xu, Fei Zhang, Huijuan Yang, Jiangxia Liu,
SUPPLEMENTARY FIGURES AND TABLES
 SUPPLEMENTARY FIGURES AND TABLES Supplementary Figure S1: CaSR expression in neuroblastoma models. A. Proteins were isolated from three neuroblastoma cell lines and from the liver metastasis of a MYCN-non
Supplementary Figure 1. AdipoR1 silencing and overexpression controls. (a) Representative blots (upper and lower panels) showing the AdipoR1 protein
 Representative blots (upper and lower panels) showing the AdipoR1 protein") Supplementary Figure 1. AdipoR1 silencing and overexpression controls. (a) Representative blots (upper and lower panels) showing the AdipoR1 protein content relative to GAPDH in two independent experiments.
Supplementary Figure 1. AdipoR1 silencing and overexpression controls. (a) Representative blots (upper and lower panels) showing the AdipoR1 protein content relative to GAPDH in two independent experiments.
Supplementary Figure 1
 Supplementary Figure 1 AAV-GFP injection in the MEC of the mouse brain C57Bl/6 mice at 4 months of age were injected with AAV-GFP into the MEC and sacrificed at 7 days post injection (dpi). (a) Brains
SUPPLEMENTARY INFORMATION
 DOI: 1.138/ncb222 / b. WB anti- WB anti- ulin Mitotic index (%) 14 1 6 2 T (h) 32 48-1 1 2 3 4 6-1 4 16 22 28 3 33 e. 6 4 2 Time (min) 1-6- 11-1 > 1 % cells Figure S1 depletion leads to mitotic defects
Supplemental Figures
 Supplemental Figures Supplemental Figure 1. Fasting-dependent regulation of the SREBP ortholog SBP-1 and lipid homeostasis mediated by the SIRT1 ortholog SIR-2.1 in C. elegans. (A) Wild-type or sir-2.1(lof)
(A) SW480, DLD1, RKO and HCT116 cells were treated with DMSO or XAV939 (5 µm)
 SW480, DLD1, RKO and HCT116 cells were treated with DMSO or XAV939 (5 µm)") Supplementary Figure Legends Figure S1. Tankyrase inhibition suppresses cell proliferation in an axin/β-catenin independent manner. (A) SW480, DLD1, RKO and HCT116 cells were treated with DMSO or XAV939
Supplementary Figure Legends Figure S1. Tankyrase inhibition suppresses cell proliferation in an axin/β-catenin independent manner. (A) SW480, DLD1, RKO and HCT116 cells were treated with DMSO or XAV939
SUPPLEMENTARY INFORMATION
 DOI: 10.1038/ncb3076 Supplementary Figure 1 btrcp targets Cep68 for degradation during mitosis. a) Cep68 immunofluorescence in interphase and metaphase. U-2OS cells were transfected with control sirna
Insight into cancer research from discovery to validation
 Insight into cancer research from discovery to validation 1 Exosomes in cancer research: from exosome isolation to biomarker discovery Zheng Songyue, PhD Technical Sales Specialists Life Technologies The
Supplementary Figure 1. SA-β-Gal positive senescent cells in various cancer tissues. Representative frozen sections of breast, thyroid, colon and
 Supplementary Figure 1. SA-β-Gal positive senescent cells in various cancer tissues. Representative frozen sections of breast, thyroid, colon and stomach cancer were stained with SA-β-Gal and nuclear fast
Supplementary Figure 1. Validation of astrocytes. Primary astrocytes were
 Supplementary Figure 1. Validation of astrocytes. Primary astrocytes were separated from the glial cultures using a mild trypsinization protocol. Anti-glial fibrillary acidic protein (GFAP) immunofluorescent
Effects of UBL5 knockdown on cell cycle distribution and sister chromatid cohesion
 Supplementary Figure S1. Effects of UBL5 knockdown on cell cycle distribution and sister chromatid cohesion A. Representative examples of flow cytometry profiles of HeLa cells transfected with indicated
SUPPLEMENTARY INFORMATION
 DOI: 10.1038/ncb3311 A B TSC2 -/- MEFs C Rapa Hours WCL 0 6 12 24 36 pakt.s473 AKT ps6k S6K CM IGF-1 Recipient WCL - + - + - + pigf-1r IGF-1R pakt ps6 AKT D 1 st SILAC 2 nd SILAC E GAPDH FGF21 ALKPGVIQILGVK
MicroRNAs Modulate the Noncanonical NF- B Pathway by Regulating IKK Expression During Macrophage Differentiation
 MicroRNAs Modulate the Noncanonical NF- B Pathway by Regulating IKK Expression During Macrophage Differentiation Tao Li 1 *, Michael J. Morgan 1 *, Swati Choksi 1, Yan Zhang 1, You-Sun Kim 2#, Zheng-gang
Supplementary Figure 1. The CagA-dependent wound healing or transwell migration of gastric cancer cell. AGS cells transfected with vector control or
 Supplementary Figure 1. The CagA-dependent wound healing or transwell migration of gastric cancer cell. AGS cells transfected with vector control or 3xflag-CagA expression vector were wounded using a pipette
Title of file for HTML: Supplementary Information Description: Supplementary Figures and Supplementary Table
 Title of file for HTML: Supplementary Information Description: Supplementary Figures and Supplementary Table Title of file for HTML: Peer Review File Description: Innate Scavenger Receptor-A regulates
supplementary information
 DOI: 10.1038/ncb2153 Figure S1 Ectopic expression of HAUSP up-regulates REST protein. (a) Immunoblotting showed that ectopic expression of HAUSP increased REST protein levels in ENStemA NPCs. (b) Immunofluorescent
Supplementary Figure 1. SC35M polymerase activity in the presence of Bat or SC35M NP encoded from the phw2000 rescue plasmid.
 1 2 3 4 5 6 7 8 9 10 11 12 13 14 15 16 17 18 19 20 21 22 23 24 25 26 27 Supplementary Figure 1. SC35M polymerase activity in the presence of Bat or SC35M NP encoded from the phw2000 rescue plasmid. HEK293T
Electron micrograph of phosphotungstanic acid-stained exosomes derived from murine
 1 SUPPLEMENTARY INFORMATION SUPPLEMENTARY FIGURES Supplementary Figure 1. Physical properties of murine DC-derived exosomes. a, Electron micrograph of phosphotungstanic acid-stained exosomes derived from
SUPPLEMENTARY INFORMATION
 DOI:.38/ncb2822 a MTC02 FAO cells EEA1 b +/+ MEFs /DAPI -/- MEFs /DAPI -/- MEFs //DAPI c HEK 293 cells WCE N M C P AKT TBC1D7 Lamin A/C EEA1 VDAC d HeLa cells WCE N M C P AKT Lamin A/C EEA1 VDAC Figure
Supplementary Figure 1. Basal level EGFR across a panel of ESCC lines. Immunoblots demonstrate the expression of phosphorylated and total EGFR as
 Supplementary Figure 1. Basal level EGFR across a panel of ESCC lines. Immunoblots demonstrate the expression of phosphorylated and total EGFR as well as their downstream effectors across a panel of ESCC
Oncolytic Adenovirus Complexes Coated with Lipids and Calcium Phosphate for Cancer Gene Therapy
 Oncolytic Adenovirus Complexes Coated with Lipids and Calcium Phosphate for Cancer Gene Therapy Jianhua Chen, Pei Gao, Sujing Yuan, Rongxin Li, Aimin Ni, Liang Chu, Li Ding, Ying Sun, Xin-Yuan Liu, Yourong
T H E J O U R N A L O F C E L L B I O L O G Y
 Supplemental material Díaz et al., http://www.jcb.org/cgi/content/full/jcb.201209151/dc1 T H E J O U R N A L O F C E L L B I O L O G Y Figure S1. Hypoxia induces invadopodia formation in different epithelial
SUPPLEMENTARY INFORMATION
 DOI: 10.1038/ncb2607 Figure S1 Elf5 loss promotes EMT in mammary epithelium while Elf5 overexpression inhibits TGFβ induced EMT. (a, c) Different confocal slices through the Z stack image. (b, d) 3D rendering
Supplemental Figures:
 Supplemental Figures: Figure 1: Intracellular distribution of VWF by electron microscopy in human endothelial cells. a) Immunogold labeling of LC3 demonstrating an LC3-positive autophagosome (white arrow)
LPS LPS P6 - + Supplementary Fig. 1.
 P6 LPS - - - + + + - LPS + + - - P6 + Supplementary Fig. 1. Pharmacological inhibition of the JAK/STAT blocks LPS-induced HMGB1 nuclear translocation. RAW 267.4 cells were stimulated with LPS in the absence
Supplemental Information. Menin Deficiency Leads to Depressive-like. Behaviors in Mice by Modulating. Astrocyte-Mediated Neuroinflammation
 Neuron, Volume 100 Supplemental Information Menin Deficiency Leads to Depressive-like Behaviors in Mice by Modulating Astrocyte-Mediated Neuroinflammation Lige Leng, Kai Zhuang, Zeyue Liu, Changquan Huang,
Supplementary Figure 1. Genotyping strategies for Mcm3 +/+, Mcm3 +/Lox and Mcm3 +/- mice and luciferase activity in Mcm3 +/Lox mice. A.
 Supplementary Figure 1. Genotyping strategies for Mcm3 +/+, Mcm3 +/Lox and Mcm3 +/- mice and luciferase activity in Mcm3 +/Lox mice. A. Upper part, three-primer PCR strategy at the Mcm3 locus yielding
SUPPLEMENTARY INFORMATION
 Supplementary Discussion The cell cycle machinery and the DNA damage response network are highly interconnected and co-regulated in assuring faithful duplication and partition of genetic materials into
293T cells were transfected with indicated expression vectors and the whole-cell extracts were subjected
 SUPPLEMENTARY INFORMATION Supplementary Figure 1. Formation of a complex between Slo1 and CRL4A CRBN E3 ligase. (a) HEK 293T cells were transfected with indicated expression vectors and the whole-cell
Supplementary Figure S1. Venn diagram analysis of mrna microarray data and mirna target analysis. (a) Western blot analysis of T lymphoblasts (CLS)
 Western blot analysis of T lymphoblasts (CLS)") Supplementary Figure S1. Venn diagram analysis of mrna microarray data and mirna target analysis. (a) Western blot analysis of T lymphoblasts (CLS) and their exosomes (EXO) in resting (REST) and activated
Supplementary Figure S1. Venn diagram analysis of mrna microarray data and mirna target analysis. (a) Western blot analysis of T lymphoblasts (CLS) and their exosomes (EXO) in resting (REST) and activated
X P. Supplementary Figure 1. Nature Medicine: doi: /nm Nilotinib LSK LT-HSC. Cytoplasm. Cytoplasm. Nucleus. Nucleus
 a b c Supplementary Figure 1 c-kit-apc-eflu780 Lin-FITC Flt3-Linc-Kit-APC-eflu780 LSK Sca-1-PE-Cy7 d e f CD48-APC LT-HSC CD150-PerCP-cy5.5 g h i j Cytoplasm RCC1 X Exp 5 mir 126 SPRED1 SPRED1 RAN P SPRED1
Supplementary Figure 1: Fn14 is upregulated in the epidermis and dermis of mice
 Supplementary Figure 1: Fn14 is upregulated in the epidermis and dermis of mice undergoing AD- and psoriasis-like disease. Immunofluorescence staining for Fn14 (green) and DAPI (blue) in skin of naïve
Supplementary Figure 1. Baf60c and baf180 are induced during cardiac regeneration in zebrafish. RNA in situ hybridization was performed on paraffin
 Supplementary Figure 1. Baf60c and baf180 are induced during cardiac regeneration in zebrafish. RNA in situ hybridization was performed on paraffin sections from sham-operated adult hearts (a and i) and
Supplementary Figure 1. Confocal immunofluorescence showing mitochondrial translocation of Drp1. Cardiomyocytes treated with H 2 O 2 were prestained
 Supplementary Figure 1. Confocal immunofluorescence showing mitochondrial translocation of Drp1. Cardiomyocytes treated with H 2 O 2 were prestained with MitoTracker (red), then were immunostained with
Nature Immunology: doi: /ni Supplementary Figure 1. Production of cytokines and chemokines after vaginal HSV-2 infection.
 Supplementary Figure 1 Production of cytokines and chemokines after vaginal HSV-2 infection. C57BL/6 mice were (a) treated intravaginally with 20 µl of PBS or infected with 6.7x10 4 pfu of HSV-2 in the
Supplementary Figure 1. MLN8237 treatments show an unusual camel-back response pattern.
 Supplementary Figure 1. MLN8237 treatments show an unusual camel-ack response pattern. NCI-H1819 cells were treated with serial concentrations of MLN8237 and four days after treatment, cell viaility was
Supplementary Information. Induction of p53-independent apoptosis by ectopic expression of HOXA5
 Supplementary Information Induction of p53-independent apoptosis by ectopic expression of in human liposarcomas Dhong Hyun Lee 1, *, Charles Forscher 1, Dolores Di Vizio 2, 3, and H. Phillip Koeffler 1,
Supplementary Figure 1. Prevalence of U539C and G540A nucleotide and E172K amino acid substitutions among H9N2 viruses. Full-length H9N2 NS
 Supplementary Figure 1. Prevalence of U539C and G540A nucleotide and E172K amino acid substitutions among H9N2 viruses. Full-length H9N2 NS nucleotide sequences (a, b) or amino acid sequences (c) from
TRAF6 ubiquitinates TGFβ type I receptor to promote its cleavage and nuclear translocation in cancer
 Supplementary Information TRAF6 ubiquitinates TGFβ type I receptor to promote its cleavage and nuclear translocation in cancer Yabing Mu, Reshma Sundar, Noopur Thakur, Maria Ekman, Shyam Kumar Gudey, Mariya
Supplementary Information. Supplementary Figure 1
 Supplementary Information Supplementary Figure 1 1 Supplementary Figure 1. Functional assay of the hcas9-2a-mcherry construct (a) Gene correction of a mutant EGFP reporter cell line mediated by hcas9 or
Loss of Calreticulin Uncovers a Critical Role for Calcium in Regulating Cellular Lipid Homeostasis
 SUPPLEMENTARY MATERIAL Loss of Calreticulin Uncovers a Critical Role for Calcium in Regulating Cellular Lipid Homeostasis Wen-An Wang 1, Wen-Xin Liu 1, Serpen Durnaoglu 2, Sun-Kyung Lee 2, Jihong Lian
Title: Cytosolic DNA-mediated, STING-dependent pro-inflammatory gene. Fig. S1. STING ligands-mediated signaling response in MEFs. (A) Primary MEFs (1
 Primary MEFs (1") 1 Supporting Information 2 3 4 Title: Cytosolic DNA-mediated, STING-dependent pro-inflammatory gene induction necessitates canonical NF-κB activation through TBK1 5 6 Authors: Abe et al. 7 8 9 Supporting
1 Supporting Information 2 3 4 Title: Cytosolic DNA-mediated, STING-dependent pro-inflammatory gene induction necessitates canonical NF-κB activation through TBK1 5 6 Authors: Abe et al. 7 8 9 Supporting
Cells and reagents. Synaptopodin knockdown (1) and dynamin knockdown (2)
 and dynamin knockdown (2)") Supplemental Methods Cells and reagents. Synaptopodin knockdown (1) and dynamin knockdown (2) podocytes were cultured as described previously. Staurosporine, angiotensin II and actinomycin D were all obtained
Supplemental Methods Cells and reagents. Synaptopodin knockdown (1) and dynamin knockdown (2) podocytes were cultured as described previously. Staurosporine, angiotensin II and actinomycin D were all obtained
SUPPLEMENTARY FIGURE LEGENDS. atypical adenomatous hyperplasias (AAH); Grade II: adenomas; Grade III: adenocarcinomas;
; Grade II: adenomas; Grade III: adenocarcinomas;") SUPPLEMENTARY FIGURE LEGENDS Supplementary Figure S1: Tumor grades in Ras G12D ; p53 / lung tumors. Representative histology (H&E) of K-Ras G12D ; p53 / lung tumors 13 weeks after tumor initiation. Grade
SUPPLEMENTARY FIGURE LEGENDS Supplementary Figure S1: Tumor grades in Ras G12D ; p53 / lung tumors. Representative histology (H&E) of K-Ras G12D ; p53 / lung tumors 13 weeks after tumor initiation. Grade
c Ischemia (30 min) Reperfusion (8 w) Supplementary Figure bp 300 bp Ischemia (30 min) Reperfusion (4 h) Dox 20 mg/kg i.p.
 Reperfusion (8 w) Supplementary Figure bp 300 bp Ischemia (30 min) Reperfusion (4 h) Dox 20 mg/kg i.p.") a Marker Ripk3 +/ 5 bp 3 bp b Ischemia (3 min) Reperfusion (4 h) d 2 mg/kg i.p. 1 w 5 w Sacrifice for IF size A subset for echocardiography and morphological analysis c Ischemia (3 min) Reperfusion (8
a Marker Ripk3 +/ 5 bp 3 bp b Ischemia (3 min) Reperfusion (4 h) d 2 mg/kg i.p. 1 w 5 w Sacrifice for IF size A subset for echocardiography and morphological analysis c Ischemia (3 min) Reperfusion (8
Supplementary Information. Induction of human pancreatic beta cell replication by inhibitors of dual specificity tyrosine regulated kinase
 Journal: Nature Medicine Supplementary Information Induction of human pancreatic beta cell replication by inhibitors of dual specificity tyrosine regulated kinase 1,2 Peng Wang PhD, 1,2 Juan-Carlos Alvarez-Perez
Supplemental information contains 7 movies and 4 supplemental Figures
 1 2 3 4 5 6 7 8 9 10 11 12 13 14 15 16 17 18 19 20 21 22 23 24 25 26 27 Supplemental information contains 7 movies and 4 supplemental Figures Movies: Movie 1. Single virus tracking of A4-mCherry-WR MV
Supplementary Information
 Supplementary Information An orally available, small-molecule interferon inhibits viral replication Hideyuki Konishi 1, Koichi Okamoto 1, Yusuke Ohmori 1, Hitoshi Yoshino 2, Hiroshi Ohmori 1, Motooki Ashihara
(A) RT-PCR for components of the Shh/Gli pathway in normal fetus cell (MRC-5) and a
 RT-PCR for components of the Shh/Gli pathway in normal fetus cell (MRC-5) and a") Supplementary figure legends Supplementary Figure 1. Expression of Shh signaling components in a panel of gastric cancer. (A) RT-PCR for components of the Shh/Gli pathway in normal fetus cell (MRC-5) and
Supplementary figure legends Supplementary Figure 1. Expression of Shh signaling components in a panel of gastric cancer. (A) RT-PCR for components of the Shh/Gli pathway in normal fetus cell (MRC-5) and
s u p p l e m e n ta ry i n f o r m at i o n
 Figure S1 Characterization of tet-off inducible cell lines expressing GFPprogerin and GFP-wt lamin A. a, Western blot analysis of GFP-progerin- or GFP-wt lamin A- expressing cells before induction (0d)
Supplementary Figure 1 IMQ-Induced Mouse Model of Psoriasis. IMQ cream was
 Supplementary Figure 1 IMQ-Induced Mouse Model of Psoriasis. IMQ cream was painted on the shaved back skin of CBL/J and BALB/c mice for consecutive days. (a, b) Phenotypic presentation of mouse back skin
Supplementary Figure 1. PAQR3 knockdown inhibits SREBP-2 processing in CHO-7 cells CHO-7 cells were transfected with control sirna or a sirna
 Supplementary Figure 1. PAQR3 knockdown inhibits SREBP-2 processing in CHO-7 cells CHO-7 cells were transfected with control sirna or a sirna targeted for hamster PAQR3. At 24 h after the transfection,
Supplementary Figure 1
 A B D Relative TAp73 mrna p73 Supplementary Figure 1 25 2 15 1 5 p63 _-tub. MDA-468 HCC1143 HCC38 SUM149 MDA-468 HCC1143 HCC38 SUM149 HCC-1937 MDA-MB-468 ΔNp63_ TAp73_ TAp73β E C Relative ΔNp63 mrna TAp73
S1a S1b S1c. S1d. S1f S1g S1h SUPPLEMENTARY FIGURE 1. - si sc Il17rd Il17ra bp. rig/s IL-17RD (ng) -100 IL-17RD
 -100 IL-17RD") SUPPLEMENTARY FIGURE 1 0 20 50 80 100 IL-17RD (ng) S1a S1b S1c IL-17RD β-actin kda S1d - si sc Il17rd Il17ra rig/s15-574 - 458-361 bp S1f S1g S1h S1i S1j Supplementary Figure 1. Knockdown of IL-17RD enhances
SUPPLEMENTARY FIGURE 1 0 20 50 80 100 IL-17RD (ng) S1a S1b S1c IL-17RD β-actin kda S1d - si sc Il17rd Il17ra rig/s15-574 - 458-361 bp S1f S1g S1h S1i S1j Supplementary Figure 1. Knockdown of IL-17RD enhances
Supplementary Figure 1. Expression of CUGBP1 in non-parenchymal liver cells treated with TGF-β
 Supplementary Figures Supplementary Figure 1. Expression of CUGBP1 in non-parenchymal liver cells treated with TGF-β and LPS. Non-parenchymal liver cells were isolated and treated with or without TGF-β
Fang et al. NMuMG. PyVmT unstained Anti-CCR2-PE MDA-MB MCF MCF10A
 A NMuMG PyVmT 16.5+.5 47.+7.2 Fang et al. unstained Anti-CCR2-PE 4T1 Control 37.6+6.3 56.1+.65 MCF1A 16.1+3. MCF-7 3.1+5.4 MDA-M-231 42.1+5.5 unstained Secondary antibody only Anti-CCR2 SUPPLEMENTAL FIGURE
Peli1 negatively regulates T-cell activation and prevents autoimmunity
 Peli1 negatively regulates T-cell activation and prevents autoimmunity Mikyoung Chang 1,*, Wei Jin 1,5,*, Jae-Hoon Chang 1, Yi-chuan Xiao 1, George Brittain 1, Jiayi Yu 1, Xiaofei Zhou 1, Yi-Hong Wang
Supplemental Table S1
 Supplemental Table S. Tumorigenicity and metastatic potential of 44SQ cell subpopulations a Tumorigenicity b Average tumor volume (mm ) c Lung metastasis d CD high /4 8. 8/ CD low /4 6./ a Mice were injected
Supplementary Figure 1. IDH1 and IDH2 mutation site sequences on WHO grade III
 Supplementary Materials: Supplementary Figure 1. IDH1 and IDH2 mutation site sequences on WHO grade III patient samples. Genomic DNA samples extracted from punch biopsies from either FFPE or frozen tumor
Supplementary Figure 1. MAT IIα is Acetylated at Lysine 81.
 IP: Flag a Mascot PTM Modified Mass Error Position Gene Names Score Score Sequence m/z [ppm] 81 MAT2A;AMS2;MATA2 35.6 137.28 _AAVDYQK(ac)VVR_ 595.83-2.28 b Pre-immu After-immu Flag- WT K81R WT K81R / Flag
Supplementary Materials
 Supplementary Materials Supplementary Figure S1 Regulation of Ubl4A stability by its assembly partner A, The translation rate of Ubl4A is not affected in the absence of Bag6. Control, Bag6 and Ubl4A CRISPR
SUPPLEMENTARY INFORMATION
 Supplementary Table 1. Cell sphingolipids and S1P bound to endogenous TRAF2. Sphingolipid Cell pmol/mg TRAF2 immunoprecipitate pmol/mg Sphingomyelin 4200 ± 250 Not detected Monohexosylceramide 311 ± 18
Soft Agar Assay. For each cell pool, 100,000 cells were resuspended in 0.35% (w/v)
") SUPPLEMENTARY MATERIAL AND METHODS Soft Agar Assay. For each cell pool, 100,000 cells were resuspended in 0.35% (w/v) top agar (LONZA, SeaKem LE Agarose cat.5004) and plated onto 0.5% (w/v) basal agar.
SUPPLEMENTARY MATERIAL AND METHODS Soft Agar Assay. For each cell pool, 100,000 cells were resuspended in 0.35% (w/v) top agar (LONZA, SeaKem LE Agarose cat.5004) and plated onto 0.5% (w/v) basal agar.
Supplementary Information POLO-LIKE KINASE 1 FACILITATES LOSS OF PTEN-INDUCED PROSTATE CANCER FORMATION
 Supplementary Information POLO-LIKE KINASE 1 FACILITATES LOSS OF PTEN-INDUCED PROSTATE CANCER FORMATION X. Shawn Liu 1, 3, Bing Song 2, 3, Bennett D. Elzey 3, 4, Timothy L. Ratliff 3, 4, Stephen F. Konieczny
An epithelial-to-mesenchymal transition-inducing potential of. granulocyte macrophage colony-stimulating factor in colon. cancer
 An epithelial-to-mesenchymal transition-inducing potential of granulocyte macrophage colony-stimulating factor in colon cancer Yaqiong Chen, Zhi Zhao, Yu Chen, Zhonglin Lv, Xin Ding, Renxi Wang, He Xiao,
Supplementary Figure 1: STAT3 suppresses Kras-induced lung tumorigenesis
 Supplementary Figure 1: STAT3 suppresses Kras-induced lung tumorigenesis (a) Immunohistochemical (IHC) analysis of tyrosine 705 phosphorylation status of STAT3 (P- STAT3) in tumors and stroma (all-time
ERK1/2/MAPK pathway-dependent regulation of the telomeric factor TRF2
 ERK1/2/MAPK pathway-dependent regulation of the telomeric factor TRF2 SUPPLEMENTARY FIGURES AND TABLE Supplementary Figure S1: Conservation of the D domain throughout evolution. Alignment of TRF2 sequences
F-actin VWF Vinculin. F-actin. Vinculin VWF
 a F-actin VWF Vinculin b F-actin VWF Vinculin Supplementary Fig. 1. WPBs in HUVECs are located along stress fibers and at focal adhesions. (a) Immunofluorescence images of f-actin (cyan), VWF (yellow),