BMDCs were generated in vitro from bone marrow cells cultured in 10 % RPMI supplemented
|
|
|
- Arline Foster
- 5 years ago
- Views:
Transcription
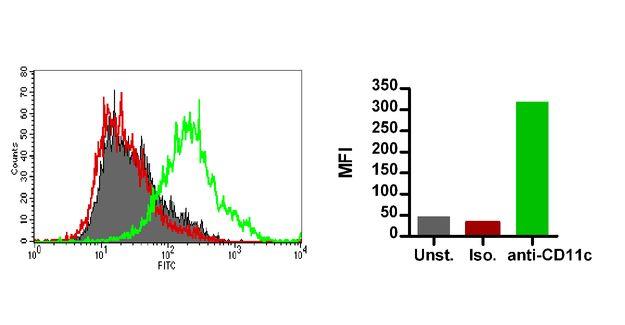
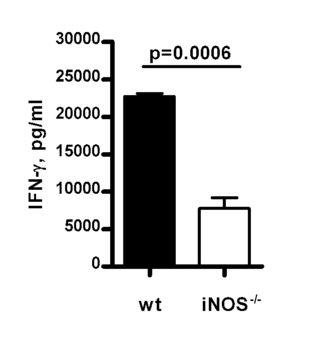
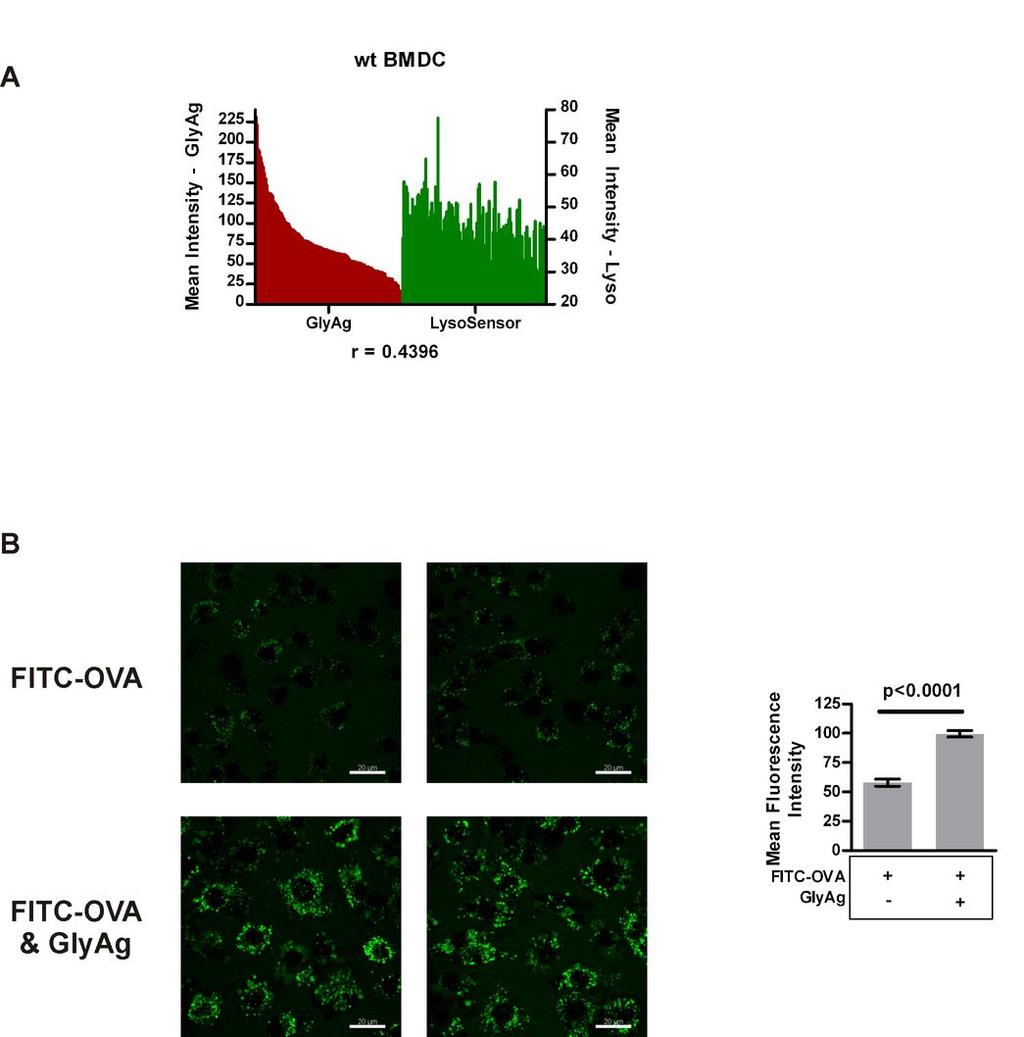
1 Supplemental Materials Figure S1. Cultured BMDCs express CD11c BMDCs were generated in vitro from bone marrow cells cultured in 10 % RPMI supplemented with 15 ng/ml GM-CSF. Media was changed and fresh cytokine added on days 2 and 4, then the cells were washed on day 7. On day 12, cells were removed and stained with anti-cd11c to verify cell surface expression by flow cytometry. The cells demonstrated high levels of surface CD11c when compared to isotype control, indicating that BMDCs were generated. Figure S2. NO oxidation and processing of GlyAg is fundamental for T cell activation. Co-cultures of purified wt and inos -/- APCs (depleted with CD90.2 microbeads) and CD4 + T cells were stimulated with 100 μg/ml GlyAg or PBS and subsequent IFN-γ production was measured six days later (ebioscience, San Diego, CA). wt CD4 + T cells produce significantly more IFN-γ in response to GlyAg stimulation than do inos -/- T cells, demonstrating that NO production and subsequent oxidation of GlyAg is necessary for T cell activation. n = 3; mean ± SEM Figure S3. LysoSensor Green fluorescence is ph dependent. LysoSensor Green (1 µm) was added to 200 µl of Tris or citrate buffers at various ph values within a 96-well plate and the fluorescence was measured immediately (n = 3; mean ± SEM) using a Victor 3 V multilabel counter (Perkin-Elmer). Error bars represent SEM. Fluorescence intensity increased by a factor of nearly 4 when comparing neutral and acidic (ph < 6) ph values. Figure S4. The amount of GlyAg present in cells positively correlates to the amount of vesicular acidification Lewis & Cobb, Pg. 1
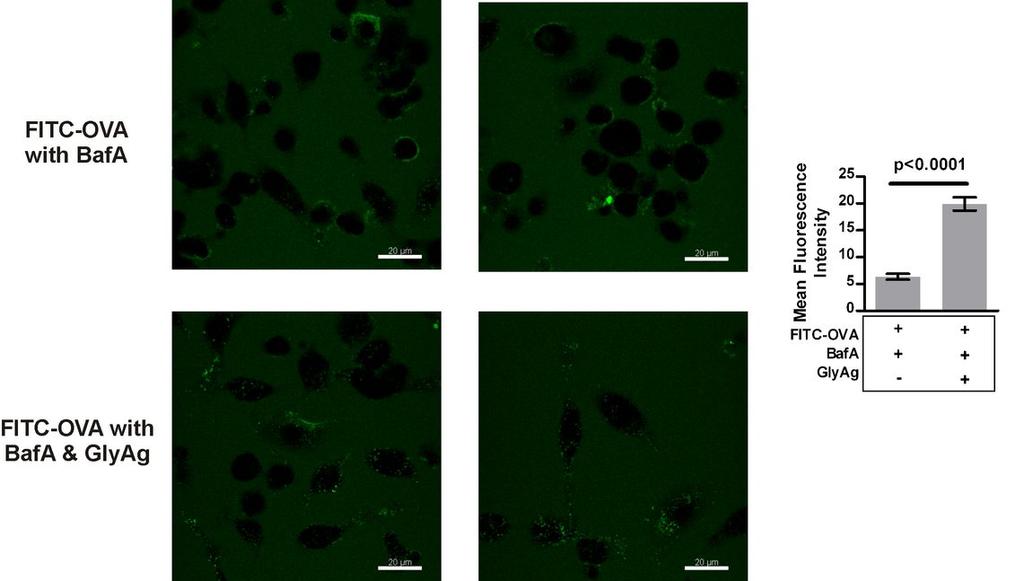
2 (A) Wild type BMDCs were stimulated with 50 μg/ml labeled GlyAg overnight, washed, then treated with 2 μm LysoSensor Green for 25 minutes. Ten confocal images were captured and the mean intensity of the fluorescent signals (green = LysoSensor; red = GlyAg) of 100 independent subcellular ROIs were quantified using Leica Application Suite software. The mean fluorescent intensities were graphed in order of brightest to weakest GlyAg signal and Pearson Correlation coefficient was determined. There is a positive correlation (r = ) between the amount GlyAg present in the cells and the degree of acidification achieved (i.e. LysoSensor fluorescence) even in these cells, which retain V-type ATPase proton pump activity. Although this relationship is more apparent when constitutive acidification is blocked with BafA (Figure 4), these data demonstrate strong GlyAg oxidation-driven acidification above the normal proton pump-mediated acidification. (B) Confocal images were obtained for RAW macrophages treated overnight with or without 50 μg/ml unlabeled GlyAg, then stimulated with 50 μg/ml FITC-OVA for 90 minutes. Images shown are maximum projections of each z-stack; bars = 20 μm. Untreated macrophages readily endocytose the protein antigen as evidence by punctate staining within cells (top row). However, the uptake of FITC-OVA is greatly enhanced by the pre-treatment of the cells with GlyAg, resulting in significantly increased mean fluorescent intensity of 50 independent ROIs. These data show that under normal conditions (i.e., without BafA), NO-mediated processing of GlyAg enhances ph-dependent receptor-mediated endocytosis and receptor-ligand dissociation within vesicular compartments. Figure S5. BafA reduces protein antigen retention within endocytic vesicles Confocal images were obtained for RAW macrophages treated overnight (~16 hours) with 40 nm BafA and 50 μg/ml GlyAg or with BafA only, then stimulated with 50 μg/ml FITC-OVA for 30 minutes. Images shown are maximum projections of each z-stack; bars = 20 μm. The mean Lewis & Cobb, Pg. 2
3 fluorescent intensity of 50 independent subcellular ROIs was quantified for each treatment group. Cells treated overnight with BafA only show primarily surface accumulation and little to no internalization of FITC-OVA (top row). However, the addition of GlyAg to BafA treated cells increased internalization and retention of FITC-OVA 4-fold as evidenced by the punctuate staining within the cell bodies (bottom row). These data support previously published findings that BafA alters antigen endocytosis by diminishing ph-dependent intravesicular receptor-ligand dissociation, leading to loaded receptors being recycled and accumulation of FITC-OVA on the cell surface. However, pretreatment with GlyAg overcomes this inhibition and promotes retention of FITC-OVA within the cells, likely through creating an acidic endosomal environment. Lewis & Cobb, Pg. 3
4
5
6
7
8
Figure S1. Western blot analysis of clathrin RNA interference in human DCs Human immature DCs were transfected with 100 nm Clathrin SMARTpool or
 Figure S1. Western blot analysis of clathrin RNA interference in human DCs Human immature DCs were transfected with 100 nm Clathrin SMARTpool or control nontargeting sirnas. At 90 hr after transfection,
Intracellular MHC class II molecules promote TLR-triggered innate. immune responses by maintaining Btk activation
 Intracellular MHC class II molecules promote TLR-triggered innate immune responses by maintaining Btk activation Xingguang Liu, Zhenzhen Zhan, Dong Li, Li Xu, Feng Ma, Peng Zhang, Hangping Yao and Xuetao
Supplementary Figures
 Inhibition of Pulmonary Anti Bacterial Defense by IFN γ During Recovery from Influenza Infection By Keer Sun and Dennis W. Metzger Supplementary Figures d a Ly6G Percentage survival f 1 75 5 1 25 1 5 1
Supplementary Figure 1. Characterization of basophils after reconstitution of SCID mice
 Supplementary figure legends Supplementary Figure 1. Characterization of after reconstitution of SCID mice with CD4 + CD62L + T cells. (A-C) SCID mice (n = 6 / group) were reconstituted with 2 x 1 6 CD4
Supplementary Information. Tissue-wide immunity against Leishmania. through collective production of nitric oxide
 Supplementary Information Tissue-wide immunity against Leishmania through collective production of nitric oxide Romain Olekhnovitch, Bernhard Ryffel, Andreas J. Müller and Philippe Bousso Supplementary
MATERIALS AND METHODS. Neutralizing antibodies specific to mouse Dll1, Dll4, J1 and J2 were prepared as described. 1,2 All
 MATERIALS AND METHODS Antibodies (Abs), flow cytometry analysis and cell lines Neutralizing antibodies specific to mouse Dll1, Dll4, J1 and J2 were prepared as described. 1,2 All other antibodies used
CD14 + S100A9 + Monocytic Myeloid-Derived Suppressor Cells and Their Clinical Relevance in Non-Small Cell Lung Cancer
 CD14 + S1A9 + Monocytic Myeloid-Derived Suppressor Cells and Their Clinical Relevance in Non-Small Cell Lung Cancer Po-Hao, Feng M.D., Kang-Yun, Lee, M.D. Ph.D., Ya-Ling Chang, Yao-Fei Chan, Lu- Wei, Kuo,Ting-Yu
The encephalitogenicity of TH17 cells is dependent on IL-1- and IL-23- induced production of the cytokine GM-CSF
 CORRECTION NOTICE Nat.Immunol. 12, 568 575 (2011) The encephalitogenicity of TH17 cells is dependent on IL-1- and IL-23- induced production of the cytokine GM-CSF Mohamed El-Behi, Bogoljub Ciric, Hong
Supporting Information
 Supporting Information lpek et al. 1.173/pnas.1121217 SI Materials and Methods Mice. cell knockout, inos / (Taconic arms), Rag1 /, INγR /, and IL-12p4 / mice (The Jackson Laboratory) were maintained and/or
SUPPLEMENTARY INFORMATION
 doi: 1.138/nature775 4 O.D. (595-655) 3 1 -ζ no antibody isotype ctrl Plated Soluble 1F6 397 7H11 Supplementary Figure 1 Soluble and plated anti- Abs induce -! signalling. B3Z cells stably expressing!
Supplementary Materials for
 www.sciencesignaling.org/cgi/content/full/8/381/ra59/dc1 Supplementary Materials for Analysis of single-cell cytokine secretion reveals a role for paracrine signaling in coordinating macrophage responses
% of live splenocytes. STAT5 deletion. (open shapes) % ROSA + % floxed
 % ROSA + % floxed") Supp. Figure 1. a 14 1 1 8 6 spleen cells (x1 6 ) 16 % of live splenocytes 5 4 3 1 % of live splenocytes 8 6 4 b 1 1 c % of CD11c + splenocytes (closed shapes) 8 6 4 8 6 4 % ROSA + (open shapes) % floxed
Supp. Figure 1. a 14 1 1 8 6 spleen cells (x1 6 ) 16 % of live splenocytes 5 4 3 1 % of live splenocytes 8 6 4 b 1 1 c % of CD11c + splenocytes (closed shapes) 8 6 4 8 6 4 % ROSA + (open shapes) % floxed
Nature Immunology: doi: /ni Supplementary Figure 1
 Supplementary Figure 1 Fatty acid oxidation is emphasized in 1 macrophages compared with that in macrophages. Gene expression of mitochondrial OXPHOS (Atp5j, Cox4i1, Uqcrc1/2, Ndufs1, Sdhb) and β-oxidation
<10. IL-1β IL-6 TNF + _ TGF-β + IL-23
 3 ns 25 ns 2 IL-17 (pg/ml) 15 1 ns ns 5 IL-1β IL-6 TNF
Cell isolation. Spleen and lymph nodes (axillary, inguinal) were removed from mice
 were removed from mice") Supplementary Methods: Cell isolation. Spleen and lymph nodes (axillary, inguinal) were removed from mice and gently meshed in DMEM containing 10% FBS to prepare for single cell suspensions. CD4 + CD25
Supplementary Methods: Cell isolation. Spleen and lymph nodes (axillary, inguinal) were removed from mice and gently meshed in DMEM containing 10% FBS to prepare for single cell suspensions. CD4 + CD25
Supplementary table I. Real-time primers used in the study. The fold change was obtained by
 Supplementary table I. Real-time primers used in the study. The fold change was obtained by normalizing the gene expression number to those of HPRT, then comparing the samples to untreated or naive mice.
Figure S1. PMVs from THP-1 cells expose phosphatidylserine and carry actin. A) Flow
 Flow") SUPPLEMENTARY DATA Supplementary Figure Legends Figure S1. PMVs from THP-1 cells expose phosphatidylserine and carry actin. A) Flow cytometry analysis of PMVs labelled with annexin-v-pe (Guava technologies)
SUPPLEMENTARY DATA Supplementary Figure Legends Figure S1. PMVs from THP-1 cells expose phosphatidylserine and carry actin. A) Flow cytometry analysis of PMVs labelled with annexin-v-pe (Guava technologies)
Supplementary Material
 Supplementary Material accompanying the manuscript Interleukin 37 is a fundamental inhibitor of innate immunity Marcel F Nold, Claudia A Nold-Petry, Jarod A Zepp, Brent E Palmer, Philip Bufler & Charles
SUPPLEMENTARY INFORMATION
 doi:1.138/nature1554 a TNF-α + in CD4 + cells [%] 1 GF SPF 6 b IL-1 + in CD4 + cells [%] 5 4 3 2 1 Supplementary Figure 1. Effect of microbiota on cytokine profiles of T cells in GALT. Frequencies of TNF-α
- 1 - Cell types Monocytes THP-1 cells Macrophages. LPS Treatment time (Hour) IL-6 level (pg/ml)
 IL-6 level (pg/ml)") Supplementary Table ST1: The dynamic effect of LPS on IL-6 production in monocytes and THP-1 cells after GdA treatment. Monocytes, THP-1 cells and macrophages (5x10 5 ) were incubated with 10 μg/ml of
Supplementary Table ST1: The dynamic effect of LPS on IL-6 production in monocytes and THP-1 cells after GdA treatment. Monocytes, THP-1 cells and macrophages (5x10 5 ) were incubated with 10 μg/ml of
Supplementary Figure S1. Flow cytometric analysis of the expression of Thy1 in NH cells. Flow cytometric analysis of the expression of T1/ST2 and
 Supplementary Figure S1. Flow cytometric analysis of the expression of Thy1 in NH cells. Flow cytometric analysis of the expression of T1/ST2 and Thy1 in NH cells derived from the lungs of naïve mice.
Supplementary figure 1. Systemic delivery of anti-cd47 antibody controls tumor growth in
 T u m o r v o lu m e (m m 3 ) P e rc e n t s u rv iv a l P e rc e n t s u rv iv a l Supplementary data a 1 8 6 4 2 5 1 1 5 2 2 5 3 3 5 4 T im e a fte r tu m o r in o c u la tio n (d ) b c 1 5 1 1 5 * *
Supplementary Fig. 1 p38 MAPK negatively regulates DC differentiation. (a) Western blot analysis of p38 isoform expression in BM cells, immature DCs
 Western blot analysis of p38 isoform expression in BM cells, immature DCs") Supplementary Fig. 1 p38 MAPK negatively regulates DC differentiation. (a) Western blot analysis of p38 isoform expression in BM cells, immature DCs (idcs) and mature DCs (mdcs). A myeloma cell line expressing
Supplementary Fig. 1 p38 MAPK negatively regulates DC differentiation. (a) Western blot analysis of p38 isoform expression in BM cells, immature DCs (idcs) and mature DCs (mdcs). A myeloma cell line expressing
Combined Rho-kinase inhibition and immunogenic cell death triggers and propagates immunity against cancer
 Supplementary Information Combined Rho-kinase inhibition and immunogenic cell death triggers and propagates immunity against cancer Gi-Hoon Nam, Eun-Jung Lee, Yoon Kyoung Kim, Yeonsun Hong, Yoonjeong Choi,
genome edited transient transfection, CMV promoter
 Supplementary Figure 1. In the absence of new protein translation, overexpressed caveolin-1-gfp is degraded faster than caveolin-1-gfp expressed from the endogenous caveolin 1 locus % loss of total caveolin-1-gfp
Supplemental Figure Legends
 Supplemental Figure Legends Supplemental Figure 1. SemaB / mice have normal immune cell populations. Cells were prepared from the spleens of WT and SemaB / mice, stained with various antibodies and then
Supplementary Figure 1. IL-12 serum levels and frequency of subsets in FL patients. (A) IL-12
 IL-12") 1 Supplementary Data Figure legends Supplementary Figure 1. IL-12 serum levels and frequency of subsets in FL patients. (A) IL-12 serum levels measured by multiplex ELISA (Luminex) in FL patients before
1 Supplementary Data Figure legends Supplementary Figure 1. IL-12 serum levels and frequency of subsets in FL patients. (A) IL-12 serum levels measured by multiplex ELISA (Luminex) in FL patients before
Live cell imaging of trafficking of the chaperone complex vaccine to the ER. BMDCs were incubated with ER-Tracker Red (1 M) in staining solution for
 in staining solution for") Live cell imaging of trafficking of the chaperone complex vaccine to the ER. BMDCs were incubated with ER-Tracker Red (1 M) in staining solution for 15 min at 37 C and replaced with fresh complete medium.
Live cell imaging of trafficking of the chaperone complex vaccine to the ER. BMDCs were incubated with ER-Tracker Red (1 M) in staining solution for 15 min at 37 C and replaced with fresh complete medium.
Detailed step-by-step operating procedures for NK cell and CTL degranulation assays
 Supplemental methods Detailed step-by-step operating procedures for NK cell and CTL degranulation assays Materials PBMC isolated from patients, relatives and healthy donors as control K562 cells (ATCC,
Blocking antibodies and peptides. Rat anti-mouse PD-1 (29F.1A12, rat IgG2a, k), PD-
, PD-") Supplementary Methods Blocking antibodies and peptides. Rat anti-mouse PD-1 (29F.1A12, rat IgG2a, k), PD- L1 (10F.9G2, rat IgG2b, k), and PD-L2 (3.2, mouse IgG1) have been described (24). Anti-CTLA-4 (clone
Supplementary Methods Blocking antibodies and peptides. Rat anti-mouse PD-1 (29F.1A12, rat IgG2a, k), PD- L1 (10F.9G2, rat IgG2b, k), and PD-L2 (3.2, mouse IgG1) have been described (24). Anti-CTLA-4 (clone
L1 on PyMT tumor cells but Py117 cells are more responsive to IFN-γ. (A) Flow
 Flow") A MHCI B PD-L1 Fold expression 8 6 4 2 Fold expression 3 2 1 No tx 1Gy 2Gy IFN Py117 Py117 Supplementary Figure 1. Radiation and IFN-γ enhance MHCI expression and PD- L1 on PyMT tumor cells but Py117 cells
A MHCI B PD-L1 Fold expression 8 6 4 2 Fold expression 3 2 1 No tx 1Gy 2Gy IFN Py117 Py117 Supplementary Figure 1. Radiation and IFN-γ enhance MHCI expression and PD- L1 on PyMT tumor cells but Py117 cells
ALETA : MODE OF ACTION
 ALETA : MODE OF ACTION Lakshmibai Vasanthakumari Bindhu. PhD ABSTRACT Previous research has shown that beta-glucan has immunomodulatory effects. Paramylon is the beta-glucan found in Aleta and forms granules.
Human and mouse T cell regulation mediated by soluble CD52 interaction with Siglec-10. Esther Bandala-Sanchez, Yuxia Zhang, Simone Reinwald,
 Human and mouse T cell regulation mediated by soluble CD52 interaction with Siglec-1 Esther Bandala-Sanchez, Yuxia Zhang, Simone Reinwald, James A. Dromey, Bo Han Lee, Junyan Qian, Ralph M Böhmer and Leonard
Supplemental information
 Supplemental information PI(3)K p11δ controls the sucellular compartmentalization of TLR4 signaling and protects from endotoxic shock Ezra Aksoy, Salma Taoui, David Torres, Sandrine Delauve, Aderrahman
Serafino et al. Thymosin α1 activates complement receptor-mediated phagocytosis in human monocyte-derived macrophages. SUPPLEMENTARY FIGURES
 Supplementary Fig. S1. Evaluation of the purity and maturation of macrophage cultures tested by flow cytometry. The lymphocytic/monocytic cellular fraction was isolated from buffy coats of healthy donors
Chapter 6. Antigen Presentation to T lymphocytes
 Chapter 6 Antigen Presentation to T lymphocytes Generation of T-cell Receptor Ligands T cells only recognize Ags displayed on cell surfaces These Ags may be derived from pathogens that replicate within
Interferon γ regulates idiopathic pneumonia syndrome, a. Th17 + CD4 + T-cell-mediated GvH disease
 Interferon γ regulates idiopathic pneumonia syndrome, a Th17 + CD4 + T-cell-mediated GvH disease Nora Mauermann, Julia Burian, Christophe von Garnier, Stefan Dirnhofer, Davide Germano, Christine Schuett,
Online supplement. Phenotypic, functional and plasticity features of classical and alternatively activated
 Online supplement Phenotypic, functional and plasticity features of classical and alternatively activated human macrophages Abdullah Al Tarique*, Jayden Logan *, Emma Thomas *, Patrick G Holt *, Peter
VEGFR2-Mediated Vascular Dilation as a Mechanism of VEGF-Induced Anemia and Bone Marrow Cell Mobilization
 Cell Reports, Volume 9 Supplemental Information VEGFR2-Mediated Vascular Dilation as a Mechanism of VEGF-Induced Anemia and Bone Marrow Cell Mobilization Sharon Lim, Yin Zhang, Danfang Zhang, Fang Chen,
J. Cell Sci. 129: doi: /jcs : Supplementary information
 Movie 1. AgLDL is contained in small sub-regions of the lysosomal synapse that are acidic. J774 cells were incubated with agldl dual labeled with a ph sensitive and a ph insensitive fluorophore for 1 hr.
Rapid antigen-specific T cell enrichment (Rapid ARTE)
") Direct ex vivo characterization of human antigen-specific CD154+CD4+ T cell Rapid antigen-specific T cell enrichment (Rapid ARTE) Introduction Workflow Antigen (ag)-specific T cells play a central role
Direct ex vivo characterization of human antigen-specific CD154+CD4+ T cell Rapid antigen-specific T cell enrichment (Rapid ARTE) Introduction Workflow Antigen (ag)-specific T cells play a central role
Phenotype Determines Nanoparticle Uptake by Human
 Phenotype Determines Nanoparticle Uptake by Human Macrophages from Liver and Blood Sonya A. MacParland a,b,, Kim M. Tsoi c,d,, Ben Ouyang c, Xue-Zhong Ma a, Justin Manuel a, Ali Fawaz b, Mario A. Ostrowski
Hua Tang, Weiping Cao, Sudhir Pai Kasturi, Rajesh Ravindran, Helder I Nakaya, Kousik
 SUPPLEMENTARY FIGURES 1-19 T H 2 response to cysteine-proteases requires dendritic cell-basophil cooperation via ROS mediated signaling Hua Tang, Weiping Cao, Sudhir Pai Kasturi, Rajesh Ravindran, Helder
Fig. S1. Subcellular localization of overexpressed LPP3wt-GFP in COS-7 and HeLa cells. Cos7 (top) and HeLa (bottom) cells expressing for 24 h human
 and HeLa (bottom) cells expressing for 24 h human") Fig. S1. Subcellular localization of overexpressed LPP3wt-GFP in COS-7 and HeLa cells. Cos7 (top) and HeLa (bottom) cells expressing for 24 h human LPP3wt-GFP, fixed and stained for GM130 (A) or Golgi97
Fig. S1. Subcellular localization of overexpressed LPP3wt-GFP in COS-7 and HeLa cells. Cos7 (top) and HeLa (bottom) cells expressing for 24 h human LPP3wt-GFP, fixed and stained for GM130 (A) or Golgi97
Supporting Information
 Supporting Information Aldridge et al. 10.1073/pnas.0900655106 Fig. S1. Flow diagram of sublethal (a) and lethal (b) influenza virus infections. (a) Infection of lung epithelial cells by influenza virus
B220 CD4 CD8. Figure 1. Confocal Image of Sensitized HLN. Representative image of a sensitized HLN
 B220 CD4 CD8 Natarajan et al., unpublished data Figure 1. Confocal Image of Sensitized HLN. Representative image of a sensitized HLN showing B cell follicles and T cell areas. 20 µm thick. Image of magnification
Supplementary information
 Supplementary information Lipid peroxidation causes endosomal antigen release for cross-presentation Ilse Dingjan 1, Daniëlle RJ Verboogen 1, Laurent M Paardekooper 1, Natalia H Revelo 1, Simone P Sittig
NK cell flow cytometric assay In vivo DC viability and migration assay
 NK cell flow cytometric assay 6 NK cells were purified, by negative selection with the NK Cell Isolation Kit (Miltenyi iotec), from spleen and lymph nodes of 6 RAG1KO mice, injected the day before with
Supplementary Figure 1.
 Supplementary Figure 1. Female Pro-ins2 -/- mice at 5-6 weeks of age were either inoculated i.p. with a single dose of CVB4 (1x10 5 PFU/mouse) or PBS and treated with αgalcer or control vehicle. On day
Supplementary Figure 1
 Supplementary Figure 1 Identification of IFN-γ-producing CD8 + and CD4 + T cells with naive phenotype by alternative gating and sample-processing strategies. a. Contour 5% probability plots show definition
Direct ex vivo characterization of human antigen-specific CD154 + CD4 + T cells Rapid antigen-reactive T cell enrichment (Rapid ARTE)
") Direct ex vivo characterization of human antigen-specific CD154 + CD4 + T cells Rapid antigen-reactive T cell enrichment (Rapid ARTE) Introduction Workflow Antigen (ag)-specific T cells play a central
Direct ex vivo characterization of human antigen-specific CD154 + CD4 + T cells Rapid antigen-reactive T cell enrichment (Rapid ARTE) Introduction Workflow Antigen (ag)-specific T cells play a central
Suppl Video: Tumor cells (green) and monocytes (white) are seeded on a confluent endothelial
 and monocytes (white) are seeded on a confluent endothelial") Supplementary Information Häuselmann et al. Monocyte induction of E-selectin-mediated endothelial activation releases VE-cadherin junctions to promote tumor cell extravasation in the metastasis cascade
Supplementary Information Häuselmann et al. Monocyte induction of E-selectin-mediated endothelial activation releases VE-cadherin junctions to promote tumor cell extravasation in the metastasis cascade
Use of a camp BRET Sensor to Characterize a Novel Regulation of camp by the Sphingosine-1-phosphate/G 13 Pathway
 Use of a camp BRET Sensor to Characterize a Novel Regulation of camp by the Sphingosine-1-phosphate/G 13 Pathway SUPPLEMENTAL DATA Characterization of the CAMYEL sensor and calculation of intracellular
LPS LPS P6 - + Supplementary Fig. 1.
 P6 LPS - - - + + + - LPS + + - - P6 + Supplementary Fig. 1. Pharmacological inhibition of the JAK/STAT blocks LPS-induced HMGB1 nuclear translocation. RAW 267.4 cells were stimulated with LPS in the absence
Chapter 3. Expression of α5-megfp in Mouse Cortical Neurons. on the β subunit. Signal sequences in the M3-M4 loop of β nachrs bind protein factors to
 22 Chapter 3 Expression of α5-megfp in Mouse Cortical Neurons Subcellular localization of the neuronal nachr subtypes α4β2 and α4β4 depends on the β subunit. Signal sequences in the M3-M4 loop of β nachrs
In vitro human regulatory T cell expansion
 - 1 - Human CD4 + CD25 + regulatory T cell isolation, Workflow in vitro expansion and analysis In vitro human regulatory T cell expansion Introduction Regulatory T (Treg) cells are a subpopulation of T
effect on the upregulation of these cell surface markers. The mean peak fluorescence intensity
 SUPPLEMENTARY FIGURE 1 Supplementary Figure 1 ASIC1 disruption or blockade does not effect in vitro and in vivo antigen-presenting cell activation. (a) Flow cytometric analysis of cell surface molecules
SUPPLEMENTARY INFORMATION
 Supplemental Figure 1. Furin is efficiently deleted in CD4 + and CD8 + T cells. a, Western blot for furin and actin proteins in CD4cre-fur f/f and fur f/f Th1 cells. Wild-type and furin-deficient CD4 +
W/T Itgam -/- F4/80 CD115. F4/80 hi CD115 + F4/80 + CD115 +
 F4/8 % in the peritoneal lavage 6 4 2 p=.15 n.s p=.76 CD115 F4/8 hi CD115 + F4/8 + CD115 + F4/8 hi CD115 + F4/8 + CD115 + MHCII MHCII Supplementary Figure S1. CD11b deficiency affects the cellular responses
B6/COLODR/SPL/11C/83/LAP/#2.006 B6/COLODR/SPL/11C/86/LAP/#2.016 CD11C B6/COLODR/SPL/11C/80/LAP/#2.011 CD11C
 CD3-specific antibody-induced immune tolerance and suppression of autoimmune encephalomyelitis involves TGF-β production through phagocytes digesting apoptotic T cells Sylvain Perruche 1,3, Pin Zhang 1,
T H 1, T H 2 and T H 17 polarization of naïve CD4 + mouse T cells
 A complete workflow for cell preparation, isolation, polarization and analysis T H 1, T H 2 and T H 17 polarization of naïve CD4 + mouse T cells Introduction Workflow CD4 + T helper (T H) cells play a
Therapeutic effect of baicalin on experimental autoimmune encephalomyelitis. is mediated by SOCS3 regulatory pathway
 Therapeutic effect of baicalin on experimental autoimmune encephalomyelitis is mediated by SOCS3 regulatory pathway Yuan Zhang 1,2, Xing Li 1,2, Bogoljub Ciric 1, Cun-gen Ma 3, Bruno Gran 4, Abdolmohamad
Intracellular Vesicular Traffic Chapter 13, Alberts et al.
 Intracellular Vesicular Traffic Chapter 13, Alberts et al. The endocytic and biosynthetic-secretory pathways The intracellular compartments of the eucaryotic ell involved in the biosynthetic-secretory
IP: anti-gfp VPS29-GFP. IP: anti-vps26. IP: anti-gfp - + +
 FAM21 Strump. WASH1 IP: anti- 1 2 3 4 5 6 FAM21 Strump. FKBP IP: anti-gfp VPS29- GFP GFP-FAM21 tail H H/P P H H/P P c FAM21 FKBP Strump. VPS29-GFP IP: anti-gfp 1 2 3 FKBP VPS VPS VPS VPS29 1 = VPS29-GFP
Supplementary Figure S1 (a) (b)
 (b)") Supplementary Figure S1: IC87114 does not affect basal Ca 2+ level nor nicotineinduced Ca 2+ influx. (a) Bovine chromaffin cells were loaded with Fluo-4AM (1 μm) in buffer A containing 0.02% of pluronic
Supplementary Figure S1: IC87114 does not affect basal Ca 2+ level nor nicotineinduced Ca 2+ influx. (a) Bovine chromaffin cells were loaded with Fluo-4AM (1 μm) in buffer A containing 0.02% of pluronic
Figure S1. Generation of inducible PTEN deficient mice and the BMMCs (A) B6.129 Pten loxp/loxp mice were mated with B6.
 B6.129 Pten loxp/loxp mice were mated with B6.") Figure S1. Generation of inducible PTEN deficient mice and the BMMCs (A) B6.129 Pten loxp/loxp mice were mated with B6.129-Gt(ROSA)26Sor tm1(cre/ert2)tyj /J mice. To induce deletion of the Pten locus,
Figure S1. Generation of inducible PTEN deficient mice and the BMMCs (A) B6.129 Pten loxp/loxp mice were mated with B6.129-Gt(ROSA)26Sor tm1(cre/ert2)tyj /J mice. To induce deletion of the Pten locus,
Supplementary Materials for
 www.sciencetranslationalmedicine.org/cgi/content/full/8/352/352ra110/dc1 Supplementary Materials for Spatially selective depletion of tumor-associated regulatory T cells with near-infrared photoimmunotherapy
Supplemental Figure 1. Western blot analysis indicated that MIF was detected in the fractions of
 Supplemental Figure Legends Supplemental Figure 1. Western blot analysis indicated that was detected in the fractions of plasma membrane and cytosol but not in nuclear fraction isolated from Pkd1 null
Solid-in-oil peptide nanocarriers for transcutaneous cancer vaccine delivery. against melanoma
 Supplementary Information for Solid-in-oil peptide nanocarriers for transcutaneous cancer vaccine delivery against melanoma Rie Wakabayashi,,a,b Masato Sakuragi,,a Shuto Kozaka, a Yoshiro Tahara, a Noriho
Supplemental Information. Checkpoint Blockade Immunotherapy. Induces Dynamic Changes. in PD-1 CD8 + Tumor-Infiltrating T Cells
 Immunity, Volume 50 Supplemental Information Checkpoint Blockade Immunotherapy Induces Dynamic Changes in PD-1 CD8 + Tumor-Infiltrating T Cells Sema Kurtulus, Asaf Madi, Giulia Escobar, Max Klapholz, Jackson
Supplemental Information. CD4 + CD25 + Foxp3 + Regulatory T Cells Promote. Th17 Cells In Vitro and Enhance Host Resistance
 Immunity, Volume 34 Supplemental Information D4 + D25 + + Regulatory T ells Promote Th17 ells In Vitro and Enhance Host Resistance in Mouse andida albicans Th17 ell Infection Model Pushpa Pandiyan, Heather
Nature Immunology: doi: /ni Supplementary Figure 1. Cytokine pattern in skin in response to urushiol.
 Supplementary Figure 1 Cytokine pattern in skin in response to urushiol. Wild-type (WT) and CD1a-tg mice (n = 3 per group) were sensitized and challenged with urushiol (uru) or vehicle (veh). Quantitative
Supplementary Figure 1. Ent inhibits LPO activity in a dose- and time-dependent fashion.
 Supplementary Information Supplementary Figure 1. Ent inhibits LPO activity in a dose- and time-dependent fashion. Various concentrations of Ent, DHBA or ABAH were pre-incubated for 10 min with LPO (50
Fig. S1 A. week 4 week 6
 Fig. S1 Trabecular Number Trabecular Thickness number/mm 3.5 3. 2.5 2. 1.5 1..5 mm.45.4.35.3.25.2.15.1.5 SKG-c SKG-A mm 1.4 1.2 1..8.6.4.2 Trabecular Spacing D. week 4 week 6 Figure S1. MicroCT analysis
Programmed necrosis, not apoptosis, is a key mediator of cell loss and DAMP-mediated inflammation in dsrna-induced retinal degeneration
 Programmed necrosis, not apoptosis, is a key mediator of cell loss and DAMP-mediated inflammation in dsrna-induced retinal degeneration The Harvard community has made this article openly available. Please
ROS Activity Assay Kit
 ROS Activity Assay Kit Catalog Number KA3841 200 assays Version: 03 Intended for research use only www.abnova.com Table of Contents Introduction... 3 Background... 3 General Information... 4 Materials
Vesicle Transport. Vesicle pathway: many compartments, interconnected by trafficking routes 3/17/14
 Vesicle Transport Vesicle Formation Curvature (Self Assembly of Coat complex) Sorting (Sorting Complex formation) Regulation (Sar1/Arf1 GTPases) Fission () Membrane Fusion SNARE combinations Tethers Regulation
General Laboratory methods Plasma analysis: Gene Expression Analysis: Immunoblot analysis: Immunohistochemistry:
 General Laboratory methods Plasma analysis: Plasma insulin (Mercodia, Sweden), leptin (duoset, R&D Systems Europe, Abingdon, United Kingdom), IL-6, TNFα and adiponectin levels (Quantikine kits, R&D Systems
Autoimmunity in MFG-E8 deficient mice is associated with altered trafficking and enhanced cross-presentation of apoptotic cell antigens
 Research article Autoimmunity in MFG-E8 deficient mice is associated with altered trafficking and enhanced cross-presentation of apoptotic cell antigens YuFeng Peng 1 and Keith B. Elkon 1,2 1 Division
Supplementary Data Table of Contents:
 Supplementary Data Table of Contents: - Supplementary Methods - Supplementary Figures S1(A-B) - Supplementary Figures S2 (A-B) - Supplementary Figures S3 - Supplementary Figures S4(A-B) - Supplementary
a surface permeabilized
 a surface permeabilized RAW 64.7 P388D1 J774 b CD11b + Ly-6G - Blood Monocytes WT Supplementary Figure 1. Cell surface expression on macrophages and DCs. (a) RAW64.7, P388D1, and J774 cells were subjected
2-Deoxyglucose Assay Kit (Colorimetric)
") 2-Deoxyglucose Assay Kit (Colorimetric) Catalog Number KA3753 100 assays Version: 01 Intended for research use only www.abnova.com Table of Contents Introduction... 3 Background... 3 General Information...
2-Deoxyglucose Assay Kit (Colorimetric) Catalog Number KA3753 100 assays Version: 01 Intended for research use only www.abnova.com Table of Contents Introduction... 3 Background... 3 General Information...
Title of file for HTML: Supplementary Information Description: Supplementary Figures and Supplementary Table
 Title of file for HTML: Supplementary Information Description: Supplementary Figures and Supplementary Table Title of file for HTML: Peer Review File Description: Innate Scavenger Receptor-A regulates
ImageStream cytometer analysis. Cells were cultured as described above in vented-cap
 ImageStream cytometer analysis. Cells were cultured as described above in vented-cap polypropylene tubes, stained with αcd66b-fitc, αm-dc8-pe and αcd56-pe-cy5.5 mabs, washed and fixed with 4 % (w/v) paraformaldehyde.
In vitro human regulatory T cell expansion
 - 1 - Human CD4 + CD25 + CD127 dim/- regulatory T cell Workflow isolation, in vitro expansion and analysis In vitro human regulatory T cell expansion Introduction Regulatory T (Treg) cells are a subpopulation
Essential Medium, containing 10% fetal bovine serum, 100 U/ml penicillin and 100 µg/ml streptomycin. Huvec were cultured in
 Supplemental data Methods Cell culture media formulations A-431 and U-87 MG cells were maintained in Dulbecco s Modified Eagle s Medium. FaDu cells were cultured in Eagle's Minimum Essential Medium, containing
Supplementary Figure 1. Efficient DC depletion in CD11c.DOG transgenic mice
 Supplementary Figure 1. Efficient DC depletion in CD11c.DOG transgenic mice (a) CD11c.DOG transgenic mice (tg) were treated with 8 ng/g body weight (b.w.) diphtheria toxin (DT) i.p. on day -1 and every
SUPPLEMENTAL MATERIAL. Number of patients 14
 SUPPLEMENTAL MATERIAL Supplemental Table 1 Number of patients 14 Age, years 54.9 ± 10.0 Female gender, n (%) 6 (42.9) Diabetes, n (%) 2 (14.3) History of hypertension, n (%) 5 (35.7) Ever smoker, n (%)
Supplementary Figure 1 Protease allergens induce IgE and IgG1 production. (a-c)
") 1 Supplementary Figure 1 Protease allergens induce IgE and IgG1 production. (a-c) Serum IgG1 (a), IgM (b) and IgG2 (c) concentrations in response to papain immediately before primary immunization (day
1 Supplementary Figure 1 Protease allergens induce IgE and IgG1 production. (a-c) Serum IgG1 (a), IgM (b) and IgG2 (c) concentrations in response to papain immediately before primary immunization (day
Cover Page. The handle holds various files of this Leiden University dissertation.
 Cover Page The handle http://hdl.handle.net/1887/23854 holds various files of this Leiden University dissertation. Author: Marel, Sander van der Title: Gene and cell therapy based treatment strategies
SUPPLEMENTARY FIGURES
 SUPPLEMENTARY FIGURES Supplementary Figure 1. (A) Left, western blot analysis of ISGylated proteins in Jurkat T cells treated with 1000U ml -1 IFN for 16h (IFN) or left untreated (CONT); right, western
Interleukin-2-Dependent Allergen-Specific Tissue-Resident Memory Cells Drive Asthma
 Immunity Supplemental Information Interleukin-2-Dependent Allergen-Specific Tissue-Resident Memory Cells Drive Asthma Brian D. Hondowicz, Dowon An, Jason M. Schenkel, Karen S. Kim, Holly R. Steach, Akshay
Supplementary Data 1. Alanine substitutions and position variants of APNCYGNIPL. Applied in
 Supplementary Data 1. Alanine substitutions and position variants of APNCYGNIPL. Applied in Supplementary Fig. 2 Substitution Sequence Position variant Sequence original APNCYGNIPL original APNCYGNIPL
well for 2 h at rt. Each dot represents an individual mouse and bar is the mean ±
 Supplementary data: Control DC Blimp-1 ko DC 8 6 4 2-2 IL-1β p=.5 medium 8 6 4 2 IL-2 Medium p=.16 8 6 4 2 IL-6 medium p=.3 5 4 3 2 1-1 medium IL-1 n.s. 25 2 15 1 5 IL-12(p7) p=.15 5 IFNγ p=.65 4 3 2 1
Supplemental Materials Molecular Biology of the Cell
 Supplemental Materials Molecular Biology of the Cell Gilberti et al. SUPPLEMENTAL FIGURE LEGENDS: Figure S1: The effect of pharmacological inhibitors on particle uptake. The data presented in Figure 1
Supplemental Figure 1
 Supplemental Figure 1 1a 1c PD-1 MFI fold change 6 5 4 3 2 1 IL-1α IL-2 IL-4 IL-6 IL-1 IL-12 IL-13 IL-15 IL-17 IL-18 IL-21 IL-23 IFN-α Mut Human PD-1 promoter SBE-D 5 -GTCTG- -1.2kb SBE-P -CAGAC- -1.kb
Optimization of a LanthaScreen Kinase assay for ZAP70
 Optimization of a LanthaScreen Kinase assay for ZAP70 Overview This protocol describes how to develop a LanthaScreen kinase assay designed to detect and characterize kinase inhibitors. The development
Supplemental Table I.
 Supplemental Table I Male / Mean ± SEM n Mean ± SEM n Body weight, g 29.2±0.4 17 29.7±0.5 17 Total cholesterol, mg/dl 534.0±30.8 17 561.6±26.1 17 HDL-cholesterol, mg/dl 9.6±0.8 17 10.1±0.7 17 Triglycerides,
Supplementary Figure 1: TSLP receptor skin expression in dcssc. A: Healthy control (HC) skin with TSLP receptor expression in brown (10x
 skin with TSLP receptor expression in brown (10x") Supplementary Figure 1: TSLP receptor skin expression in dcssc. A: Healthy control (HC) skin with TSLP receptor expression in brown (10x magnification). B: Second HC skin stained for TSLP receptor in brown
Supplementary Figure 1: TSLP receptor skin expression in dcssc. A: Healthy control (HC) skin with TSLP receptor expression in brown (10x magnification). B: Second HC skin stained for TSLP receptor in brown
Optimization of the Fuse-It-mRNA Protocol for L929 Cells in the µ-plate 24 Well
 Optimization of the Fuse-It-mRNA Protocol for L929 Cells in the µ-plate 24 Well 1. General Information... 1 2. Background... 1 3. Material and Equipment Required... 2 4. Experimental Procedure and Results...