Nature Structural & Molecular Biology: doi: /nsmb Supplementary Figure 1. Differential expression of mirnas from the pri-mir-17-92a locus.
|
|
|
- Audrey Parker
- 5 years ago
- Views:
Transcription
1 Supplementary Figure 1 Differential expression of mirnas from the pri-mir-17-92a locus. (a) The mir-17-92a expression unit in the third intron of the host mir-17hg transcript. (b,c) Impact of knockdown of Ago1-4 on mirna expression from the mir-17-92a locus, quantified by RT-qPCR (b) and the Ago knockdown efficiency was verified by Western blotting (c). (d,e) Impact of knockdown of Dicer on mirna expression from the mir-17-92a locus, quantified by RT-qPCR (d) and the Dicer knockdown efficiency verified by Western blotting (e). Uncropped images of Western blots in c and e are shown in Supplementary Data Set 1. Data in b,d are presented as mean ± SEM (n=3, technical replicates). *P < 0.05; **P < 0.01; ***P < 0.001, determined by two-tailed Student s t test. Source data are reported in Source Data for Supplementary Figure 1.
2
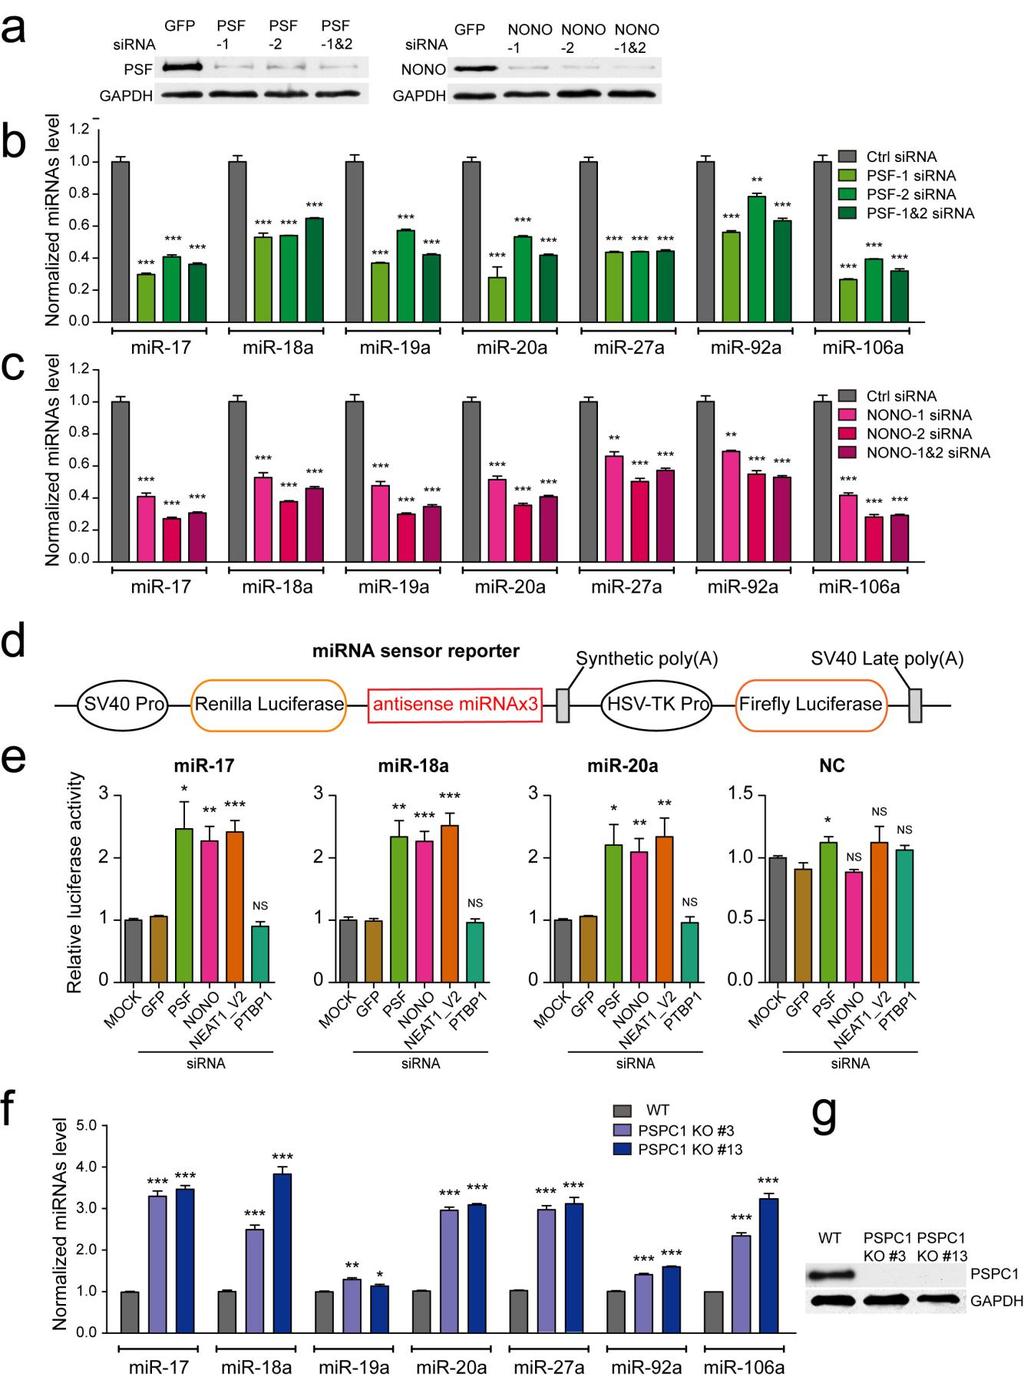
3 Supplementary Figure 2 Evidence for the involvement of paraspeckle-associated proteins and NEAT1 in mirna biogenesis. (a) The knockdown efficiencies of PSF (left) and NONO (right) were verified by Western blotting. (b,c) Ablation of paraspeckle key components PSF (b) or NONO (c) down regulated representative mirnas as indicated. (d) Illustration of mirna sensor reporters: Individual antisense mirnas were cloned into the 3 UTR of the Renilla luciferase in psicheck2. Reduced mirna expression would stabilize the Renilla mrna, thus increasing the relative luciferase activity. (e) Levels of mirna sensor reporters in response to knockdown of individual paraspeckle-associated proteins or NEAT1. GFP and the RNA binding protein PTB1 served as controls. (f) Knockout of PSPC1 by CRISPR up-regulates representative mirnas as indicated. (g) The absence of PSPC1 was verified by Western blotting in two independent cell lines. Uncropped images of Western blots in a,g are shown in Supplementary Data Set 1. Data in b,c,e,f are presented as mean ± SEM (n=3, technical replicates for b,c,f; n=4, cell culture for e). *P < 0.05; **P < 0.01; ***P < 0.001; NS, not significant, determined by two-tailed Student s t test. Source data are reported in Source Data for Supplementary Figure 2.
, NONO and PSPC1 co-localized in paraspeckles.")
4 Supplementary Figure 3 Interrelationship of paraspeckle associated proteins and RNA. (a) HeLa cells were immunostained with anti-nono (green) and anti-pspc1 (red) antibodies. DAPI was used to indicate nucleus. In wild-type cells (WT), NONO and PSPC1 co-localized in paraspeckles. In response to knockdown (KD) of PSF (second raw) or NONO (third raw), the paraspeckle marker PSCP1 no longer showed foci. In contrast, in PSPC1 knockout (KO) cells, NONO continued to show foci. Scale bars, 10 μm. (b) RT-qPCR was performed to confirm NEAT1 knockdown with a stealth sirna and the impact on mirna expression. (c-f) Western blot analysis of the Microprocessor Drosha/DGCR8 and a panel of other paraspeckle-associated RBPs upon knockdown of paraspeckle-associated proteins or NEAT1. Data in b are presented as mean ± SEM (n=3, technical replicates). *P < 0.05; **P < 0.01; ***P < 0.001, determined by two-tailed Student s t test. Source data are reported in Source Data for Supplementary Figure 3. Uncropped images of Western blots are shown in Supplementary Data Set 1.
 Counts of reference sequences (trnas, snornas, spike-in RNA, rrnas) between duplicated small RNA-seq libraries from sigfp-treated cells (a) or between sipsf and sigfp-treated cells (b).")
5 Supplementary Figure 4 mirna profiling by small RNA-seq and validation by RT-qPCR. (a,b) Counts of reference sequences (trnas, snornas, spike-in RNA, rrnas) between duplicated small RNA-seq libraries from sigfp-treated cells (a) or between sipsf and sigfp-treated cells (b). (c,d) Correlation of mirna counts between duplicated libraries from sigfp-treated (c) or sipsf-treated HeLa cells (d). (e) A panel of mirnas validated by RT-qPCR. (f) Heatmap representation of validated mirna expression from the mir-17-92a locus (left) or other pri-mirnas (right) in response to knockdown of various paraspeckle-associated proteins or NEAT1 as indicated. Data in e are presented as mean ± SEM (n=3, technical replicates). **P < 0.01; ***P < 0.001; NS, not significant, determined by two-tailed Student s t test. Data source data are reported in Source Data for Supplementary Figure 4.
 The anti-psf immunoprecipitated complex trimmed with two different concentrations of MNase (1: 1,000 or 1: 50,000 dilution) and analyzed by autoradiography (bottom panel) and Western blotting")
6 Supplementary Figure 5 CLIP-seq analysis of PSF/NONO interactions with RNA. (a) The anti-psf immunoprecipitated complex trimmed with two different concentrations of MNase (1: 1,000 or 1: 50,000 dilution) and analyzed by autoradiography (bottom panel) and Western blotting (upper panel). (b) Reproducibility between independently constructed CLIP-seq libraries for NONO and PSF. Global comparison was performed with 1 Kb-binned genome. (c) The genomic distribution of NONO and PSF CLIP-seq peaks. (d) Additional examples of NONO and PSF binding on a set of pri-mirnas in HeLa cell. Uncropped images of Western blots and autoradiography in a are shown in Supplementary Data Set 1.
7 Supplementary Figure 6 Exogenous DGCR8 interacts with endogenous NONO. (a) The pri-mirna-based reporter assay for pri-mir-612 processing relative to pri-mir-17-92a processing in response to knockdown of the Microprocessor. (b) Detection of FLAG-tagged DGCR8 in anti-nono immunoprecipitant. (c) Detection of NONO in FLAG-tagged DGCR8 immunoprecipitant. * indicates IgG heavy chain. Data are shown in a as mean ± SEM (n=3, cell culture). *P < 0.05; ***P < 0.001; NS, not significant, determined by two-tailed Student s t test. Data source are reported in Source Data for Supplementary Figure 6. Uncropped images of Western blots in b and c are shown in Supplementary Data Set 1.
Supplementary Figure 1: si-craf but not si-braf sensitizes tumor cells to radiation.
 Supplementary Figure 1: si-craf but not si-braf sensitizes tumor cells to radiation. (a) Embryonic fibroblasts isolated from wildtype (WT), BRAF -/-, or CRAF -/- mice were irradiated (6 Gy) and DNA damage
Supplementary Fig. 1. GPRC5A post-transcriptionally down-regulates EGFR expression. (a) Plot of the changes in steady state mrna levels versus
 Plot of the changes in steady state mrna levels versus") Supplementary Fig. 1. GPRC5A post-transcriptionally down-regulates EGFR expression. (a) Plot of the changes in steady state mrna levels versus changes in corresponding proteins between wild type and Gprc5a-/-
Supplementary Fig. 1. GPRC5A post-transcriptionally down-regulates EGFR expression. (a) Plot of the changes in steady state mrna levels versus changes in corresponding proteins between wild type and Gprc5a-/-
Supplementary information
 Supplementary information Human Cytomegalovirus MicroRNA mir-us4-1 Inhibits CD8 + T Cell Response by Targeting ERAP1 Sungchul Kim, Sanghyun Lee, Jinwook Shin, Youngkyun Kim, Irini Evnouchidou, Donghyun
(a) Significant biological processes (upper panel) and disease biomarkers (lower panel)
 Significant biological processes (upper panel) and disease biomarkers (lower panel)") Supplementary Figure 1. Functional enrichment analyses of secretomic proteins. (a) Significant biological processes (upper panel) and disease biomarkers (lower panel) 2 involved by hrab37-mediated secretory
Supplementary Figure 1. Functional enrichment analyses of secretomic proteins. (a) Significant biological processes (upper panel) and disease biomarkers (lower panel) 2 involved by hrab37-mediated secretory
Supplementary Figure 1. Confocal immunofluorescence showing mitochondrial translocation of Drp1. Cardiomyocytes treated with H 2 O 2 were prestained
 Supplementary Figure 1. Confocal immunofluorescence showing mitochondrial translocation of Drp1. Cardiomyocytes treated with H 2 O 2 were prestained with MitoTracker (red), then were immunostained with
Supplementary Figure 1 IL-27 IL
 Tim-3 Supplementary Figure 1 Tc0 49.5 0.6 Tc1 63.5 0.84 Un 49.8 0.16 35.5 0.16 10 4 61.2 5.53 10 3 64.5 5.66 10 2 10 1 10 0 31 2.22 10 0 10 1 10 2 10 3 10 4 IL-10 28.2 1.69 IL-27 Supplementary Figure 1.
Supplementary Figure 1. SC35M polymerase activity in the presence of Bat or SC35M NP encoded from the phw2000 rescue plasmid.
 1 2 3 4 5 6 7 8 9 10 11 12 13 14 15 16 17 18 19 20 21 22 23 24 25 26 27 Supplementary Figure 1. SC35M polymerase activity in the presence of Bat or SC35M NP encoded from the phw2000 rescue plasmid. HEK293T
Table S1. Primer sequences used for qrt-pcr. CACCATTGGCAATGAGCGGTTC AGGTCTTTGCGGATGTCCACGT ACTB AAGTCCATGTGCTGGCAGCACT ATCACCACTCCGAAGTCCGTCT LCOR
 Table S1. Primer sequences used for qrt-pcr. ACTB LCOR KLF6 CTBP1 CDKN1A CDH1 ATF3 PLAU MMP9 TFPI2 CACCATTGGCAATGAGCGGTTC AGGTCTTTGCGGATGTCCACGT AAGTCCATGTGCTGGCAGCACT ATCACCACTCCGAAGTCCGTCT CGGCTGCAGGAAAGTTTACA
Supplementary Figure 1. Quantile-quantile (Q-Q) plots. (Panel A) Q-Q plot graphical
 plots. (Panel A) Q-Q plot graphical") Supplementary Figure 1. Quantile-quantile (Q-Q) plots. (Panel A) Q-Q plot graphical representation using all SNPs (n= 13,515,798) including the region on chromosome 1 including SORT1 which was previously
Supplementary Figure 1. Quantile-quantile (Q-Q) plots. (Panel A) Q-Q plot graphical representation using all SNPs (n= 13,515,798) including the region on chromosome 1 including SORT1 which was previously
Supplementary Information
 Supplementary Information Supplementary Figure 1. Effect of mir mimics and anti-mirs on DTPs a, Representative fluorescence microscopy images of GFP vector control or mir mimicexpressing parental and DTP
RNA interference induced hepatotoxicity results from loss of the first synthesized isoform of microrna-122 in mice
 SUPPLEMENTARY INFORMATION RNA interference induced hepatotoxicity results from loss of the first synthesized isoform of microrna-122 in mice Paul N Valdmanis, Shuo Gu, Kirk Chu, Lan Jin, Feijie Zhang,
Supplementary Materials
 Supplementary Materials Supplementary Figure S1 Regulation of Ubl4A stability by its assembly partner A, The translation rate of Ubl4A is not affected in the absence of Bag6. Control, Bag6 and Ubl4A CRISPR
Supplementary Figure 1
 Supplementary Figure 1 Supplementary Figure 1 Schematic depiction of the tandem Fc GDF15. Supplementary Figure 2 Supplementary Figure 2 Gfral mrna levels in the brains of both wild-type and knockout Gfral
SUPPLEMENTARY INFORMATION
 doi:10.1038/nature12652 Supplementary Figure 1. PRDM16 interacts with endogenous EHMT1 in brown adipocytes. Immunoprecipitation of PRDM16 complex by flag antibody (M2) followed by Western blot analysis
Supplementary Information
 Supplementary Information mediates STAT3 activation at retromer-positive structures to promote colitis and colitis-associated carcinogenesis Zhang et al. a b d e g h Rel. Luc. Act. Rel. mrna Rel. mrna
Scaffold function of long noncoding RNA HOTAIR in protein ubiquitination
 Yoon et al, page Scaffold function of long noncoding RNA HOTAIR in protein ubiquitination Je-Hyun Yoon,, Kotb Abdelmohsen, Jiyoung Kim, Xiaoling Yang, Jennifer L. Martindale, Kumiko Tominaga-Yamanaka,
X P. Supplementary Figure 1. Nature Medicine: doi: /nm Nilotinib LSK LT-HSC. Cytoplasm. Cytoplasm. Nucleus. Nucleus
 a b c Supplementary Figure 1 c-kit-apc-eflu780 Lin-FITC Flt3-Linc-Kit-APC-eflu780 LSK Sca-1-PE-Cy7 d e f CD48-APC LT-HSC CD150-PerCP-cy5.5 g h i j Cytoplasm RCC1 X Exp 5 mir 126 SPRED1 SPRED1 RAN P SPRED1
Supplementary Figure 1. Normal T lymphocyte populations in Dapk -/- mice. (a) Normal thymic development in Dapk -/- mice. Thymocytes from WT and Dapk
 Normal thymic development in Dapk -/- mice. Thymocytes from WT and Dapk") Supplementary Figure 1. Normal T lymphocyte populations in Dapk -/- mice. (a) Normal thymic development in Dapk -/- mice. Thymocytes from WT and Dapk -/- mice were stained for expression of CD4 and CD8.
Supplementary Figure 1. Normal T lymphocyte populations in Dapk -/- mice. (a) Normal thymic development in Dapk -/- mice. Thymocytes from WT and Dapk -/- mice were stained for expression of CD4 and CD8.
Soft Agar Assay. For each cell pool, 100,000 cells were resuspended in 0.35% (w/v)
") SUPPLEMENTARY MATERIAL AND METHODS Soft Agar Assay. For each cell pool, 100,000 cells were resuspended in 0.35% (w/v) top agar (LONZA, SeaKem LE Agarose cat.5004) and plated onto 0.5% (w/v) basal agar.
SUPPLEMENTARY MATERIAL AND METHODS Soft Agar Assay. For each cell pool, 100,000 cells were resuspended in 0.35% (w/v) top agar (LONZA, SeaKem LE Agarose cat.5004) and plated onto 0.5% (w/v) basal agar.
Supplemental Figure S1. PLAG1 kidneys contain fewer glomeruli (A) Quantitative PCR for Igf2 and PLAG1 in whole kidneys taken from mice at E15.
 Quantitative PCR for Igf2 and PLAG1 in whole kidneys taken from mice at E15.") Supplemental Figure S1. PLAG1 kidneys contain fewer glomeruli (A) Quantitative PCR for Igf2 and PLAG1 in whole kidneys taken from mice at E15.5, E18.5, P4, and P8. Values shown are means from four technical
Supplemental Figure S1. PLAG1 kidneys contain fewer glomeruli (A) Quantitative PCR for Igf2 and PLAG1 in whole kidneys taken from mice at E15.5, E18.5, P4, and P8. Values shown are means from four technical
Supplementary Figure 1.TRIM33 binds β-catenin in the nucleus. a & b, Co-IP of endogenous TRIM33 with β-catenin in HT-29 cells (a) and HEK 293T cells
 and HEK 293T cells") Supplementary Figure 1.TRIM33 binds β-catenin in the nucleus. a & b, Co-IP of endogenous TRIM33 with β-catenin in HT-29 cells (a) and HEK 293T cells (b). TRIM33 was immunoprecipitated, and the amount of
Supplementary Figure 1.TRIM33 binds β-catenin in the nucleus. a & b, Co-IP of endogenous TRIM33 with β-catenin in HT-29 cells (a) and HEK 293T cells (b). TRIM33 was immunoprecipitated, and the amount of
SUPPLEMENTARY INFORMATION
 doi:10.1038/nature12215 Supplementary Figure 1. The effects of full and dissociated GR agonists in supporting BFU-E self-renewal divisions. BFU-Es were cultured in self-renewal medium with indicated GR
Dynamic Interaction of Stress Granule, DDX3X and IKK-α Mediates Multiple Functions in
 Dynamic Interaction of Stress Granule, and Mediates Multiple Functions in Hepatitis C Virus Infection Véronique Pène, Qisheng Li#, Catherine Sodroski, Ching-Sheng Hsu, T. Jake Liang# Liver Diseases Branch,
Supplementary Figure 1 IMQ-Induced Mouse Model of Psoriasis. IMQ cream was
 Supplementary Figure 1 IMQ-Induced Mouse Model of Psoriasis. IMQ cream was painted on the shaved back skin of CBL/J and BALB/c mice for consecutive days. (a, b) Phenotypic presentation of mouse back skin
Supplementary Figure 1. Establishment of prostacyclin-secreting hmscs. (a) PCR showed the integration of the COX-1-10aa-PGIS transgene into the
 PCR showed the integration of the COX-1-10aa-PGIS transgene into the") Supplementary Figure 1. Establishment of prostacyclin-secreting hmscs. (a) PCR showed the integration of the COX-1-10aa-PGIS transgene into the genomic DNA of hmscs (PGI2- hmscs). Native hmscs and plasmid
Supplementary Figure 1. Establishment of prostacyclin-secreting hmscs. (a) PCR showed the integration of the COX-1-10aa-PGIS transgene into the genomic DNA of hmscs (PGI2- hmscs). Native hmscs and plasmid
7SK ChIRP-seq is specifically RNA dependent and conserved between mice and humans.
 Supplementary Figure 1 7SK ChIRP-seq is specifically RNA dependent and conserved between mice and humans. Regions targeted by the Even and Odd ChIRP probes mapped to a secondary structure model 56 of the
Nature Genetics: doi: /ng.3731
 Supplementary Figure 1 Circadian profiles of Adarb1 transcript and ADARB1 protein in mouse tissues. (a) Overlap of rhythmic transcripts identified in the previous transcriptome analyses. The mouse liver
m 6 A mrna methylation regulates AKT activity to promote the proliferation and tumorigenicity of endometrial cancer
 SUPPLEMENTARY INFORMATION Articles https://doi.org/10.1038/s41556-018-0174-4 In the format provided by the authors and unedited. m 6 A mrna methylation regulates AKT activity to promote the proliferation
Supplementary Figure 1. mir124 does not change neuron morphology and synaptic
 Supplementary Figure 1. mir124 does not change neuron morphology and synaptic density. Hippocampal neurons were transfected with mir124 (containing DsRed) or DsRed as a control. 2 d after transfection,
supplementary information
 DOI: 10.1038/ncb2157 Figure S1 Immobilization of histone pre-mrna to chromatin leads to formation of histone locus body with associated Cajal body. Endogenous histone H2b(e) pre-mrna is processed with
RAW264.7 cells stably expressing control shrna (Con) or GSK3b-specific shrna (sh-
 or GSK3b-specific shrna (sh-") 1 a b Supplementary Figure 1. Effects of GSK3b knockdown on poly I:C-induced cytokine production. RAW264.7 cells stably expressing control shrna (Con) or GSK3b-specific shrna (sh- GSK3b) were stimulated
1 a b Supplementary Figure 1. Effects of GSK3b knockdown on poly I:C-induced cytokine production. RAW264.7 cells stably expressing control shrna (Con) or GSK3b-specific shrna (sh- GSK3b) were stimulated
SUPPLEMENTARY INFORMATION
 DOI: 10.1038/ncb2607 Figure S1 Elf5 loss promotes EMT in mammary epithelium while Elf5 overexpression inhibits TGFβ induced EMT. (a, c) Different confocal slices through the Z stack image. (b, d) 3D rendering
Supplementary Figure S1. Venn diagram analysis of mrna microarray data and mirna target analysis. (a) Western blot analysis of T lymphoblasts (CLS)
 Western blot analysis of T lymphoblasts (CLS)") Supplementary Figure S1. Venn diagram analysis of mrna microarray data and mirna target analysis. (a) Western blot analysis of T lymphoblasts (CLS) and their exosomes (EXO) in resting (REST) and activated
Supplementary Figure S1. Venn diagram analysis of mrna microarray data and mirna target analysis. (a) Western blot analysis of T lymphoblasts (CLS) and their exosomes (EXO) in resting (REST) and activated
Supplementary Figure 1. MAT IIα is Acetylated at Lysine 81.
 IP: Flag a Mascot PTM Modified Mass Error Position Gene Names Score Score Sequence m/z [ppm] 81 MAT2A;AMS2;MATA2 35.6 137.28 _AAVDYQK(ac)VVR_ 595.83-2.28 b Pre-immu After-immu Flag- WT K81R WT K81R / Flag
Supplementary Figure 1
 Supplementary Figure 1 Asymmetrical function of 5p and 3p arms of mir-181 and mir-30 families and mir-142 and mir-154. (a) Control experiments using mirna sensor vector and empty pri-mirna overexpression
A Normal Exencephaly Craniora- Spina bifida Microcephaly chischisis. Midbrain Forebrain/ Forebrain/ Hindbrain Spinal cord Hindbrain Hindbrain
 A Normal Exencephaly Craniora- Spina bifida Microcephaly chischisis NTD Number of embryos % among NTD Embryos Exencephaly 52 74.3% Craniorachischisis 6 8.6% Spina bifida 5 7.1% Microcephaly 7 1% B Normal
Supplementary Figures
 Supplementary Figures Supplementary Figure 1 Characterization of stable expression of GlucB and sshbira in the CT26 cell line (a) Live cell imaging of stable CT26 cells expressing green fluorescent protein
File Name: Supplementary Information Description: Supplementary Figures and Supplementary Tables. File Name: Peer Review File Description:
 File Name: Supplementary Information Description: Supplementary Figures and Supplementary Tables File Name: Peer Review File Description: Primer Name Sequence (5'-3') AT ( C) RT-PCR USP21 F 5'-TTCCCATGGCTCCTTCCACATGAT-3'
SUPPLEMENTARY INFORMATION
 -. -. SUPPLEMENTARY INFORMATION DOI: 1.1/ncb86 a WAT-1 WAT- BAT-1 BAT- sk-muscle-1 sk-muscle- mir-133b mir-133a mir-6 mir-378 mir-1 mir-85 mir-378 mir-6a mir-18 mir-133a mir- mir- mir-341 mir-196a mir-17
Control shrna#9 shrna#12. shrna#12 CD14-PE CD14-PE
 a Control shrna#9 shrna#12 c Control shrna#9 shrna#12 e Control shrna#9 shrna#12 h 14 12 CFU-E BFU-E GEMM GM b Colony number 7 6 5 4 3 2 1 6 pm A pa pc CFU-E BFU-E GEMM GM pu pgm A p pg B d f CD11b-APC
well for 2 h at rt. Each dot represents an individual mouse and bar is the mean ±
 Supplementary data: Control DC Blimp-1 ko DC 8 6 4 2-2 IL-1β p=.5 medium 8 6 4 2 IL-2 Medium p=.16 8 6 4 2 IL-6 medium p=.3 5 4 3 2 1-1 medium IL-1 n.s. 25 2 15 1 5 IL-12(p7) p=.15 5 IFNγ p=.65 4 3 2 1
SUPPLEMENTARY INFORMATION
 DOI: 10.1038/ncb2211 a! mir-143! b! mir-103/107! let-7a! mir-144! mir-122a! mir-126-3p! mir-194! mir-27a! mir-30c! Figure S1 Northern blot analysis of mir-143 expression dependent on feeding conditions.
SUPPLEMENTARY INFORMATION
 DOI: 10.1038/ncb2566 Figure S1 CDKL5 protein expression pattern and localization in mouse brain. (a) Multiple-tissue western blot from a postnatal day (P) 21 mouse probed with an antibody against CDKL5.
SUPPLEMENTAL FIGURE LEGENDS
 SUPPLEMENTAL FIGURE LEGENDS Supplemental Figure S1: Endogenous interaction between RNF2 and H2AX: Whole cell extracts from 293T were subjected to immunoprecipitation with anti-rnf2 or anti-γ-h2ax antibodies
P. Mathijs Voorhoeve, Carlos le Sage, Mariette Schrier, Ad J.M. Gillis, Hans Stoop,
 Supplemental Data A Genetic Screen Implicates mirna-372 and mirna-373 As Oncogenes in Testicular Germ Cell Tumors P. Mathijs Voorhoeve, Carlos le Sage, Mariette Schrier, Ad J.M. Gillis, Hans Stoop, Remco
Supplementary figures
 Supplementary figures Supplementary Figure 1. B cells stimulated with pokeweed mitogen display normal mitotic figures but not cells infected with B95-8. The figures show cells stimulated with pokeweed
Circular RNAs (circrnas) act a stable mirna sponges
 act a stable mirna sponges") Circular RNAs (circrnas) act a stable mirna sponges cernas compete for mirnas Ancestal mrna (+3 UTR) Pseudogene RNA (+3 UTR homolgy region) The model holds true for all RNAs that share a mirna binding
Circular RNAs (circrnas) act a stable mirna sponges cernas compete for mirnas Ancestal mrna (+3 UTR) Pseudogene RNA (+3 UTR homolgy region) The model holds true for all RNAs that share a mirna binding
Supplementary Figure 1 hlrrk2 promotes CAP dependent protein translation.
 ` Supplementary Figure 1 hlrrk2 promotes CAP dependent protein translation. (a) Overexpression of hlrrk2 in HeLa cells enhances total protein synthesis in [35S] methionine/cysteine incorporation assays.
Supplementary Figure 1. Baf60c and baf180 are induced during cardiac regeneration in zebrafish. RNA in situ hybridization was performed on paraffin
 Supplementary Figure 1. Baf60c and baf180 are induced during cardiac regeneration in zebrafish. RNA in situ hybridization was performed on paraffin sections from sham-operated adult hearts (a and i) and
Supplementary Figure S1. Gene expression analysis of epidermal marker genes and TP63.
 Supplementary Figure Legends Supplementary Figure S1. Gene expression analysis of epidermal marker genes and TP63. A. Screenshot of the UCSC genome browser from normalized RNAPII and RNA-seq ChIP-seq data
IP: anti-gfp VPS29-GFP. IP: anti-vps26. IP: anti-gfp - + +
 FAM21 Strump. WASH1 IP: anti- 1 2 3 4 5 6 FAM21 Strump. FKBP IP: anti-gfp VPS29- GFP GFP-FAM21 tail H H/P P H H/P P c FAM21 FKBP Strump. VPS29-GFP IP: anti-gfp 1 2 3 FKBP VPS VPS VPS VPS29 1 = VPS29-GFP
SUPPLEMENTARY FIGURES
 SUPPLEMENTARY FIGURES 1 Supplementary Figure 1, Adult hippocampal QNPs and TAPs uniformly express REST a-b) Confocal images of adult hippocampal mouse sections showing GFAP (green), Sox2 (red), and REST
(a) Schematic diagram of the FS mutation of UVRAG in exon 8 containing the highly instable
 Schematic diagram of the FS mutation of UVRAG in exon 8 containing the highly instable") Supplementary Figure 1. Frameshift (FS) mutation in UVRAG. (a) Schematic diagram of the FS mutation of UVRAG in exon 8 containing the highly instable A 10 DNA repeat, generating a premature stop codon
Supplementary Figure 1. Frameshift (FS) mutation in UVRAG. (a) Schematic diagram of the FS mutation of UVRAG in exon 8 containing the highly instable A 10 DNA repeat, generating a premature stop codon
Comparison of open chromatin regions between dentate granule cells and other tissues and neural cell types.
 Supplementary Figure 1 Comparison of open chromatin regions between dentate granule cells and other tissues and neural cell types. (a) Pearson correlation heatmap among open chromatin profiles of different
Supporting Information. FADD regulates NF-кB activation and promotes ubiquitination of cflip L to induce. apoptosis
 1 2 Supporting Information 3 4 5 FADD regulates NF-кB activation and promotes ubiquitination of cflip L to induce apoptosis 6 7 Kishu Ranjan and Chandramani Pathak* 8 9 Department of Cell Biology, School
Supplementary Fig. 1. Delivery of mirnas via Red Fluorescent Protein.
 prfp-vector RFP Exon1 Intron RFP Exon2 prfp-mir-124 mir-93/124 RFP Exon1 Intron RFP Exon2 Untransfected prfp-vector prfp-mir-93 prfp-mir-124 Supplementary Fig. 1. Delivery of mirnas via Red Fluorescent
Effects of UBL5 knockdown on cell cycle distribution and sister chromatid cohesion
 Supplementary Figure S1. Effects of UBL5 knockdown on cell cycle distribution and sister chromatid cohesion A. Representative examples of flow cytometry profiles of HeLa cells transfected with indicated
Supplemental Figure 1
 Supplemental Figure 1 1a 1c PD-1 MFI fold change 6 5 4 3 2 1 IL-1α IL-2 IL-4 IL-6 IL-1 IL-12 IL-13 IL-15 IL-17 IL-18 IL-21 IL-23 IFN-α Mut Human PD-1 promoter SBE-D 5 -GTCTG- -1.2kb SBE-P -CAGAC- -1.kb
Supplemental Table S1
 Supplemental Table S. Tumorigenicity and metastatic potential of 44SQ cell subpopulations a Tumorigenicity b Average tumor volume (mm ) c Lung metastasis d CD high /4 8. 8/ CD low /4 6./ a Mice were injected
SUPPLEMENTARY INFORMATION
 DOI:.38/ncb2822 a MTC02 FAO cells EEA1 b +/+ MEFs /DAPI -/- MEFs /DAPI -/- MEFs //DAPI c HEK 293 cells WCE N M C P AKT TBC1D7 Lamin A/C EEA1 VDAC d HeLa cells WCE N M C P AKT Lamin A/C EEA1 VDAC Figure
Supplementary Figures
 Supplementary Figures Supplementary Figure 1. Confirmation of Dnmt1 conditional knockout out mice. a, Representative images of sorted stem (Lin - CD49f high CD24 + ), luminal (Lin - CD49f low CD24 + )
Supplementary Material
 Supplementary Material Summary: The supplementary information includes 1 table (Table S1) and 4 figures (Figure S1 to S4). Supplementary Figure Legends Figure S1 RTL-bearing nude mouse model. (A) Tumor
Figure S1. Reduction in glomerular mir-146a levels correlate with progression to higher albuminuria in diabetic patients.
 Supplementary Materials Supplementary Figures Figure S1. Reduction in glomerular mir-146a levels correlate with progression to higher albuminuria in diabetic patients. Figure S2. Expression level of podocyte
sirna count per 50 kb small RNAs matching the direct strand Repeat length (bp) per 50 kb repeats in the chromosome
 per 50 kb repeats in the chromosome") Qi et al. 26-3-2564C Qi et al., Figure S1 sirna count per 5 kb small RNAs matching the direct strand sirna count per 5 kb small RNAs matching the complementary strand Repeat length (bp) per 5 kb repeats
Qi et al. 26-3-2564C Qi et al., Figure S1 sirna count per 5 kb small RNAs matching the direct strand sirna count per 5 kb small RNAs matching the complementary strand Repeat length (bp) per 5 kb repeats
PREPARED FOR: U.S. Army Medical Research and Materiel Command Fort Detrick, Maryland
 AD Award Number: W81XWH-10-1-1029 TITLE: PRINCIPAL INVESTIGATOR: Mu-Shui Dai, M.D., Ph.D. CONTRACTING ORGANIZATION: Oregon Health Science niversity, Portland, Oregon 97239 REPORT DATE: October 2013 TYPE
Supplementary Figure S1: Defective heterochromatin repair in HGPS progeroid cells
 Supplementary Figure S1: Defective heterochromatin repair in HGPS progeroid cells Immunofluorescence staining of H3K9me3 and 53BP1 in PH and HGADFN003 (HG003) cells at 24 h after γ-irradiation. Scale bar,
Supplementary Figure 1. Efficiency of Mll4 deletion and its effect on T cell populations in the periphery. Nature Immunology: doi: /ni.
 Supplementary Figure 1 Efficiency of Mll4 deletion and its effect on T cell populations in the periphery. Expression of Mll4 floxed alleles (16-19) in naive CD4 + T cells isolated from lymph nodes and
SUPPLEMENTARY FIGURES
 SUPPLEMENTARY FIGURES Supplementary Figure 1. (A) Left, western blot analysis of ISGylated proteins in Jurkat T cells treated with 1000U ml -1 IFN for 16h (IFN) or left untreated (CONT); right, western
Supplementary Figure 1 Transcription assay of nine ABA-responsive PP2C. Transcription assay of nine ABA-responsive PP2C genes. Total RNA was isolated
 Supplementary Figure 1 Transcription assay of nine ABA-responsive PP2C genes. Transcription assay of nine ABA-responsive PP2C genes. Total RNA was isolated from 7 day-old seedlings treated with or without
A. List of selected proteins with high SILAC (H/L) ratios identified in mass
 ratios identified in mass") Supplementary material Figure S1. Interaction between UBL5 and FANCI A. List of selected proteins with high SILAC (H/L) ratios identified in mass spectrometry (MS)-based analysis of UBL5-interacting proteins,
Supplementary material Figure S1. Interaction between UBL5 and FANCI A. List of selected proteins with high SILAC (H/L) ratios identified in mass spectrometry (MS)-based analysis of UBL5-interacting proteins,
Supplemental Figure 1. Western blot analysis indicated that MIF was detected in the fractions of
 Supplemental Figure Legends Supplemental Figure 1. Western blot analysis indicated that was detected in the fractions of plasma membrane and cytosol but not in nuclear fraction isolated from Pkd1 null
Supplementary Fig. S1. Schematic diagram of minigenome segments.
 open reading frame 1565 (segment 5) 47 (-) 3 5 (+) 76 101 125 149 173 197 221 246 287 open reading frame 890 (segment 8) 60 (-) 3 5 (+) 172 Supplementary Fig. S1. Schematic diagram of minigenome segments.
Supplementary fig. 1. Crystals induce necroptosis does not involve caspases, TNF receptor or NLRP3. A. Mouse tubular epithelial cells were pretreated
 Supplementary fig. 1. Crystals induce necroptosis does not involve caspases, TNF receptor or NLRP3. A. Mouse tubular epithelial cells were pretreated with zvad-fmk (10µM) and exposed to calcium oxalate
Supplementary Figure 1. The mir-182 binding site of SMAD7 3 UTR and the. mutated sequence.
 Supplementary Figure 1. The mir-182 binding site of SMAD7 3 UTR and the mutated sequence. 1 Supplementary Figure 2. Expression of mir-182 and SMAD7 in various cell lines. (A) Basal levels of mir-182 expression
SUPPLEMENTARY INFORMATION
 DOI: 1.138/ncb222 / b. WB anti- WB anti- ulin Mitotic index (%) 14 1 6 2 T (h) 32 48-1 1 2 3 4 6-1 4 16 22 28 3 33 e. 6 4 2 Time (min) 1-6- 11-1 > 1 % cells Figure S1 depletion leads to mitotic defects
Supplementary Figure 1. PD-L1 is glycosylated in cancer cells. (a) Western blot analysis of PD-L1 in breast cancer cells. (b) Western blot analysis
 Western blot analysis of PD-L1 in breast cancer cells. (b) Western blot analysis") Supplementary Figure 1. PD-L1 is glycosylated in cancer cells. (a) Western blot analysis of PD-L1 in breast cancer cells. (b) Western blot analysis of PD-L1 in ovarian cancer cells. (c) Western blot analysis
Supplementary Figure 1. PD-L1 is glycosylated in cancer cells. (a) Western blot analysis of PD-L1 in breast cancer cells. (b) Western blot analysis of PD-L1 in ovarian cancer cells. (c) Western blot analysis
F-actin VWF Vinculin. F-actin. Vinculin VWF
 a F-actin VWF Vinculin b F-actin VWF Vinculin Supplementary Fig. 1. WPBs in HUVECs are located along stress fibers and at focal adhesions. (a) Immunofluorescence images of f-actin (cyan), VWF (yellow),
mir-7a regulation of Pax6 in neural stem cells controls the spatial origin of forebrain dopaminergic neurons
 Supplemental Material mir-7a regulation of Pax6 in neural stem cells controls the spatial origin of forebrain dopaminergic neurons Antoine de Chevigny, Nathalie Coré, Philipp Follert, Marion Gaudin, Pascal
a) List of KMTs targeted in the shrna screen. The official symbol, KMT designation,
 List of KMTs targeted in the shrna screen. The official symbol, KMT designation,") Supplementary Information Supplementary Figures Supplementary Figure 1. a) List of KMTs targeted in the shrna screen. The official symbol, KMT designation, gene ID and specifities are provided. Those highlighted
Supplementary Information Supplementary Figures Supplementary Figure 1. a) List of KMTs targeted in the shrna screen. The official symbol, KMT designation, gene ID and specifities are provided. Those highlighted
effects on organ development. a-f, Eye and wing discs with clones of ε j2b10 show no
 Supplementary Figure 1. Loss of function clones of 14-3-3 or 14-3-3 show no significant effects on organ development. a-f, Eye and wing discs with clones of 14-3-3ε j2b10 show no obvious defects in Elav
mir-509-5p and mir-1243 increase the sensitivity to gemcitabine by inhibiting
 mir-509-5p and mir-1243 increase the sensitivity to gemcitabine by inhibiting epithelial-mesenchymal transition in pancreatic cancer Hidekazu Hiramoto, M.D. 1,3, Tomoki Muramatsu, Ph.D. 1, Daisuke Ichikawa,
TRAF6 ubiquitinates TGFβ type I receptor to promote its cleavage and nuclear translocation in cancer
 Supplementary Information TRAF6 ubiquitinates TGFβ type I receptor to promote its cleavage and nuclear translocation in cancer Yabing Mu, Reshma Sundar, Noopur Thakur, Maria Ekman, Shyam Kumar Gudey, Mariya
mirna Dr. S Hosseini-Asl
 mirna Dr. S Hosseini-Asl 1 2 MicroRNAs (mirnas) are small noncoding RNAs which enhance the cleavage or translational repression of specific mrna with recognition site(s) in the 3 - untranslated region
Infect MCF-7 cells carrying dcas9-vp64 + psm2-p65-hsf1 with SAM library or vector. Introduce AKT reporter
 Infect MCF-7 cells carrying dcas9-vp64 + psm2-p65-hsf1 with SM library or vector Introduce reporter Grow cells in presence of puromycin for 5 days Vector control SM library fewer surviving cells More surviving
SUPPLEMENTARY FIGURES AND TABLES
 SUPPLEMENTARY FIGURES AND TABLES Supplementary Figure S1: CaSR expression in neuroblastoma models. A. Proteins were isolated from three neuroblastoma cell lines and from the liver metastasis of a MYCN-non
Supplementary Figure 1
 Supplementary Figure 1 YAP negatively regulates IFN- signaling. (a) Immunoblot analysis of Yap knockdown efficiency with sh-yap (#1 to #4 independent constructs) in Raw264.7 cells. (b) IFN- -Luc and PRDs
Supplementary Figure S1
 Supplementary Figure S1 Supplementary Figure S1. PARP localization patterns using GFP-PARP and PARP-specific antibody libraries GFP-PARP localization in non-fixed (A) and formaldehyde fixed (B) GFP-PARPx
(A) SW480, DLD1, RKO and HCT116 cells were treated with DMSO or XAV939 (5 µm)
 SW480, DLD1, RKO and HCT116 cells were treated with DMSO or XAV939 (5 µm)") Supplementary Figure Legends Figure S1. Tankyrase inhibition suppresses cell proliferation in an axin/β-catenin independent manner. (A) SW480, DLD1, RKO and HCT116 cells were treated with DMSO or XAV939
Supplementary Figure Legends Figure S1. Tankyrase inhibition suppresses cell proliferation in an axin/β-catenin independent manner. (A) SW480, DLD1, RKO and HCT116 cells were treated with DMSO or XAV939
MicroRNA in Cancer Karen Dybkær 2013
 MicroRNA in Cancer Karen Dybkær RNA Ribonucleic acid Types -Coding: messenger RNA (mrna) coding for proteins -Non-coding regulating protein formation Ribosomal RNA (rrna) Transfer RNA (trna) Small nuclear
MicroRNA-mediated loss of ADAR1 in metastatic melanoma promotes tumor growth
 Research article MicroRNA-mediated loss of ADAR1 in metastatic melanoma promotes tumor growth Yael Nemlich, 1,2 Eyal Greenberg, 1,3 Rona Ortenberg, 1,3 Michal J. Besser, 1,3 Iris Barshack, 4 Jasmine Jacob-Hirsch,
MicroRNA sponges: competitive inhibitors of small RNAs in mammalian cells
 MicroRNA sponges: competitive inhibitors of small RNAs in mammalian cells Margaret S Ebert, Joel R Neilson & Phillip A Sharp Supplementary figures and text: Supplementary Figure 1. Effect of sponges on
T H E J O U R N A L O F C E L L B I O L O G Y
 T H E J O U R N A L O F C E L L B I O L O G Y Supplemental material Krenn et al., http://www.jcb.org/cgi/content/full/jcb.201110013/dc1 Figure S1. Levels of expressed proteins and demonstration that C-terminal
ANGPTL2 increases bone metastasis of breast cancer cells through. Tetsuro Masuda, Motoyoshi Endo, Yutaka Yamamoto, Haruki Odagiri, Tsuyoshi
 Masuda et al. Supplementary information for ANGPTL2 increases bone metastasis of breast cancer cells through enhancing CXCR4 signaling Tetsuro Masuda, Motoyoshi Endo, Yutaka Yamamoto, Haruki Odagiri, Tsuyoshi
Table S1. Relative abundance of AGO1/4 proteins in different organs. Table S2. Summary of smrna datasets from various samples.
 Supplementary files Table S1. Relative abundance of AGO1/4 proteins in different organs. Table S2. Summary of smrna datasets from various samples. Table S3. Specificity of AGO1- and AGO4-preferred 24-nt
Supplementary Figure 1
 Supplementary Figure 1 a γ-h2ax MDC1 RNF8 FK2 BRCA1 U2OS Cells sgrna-1 ** 60 sgrna 40 20 0 % positive Cells (>5 foci per cell) b ** 80 sgrna sgrna γ-h2ax MDC1 γ-h2ax RNF8 FK2 MDC1 BRCA1 RNF8 FK2 BRCA1
Eukaryotic small RNA Small RNAseq data analysis for mirna identification
 Eukaryotic small RNA Small RNAseq data analysis for mirna identification P. Bardou, C. Gaspin, S. Maman, J. Mariette, O. Rué, M. Zytnicki INRA Sigenae Toulouse INRA MIA Toulouse GenoToul Bioinfo INRA MaIAGE
Supplementary information. MARCH8 inhibits HIV-1 infection by reducing virion incorporation of envelope glycoproteins
 Supplementary information inhibits HIV-1 infection by reducing virion incorporation of envelope glycoproteins Takuya Tada, Yanzhao Zhang, Takayoshi Koyama, Minoru Tobiume, Yasuko Tsunetsugu-Yokota, Shoji
Small RNAs and how to analyze them using sequencing
 Small RNAs and how to analyze them using sequencing RNA-seq Course November 8th 2017 Marc Friedländer ComputaAonal RNA Biology Group SciLifeLab / Stockholm University Special thanks to Jakub Westholm for
S1a S1b S1c. S1d. S1f S1g S1h SUPPLEMENTARY FIGURE 1. - si sc Il17rd Il17ra bp. rig/s IL-17RD (ng) -100 IL-17RD
 -100 IL-17RD") SUPPLEMENTARY FIGURE 1 0 20 50 80 100 IL-17RD (ng) S1a S1b S1c IL-17RD β-actin kda S1d - si sc Il17rd Il17ra rig/s15-574 - 458-361 bp S1f S1g S1h S1i S1j Supplementary Figure 1. Knockdown of IL-17RD enhances
SUPPLEMENTARY FIGURE 1 0 20 50 80 100 IL-17RD (ng) S1a S1b S1c IL-17RD β-actin kda S1d - si sc Il17rd Il17ra rig/s15-574 - 458-361 bp S1f S1g S1h S1i S1j Supplementary Figure 1. Knockdown of IL-17RD enhances
Nature Structural & Molecular Biology: doi: /nsmb.3218
 Supplementary Figure 1 Endogenous EGFR trafficking and responses depend on biased ligands. (a) Lysates from HeLa cells stimulated for 2 min. with increasing concentration of ligands were immunoblotted