Supporting Information
|
|
|
- Darleen Lambert
- 5 years ago
- Views:
Transcription
1 Supporting Information Fig. S1. Overexpression of Rpr causes progenitor cell death. (A) TUNEL assay of control intestines. No progenitor cell death could be observed, except that some ECs are undergoing cell death (red, white arrowheads). (B) TUNEL assay of esg ts >Rpr intestines. Some progenitors are undergoing cell death (red, yellow arrowheads). Dying ECs (red, white arrowheads) can also be observed. Blue indicates DAPI staining for DNA. Scale bars: 20 µm.
2
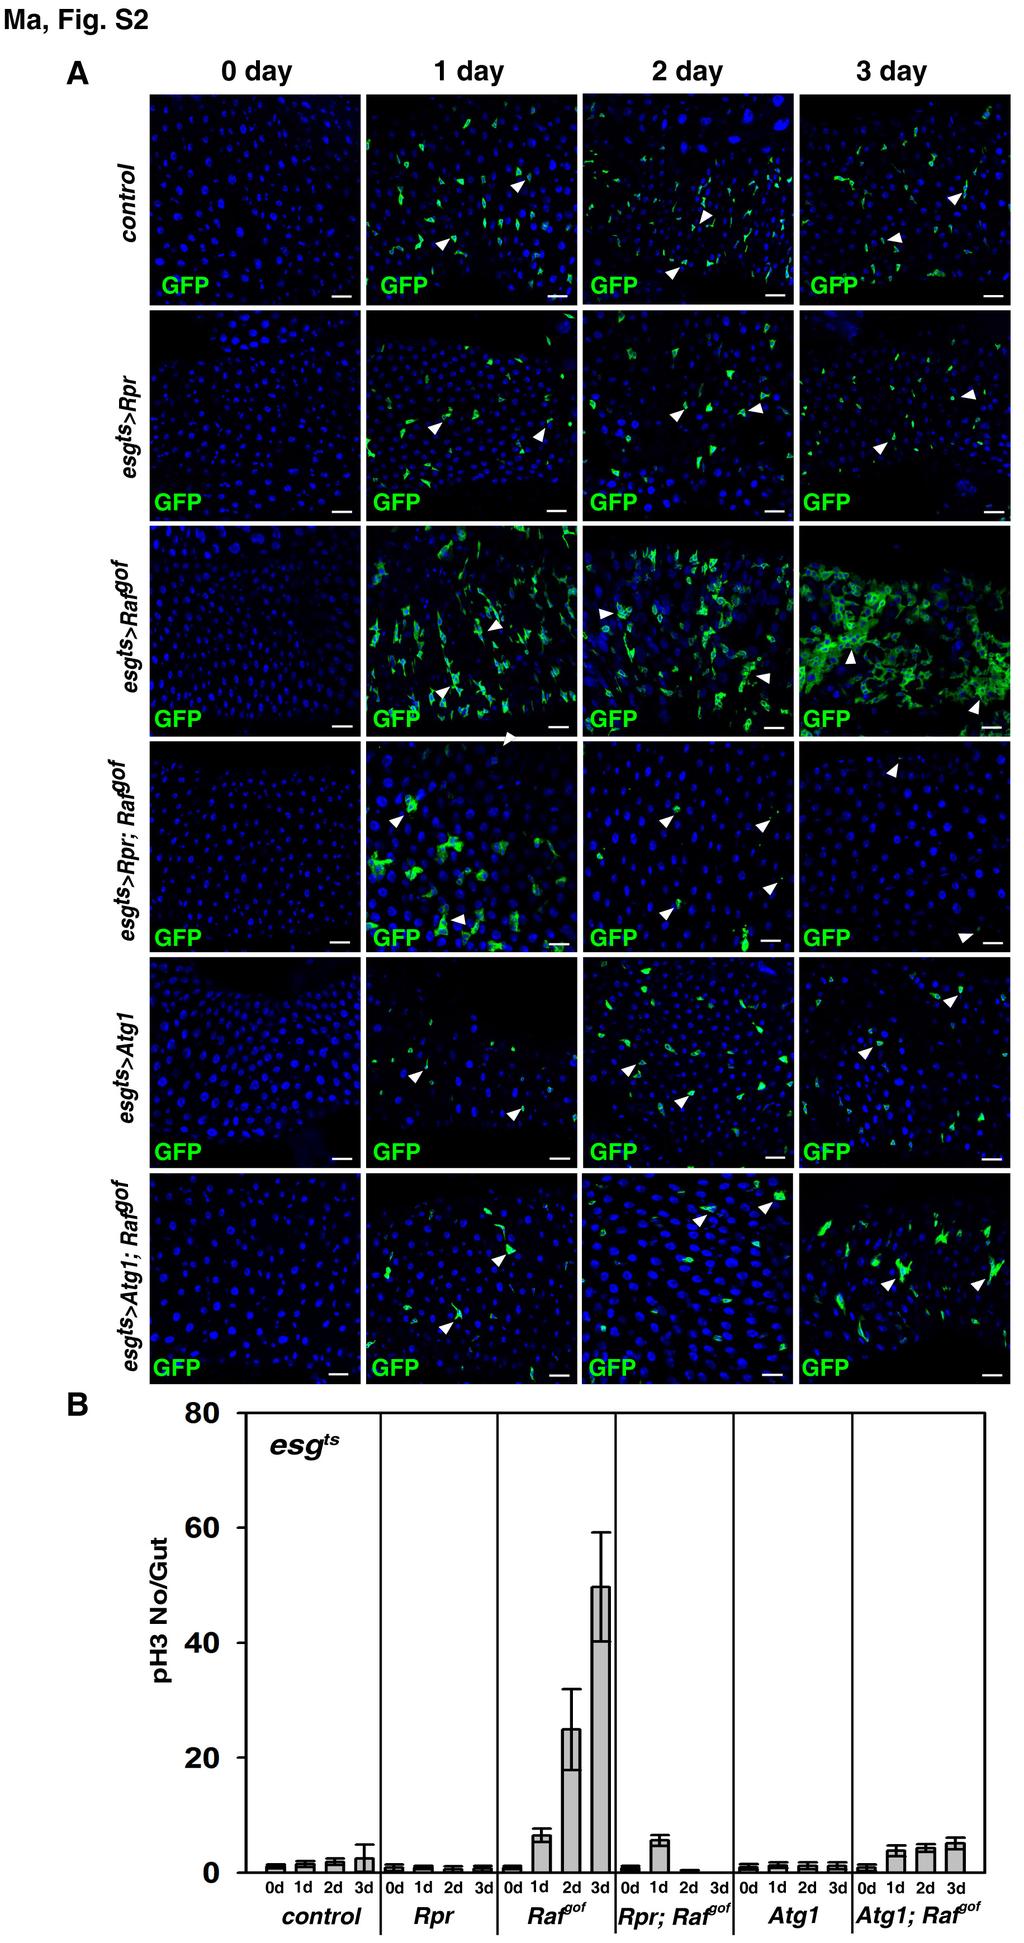
3 Fig. S2. Overexpression of Rpr ablates all Raf gof tumor cells, while Atg1 induction inhibits Raf gof tumor formation. (A) A time course analysis in the intestines of different genotypes (from 0 to 3 days). 0 day: flies hatched from 18 C incubator were dissected and fixed, thereby no GFP expression was observed. A transient increase of ISC number was detected in esg ts >Rpr; Raf gof intestines at day 1 (white arrowheads). Most of the esg+ cells expressing Rpr and Raf gof at the 2 nd day were morphologically abnormal and some cell debris were observed (white arrowheads), only some cell debris were observed at the 3 rd day (white arrowheads). Raf gof tumors were significantly suppressed by Atg1 co-induction (white arrowheads). GFP in green, blue indicates DAPI staining for DNA. Scale bars: 20 µm. (B) Quantification of ph3 staining per gut in the intestines of different genotypes at different time points. n = intestines. Mean ± SD is shown.
4
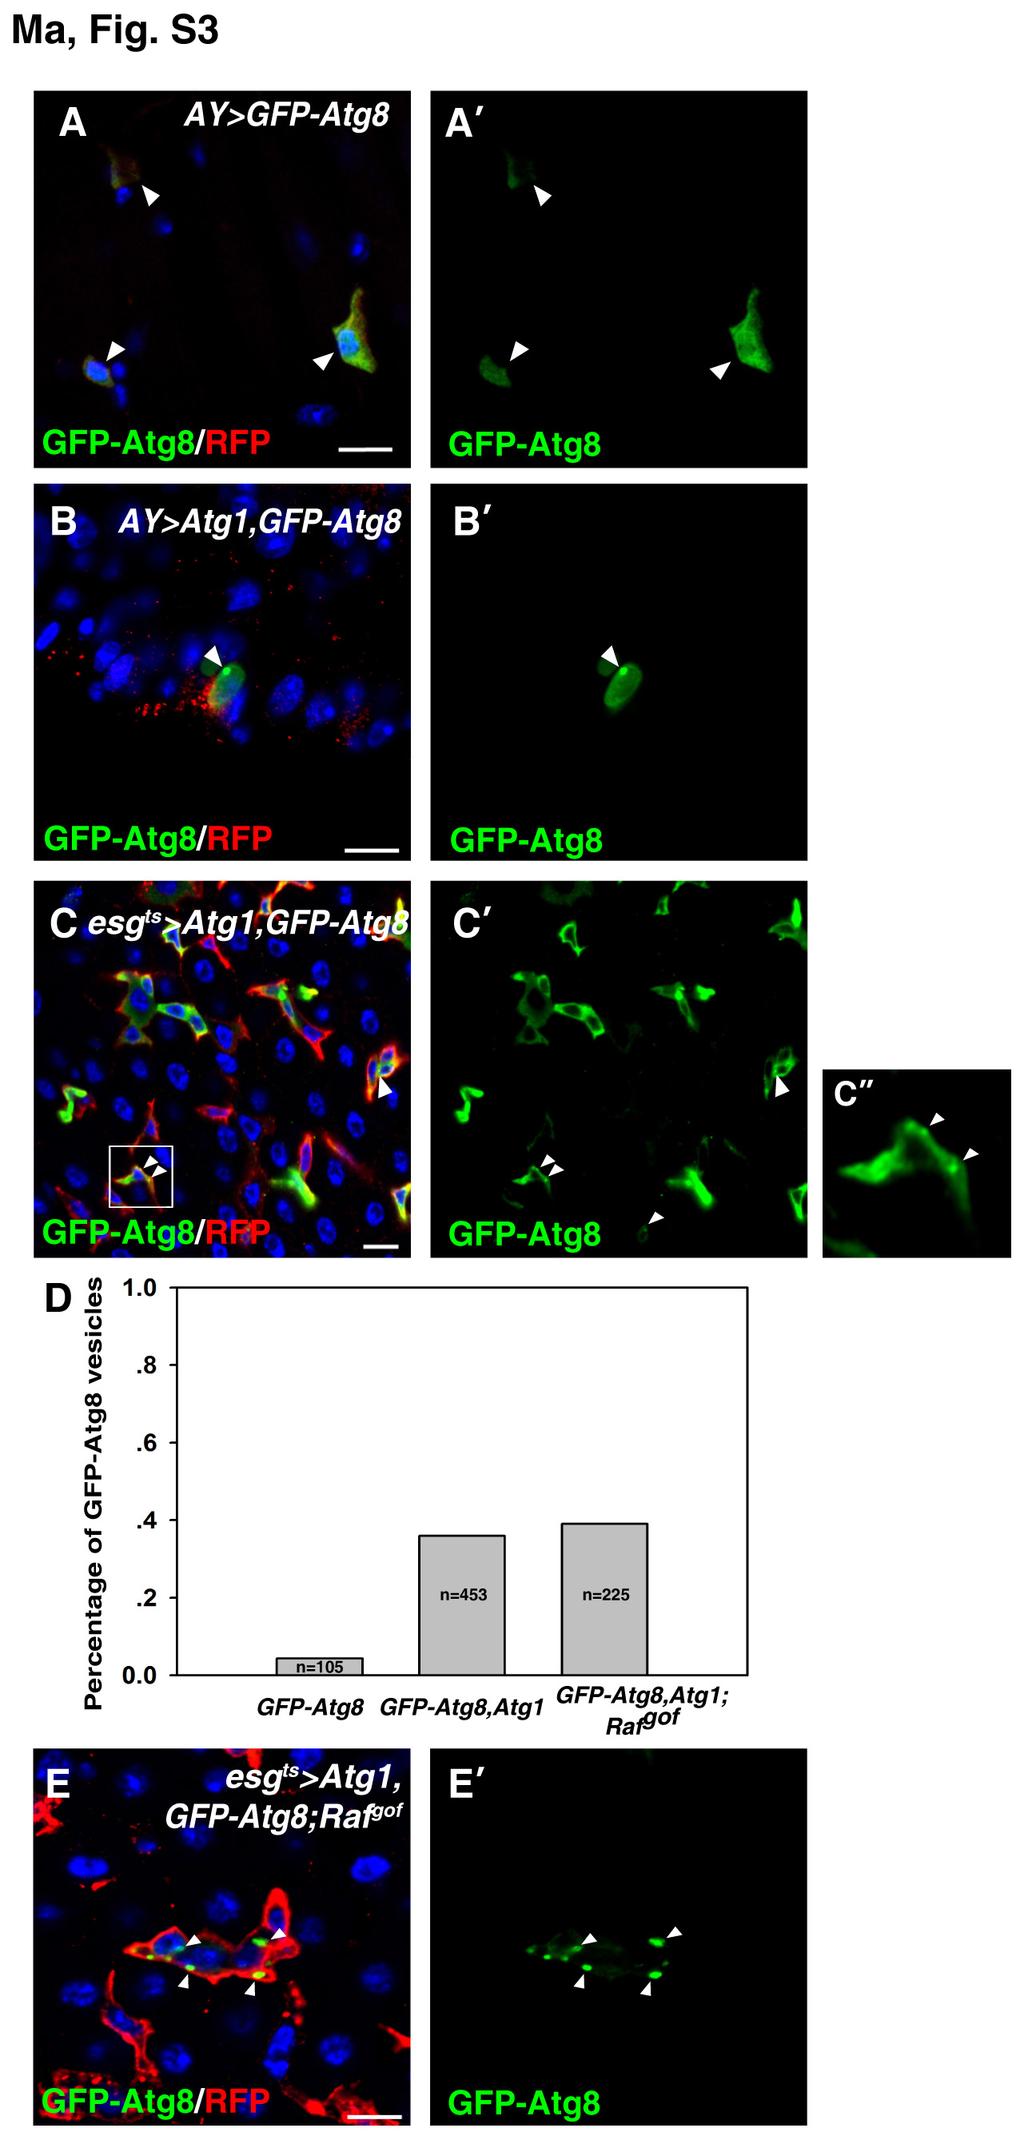
 Autophagosomes (green, GFP-Atg8/LC3) are readily observed in AY clones (red) expressing both Atg1 and GFP-Atg8 (white arrowhead).")
5 Fig. S3. Overexpression of Atg1 induces autophagosome formation. (A, A ) Autophagosomes are rarely observed in ActGal4 FLP-out clones (AY, red) expressing GFP-Atg8 alone (white arrowheads). (B, B ) Autophagosomes (green, GFP-Atg8/LC3) are readily observed in AY clones (red) expressing both Atg1 and GFP-Atg8 (white arrowhead). (C-C ) Autophagosomes (green, GFP-Atg8/LC3) are readily observed in progenitors (red) expressing both Atg1 and GFP-Atg8 using esg ts (white arrowheads). (D) Quantification of the percentage of cells containing autophagosomes (GFP-Atg8 vesicles) in GFP-positive cells. For an unknown reason, when Atg1 and GFP-Atg8 were co-expressed, some of the RFP positive cells did not contain the GFP-Atg8 signal. (E, E ) Large autophagosomes (green, GFP-Atg8/LC3) are observed in progenitors expressing Atg1, GFP-Atg8, and Raf gof using esg ts (white arrowheads). Blue indicates DAPI staining for DNA. Scale bars: 10 µm. Fig. S4. Progenitor identity and progeny differentiation are not affected by the expression of Atg1 at 3 days.
 Progenitor identity (Dl in red, yellow arrowheads) and ee cell differentiation (Pros in red, white arrowheads) in esg ts >Atg1 intestines. Blue indicates DAPI staining for DNA. Scale bars: 20 µm.")
6 (A) Progenitors (Dl in red, yellow arrowheads) and ee cells (Pros in red, white arrowheads) in control intestines. (B) Progenitor identity (Dl in red, yellow arrowheads) and ee cell differentiation (Pros in red, white arrowheads) in esg ts >Atg1 intestines. Blue indicates DAPI staining for DNA. Scale bars: 20 µm. Fig. S5. Renal tumors induced by Raf gof expression are inhibited by autophagy induction. (A) Control AY renal clones grown in well-fed flies (rich medium) at 29 ºC for 3 days (white arrowheads). (B) Renal tumors are formed in well-fed animals after AY induction of Raf gof at 29 ºC for 3 days (white arrowheads). (C) AY renal clones grown in well-fed flies expressing Atg1 at 29 ºC for 3 days (white arrowheads). (D) Renal Raf gof tumors are significantly inhibited by co-expressing Atg1 (white arrowhead). (E)
 Intestinal tumors are formed in esgts>rafgof intestines at 29 C for 3 days (white arrowheads).")
7 Renal Rafgof tumors are significantly inhibited under starvation (white arrowheads). Blue indicates DAPI staining for DNA. Scale bars: 20 µm. Fig. S6. Autophagy is required for the inhibition of Rafgof tumors. (A) Intestinal tumors are formed in esgts>rafgof intestines at 29 C for 3 days (white arrowheads). (B) No obvious defects are observed in esgts>atg1 intestines (white arrowheads). (C) Intestines with knockdown of Atg5 (progenitors in green, white arrowheads). (D) Intestinal tumors are formed in esgts>atg5rnai, Rafgof intestines at 29 C for 3 days (white arrowheads). (E) Atg5 RNAi significantly rescues the
 Intestinal tumors are formed in esg ts >Atg6 RNAi, Raf gof intestines at 29 C for 3 days (white arrowheads).")
8 inhibition of tumor formation observed in esg ts >Atg1, Raf gof intestines (white arrowheads). (F) Intestines with knockdown of Atg6 (progenitors in green, white arrowheads). (G) Intestinal tumors are formed in esg ts >Atg6 RNAi, Raf gof intestines at 29 C for 3 days (white arrowheads). (H) Atg6 knockdown significantly rescues the inhibition of tumor formation observed in esg ts >Atg1, Raf gof intestines (white arrowheads). (I) Quantification of the relative number of esg+ cells in the intestines of different genotypes. Note that because esg ts >Raf gof intestines are highly deformed due to the formation of tumors, it is very difficult to accurately count the number of esg+ cells in these intestines. n = intestines. Mean ± SD is shown. **p< (J) Quantification of ph3 staining per gut in the intestines of different genotypes. n = intestines. Mean ± SD is shown. **p< Blue indicates DAPI staining for DNA. Scale bars: 20 µm. Fig. S7. Overexpression of Atg1 does not cause progenitor cell death. (A) TUNEL assay of control intestines. No progenitor cell death could be observed, except that some ECs are undergoing cell death (red, white arrowheads). (B) TUNEL

9 assay of esg ts >Atg1 intestines. No progenitor cell death could be observed. Dying ECs (red, white arrowheads) can be observed. Blue indicates DAPI staining for DNA. Scale bars: 20 µm. Fig. S8. Mitochondria and golgi apparatus are engulfed in autophagosomes in esg ts >Atg1, GFP-Atg8; Raf gof /UAS-mRFP cells. (A) Mitochondria (Cova, yellow) are present within the autophagosomes (green, labeled with GFP-Atg8) (white arrowhead). (B) Golgi apparatus (GM130, yellow) are observed in the autophagosomes (green, labeled with GFP-Atg8) (white arrowheads).
10 For an unknown reason, when Atg1 and GFP-Atg8 were co-expressed, some of the RFP positive cells did not contain the GFP-Atg8 signal. mrfp in red. Blue indicates DAPI staining for DNA. Scale bars: 10 µm.
Supplementary Figure 1 Madm is not required in GSCs and hub cells. (a,b) Act-Gal4-UAS-GFP (a), Act-Gal4-UAS- GFP.nls (b,c) is ubiquitously expressed
 Act-Gal4-UAS-GFP (a), Act-Gal4-UAS- GFP.nls (b,c) is ubiquitously expressed") Supplementary Figure 1 Madm is not required in GSCs and hub cells. (a,b) Act-Gal4-UAS-GFP (a), Act-Gal4-UAS- GFP.nls (b,c) is ubiquitously expressed in the testes. The testes were immunostained with GFP
Supplementary Figure 1 Madm is not required in GSCs and hub cells. (a,b) Act-Gal4-UAS-GFP (a), Act-Gal4-UAS- GFP.nls (b,c) is ubiquitously expressed in the testes. The testes were immunostained with GFP
effects on organ development. a-f, Eye and wing discs with clones of ε j2b10 show no
 Supplementary Figure 1. Loss of function clones of 14-3-3 or 14-3-3 show no significant effects on organ development. a-f, Eye and wing discs with clones of 14-3-3ε j2b10 show no obvious defects in Elav
Supplementary Fig. 1 V-ATPase depletion induces unique and robust phenotype in Drosophila fat body cells.
 Supplementary Fig. 1 V-ATPase depletion induces unique and robust phenotype in Drosophila fat body cells. a. Schematic of the V-ATPase proton pump macro-complex structure. The V1 complex is composed of
A. Generation and characterization of Ras-expressing autophagycompetent
 Supplemental Material Supplemental Figure Legends Fig. S1 A. Generation and characterization of Ras-expressing autophagycompetent and -deficient cell lines. HA-tagged H-ras V12 was stably expressed in
marker. DAPI labels nuclei. Flies were 20 days old. Scale bar is 5 µm. Ctrl is
 Supplementary Figure 1. (a) Nos is detected in glial cells in both control and GFAP R79H transgenic flies (arrows), but not in deletion mutant Nos Δ15 animals. Repo is a glial cell marker. DAPI labels
50mM D-Glucose. Percentage PI. L-Glucose
 Monica Dus, Minrong Ai, Greg S.B Suh. Taste-independent nutrient selection is mediated by a brain-specific Na+/solute cotransporter in Drosophila. Control + Phlorizin mm D-Glucose 1 2mM 1 L-Glucose Gr5a;Gr64a
IP: anti-gfp VPS29-GFP. IP: anti-vps26. IP: anti-gfp - + +
 FAM21 Strump. WASH1 IP: anti- 1 2 3 4 5 6 FAM21 Strump. FKBP IP: anti-gfp VPS29- GFP GFP-FAM21 tail H H/P P H H/P P c FAM21 FKBP Strump. VPS29-GFP IP: anti-gfp 1 2 3 FKBP VPS VPS VPS VPS29 1 = VPS29-GFP
Nature Neuroscience: doi: /nn Supplementary Figure 1
 Supplementary Figure 1 Expression of escargot (esg) and genetic approach for achieving IPC-specific knockdown. (a) esg MH766 -Gal4 UAS-cd8GFP (green) and esg-lacz B7-2-22 (red) show similar expression
Supplementary Figure S1: TIPF reporter validation in the wing disc.
 Supplementary Figure S1: TIPF reporter validation in the wing disc. a,b, Test of put RNAi. a, In wildtype discs the Dpp target gene Sal (red) is expressed in a broad stripe in the centre of the ventral
SUPPLEMENTARY INFORMATION
 DOI: 10.1038/ncb2419 Figure S1 NiGFP localization in Dl mutant dividing SOPs. a-c) time-lapse analysis of NiGFP (green) in Dl mutant SOPs (H2B-RFP, red; clones were identified by the loss of nlsgfp) showing
Supplementary Information
 Supplementary Information Supplementary Figure 1: cholesterol manipulation alters the positioning of autophagosomes in cells, related to figure 1. (a) HeLa cells were treated for 24h under conditions reducing
Supplementary Figure 1
 Supplementary Figure 1 Kif1a RNAi effect on basal progenitor differentiation Related to Figure 2. Representative confocal images of the VZ and SVZ of rat cortices transfected at E16 with scrambled or Kif1a
Supplementary Information
 Supplementary Information Supplementary s Supplementary 1 All three types of foods suppress subsequent feeding in both sexes when the same food is used in the pre-feeding test feeding. (a) Adjusted pre-feeding
Supplementary Figures
 J. Cell Sci. 128: doi:10.1242/jcs.173807: Supplementary Material Supplementary Figures Fig. S1 Fig. S1. Description and/or validation of reagents used. All panels show Drosophila tissues oriented with
Supplemental Data. Wang et al. (2013). Plant Cell /tpc
. Plant Cell /tpc") Supplemental Data. Wang et al. (2013). Plant Cell 10.1105/tpc.112.108993 Supplemental Figure 1. 3-MA Treatment Reduces the Growth of Seedlings. Two-week-old Nicotiana benthamiana seedlings germinated on
Supplemental Data. Wang et al. (2013). Plant Cell 10.1105/tpc.112.108993 Supplemental Figure 1. 3-MA Treatment Reduces the Growth of Seedlings. Two-week-old Nicotiana benthamiana seedlings germinated on
Supplementary Figure 1. Flies form water-reward memory only in the thirsty state
 1 2 3 4 5 6 7 Supplementary Figure 1. Flies form water-reward memory only in the thirsty state Thirsty but not sated wild-type flies form robust 3 min memory. For the thirsty group, the flies were water-deprived
Expanded View Figures
 PEX13 functions in selective autophagy Ming Y Lee et al Expanded View Figures Figure EV1. PEX13 is required for Sindbis virophagy. A, B Quantification of mcherry-capsid puncta per cell (A) and GFP-LC3
SUPPLEMENTARY INFORMATION
 DOI: 10.1038/ncb2988 Supplementary Figure 1 Kif7 L130P encodes a stable protein that does not localize to cilia tips. (a) Immunoblot with KIF7 antibody in cell lysates of wild-type, Kif7 L130P and Kif7
SUPPLEMENTARY INFORMATION
 Supplementary Figure 1. Ras V12 expression in the entire eye-antennal disc does not cause invasive tumours. a, Eye-antennal discs expressing Ras V12 in all cells (marked with GFP, green) overgrow moderately
Supplemental Information. Autophagy in Oncogenic K-Ras. Promotes Basal Extrusion. of Epithelial Cells by Degrading S1P. Current Biology, Volume 24
 Current Biology, Volume 24 Supplemental Information Autophagy in Oncogenic K-Ras Promotes Basal Extrusion of Epithelial Cells by Degrading S1P Gloria Slattum, Yapeng Gu, Roger Sabbadini, and Jody Rosenblatt
Supplementary Figure 1: GFAP positive nerves in patients with adenocarcinoma of
 SUPPLEMENTARY FIGURES AND MOVIE LEGENDS Supplementary Figure 1: GFAP positive nerves in patients with adenocarcinoma of the pancreas. (A) Images of nerves stained for GFAP (green), S100 (red) and DAPI
6. TNF-α regulates oxidative stress, mitochondrial function and autophagy in neuronal cells
 6. TNF-α regulates oxidative stress, mitochondrial function and autophagy in neuronal cells 6.1 TNF-α induces mitochondrial oxidative stress in SH-SY5Y cells. The dysregulation of mitochondria and oxidative
genome edited transient transfection, CMV promoter
 Supplementary Figure 1. In the absence of new protein translation, overexpressed caveolin-1-gfp is degraded faster than caveolin-1-gfp expressed from the endogenous caveolin 1 locus % loss of total caveolin-1-gfp
Head of College Scholars List Scheme. Summer Studentship Report Form
 Head of College Scholars List Scheme Summer Studentship 2019 Report Form This report should be completed by the student with his/her project supervisor. It should summarise the work undertaken during the
islets scored 1 week month months
 Supplementary Table 1. Sampling parameters for the morphometrical analyses Time (post- DT) Control mice (age-matched) α-cells mice pancreatic surface (mm 2 ) scored DT-treated mice islets scored mice pancreatic
Supplemental Figures:
 Supplemental Figures: Figure 1: Intracellular distribution of VWF by electron microscopy in human endothelial cells. a) Immunogold labeling of LC3 demonstrating an LC3-positive autophagosome (white arrow)
SUPPLEMENTARY INFORMATION
 Figure S1 Induction of non-apoptotic death of SV40-transformed and primary DKO MEFs, and DKO thymocytes. (A-F) STS-induced non-apoptotic death of DKO MEF. (A, B) Reduced viability of DKO MEFs after exposure
Supplementary Figure S1
 Supplementary Figure S1 Supplementary Figure S1. PARP localization patterns using GFP-PARP and PARP-specific antibody libraries GFP-PARP localization in non-fixed (A) and formaldehyde fixed (B) GFP-PARPx
Sestrin2 and BNIP3 (Bcl-2/adenovirus E1B 19kDa-interacting. protein3) regulate autophagy and mitophagy in renal tubular cells in. acute kidney injury
 regulate autophagy and mitophagy in renal tubular cells in. acute kidney injury") Sestrin2 and BNIP3 (Bcl-2/adenovirus E1B 19kDa-interacting protein3) regulate autophagy and mitophagy in renal tubular cells in acute kidney injury by Masayuki Ishihara 1, Madoka Urushido 2, Kazu Hamada
Sestrin2 and BNIP3 (Bcl-2/adenovirus E1B 19kDa-interacting protein3) regulate autophagy and mitophagy in renal tubular cells in acute kidney injury by Masayuki Ishihara 1, Madoka Urushido 2, Kazu Hamada
SUPPLEMENTARY INFORMATION
 doi: 10.1038/nature07173 SUPPLEMENTARY INFORMATION Supplementary Figure Legends: Supplementary Figure 1: Model of SSC and CPC divisions a, Somatic stem cells (SSC) reside adjacent to the hub (red), self-renew
Tumor suppressor Spred2 interaction with LC3 promotes autophagosome maturation and induces autophagy-dependent cell death
 www.impactjournals.com/oncotarget/ Oncotarget, Supplementary Materials 2016 Tumor suppressor Spred2 interaction with LC3 promotes autophagosome maturation and induces autophagy-dependent cell death Supplementary
Supplementary Materials for
 www.sciencesignaling.org/cgi/content/full/6/283/ra57/dc1 Supplementary Materials for JNK3 Couples the Neuronal Stress Response to Inhibition of Secretory Trafficking Guang Yang,* Xun Zhou, Jingyan Zhu,
Fig. S1. Subcellular localization of overexpressed LPP3wt-GFP in COS-7 and HeLa cells. Cos7 (top) and HeLa (bottom) cells expressing for 24 h human
 and HeLa (bottom) cells expressing for 24 h human") Fig. S1. Subcellular localization of overexpressed LPP3wt-GFP in COS-7 and HeLa cells. Cos7 (top) and HeLa (bottom) cells expressing for 24 h human LPP3wt-GFP, fixed and stained for GM130 (A) or Golgi97
Fig. S1. Subcellular localization of overexpressed LPP3wt-GFP in COS-7 and HeLa cells. Cos7 (top) and HeLa (bottom) cells expressing for 24 h human LPP3wt-GFP, fixed and stained for GM130 (A) or Golgi97
Supplemental Materials. STK16 regulates actin dynamics to control Golgi organization and cell cycle
 Supplemental Materials STK16 regulates actin dynamics to control Golgi organization and cell cycle Juanjuan Liu 1,2,3, Xingxing Yang 1,3, Binhua Li 1, Junjun Wang 1,2, Wenchao Wang 1, Jing Liu 1, Qingsong
T H E J O U R N A L O F C E L L B I O L O G Y
 T H E J O U R N A L O F C E L L B I O L O G Y Supplemental material Krenn et al., http://www.jcb.org/cgi/content/full/jcb.201110013/dc1 Figure S1. Levels of expressed proteins and demonstration that C-terminal
Karen L.P. McNally, Amy S. Fabritius, Marina L. Ellefson, Jonathan R. Flynn, Jennifer A. Milan, and Francis J. McNally
 Developmental Cell, Volume 22 Supplemental Information Kinesin-1 Prevents Capture of the Oocyte Meiotic Spindle by the Sperm Aster Karen L.P. McNally, Amy S. Fabritius, Marina L. Ellefson, Jonathan R.
Supplementary Figure 1: Signaling centers contain few proliferating cells, express p21, and
 Supplementary Figure 1: Signaling centers contain few proliferating cells, express p21, and exclude YAP from the nucleus. (a) Schematic diagram of an E10.5 mouse embryo. (b,c) Sections at B and C in (a)
Regulation of sleep plasticity by a thermo-sensitive circuit in Drosophila
 Regulation of sleep plasticity by a thermo-sensitive circuit in Drosophila Angelique Lamaze 1, Arzu Öztürk-Çolak 2, Robin Fischer 3, Nicolai Peschel 3, Kyunghee Koh 2 and James E.C. Jepson 1* 1 UCL Institute
Santulli G. et al. A microrna-based strategy to suppress restenosis while preserving endothelial function
 ONLINE DATA SUPPLEMENTS Santulli G. et al. A microrna-based strategy to suppress restenosis while preserving endothelial function Supplementary Figures Figure S1 Effect of Ad-p27-126TS on the expression
Inhibition of Cdk5 Promotes β-cell Differentiation from Ductal Progenitors
 Inhibition of Cdk5 Promotes β-cell Differentiation from Ductal Progenitors Ka-Cheuk Liu, Gunter Leuckx, Daisuke Sakano, Philip A. Seymour, Charlotte L. Mattsson, Linn Rautio, Willem Staels, Yannick Verdonck,
Supplementary Information
 Supplementary Information Supplementary Figure 1: Luminal localization of CCM-3. (a) The CCM-3::GFP fusion protein localizes along the apical (luminal) surface of the pharynx (b) as well as the lumen of
Nature Structural & Molecular Biology: doi: /nsmb Supplementary Figure 1. Generation and validation of mtef4-knockout mice.
 Supplementary Figure 1 Generation and validation of mtef4-knockout mice. (a) Alignment of EF4 (E. coli) with mouse, yeast and human EF4. (b) Domain structures of mouse mtef4 compared to those of EF4 (E.
SUPPLEMENTARY FIGURE LEGENDS
 SUPPLEMENTARY FIGURE LEGENDS Supplemental FIG. 1. Localization of myosin Vb in cultured neurons varies with maturation stage. A and B, localization of myosin Vb in cultured hippocampal neurons. A, in DIV
Supplemental Figure 1. (A) The localization of Cre DNA recombinase in the testis of Cyp19a1-Cre mice was detected by immunohistchemical analyses
 The localization of Cre DNA recombinase in the testis of Cyp19a1-Cre mice was detected by immunohistchemical analyses") Supplemental Figure 1. (A) The localization of Cre DNA recombinase in the testis of Cyp19a1-Cre mice was detected by immunohistchemical analyses using an anti-cre antibody; testes at 1 week (left panel),
Supplemental Figure 1. (A) The localization of Cre DNA recombinase in the testis of Cyp19a1-Cre mice was detected by immunohistchemical analyses using an anti-cre antibody; testes at 1 week (left panel),
Supplemental Information. Tissue Myeloid Progenitors Differentiate. into Pericytes through TGF-b Signaling. in Developing Skin Vasculature
 Cell Reports, Volume 18 Supplemental Information Tissue Myeloid Progenitors Differentiate into Pericytes through TGF-b Signaling in Developing Skin Vasculature Tomoko Yamazaki, Ani Nalbandian, Yutaka Uchida,
SUPPLEMENTARY INFORMATION
 DOI: 10.1038/ncb2566 Figure S1 CDKL5 protein expression pattern and localization in mouse brain. (a) Multiple-tissue western blot from a postnatal day (P) 21 mouse probed with an antibody against CDKL5.
Supplemental Information. Proprioceptive Opsin Functions. in Drosophila Larval Locomotion
 Neuron, Volume 98 Supplemental Information Proprioceptive Opsin Functions in Drosophila Larval Locomotion Damiano Zanini, Diego Giraldo, Ben Warren, Radoslaw Katana, Marta Andrés, Suneel Reddy, Stephanie
Supplementary Materials
 Supplementary Materials Supplementary Figure S1 Regulation of Ubl4A stability by its assembly partner A, The translation rate of Ubl4A is not affected in the absence of Bag6. Control, Bag6 and Ubl4A CRISPR
SUPPLEMENTARY INFORMATION
 Figure S1 Treatment with both Sema6D and Plexin-A1 sirnas induces the phenotype essentially identical to that induced by treatment with Sema6D sirna alone or Plexin-A1 sirna alone. (a,b) The cardiac tube
Supplemental Figures
 Supplemental Figures Supplemental Figure 1. Fasting-dependent regulation of the SREBP ortholog SBP-1 and lipid homeostasis mediated by the SIRT1 ortholog SIR-2.1 in C. elegans. (A) Wild-type or sir-2.1(lof)
FOR OPTIMAL GUT HEALTH KEMIN.COM/GUTHEALTH
 FOR OPTIMAL GUT HEALTH KEMIN.COM/GUTHEALTH ALETA A SOURCE OF 1,3-BETA GLUCANS Aleta is highly bioavailable, offering a concentration greater than 5% of 1,3-beta glucans. Aleta provides a consistent response
F-actin VWF Vinculin. F-actin. Vinculin VWF
 a F-actin VWF Vinculin b F-actin VWF Vinculin Supplementary Fig. 1. WPBs in HUVECs are located along stress fibers and at focal adhesions. (a) Immunofluorescence images of f-actin (cyan), VWF (yellow),
100 mm Sucrose. +Berberine +Quinine
 8 mm Sucrose Probability (%) 7 6 5 4 3 Wild-type Gr32a / 2 +Caffeine +Berberine +Quinine +Denatonium Supplementary Figure 1: Detection of sucrose and bitter compounds is not affected in Gr32a / flies.
33VASTVNGATSANNHGEPPS51PADARPR58
 Pro-rich region Trans-membrane region 214 246 359 381 UL50 1 397 211SSRTAS216PPPPPR222 NLS CR1 CR2 CR3 CR4 UL53 1 376 11RERRS15ALRS19LLRKRRR25 33VASTVNGATSANNHGEPPS51PADARPR58 FIG S1. UL97 phosphorylation
A Normal Exencephaly Craniora- Spina bifida Microcephaly chischisis. Midbrain Forebrain/ Forebrain/ Hindbrain Spinal cord Hindbrain Hindbrain
 A Normal Exencephaly Craniora- Spina bifida Microcephaly chischisis NTD Number of embryos % among NTD Embryos Exencephaly 52 74.3% Craniorachischisis 6 8.6% Spina bifida 5 7.1% Microcephaly 7 1% B Normal
Loss of RhoA promotes skin tumor formation. Supplementary Figure 1. Loss of RhoA does not impair F-actin organization.
 Supplementary Figure Legends Supplementary Figure 1. Loss of RhoA does not impair F-actin organization. a. Representative IF images of F-actin staining of big and small control (left) and RhoA ko tumors
MII. Supplement Figure 1. CapZ β2. Merge. 250ng. 500ng DIC. Merge. Journal of Cell Science Supplementary Material. GFP-CapZ β2 DNA
 A GV GVBD MI DNA CapZ β2 CapZ β2 Merge B DIC GFP-CapZ β2 Merge CapZ β2-gfp 250ng 500ng Supplement Figure 1. MII A early MI late MI Control RNAi CapZαβ DNA Actin Tubulin B Phalloidin Intensity(A.U.) n=10
Supplementary Figure 1. Electroporation of a stable form of β-catenin causes masses protruding into the IV ventricle. HH12 chicken embryos were
 Supplementary Figure 1. Electroporation of a stable form of β-catenin causes masses protruding into the IV ventricle. HH12 chicken embryos were electroporated with β- Catenin S33Y in PiggyBac expression
Autophagy suppresses Ras-driven epithelial tumourigenesis by limiting the accumulation of reactive oxygen species
 Oncogene (2017) 36, 5576 5592 www.nature.com/onc OPEN ORIGINAL ARTICLE Autophagy suppresses Ras-driven epithelial tumourigenesis by limiting the accumulation of reactive oxygen species This article has
Nature Structural and Molecular Biology: doi: /nsmb Supplementary Figure 1
 Supplementary Figure 1 Mutational analysis of the SA2-Scc1 interaction in vitro and in human cells. (a) Autoradiograph (top) and Coomassie stained gel (bottom) of 35 S-labeled Myc-SA2 proteins (input)
Development Supplementary information
 Supplemental Materials and Methods Mosaic clonal analysis GSC and SP clones were induced with the FLP/FRT-mediated mitotic recombination technique (Xu and Rubin, 1993) in files with following genotypes:
McWilliams et al., http :// /cgi /content /full /jcb /DC1
 Supplemental material JCB McWilliams et al., http ://www.jcb.org /cgi /content /full /jcb.201603039 /DC1 THE JOURNAL OF CELL BIOLOGY Figure S1. In vitro characterization of mito-qc. (A and B) Analysis
GFP-LC3 +/+ CLU -/- kda CLU GFP. Actin. GFP-LC3 +/+ CLU -/- kda CLU GFP. Actin
 Supplementary Fig. 1 a CQ treatment ScrB OGX11 MG132 I II AZD5363 I II b GFP / / GFP / / GFP / / GFP / / GFP GFP Actin Actin ctrl CQ GFP / / GFP / / GFP / / GFP / / GFP GFP Actin Actin rapamycin rapamycincq
Supplementary Figure 1. Validation of astrocytes. Primary astrocytes were
 Supplementary Figure 1. Validation of astrocytes. Primary astrocytes were separated from the glial cultures using a mild trypsinization protocol. Anti-glial fibrillary acidic protein (GFAP) immunofluorescent
SUPPLEMENTARY INFORMATION
 DOI:.38/ncb2822 a MTC02 FAO cells EEA1 b +/+ MEFs /DAPI -/- MEFs /DAPI -/- MEFs //DAPI c HEK 293 cells WCE N M C P AKT TBC1D7 Lamin A/C EEA1 VDAC d HeLa cells WCE N M C P AKT Lamin A/C EEA1 VDAC Figure
Role of Autophagy in Glycogen Breakdown and Its Relevance to Chloroquine Myopathy
 Role of Autophagy in Glycogen Breakdown and Its Relevance to Chloroquine Myopathy Jonathan Zirin 1 *, Joppe Nieuwenhuis 1, Norbert Perrimon 1,2 * 1 Department of Genetics, Harvard Medical School, Boston,
Rapid parallel measurements of macroautophagy and mitophagy in
 Supplemental Figures Rapid parallel measurements of macroautophagy and mitophagy in mammalian cells using a single fluorescent biosensor Sargsyan A, Cai J, Fandino LB, Labasky ME, Forostyan T, Colosimo
Nature Methods: doi: /nmeth.4257
 Supplementary Figure 1 Screen for polypeptides that affect cellular actin filaments. (a) Table summarizing results from all polypeptides tested. Source shows organism, gene, and amino acid numbers used.
SUPPLEMENTARY FIGURE LEGENDS. atypical adenomatous hyperplasias (AAH); Grade II: adenomas; Grade III: adenocarcinomas;
; Grade II: adenomas; Grade III: adenocarcinomas;") SUPPLEMENTARY FIGURE LEGENDS Supplementary Figure S1: Tumor grades in Ras G12D ; p53 / lung tumors. Representative histology (H&E) of K-Ras G12D ; p53 / lung tumors 13 weeks after tumor initiation. Grade
SUPPLEMENTARY FIGURE LEGENDS Supplementary Figure S1: Tumor grades in Ras G12D ; p53 / lung tumors. Representative histology (H&E) of K-Ras G12D ; p53 / lung tumors 13 weeks after tumor initiation. Grade
Supplementary Figure S1. Distinct compartmentalization of proinsulin in obese db/db mouse islet ß- cells.
 Supplementary Figure S1. Distinct compartmentalization of proinsulin in obese db/db mouse islet ß- cells. Pancreata from 16-weeks-old 6J +/+, 6J db/db, KS +/+ and KS db/db mice were harvested, fixed with
Figure S1. HP1α localizes to centromeres in mitosis and interacts with INCENP. (A&B) HeLa
 HeLa") SUPPLEMENTARY FIGURES Figure S1. HP1α localizes to centromeres in mitosis and interacts with INCENP. (A&B) HeLa tet-on cells that stably express HP1α-CFP, HP1β-CFP, or HP1γ-CFP were monitored with livecell
SUPPLEMENTARY FIGURES Figure S1. HP1α localizes to centromeres in mitosis and interacts with INCENP. (A&B) HeLa tet-on cells that stably express HP1α-CFP, HP1β-CFP, or HP1γ-CFP were monitored with livecell
klp-18 (RNAi) Control. supplementary information. starting strain: AV335 [emb-27(g48); GFP::histone; GFP::tubulin] bleach
![klp-18 (RNAi) Control. supplementary information. starting strain: AV335 [emb-27(g48); GFP::histone; GFP::tubulin] bleach](/thumbs/91/104639484.jpg "klp-18 (RNAi) Control. supplementary information. starting strain: AV335 [emb-27(g48); GFP::histone; GFP::tubulin] bleach") DOI: 10.1038/ncb1891 A. starting strain: AV335 [emb-27(g48); GFP::histone; GFP::tubulin] bleach embryos let hatch overnight transfer to RNAi plates; incubate 5 days at 15 C RNAi food L1 worms adult worms
DOI: 10.1038/ncb1891 A. starting strain: AV335 [emb-27(g48); GFP::histone; GFP::tubulin] bleach embryos let hatch overnight transfer to RNAi plates; incubate 5 days at 15 C RNAi food L1 worms adult worms
Supplementary information
 Supplementary information 1 Supplementary Figure 1. CALM regulates autophagy. (a). Quantification of LC3 levels in the experiment described in Figure 1A. Data are mean +/- SD (n > 3 experiments for each
GFP/Iba1/GFAP. Brain. Liver. Kidney. Lung. Hoechst/Iba1/TLR9!
 Supplementary information a +KA Relative expression d! Tlr9 5!! 5! NSC Neuron Astrocyte Microglia! 5! Tlr7!!!! NSC Neuron Astrocyte! GFP/Sβ/! Iba/Hoechst Microglia e Hoechst/Iba/TLR9! GFP/Iba/GFAP f Brain
(a) Schematic diagram of the FS mutation of UVRAG in exon 8 containing the highly instable
 Schematic diagram of the FS mutation of UVRAG in exon 8 containing the highly instable") Supplementary Figure 1. Frameshift (FS) mutation in UVRAG. (a) Schematic diagram of the FS mutation of UVRAG in exon 8 containing the highly instable A 10 DNA repeat, generating a premature stop codon
Supplementary Figure 1. Frameshift (FS) mutation in UVRAG. (a) Schematic diagram of the FS mutation of UVRAG in exon 8 containing the highly instable A 10 DNA repeat, generating a premature stop codon
Kinase Inhibitor p21 WAF1/CIP1 in Apoptosis and Autophagy
 Pivotal Role of the Cyclin-dependent Kinase Inhibitor p21 WAF1/CIP1 in Apoptosis and Autophagy Keishi Fujiwara, Shigeru Daido, Akitsugu Yamamoto, Ryuji Kobayash, Tomohisa Yokoyama, Hiroshi Aok, Eiji Iwado,
Downregulation of the small GTPase SAR1A: a key event underlying alcohol-induced Golgi fragmentation in hepatocytes
 Downregulation of the small GTPase SAR1A: a key event underlying alcohol-induced Golgi fragmentation in hepatocytes Armen Petrosyan 1*, Pi-Wan Cheng 1,3, Dahn L. Clemens 2,3 & Carol A. Casey 2,3 1 Department
Supplementary Figures
 Supplementary Figures Supplementary Figure 1. nrg1 bns101/bns101 embryos develop a functional heart and survive to adulthood (a-b) Cartoon of Talen-induced nrg1 mutation with a 14-base-pair deletion in
Supplementary Information. Cofilin Regulates Nuclear Architecture through a Myosin-II Dependent Mechanotransduction Module
 Supplementary Information Cofilin Regulates Nuclear Architecture through a Myosin-II Dependent Mechanotransduction Module O Neil Wiggan, Bryce Schroder, Diego Krapf, James R. Bamurg and Jennifer G. DeLuca
Supporting Online Material for
 www.sciencemag.org/cgi/content/full/1171320/dc1 Supporting Online Material for A Frazzled/DCC-Dependent Transcriptional Switch Regulates Midline Axon Guidance Long Yang, David S. Garbe, Greg J. Bashaw*
Supplementary Figure 1. Procedures to independently control fly hunger and thirst states.
 Supplementary Figure 1 Procedures to independently control fly hunger and thirst states. (a) Protocol to produce exclusively hungry or thirsty flies for 6 h water memory retrieval. (b) Consumption assays
Figure S1. PMVs from THP-1 cells expose phosphatidylserine and carry actin. A) Flow
 Flow") SUPPLEMENTARY DATA Supplementary Figure Legends Figure S1. PMVs from THP-1 cells expose phosphatidylserine and carry actin. A) Flow cytometry analysis of PMVs labelled with annexin-v-pe (Guava technologies)
SUPPLEMENTARY DATA Supplementary Figure Legends Figure S1. PMVs from THP-1 cells expose phosphatidylserine and carry actin. A) Flow cytometry analysis of PMVs labelled with annexin-v-pe (Guava technologies)
THE ROLE OF ALTERED CALCIUM AND mtor SIGNALING IN THE PATHOGENESIS OF CYSTINOSIS
 Research Foundation, 18 month progress report THE ROLE OF ALTERED CALCIUM AND mtor SIGNALING IN THE PATHOGENESIS OF CYSTINOSIS Ekaterina Ivanova, doctoral student Elena Levtchenko, MD, PhD, PI Antonella
SUPPLEMENTARY INFORMATION
 SUPPLEMENTARY INFORMATION doi:10.1038/nature11429 S1a 6 7 8 9 Nlrc4 allele S1b Nlrc4 +/+ Nlrc4 +/F Nlrc4 F/F 9 Targeting construct 422 bp 273 bp FRT-neo-gb-PGK-FRT 3x.STOP S1c Nlrc4 +/+ Nlrc4 F/F casp1
SUPPLEMENTARY INFORMATION
 doi:10.1038/nature12652 Supplementary Figure 1. PRDM16 interacts with endogenous EHMT1 in brown adipocytes. Immunoprecipitation of PRDM16 complex by flag antibody (M2) followed by Western blot analysis
Supplementary Material
 Electronic Supplementary Material (ESI) for Integrative Biology. This journal is The Royal Society of Chemistry 2018 Supplementary Material 1 Supplemental Figures Supplemental Figure S1. Mechanical properties
(a) Significant biological processes (upper panel) and disease biomarkers (lower panel)
 Significant biological processes (upper panel) and disease biomarkers (lower panel)") Supplementary Figure 1. Functional enrichment analyses of secretomic proteins. (a) Significant biological processes (upper panel) and disease biomarkers (lower panel) 2 involved by hrab37-mediated secretory
Supplementary Figure 1. Functional enrichment analyses of secretomic proteins. (a) Significant biological processes (upper panel) and disease biomarkers (lower panel) 2 involved by hrab37-mediated secretory
supplementary information
 DOI: 10.1038/ncb2153 Figure S1 Ectopic expression of HAUSP up-regulates REST protein. (a) Immunoblotting showed that ectopic expression of HAUSP increased REST protein levels in ENStemA NPCs. (b) Immunofluorescent
Title: Epigenetic mechanisms underlying maternal diabetes-associated risk of congenital heart disease
 1 Supplemental Materials 2 3 Title: Epigenetic mechanisms underlying maternal diabetes-associated risk of congenital heart disease 4 5 6 Authors: Madhumita Basu, 1 Jun-Yi Zhu, 2 Stephanie LaHaye 1,3, Uddalak
Non-autonomous crosstalk between the Jak/Stat and Egfr pathways mediates Apc1-driven intestinal stem cell hyperplasia in the Drosophila adult midgut
 4524 RESEARCH ARTICLE AND STEM CELLS Development 139, 4524-4535 (2012) doi:10.1242/dev.078261 2012. Published by The Company of Biologists Ltd Non-autonomous crosstalk between the Jak/Stat and Egfr pathways
T H E J O U R N A L O F C E L L B I O L O G Y
 Supplemental material Brooks and Wallingford, http://www.jcb.org/cgi/content/full/jcb.201204072/dc1 T H E J O U R N A L O F C E L L B I O L O G Y Figure S1. Quantification of ciliary compartments in control
Supplementary Materials for
 www.sciencetranslationalmedicine.org/cgi/content/full/4/117/117ra8/dc1 Supplementary Materials for Notch4 Normalization Reduces Blood Vessel Size in Arteriovenous Malformations Patrick A. Murphy, Tyson
Relative SOD1 activity. Relative SOD2 activity. Relative SOD activity (Infected:Mock) + CP + DDC
 + CP + DDC") Supplementary Figure 1. SOD1 activity is significantly increased relative to SOD1 levels. SOD1 and SOD2 activities in the infected mork13 cells are shown normalised to their corresponding levels and relative
Supplementary Figure 1. SOD1 activity is significantly increased relative to SOD1 levels. SOD1 and SOD2 activities in the infected mork13 cells are shown normalised to their corresponding levels and relative
a) Primary cultures derived from the pancreas of an 11-week-old Pdx1-Cre; K-MADM-p53
 Primary cultures derived from the pancreas of an 11-week-old Pdx1-Cre; K-MADM-p53") 1 2 3 4 5 6 7 8 9 10 Supplementary Figure 1. Induction of p53 LOH by MADM. a) Primary cultures derived from the pancreas of an 11-week-old Pdx1-Cre; K-MADM-p53 mouse revealed increased p53 KO/KO (green,
1 2 3 4 5 6 7 8 9 10 Supplementary Figure 1. Induction of p53 LOH by MADM. a) Primary cultures derived from the pancreas of an 11-week-old Pdx1-Cre; K-MADM-p53 mouse revealed increased p53 KO/KO (green,
Bidirectional Notch signaling regulates Drosophila intestinal stem cell multipotency
 RESEARCH RESEARCH ARTICLE SUMMARY STEM CELL REGULATION Bidirectional Notch signaling regulates Drosophila intestinal stem cell multipotency Zheng Guo and Benjamin Ohlstein* INTRODUCTION: In the Drosophila
Supplemental Information. Figures. Figure S1
 Supplemental Information Figures Figure S1 Identification of JAGGER T-DNA insertions. A. Positions of T-DNA and Ds insertions in JAGGER are indicated by inverted triangles, the grey box represents the
Supplementary Figure 1. Nature Neuroscience: doi: /nn.4547
 Supplementary Figure 1 Characterization of the Microfetti mouse model. (a) Gating strategy for 8-color flow analysis of peripheral Ly-6C + monocytes from Microfetti mice 5-7 days after TAM treatment. Living
ROCK/Cdc42-mediated microglial motility and gliapse formation lead to phagocytosis of degenerating dopaminergic neurons in vivo
 Supplementary Information ROCK/Cdc42-mediated microglial motility and gliapse formation lead to phagocytosis of degenerating dopaminergic neurons in vivo Carlos Barcia* 1,2, Carmen M Ros 1,2, Valentina
supplementary information
 DOI: 10.1038/ncb2133 Figure S1 Actomyosin organisation in human squamous cell carcinoma. (a) Three examples of actomyosin organisation around the edges of squamous cell carcinoma biopsies are shown. Myosin
SUPPLEMENTARY FIGURES
 SUPPLEMENTARY FIGURES Supplementary Figure S1: Fibroblast-induced elongation of cancer cells requires direct contact with living fibroblasts. A. Representative images of HT29-GFP cultured in the presence