Supplementary Figure 1: GFAP positive nerves in patients with adenocarcinoma of
|
|
|
- Quentin Farmer
- 5 years ago
- Views:
Transcription
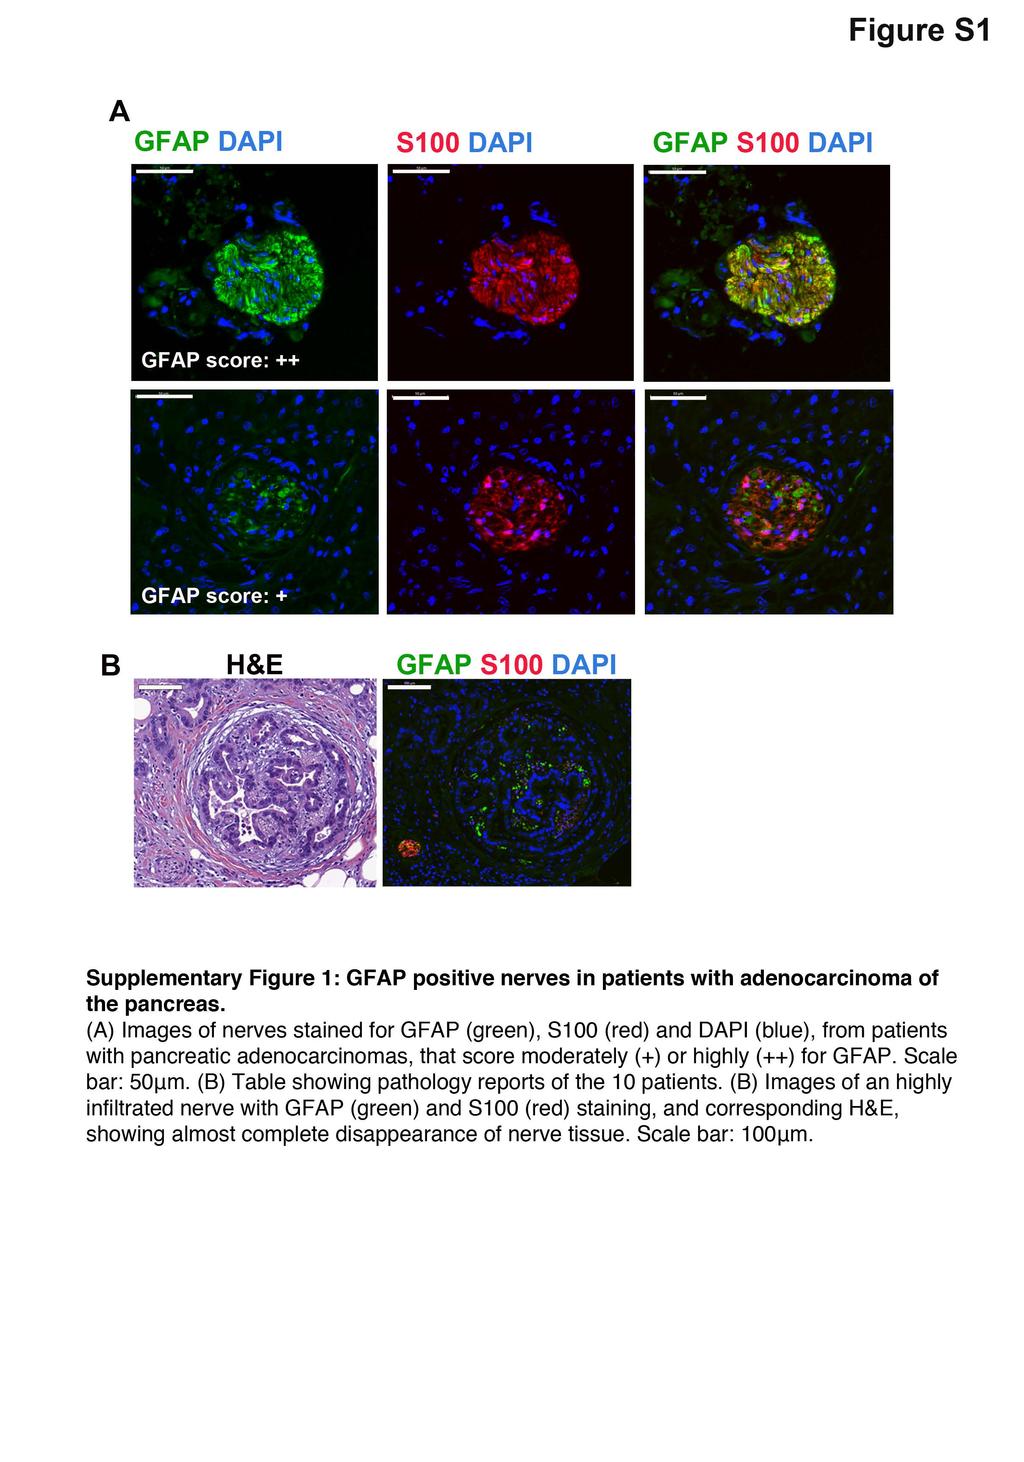
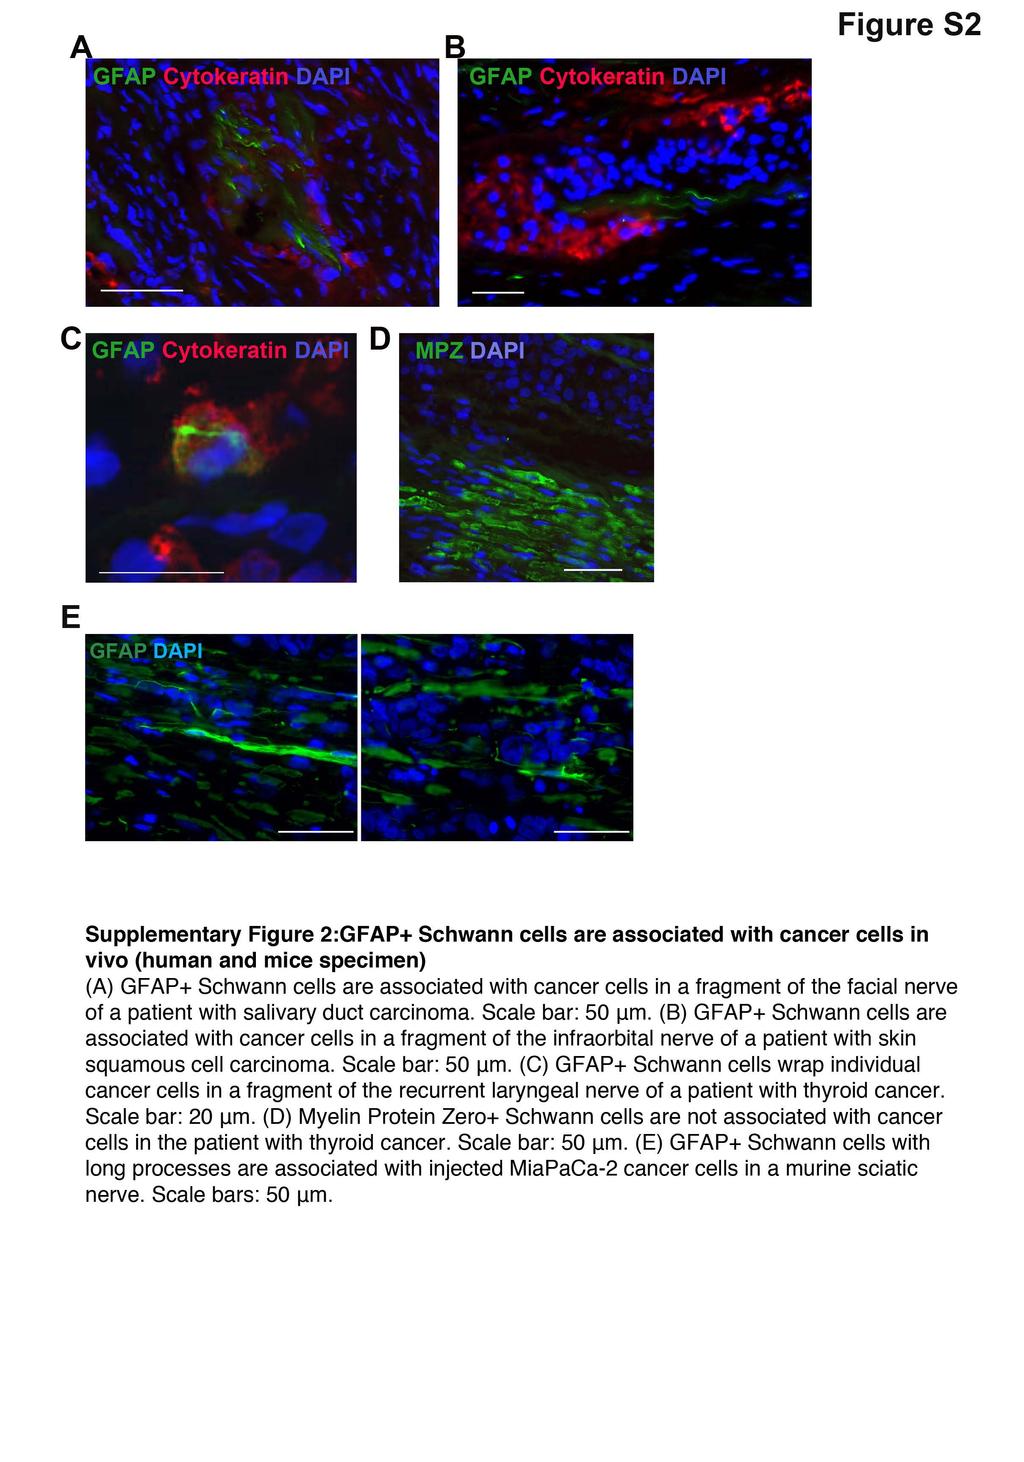
1 SUPPLEMENTARY FIGURES AND MOVIE LEGENDS Supplementary Figure 1: GFAP positive nerves in patients with adenocarcinoma of the pancreas. (A) Images of nerves stained for GFAP (green), S100 (red) and DAPI (blue), from patients with pancreatic adenocarcinomas, that score moderately (+) or highly (++) for GFAP. Scale bar: 50μm. (B) Table showing pathology reports of the 10 patients. (B) Images of an highly infiltrated nerve with GFAP (green) and S100 (red) staining, and corresponding H&E, showing almost complete disappearance of nerve tissue. Scale bar: 100μm. Supplementary Figure 2:GFAP+ Schwann cells are associated with cancer cells in vivo (human and mice specimen) (A) GFAP+ Schwann cells are associated with cancer cells in a fragment of the facial nerve of a patient with salivary duct carcinoma. Scale bar: 50 μm. (B) GFAP+ Schwann cells are associated with cancer cells in a fragment of the infraorbital nerve of a patient with skin squamous cell carcinoma. Scale bar: 50 μm. (C) GFAP+ Schwann cells wrap individual cancer cells in a fragment of the recurrent laryngeal nerve of a patient with thyroid cancer. Scale bar: 20 μm. (D) Myelin Protein Zero+ Schwann cells are not associated with cancer cells in the patient with thyroid cancer. Scale bar: 50 μm. (E) GFAP+ Schwann cells with long processes are associated with injected MiaPaCa-2 cancer cells in a murine sciatic nerve. Scale bars: 50 μm.
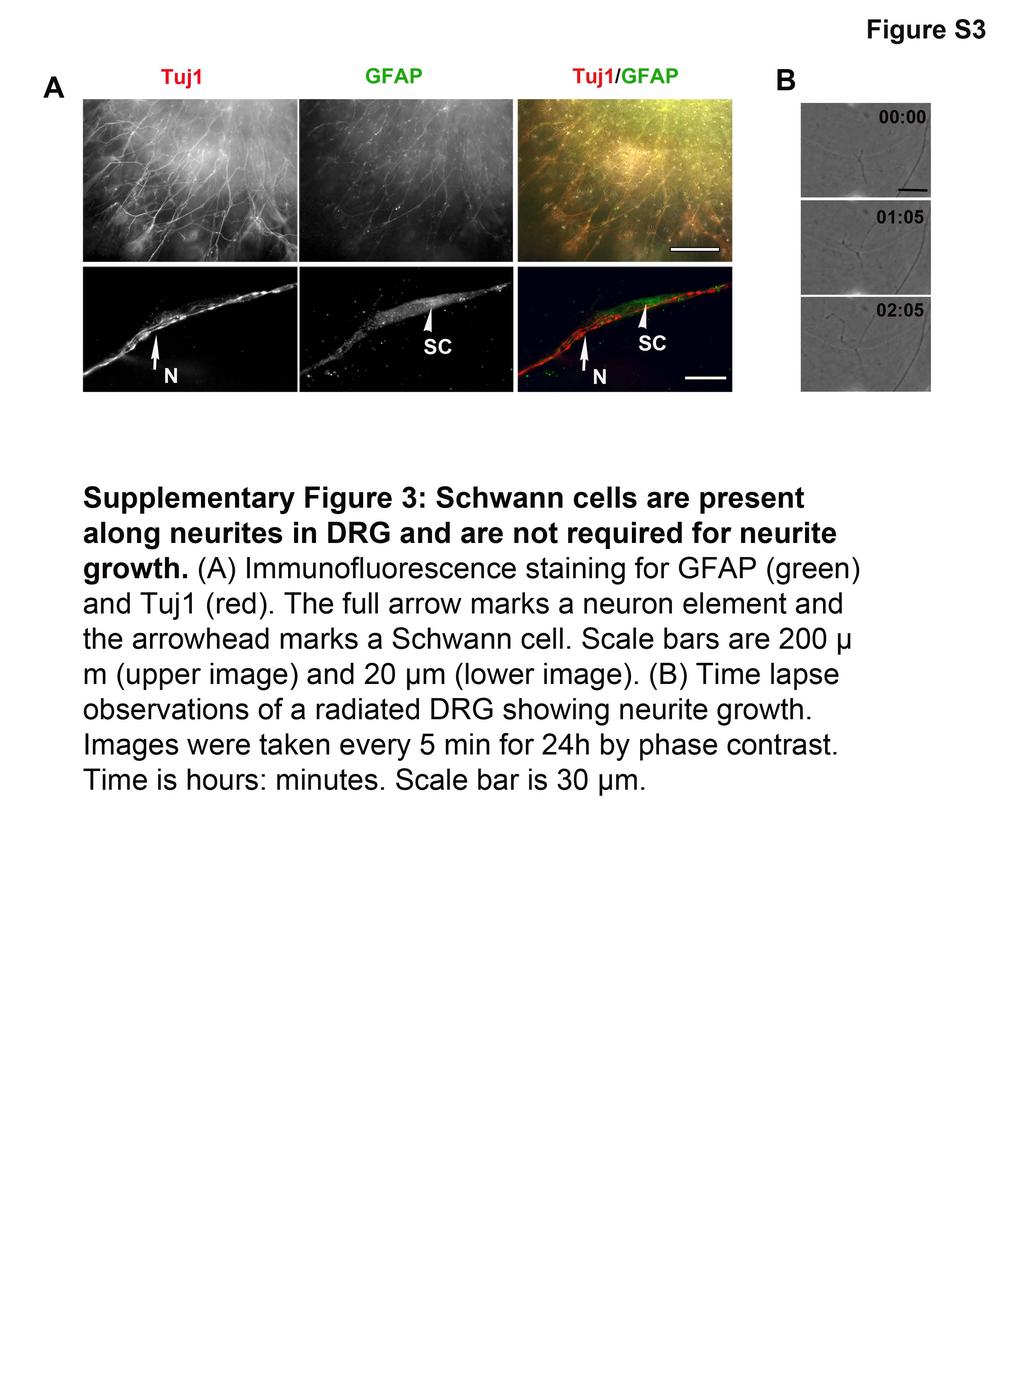
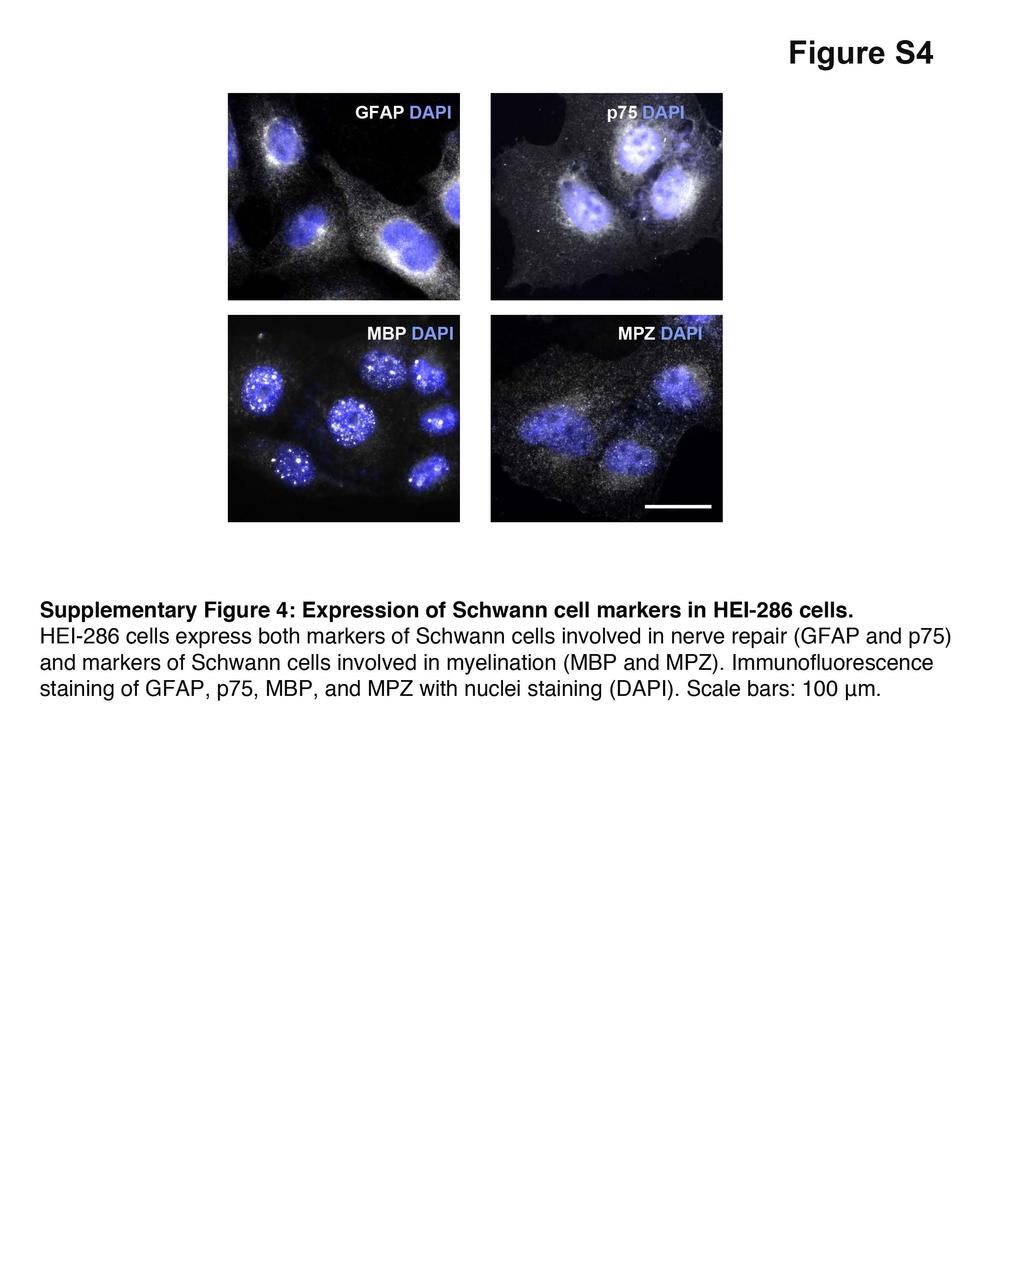
2 Supplementary Figure 3: Schwann cells are present along neurites in DRG and are not required for neurite growth. (A) Immunofluorescence staining for GFAP (green) and Tuj1 (red). The full arrow marks a neuron element and the arrowhead marks a Schwann cell. Scale bars are 200 μm (upper image) and 20 μm (lower image). (B) Time lapse observations of a radiated DRG showing neurite growth. Images were taken every 5 min for 24h by phase contrast. Time is hours: minutes. Scale bar is 30 μm. Supplementary Figure 4: Expression of Schwann cell markers in HEI-286 cells. HEI-286 cells express both markers of Schwann cells involved in nerve repair (GFAP and p75) and markers of Schwann cells involved in myelination (MBP and MPZ). Immunofluorescence staining of GFAP, p75, MBP, and MPZ with nuclei staining (DAPI). Scale bars: 100 μm. Supplementary Figure 5: Reorganization of cancer cell clusters (A) Panc1 cancer cell clusters reorganize in presence of Schwann cells. Microscopic examination of organization of Panc1 cancer cells grown in Matrigel together with Schwann cells. Quantification of cancer cell reorganization using the shape factor index for Panc1 clusters growing with (HEI) or without (No HEI) HEI-286 Schwann cells. Data are means ± SEM. Significance was determined using t test (****p<0.0001, n (No HEI)=9, n (HEI)=7). (B) Microscopic examination of MiaPaCa-2 cell organization in Matrigel with NIH3T3. The cancer cell cluster shape is unaffected by contact with NIH3T3 (See quantification in Figure 6). Scale bars: 50 μm.
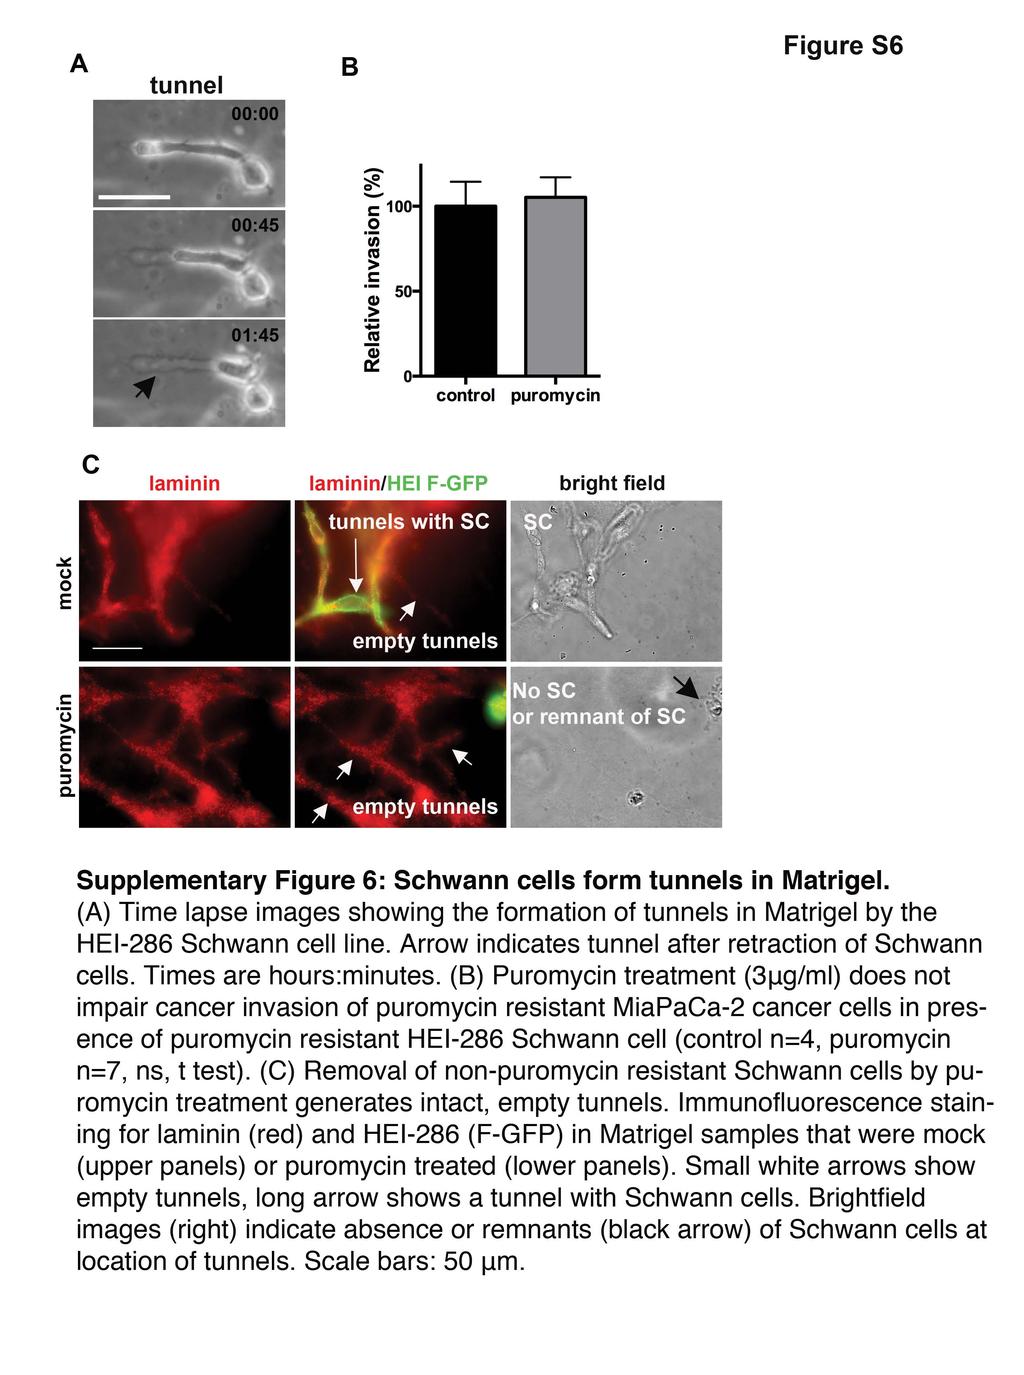
3 Supplementary Figure 6: Schwann cells form tunnels in Matrigel. (A) Time lapse images showing the formation of tunnels in Matrigel by the HEI-286 Schwann cell line. Arrow indicates tunnel after retraction of Schwann cells. Times are hours:minutes. (B) Puromycin treatment (3μg/ml) does not impair cancer invasion of puromycin resistant MiaPaCa-2 cancer cells in presence of puromycin resistant HEI-286 Schwann cell (control n=4, puromycin n=7, ns, t test). (C) Removal of non-puromycin resistant Schwann cells by puromycin treatment generates intact, empty tunnels. Immunofluorescence staining for laminin (red) and HEI-286 (F-GFP) in Matrigel samples that were mock (upper panels) or puromycin treated (lower panels). Small white arrows show empty tunnels, long arrow shows a tunnel with Schwann cells. Brightfield images (right) indicate absence or remnants (black arrow) of Schwann cells at location of tunnels. Scale bars: 50 μm. Supplementary Figure 7: Characterization of NCAM depleted HEI-286 Schwann cells. (A) Immunofluorescence staining for NCAM in control (sh) and NCAM depleted (sh NCAM1) HEI-286 cells. Scale bar: 20 μm. (B). Cell proliferation of control (sh), and NCAM depleted (shncam1 and shncam2) HEI-286 cells. Data are mean ± SD, n=3 for each data point. (C) Quantification of velocity of control (sh cont) and NCAM depleted (shncam) HEI-286 cells. Cells were seeded in insert (Ibidi) for 24h and allowed to migrate after removal of the insert. Velocity was calculated after measuring distance covered over a 24h period. Data are means ± SEM, n=7 for each cell type. Difference was not found significant, as determined using t test.
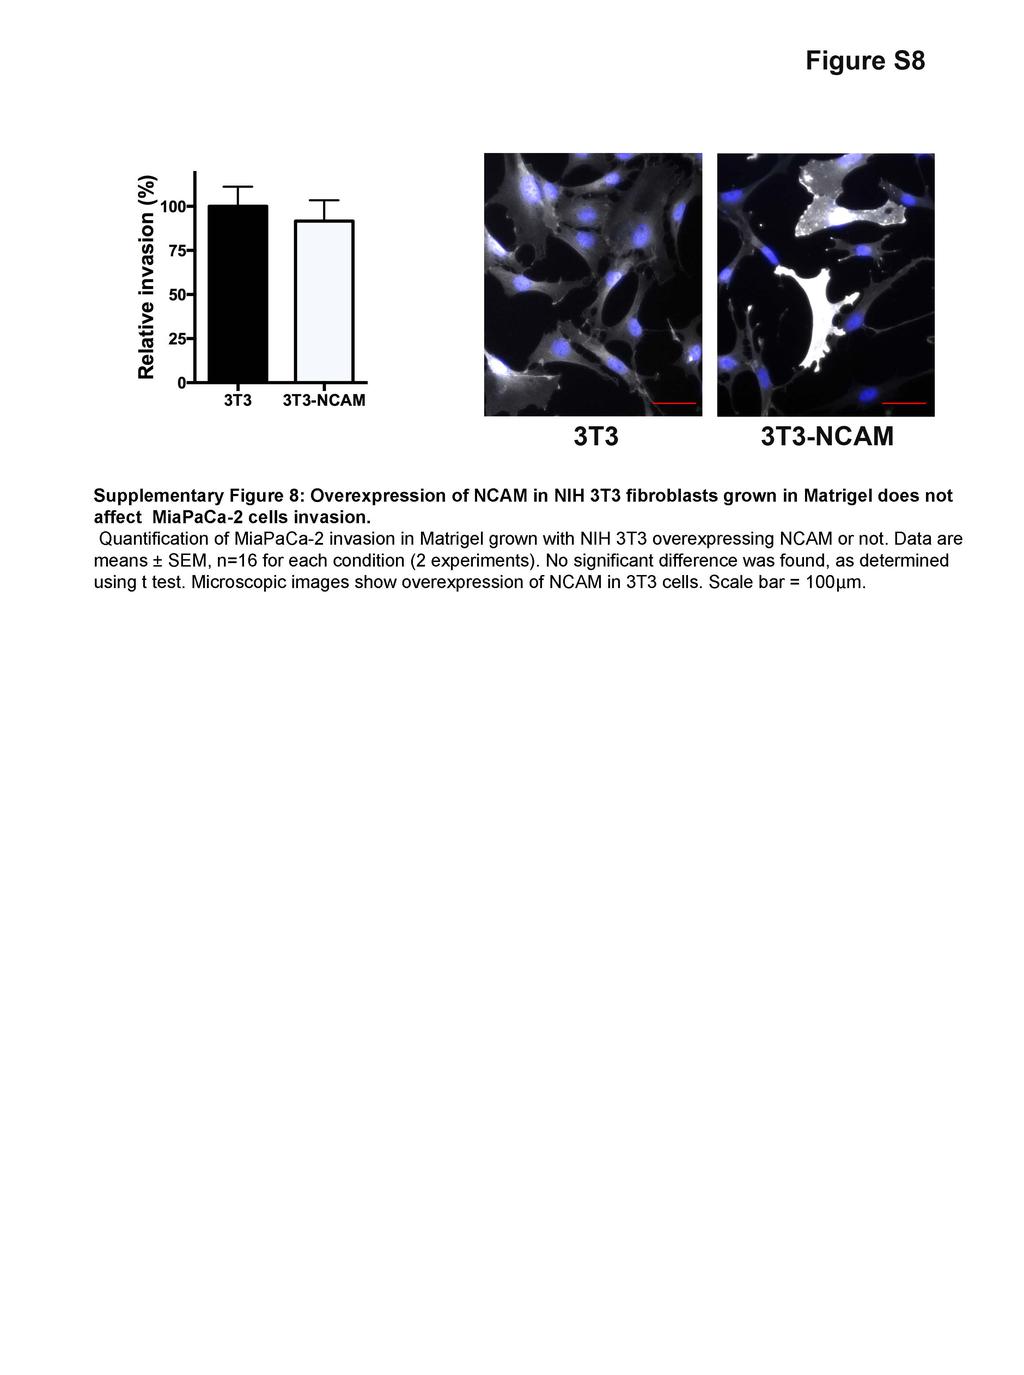
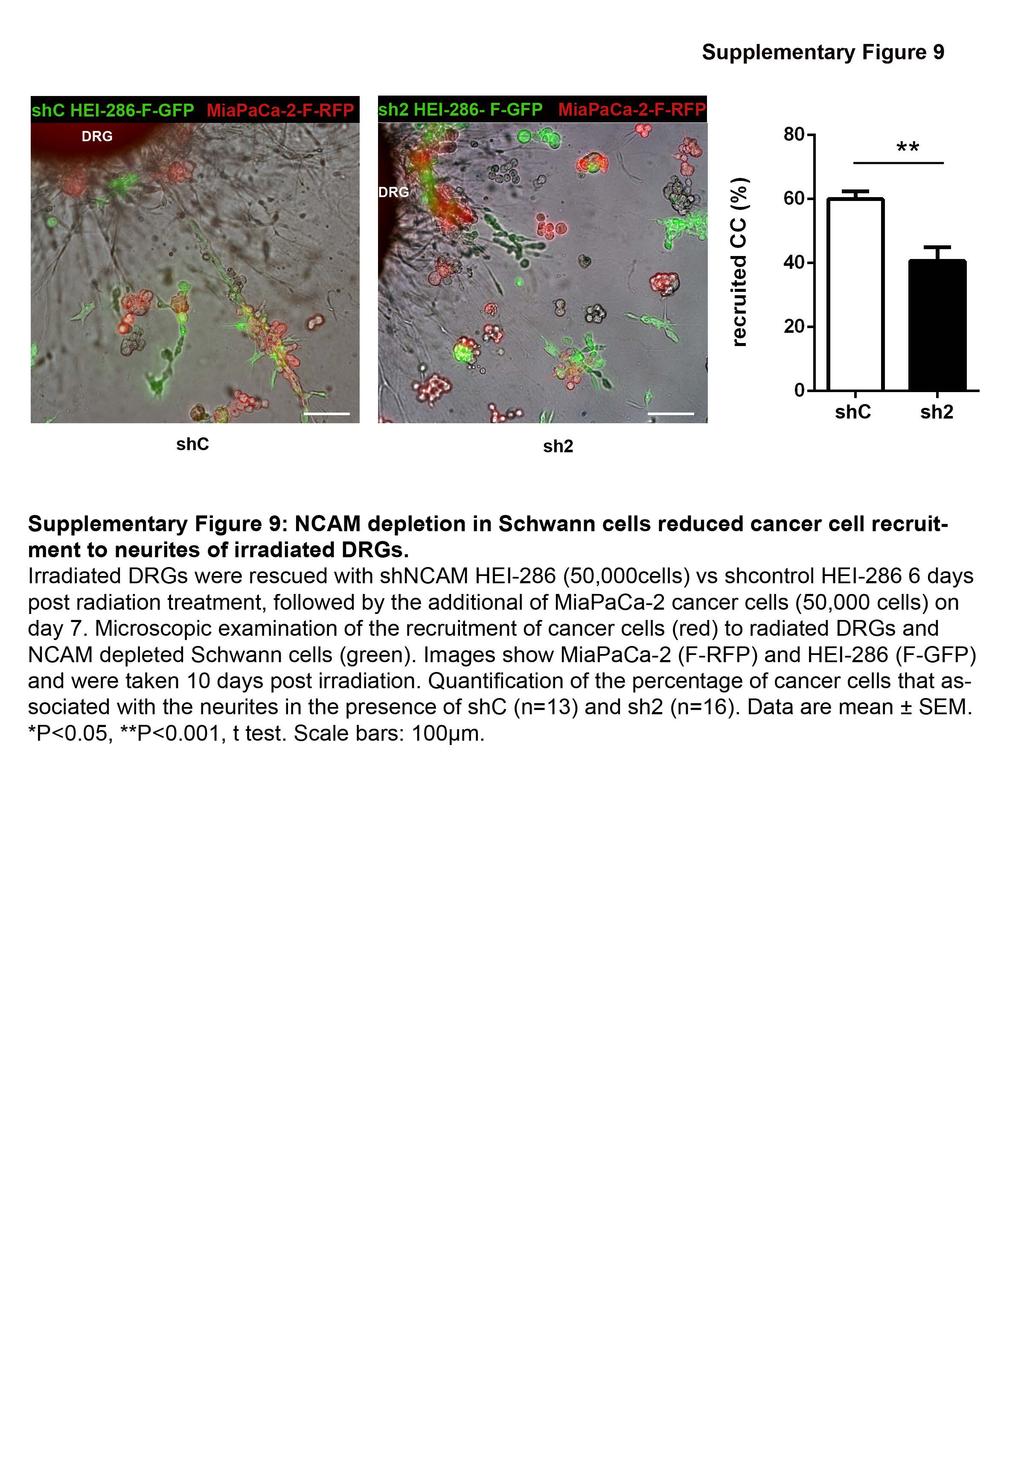
4 Supplementary Figure 8: Overexpression of NCAM in NIH 3T3 fibroblasts grown in Matrigel does not affect MiaPaCa-2 cells invasion. Quantification of MiaPaCa-2 invasion in Matrigel grown with NIH 3T3 overexpressing NCAM or not. Data are means ± SEM, n=16 for each condition (2 experiments). No significant difference was found, as determined using t test. Microscopic images show overexpression of NCAM in 3T3 cells. Scale bar = 100μm. Supplementary Figure 9: NCAM depletion in Schwann cells reduced cancer cell recruitment to neurites of irradiated DRGs. Irradiated DRGs were rescued with shncam HEI-286 (50,000cells) vs shcontrol HEI days post radiation treatment, followed by the additional of MiaPaCa-2 cancer cells (50,000 cells) on day 7. Microscopic examination of the recruitment of cancer cells (red) to radiated DRGs and NCAM depleted Schwann cells (green). Images show MiaPaCa-2 (F-RFP) and HEI-286 (F-GFP) and were taken 10 days post irradiation. Quantification of the percentage of cancer cells that associated with the neurites in the presence of shc (n=13) and sh2 (n=16). Data are mean ± SEM. *P<0.05, **P<0.001, t test. Scale bars: 100μm. MOVIES: Movie S1. Time lapse of DRG and MiaPaCa-2 (expressing F-RFP) co-cultures. (A) MiaPaCa-2 cells move along neurites toward the center of the DRG. (B) Association of a
5 Schwann cell and cancer cell during cancer cell migration.(c) A cluster of cancer cells approaching a neurite projection via an association (bridge) with Schwann cells. (D) A cluster of cancer cells that are not directed to a neurite projection (control for cells from movie C). Images were taken every 5 min for 24h by phase contrast and fluorescence microscopy. Time is hours:minutes. Scale bars are 30 µm. Movie S2. Time lapse observations of MiaPaCa-2 (F-RFP) and Schwann cells (HEI- 286 F-GFP) in 3D Matrigel. (A) Formation of a chain of cancer cells (red) in contact with Schwann cells (green) (See figure 5B). (B) Isolation of a single cell from a cluster of cancer cells (red). Note that this cancer cell is constantly in contact with a Schwann cell (green) during the dissociation of the cancer cell from its cluster (See figure 5B). Images were taken every 5 min for 24h by fluorescence microscopy. Time is hours: minutes. Scale bars are 30 µm Movie S3. Time lapse observations of MiaPaCa-2 (F-RFP) and Schwann cells (HEI- 286 F-GFP) grown on top of Matrigel. (A) MiaPaCa-2 cells (red) grow as a cluster. Scale bar is 60µm. Compare with B. (See figure 6A). (B) In the presence of Schwann cells, MiaPaCa-2 cells dissociate from the cluster. The dissociated cancer cell is constantly in contact with Schwann cells. Scale bar is 60µm. Compare with movie A (See figure 6A). (C) Intercalation of Schwann cells between MiaPaCa-2 cells before the dissociation of a cancer cell from its cluster. Note the protrusion of the Schwann cells intercalating between cancer cells and the loss of strong contact between cancer cells. Scale bar is 60 µm (See figure 6B-D). (D) Formation of a cancer cell protrusion after
6 contact with a Schwann cell. Scale bar is 80µm. (See Figure 6D). (E) Sequential events: cancer cell protrusion, Schwann cell intercalation and cancer cell migration after heterocellular contact Schwann cell-cancer cell. Scale bar is 80µm (See Figure 6D). Images were taken every 5 min for 24h by phase contrast and fluorescence microscopy. Time is hours:minutes.
7
8
9
10

11
12

13
14
15
SUPPLEMENTARY LEGENDS...
 TABLE OF CONTENTS SUPPLEMENTARY LEGENDS... 2 11 MOVIE S1... 2 FIGURE S1 LEGEND... 3 FIGURE S2 LEGEND... 4 FIGURE S3 LEGEND... 5 FIGURE S4 LEGEND... 6 FIGURE S5 LEGEND... 7 FIGURE S6 LEGEND... 8 FIGURE
Supplementary Figure 1 Expression of Crb3 in mouse sciatic nerve: biochemical analysis (a) Schematic of Crb3 isoforms, ERLI and CLPI, indicating the
 Schematic of Crb3 isoforms, ERLI and CLPI, indicating the") Supplementary Figure 1 Expression of Crb3 in mouse sciatic nerve: biochemical analysis (a) Schematic of Crb3 isoforms, ERLI and CLPI, indicating the location of the transmembrane (TM), FRM binding (FB)
Supplementary Figure 1 Expression of Crb3 in mouse sciatic nerve: biochemical analysis (a) Schematic of Crb3 isoforms, ERLI and CLPI, indicating the location of the transmembrane (TM), FRM binding (FB)
Figure S1: Effects on haptotaxis are independent of effects on cell velocity A)
") Supplemental Figures Figure S1: Effects on haptotaxis are independent of effects on cell velocity A) Velocity of MV D7 fibroblasts expressing different GFP-tagged Ena/VASP family proteins in the haptotaxis
Supplemental Figures Figure S1: Effects on haptotaxis are independent of effects on cell velocity A) Velocity of MV D7 fibroblasts expressing different GFP-tagged Ena/VASP family proteins in the haptotaxis
Supplementary Figure 1. Double-staining immunofluorescence analysis of invasive colon and breast cancers. Specimens from invasive ductal breast
 Supplementary Figure 1. Double-staining immunofluorescence analysis of invasive colon and breast cancers. Specimens from invasive ductal breast carcinoma (a) and colon adenocarcinoma (b) were staining
(a) Significant biological processes (upper panel) and disease biomarkers (lower panel)
 Significant biological processes (upper panel) and disease biomarkers (lower panel)") Supplementary Figure 1. Functional enrichment analyses of secretomic proteins. (a) Significant biological processes (upper panel) and disease biomarkers (lower panel) 2 involved by hrab37-mediated secretory
Supplementary Figure 1. Functional enrichment analyses of secretomic proteins. (a) Significant biological processes (upper panel) and disease biomarkers (lower panel) 2 involved by hrab37-mediated secretory
SUPPLEMENTARY FIGURE LEGENDS. atypical adenomatous hyperplasias (AAH); Grade II: adenomas; Grade III: adenocarcinomas;
; Grade II: adenomas; Grade III: adenocarcinomas;") SUPPLEMENTARY FIGURE LEGENDS Supplementary Figure S1: Tumor grades in Ras G12D ; p53 / lung tumors. Representative histology (H&E) of K-Ras G12D ; p53 / lung tumors 13 weeks after tumor initiation. Grade
SUPPLEMENTARY FIGURE LEGENDS Supplementary Figure S1: Tumor grades in Ras G12D ; p53 / lung tumors. Representative histology (H&E) of K-Ras G12D ; p53 / lung tumors 13 weeks after tumor initiation. Grade
SUPPLEMENTARY INFORMATION
 DOI:.38/ncb3399 a b c d FSP DAPI 5mm mm 5mm 5mm e Correspond to melanoma in-situ Figure a DCT FSP- f MITF mm mm MlanaA melanoma in-situ DCT 5mm FSP- mm mm mm mm mm g melanoma in-situ MITF MlanaA mm mm
Influenza virus exploits tunneling nanotubes for cell-to-cell spread
 Supplementary Information Influenza virus exploits tunneling nanotubes for cell-to-cell spread Amrita Kumar 1, Jin Hyang Kim 1, Priya Ranjan 1, Maureen G. Metcalfe 2, Weiping Cao 1, Margarita Mishina 1,
SUPPLEMENTARY FIGURES
 SUPPLEMENTARY FIGURES 1 2 3 4 SUPPLEMENTARY TABLES Supplementary Table S1. Brain Tumors used in the study Code Tumor Classification Age Gender HuTuP51 Glioblastoma 57 Male HuTuP52 Glioblastoma 53 Male
Supplementary Materials. for Garmy-Susini, et al, Integrin 4 1 signaling is required for lymphangiogenesis and tumor metastasis
 Supplementary Materials for Garmy-Susini, et al, Integrin 4 1 signaling is required for lymphangiogenesis and tumor metastasis 1 Supplementary Figure Legends Supplementary Figure 1: Integrin expression
Supplemental Figure 1. Quantification of proliferation in thyroid of WT, Ctns -/- and grafted
 Supplemental Figure 1. Quantification of proliferation in thyroid of WT, Ctns -/- and grafted Ctns -/- mice. Cells immunolabeled for the proliferation marker (Ki-67) were counted in sections (n=3 WT, n=4
Interleukin-6 promotes pancreatic cancer cell migration by rapidly activating the small GTPase CDC42
 Interleukin-6 promotes pancreatic cancer cell migration by rapidly activating the small GTPase CDC42 Gina L. Razidlo, Kevin M. Burton, and Mark A. McNiven SUPPORTING INFORMATION Figure S1. IL-6 promotes
Supplementary Information. Tissue-wide immunity against Leishmania. through collective production of nitric oxide
 Supplementary Information Tissue-wide immunity against Leishmania through collective production of nitric oxide Romain Olekhnovitch, Bernhard Ryffel, Andreas J. Müller and Philippe Bousso Supplementary
SUPPLEMENTARY FIG. S2. Representative counting fields used in quantification of the in vitro neural differentiation of pattern of dnscs.
 Supplementary Data SUPPLEMENTARY FIG. S1. Representative counting fields used in quantification of the in vitro neural differentiation of pattern of anpcs. A panel of lineage-specific markers were used
Supplementary information. The Light Intermediate Chain 2 Subpopulation of Dynein Regulates Mitotic. Spindle Orientation
 Supplementary information The Light Intermediate Chain 2 Subpopulation of Dynein Regulates Mitotic Spindle Orientation Running title: Dynein LICs distribute mitotic functions. Sagar Mahale a, d, *, Megha
Supplementary Figure 1. Nature Neuroscience: doi: /nn.4547
 Supplementary Figure 1 Characterization of the Microfetti mouse model. (a) Gating strategy for 8-color flow analysis of peripheral Ly-6C + monocytes from Microfetti mice 5-7 days after TAM treatment. Living
SUPPLEMENTARY INFORMATION
 DOI: 10.1038/ncb2294 Figure S1 Localization and function of cell wall polysaccharides in root hair cells. (a) Spinning-disk confocal sections of seven day-old A. thaliana seedlings stained with 0.1% S4B
Supplementary Figure 1
 Supplementary Figure 1 14 12 SEM4C PLXN2 8 SEM4C C 3 Cancer Cell Non Cancer Cell Expression 1 8 6 6 4 log2 ratio Expression 2 1 4 2 2 p value.1 D Supplementary Figure 1. Expression of Sema4C and Plexin2
Suppl Video: Tumor cells (green) and monocytes (white) are seeded on a confluent endothelial
 and monocytes (white) are seeded on a confluent endothelial") Supplementary Information Häuselmann et al. Monocyte induction of E-selectin-mediated endothelial activation releases VE-cadherin junctions to promote tumor cell extravasation in the metastasis cascade
Supplementary Information Häuselmann et al. Monocyte induction of E-selectin-mediated endothelial activation releases VE-cadherin junctions to promote tumor cell extravasation in the metastasis cascade
Supplementary Information. Cofilin Regulates Nuclear Architecture through a Myosin-II Dependent Mechanotransduction Module
 Supplementary Information Cofilin Regulates Nuclear Architecture through a Myosin-II Dependent Mechanotransduction Module O Neil Wiggan, Bryce Schroder, Diego Krapf, James R. Bamurg and Jennifer G. DeLuca
SUPPLEMENTARY INFORMATION
 Figure S1. Loss of Ena/VASP proteins inhibits filopodia and neuritogenesis. (a) Bar graph of filopodia number per stage 1 control and mmvvee (Mena/ VASP/EVL-null) neurons at 40hrs in culture. Loss of all
Real-time imaging reveals the single steps of brain metastasis fo mation r
 Real-time imaging reveals the single steps of brain metastasis fo mation r Yvonne Kienast, Louisa von Baumgarten, Martin Fuhrmann, Wolfgang E.F. Klinkert, Roland Goldbrunner, Jochen Herms and Frank Winkler
Supplemental Materials. STK16 regulates actin dynamics to control Golgi organization and cell cycle
 Supplemental Materials STK16 regulates actin dynamics to control Golgi organization and cell cycle Juanjuan Liu 1,2,3, Xingxing Yang 1,3, Binhua Li 1, Junjun Wang 1,2, Wenchao Wang 1, Jing Liu 1, Qingsong
SUPPLEMENTARY INFORMATION
 DOI: 10.1038/ncb2988 Supplementary Figure 1 Kif7 L130P encodes a stable protein that does not localize to cilia tips. (a) Immunoblot with KIF7 antibody in cell lysates of wild-type, Kif7 L130P and Kif7
Supplementary Figures for
 mirns regulate s Supplementary igures for MicroRNs Reprogram Normal ibroblasts into Cancer ssociated ibroblasts in Ovarian Cancer nirban K. Mitra, Marion Zillhardt, Youjia Hua, Payal iwari, ndrea E. Murmann,
a) Primary cultures derived from the pancreas of an 11-week-old Pdx1-Cre; K-MADM-p53
 Primary cultures derived from the pancreas of an 11-week-old Pdx1-Cre; K-MADM-p53") 1 2 3 4 5 6 7 8 9 10 Supplementary Figure 1. Induction of p53 LOH by MADM. a) Primary cultures derived from the pancreas of an 11-week-old Pdx1-Cre; K-MADM-p53 mouse revealed increased p53 KO/KO (green,
1 2 3 4 5 6 7 8 9 10 Supplementary Figure 1. Induction of p53 LOH by MADM. a) Primary cultures derived from the pancreas of an 11-week-old Pdx1-Cre; K-MADM-p53 mouse revealed increased p53 KO/KO (green,
Supplementary Figure 1
 Supplementary Figure 1 Kif1a RNAi effect on basal progenitor differentiation Related to Figure 2. Representative confocal images of the VZ and SVZ of rat cortices transfected at E16 with scrambled or Kif1a
(A) Cells grown in monolayer were fixed and stained for surfactant protein-c (SPC,
 Cells grown in monolayer were fixed and stained for surfactant protein-c (SPC,") Supplemental Figure Legends Figure S1. Cell line characterization (A) Cells grown in monolayer were fixed and stained for surfactant protein-c (SPC, green) and co-stained with DAPI to visualize the nuclei.
Supplemental Figure Legends Figure S1. Cell line characterization (A) Cells grown in monolayer were fixed and stained for surfactant protein-c (SPC, green) and co-stained with DAPI to visualize the nuclei.
Supplementary Materials for
 www.sciencetranslationalmedicine.org/cgi/content/full/4/117/117ra8/dc1 Supplementary Materials for Notch4 Normalization Reduces Blood Vessel Size in Arteriovenous Malformations Patrick A. Murphy, Tyson
Nature Methods: doi: /nmeth.4257
 Supplementary Figure 1 Screen for polypeptides that affect cellular actin filaments. (a) Table summarizing results from all polypeptides tested. Source shows organism, gene, and amino acid numbers used.
Nature Immunology: doi: /ni eee Supplementary Figure 1
 eee Supplementary Figure 1 Hyphae induce NET release, but yeast do not. (a) NET release by human peripheral neutrophils stimulated with a hgc1 yeast-locked C. albicans mutant (yeast) or pre-formed WT C.
Supplementary Information
 Supplementary Information Title Degeneration and impaired regeneration of gray matter oligodendrocytes in amyotrophic lateral sclerosis Authors Shin H. Kang, Ying Li, Masahiro Fukaya, Ileana Lorenzini,
Ductal pancreatic cancer modeling and drug screening using human pluripotent stem cell and patient-derived tumor organoids
 Ductal pancreatic cancer modeling and drug screening using human pluripotent stem cell and patient-derived tumor organoids Ling Huang 1, Audrey Holtzinger 1,2,11, Ishaan Jagan 1,11, Michael BeGora 1, Ines
marker. DAPI labels nuclei. Flies were 20 days old. Scale bar is 5 µm. Ctrl is
 Supplementary Figure 1. (a) Nos is detected in glial cells in both control and GFAP R79H transgenic flies (arrows), but not in deletion mutant Nos Δ15 animals. Repo is a glial cell marker. DAPI labels
Supplemental Figure 1. Intracranial transduction of a modified ptomo lentiviral vector in the mouse
 Supplemental figure legends Supplemental Figure 1. Intracranial transduction of a modified ptomo lentiviral vector in the mouse hippocampus targets GFAP-positive but not NeuN-positive cells. (A) Stereotaxic
supplementary information
 DOI: 10.1038/ncb2133 Figure S1 Actomyosin organisation in human squamous cell carcinoma. (a) Three examples of actomyosin organisation around the edges of squamous cell carcinoma biopsies are shown. Myosin
(A) SW480, DLD1, RKO and HCT116 cells were treated with DMSO or XAV939 (5 µm)
 SW480, DLD1, RKO and HCT116 cells were treated with DMSO or XAV939 (5 µm)") Supplementary Figure Legends Figure S1. Tankyrase inhibition suppresses cell proliferation in an axin/β-catenin independent manner. (A) SW480, DLD1, RKO and HCT116 cells were treated with DMSO or XAV939
Supplementary Figure Legends Figure S1. Tankyrase inhibition suppresses cell proliferation in an axin/β-catenin independent manner. (A) SW480, DLD1, RKO and HCT116 cells were treated with DMSO or XAV939
SUPPLEMENTARY INFORMATION
 SUPPLEMENTARY INFORMATION Advances in pancreatic islet monolayer culture on glass surfaces enable superresolution microscopy and insights into beta cell ciliogenesis and proliferation Edward A. Phelps,
Impact of hyper-o-glcnacylation on apoptosis and NF-κB activity SUPPLEMENTARY METHODS
 SUPPLEMENTARY METHODS 3D culture and cell proliferation- MiaPaCa-2 cell culture in 3D was performed as described previously (1). Briefly, 8-well glass chamber slides were evenly coated with 50 µl/well
mm Distance (mm)
") b a Magnet Illumination Coverslips MPs Objective 2575 µm 1875 µm 1575 µm 1075 µm 875 µm 545 µm 20µm 2 3 0.5 0.3mm 1 1000 100 10 1 0.1 1000 100 10 1 0.1 Field Induction (Gauss) 1.5 0 5 10 15 20 Distance
b a Magnet Illumination Coverslips MPs Objective 2575 µm 1875 µm 1575 µm 1075 µm 875 µm 545 µm 20µm 2 3 0.5 0.3mm 1 1000 100 10 1 0.1 1000 100 10 1 0.1 Field Induction (Gauss) 1.5 0 5 10 15 20 Distance
Supplementary Figure 1
 Supplementary Figure 1 AAV-GFP injection in the MEC of the mouse brain C57Bl/6 mice at 4 months of age were injected with AAV-GFP into the MEC and sacrificed at 7 days post injection (dpi). (a) Brains
Supplementary Figure 1. EC-specific Deletion of Snail1 Does Not Affect EC Apoptosis. (a,b) Cryo-sections of WT (a) and Snail1 LOF (b) embryos at
 Cryo-sections of WT (a) and Snail1 LOF (b) embryos at") Supplementary Figure 1. EC-specific Deletion of Snail1 Does Not Affect EC Apoptosis. (a,b) Cryo-sections of WT (a) and Snail1 LOF (b) embryos at E10.5 were double-stained for TUNEL (red) and PECAM-1 (green).
Supplementary Figure 1. EC-specific Deletion of Snail1 Does Not Affect EC Apoptosis. (a,b) Cryo-sections of WT (a) and Snail1 LOF (b) embryos at E10.5 were double-stained for TUNEL (red) and PECAM-1 (green).
SUPPLEMENTARY FIGURES
 SUPPLEMENTARY FIGURES 1 Supplementary Figure 1, Adult hippocampal QNPs and TAPs uniformly express REST a-b) Confocal images of adult hippocampal mouse sections showing GFAP (green), Sox2 (red), and REST
Supplementary Materials
 Supplementary Materials Fig. S1. Weights of full-dose treatment groups comparing 1 st, 2 nd, and 3 rd generation gene replacement therapy. Mice were treated at p1 with 4x10 11 GC of the three different
Fig. S1. Subcellular localization of overexpressed LPP3wt-GFP in COS-7 and HeLa cells. Cos7 (top) and HeLa (bottom) cells expressing for 24 h human
 and HeLa (bottom) cells expressing for 24 h human") Fig. S1. Subcellular localization of overexpressed LPP3wt-GFP in COS-7 and HeLa cells. Cos7 (top) and HeLa (bottom) cells expressing for 24 h human LPP3wt-GFP, fixed and stained for GM130 (A) or Golgi97
Fig. S1. Subcellular localization of overexpressed LPP3wt-GFP in COS-7 and HeLa cells. Cos7 (top) and HeLa (bottom) cells expressing for 24 h human LPP3wt-GFP, fixed and stained for GM130 (A) or Golgi97
ROCK/Cdc42-mediated microglial motility and gliapse formation lead to phagocytosis of degenerating dopaminergic neurons in vivo
 Supplementary Information ROCK/Cdc42-mediated microglial motility and gliapse formation lead to phagocytosis of degenerating dopaminergic neurons in vivo Carlos Barcia* 1,2, Carmen M Ros 1,2, Valentina
Supplementary figure 1
 Supplementary figure 1 (A) Quantitative analysis of F-actin signal intensity in NIH3T3 cells treated with PTD4-myc- RBD. NIH3T3 cells were treated with PTD4-myc-RBD as described. Please note the increase
Supplementary Figure 1. Genotyping strategies for Mcm3 +/+, Mcm3 +/Lox and Mcm3 +/- mice and luciferase activity in Mcm3 +/Lox mice. A.
 Supplementary Figure 1. Genotyping strategies for Mcm3 +/+, Mcm3 +/Lox and Mcm3 +/- mice and luciferase activity in Mcm3 +/Lox mice. A. Upper part, three-primer PCR strategy at the Mcm3 locus yielding
(a) Schematic diagram of the FS mutation of UVRAG in exon 8 containing the highly instable
 Schematic diagram of the FS mutation of UVRAG in exon 8 containing the highly instable") Supplementary Figure 1. Frameshift (FS) mutation in UVRAG. (a) Schematic diagram of the FS mutation of UVRAG in exon 8 containing the highly instable A 10 DNA repeat, generating a premature stop codon
Supplementary Figure 1. Frameshift (FS) mutation in UVRAG. (a) Schematic diagram of the FS mutation of UVRAG in exon 8 containing the highly instable A 10 DNA repeat, generating a premature stop codon
Supporting Information
 Supporting Information Fig. S1. Overexpression of Rpr causes progenitor cell death. (A) TUNEL assay of control intestines. No progenitor cell death could be observed, except that some ECs are undergoing
Supplementary Table 1
 Supplementary Table 1 Flow Cytometry Antibodies Antibody Fluorochrome Clone Vendor CD45 PE-cyanine 7 30-F11 D ioscience CD3 Pacific lue 17A2 iolegend (San Diego, CA) CD11b APC M1/70 iolegend (San Diego,
T H E J O U R N A L O F C E L L B I O L O G Y
 Supplemental material Edens and Levy, http://www.jcb.org/cgi/content/full/jcb.201406004/dc1 T H E J O U R N A L O F C E L L B I O L O G Y Figure S1. Nuclear shrinking does not depend on the cytoskeleton
SUPPLEMENTARY INFORMATION
 DOI: 1.138/ncb222 / b. WB anti- WB anti- ulin Mitotic index (%) 14 1 6 2 T (h) 32 48-1 1 2 3 4 6-1 4 16 22 28 3 33 e. 6 4 2 Time (min) 1-6- 11-1 > 1 % cells Figure S1 depletion leads to mitotic defects
Supplementary Figure 1.
 Supplementary Figure 1. Transduction of adipocytes after intra-ewat administration of AAV vectors. A: Immunostaining against GFP (green) in sections of ewat two weeks after the intra-ewat administration
Supplemental Figure S1. RANK expression on human lung cancer cells.
 Supplemental Figure S1. RANK expression on human lung cancer cells. (A) Incidence and H-Scores of RANK expression determined from IHC in the indicated primary lung cancer subgroups. The overall expression
SUPPLEMENTARY FIGURE LEGENDS
 SUPPLEMENTARY FIGURE LEGENDS Supplemental FIG. 1. Localization of myosin Vb in cultured neurons varies with maturation stage. A and B, localization of myosin Vb in cultured hippocampal neurons. A, in DIV
F-actin VWF Vinculin. F-actin. Vinculin VWF
 a F-actin VWF Vinculin b F-actin VWF Vinculin Supplementary Fig. 1. WPBs in HUVECs are located along stress fibers and at focal adhesions. (a) Immunofluorescence images of f-actin (cyan), VWF (yellow),
MII. Supplement Figure 1. CapZ β2. Merge. 250ng. 500ng DIC. Merge. Journal of Cell Science Supplementary Material. GFP-CapZ β2 DNA
 A GV GVBD MI DNA CapZ β2 CapZ β2 Merge B DIC GFP-CapZ β2 Merge CapZ β2-gfp 250ng 500ng Supplement Figure 1. MII A early MI late MI Control RNAi CapZαβ DNA Actin Tubulin B Phalloidin Intensity(A.U.) n=10
Supplemental Information. Menin Deficiency Leads to Depressive-like. Behaviors in Mice by Modulating. Astrocyte-Mediated Neuroinflammation
 Neuron, Volume 100 Supplemental Information Menin Deficiency Leads to Depressive-like Behaviors in Mice by Modulating Astrocyte-Mediated Neuroinflammation Lige Leng, Kai Zhuang, Zeyue Liu, Changquan Huang,
SUPPLEMENTARY INFORMATION
 DOI: 10.1038/ncb2610 Figure S1 FSMCs derived from MSLN CLN transgenic mice express smooth muscle-specific proteins. Beta-galactosidase is ubiquitously expressed within cultured FSMCs derived from MSLN
Supplementary Figure 1. Characterization of human carotid plaques. (a) Flash-frozen human plaques were separated into vulnerable (V) and stable (S),
 Flash-frozen human plaques were separated into vulnerable (V) and stable (S),") Supplementary Figure 1. Characterization of human carotid plaques. (a) Flash-frozen human plaques were separated into vulnerable (V) and stable (S), regions which were then quantified for mean fluorescence
Supplementary Figure 1. Characterization of human carotid plaques. (a) Flash-frozen human plaques were separated into vulnerable (V) and stable (S), regions which were then quantified for mean fluorescence
Supplementary Table 1. List of primers used in this study
 Supplementary Table 1. List of primers used in this study Gene Forward primer Reverse primer Rat Met 5 -aggtcgcttcatgcaggt-3 5 -tccggagacacaggatgg-3 Rat Runx1 5 -cctccttgaaccactccact-3 5 -ctggatctgcctggcatc-3
Supplementary Materials for
 www.sciencesignaling.org/cgi/content/full/8/358/ra2/dc1 Supplementary Materials for Localized TRPA1 channel Ca 2+ signals stimulated by reactive oxygen species promote cerebral artery dilation Michelle
Supplementary Figure 1. SA-β-Gal positive senescent cells in various cancer tissues. Representative frozen sections of breast, thyroid, colon and
 Supplementary Figure 1. SA-β-Gal positive senescent cells in various cancer tissues. Representative frozen sections of breast, thyroid, colon and stomach cancer were stained with SA-β-Gal and nuclear fast
SUPPLEMENTARY FIGURES AND TABLE
 SUPPLEMENTARY FIGURES AND TABLE Supplementary Figure S1: Characterization of IRE1α mutants. A. U87-LUC cells were transduced with the lentiviral vector containing the GFP sequence (U87-LUC Tet-ON GFP).
Supplementary Figures
 Supplementary Figures Supplementary Fig. 1. Galectin-3 is present within tumors. (A) mrna expression levels of Lgals3 (galectin-3) and Lgals8 (galectin-8) in the four classes of cell lines as determined
Dramatic increase in SHP2 binding activity of Helicobacter. pylori Western CagA by EPIYA-C duplication: its
 Supplementary Information Dramatic increase in SHP2 binding activity of Helicobacter pylori Western CagA by EPIYA-C duplication: its implications in gastric carcinogenesis Lisa Nagase, Takeru Hayashi,
(A) RT-PCR for components of the Shh/Gli pathway in normal fetus cell (MRC-5) and a
 RT-PCR for components of the Shh/Gli pathway in normal fetus cell (MRC-5) and a") Supplementary figure legends Supplementary Figure 1. Expression of Shh signaling components in a panel of gastric cancer. (A) RT-PCR for components of the Shh/Gli pathway in normal fetus cell (MRC-5) and
Supplementary figure legends Supplementary Figure 1. Expression of Shh signaling components in a panel of gastric cancer. (A) RT-PCR for components of the Shh/Gli pathway in normal fetus cell (MRC-5) and
Type of file: PDF Size of file: 0 KB Title of file for HTML: Supplementary Information Description: Supplementary Figures
 Type of file: PDF Size of file: 0 KB Title of file for HTML: Supplementary Information Description: Supplementary Figures Supplementary Figure 1 mir-128-3p is highly expressed in chemoresistant, metastatic
Supplemental Materials Molecular Biology of the Cell
 Supplemental Materials Molecular Biology of the Cell Gilberti et al. SUPPLEMENTAL FIGURE LEGENDS: Figure S1: The effect of pharmacological inhibitors on particle uptake. The data presented in Figure 1
Santulli G. et al. A microrna-based strategy to suppress restenosis while preserving endothelial function
 ONLINE DATA SUPPLEMENTS Santulli G. et al. A microrna-based strategy to suppress restenosis while preserving endothelial function Supplementary Figures Figure S1 Effect of Ad-p27-126TS on the expression
Nature Neuroscience: doi: /nn.2275
 Supplementary Figure S1. The presence of MeCP2 in enriched primary glial cultures from rat or mouse brains is not neuronal. Western blot analysis of protein extracts from (a) rat glial and neuronal cultures.
(A) PCR primers (arrows) designed to distinguish wild type (P1+P2), targeted (P1+P2) and excised (P1+P3)14-
 PCR primers (arrows) designed to distinguish wild type (P1+P2), targeted (P1+P2) and excised (P1+P3)14-") 1 Supplemental Figure Legends Figure S1. Mammary tumors of ErbB2 KI mice with 14-3-3σ ablation have elevated ErbB2 transcript levels and cell proliferation (A) PCR primers (arrows) designed to distinguish
1 Supplemental Figure Legends Figure S1. Mammary tumors of ErbB2 KI mice with 14-3-3σ ablation have elevated ErbB2 transcript levels and cell proliferation (A) PCR primers (arrows) designed to distinguish
Supplementary Figure S1 (a) (b)
 (b)") Supplementary Figure S1: IC87114 does not affect basal Ca 2+ level nor nicotineinduced Ca 2+ influx. (a) Bovine chromaffin cells were loaded with Fluo-4AM (1 μm) in buffer A containing 0.02% of pluronic
Supplementary Figure S1: IC87114 does not affect basal Ca 2+ level nor nicotineinduced Ca 2+ influx. (a) Bovine chromaffin cells were loaded with Fluo-4AM (1 μm) in buffer A containing 0.02% of pluronic
SUPPLEMENTARY INFORMATION
 b 350 300 250 200 150 100 50 0 E0 E10 E50 E0 E10 E50 E0 E10 E50 E0 E10 E50 Number of organoids per well 350 300 250 200 150 100 50 0 R0 R50 R100 R500 1st 2nd 3rd Noggin 100 ng/ml Noggin 10 ng/ml Noggin
Supplementary Materials for
 www.sciencesignaling.org/cgi/content/full/8/385/ra70/dc1 Supplementary Materials for The interaction of heparan sulfate proteoglycans with endothelial transglutaminase-2 limits VEGF 165 -induced angiogenesis
CD4 and CD8 T cells show a similar accumulation in the tumor stroma.
 Fig S1 CD4 Fibronectin EpCM CD8 CD4 and CD8 T cells show a similar accumulation in the tumor stroma. Fluorescently-labeled CD4 (CMFD, green) and CD8 (Hoechst, yellow) T cells were added to a human lung
Supplementary Figure 1. Rab27a-KD inhibits speed and persistence of HEp3 cells migrating in the chick CAM. (a) Western blot analysis of Rab27a
 Western blot analysis of Rab27a") Supplementary Figure 1. Rab27a-KD inhibits speed and persistence of HEp3 cells migrating in the chick CAM. (a) Western blot analysis of Rab27a expression in GFP-expressing HEp3 cells. (b) Representative
Supplementary Figure 1. Rab27a-KD inhibits speed and persistence of HEp3 cells migrating in the chick CAM. (a) Western blot analysis of Rab27a expression in GFP-expressing HEp3 cells. (b) Representative
Supplementary Figure 1: si-craf but not si-braf sensitizes tumor cells to radiation.
 Supplementary Figure 1: si-craf but not si-braf sensitizes tumor cells to radiation. (a) Embryonic fibroblasts isolated from wildtype (WT), BRAF -/-, or CRAF -/- mice were irradiated (6 Gy) and DNA damage
Nature Biotechnology: doi: /nbt Supplementary Figure 1
 Supplementary Figure 1 Representative images of an in vitro comparison of several AAV serotypes regarding egfp expression in cochlear explants of CBA/CaJ mice. (A-F): Results after incubation at equal
Supplemental Table 1. Primer sequences for transcript analysis
 Supplemental Table 1. Primer sequences for transcript analysis Primer Sequence (5 3 ) Primer Sequence (5 3 ) Mmp2 Forward CCCGTGTGGCCCTC Mmp15 Forward CGGGGCTGGCT Reverse GCTCTCCCGGTTTC Reverse CCTGGTGTGCCTGCTC
Supplementary Figure 1.TRIM33 binds β-catenin in the nucleus. a & b, Co-IP of endogenous TRIM33 with β-catenin in HT-29 cells (a) and HEK 293T cells
 and HEK 293T cells") Supplementary Figure 1.TRIM33 binds β-catenin in the nucleus. a & b, Co-IP of endogenous TRIM33 with β-catenin in HT-29 cells (a) and HEK 293T cells (b). TRIM33 was immunoprecipitated, and the amount of
Supplementary Figure 1.TRIM33 binds β-catenin in the nucleus. a & b, Co-IP of endogenous TRIM33 with β-catenin in HT-29 cells (a) and HEK 293T cells (b). TRIM33 was immunoprecipitated, and the amount of
Diabetic pdx1-mutant zebrafish show conserved responses to nutrient overload and anti-glycemic treatment
 Supplementary Information Diabetic pdx1-mutant zebrafish show conserved responses to nutrient overload and anti-glycemic treatment Robin A. Kimmel, Stefan Dobler, Nicole Schmitner, Tanja Walsen, Julia
Diabetic Complications Consortium
 Diabetic Complications Consortium Application Title: Cathepsin S inhibition and diabetic neuropathy Principal Investigator: Nigel A Calcutt 1. Project Accomplishments: We investigated the efficacy of cathepsin
Supplementary Figures
 Supplementary Figures Supplementary Figure 1 Characterization of stable expression of GlucB and sshbira in the CT26 cell line (a) Live cell imaging of stable CT26 cells expressing green fluorescent protein
Relative SOD1 activity. Relative SOD2 activity. Relative SOD activity (Infected:Mock) + CP + DDC
 + CP + DDC") Supplementary Figure 1. SOD1 activity is significantly increased relative to SOD1 levels. SOD1 and SOD2 activities in the infected mork13 cells are shown normalised to their corresponding levels and relative
Supplementary Figure 1. SOD1 activity is significantly increased relative to SOD1 levels. SOD1 and SOD2 activities in the infected mork13 cells are shown normalised to their corresponding levels and relative
Supplemental Materials Molecular Biology of the Cell
 Supplemental Materials Molecular Biology of the Cell Garcia-Alvarez et al. Supplementary Figure Legends Figure S1.Expression and RNAi-mediated silencing of STIM1 in hippocampal neurons (DIV, days in vitro).
Supplemental Information. Tissue Myeloid Progenitors Differentiate. into Pericytes through TGF-b Signaling. in Developing Skin Vasculature
 Cell Reports, Volume 18 Supplemental Information Tissue Myeloid Progenitors Differentiate into Pericytes through TGF-b Signaling in Developing Skin Vasculature Tomoko Yamazaki, Ani Nalbandian, Yutaka Uchida,
Project report October 2012 March 2013 CRF fellow: Principal Investigator: Project title:
 Project report October 2012 March 2013 CRF fellow: Gennaro Napolitano Principal Investigator: Sergio Daniel Catz Project title: Small molecule regulators of vesicular trafficking to enhance lysosomal exocytosis
CD4 + T cells recovered in Rag2 / recipient ( 10 5 ) Heart Lung Pancreas
 Heart Lung Pancreas") a CD4 + T cells recovered in Rag2 / recipient ( 1 5 ) Heart Lung Pancreas.5 1 2 4 6 2 4 6 Ctla4 +/+ Ctla4 / Ctla4 / Lung Ctla4 / Pancreas b Heart Lung Pancreas Ctla4 +/+ Ctla4 / Ctla4 / Lung Ctla4 / Pancreas
a CD4 + T cells recovered in Rag2 / recipient ( 1 5 ) Heart Lung Pancreas.5 1 2 4 6 2 4 6 Ctla4 +/+ Ctla4 / Ctla4 / Lung Ctla4 / Pancreas b Heart Lung Pancreas Ctla4 +/+ Ctla4 / Ctla4 / Lung Ctla4 / Pancreas
SUPPLEMENTARY INFORMATION
 doi:10.1038/nature10353 Supplementary Figure 1. Mutations of UBQLN2 in patients with ALS and ALS/dementia. (a) A mutation, c.1489c>t (p.p497s), was identified in F#9975. The pedigree is shown on the left
Anti-ceramide Antibody Prevents the Radiation GI Syndrome in Mice
 Anti-ceramide Antibody Prevents the Radiation GI Syndrome in Mice Jimmy A. Rotolo 1, Branka Stancevic 1, Jianjun Zhang 1, Guoqiang Hua 1, John Fuller 1, Xianglei Yin 1, Adriana Haimovitz-Friedman 2, Kisu
T H E J O U R N A L O F C E L L B I O L O G Y
 Supplemental material Díaz et al., http://www.jcb.org/cgi/content/full/jcb.201209151/dc1 T H E J O U R N A L O F C E L L B I O L O G Y Figure S1. Hypoxia induces invadopodia formation in different epithelial
Zhu et al, page 1. Supplementary Figures
 Zhu et al, page 1 Supplementary Figures Supplementary Figure 1: Visual behavior and avoidance behavioral response in EPM trials. (a) Measures of visual behavior that performed the light avoidance behavior
Nature Protocols: doi: /nprot Supplementary Figure 1
 Supplementary Figure 1 Traditional electronic gating strategy for analysing cell death based on A5-FITC and 7-AAD. a, Flow cytometry analysis showing the traditional two-stage electronic gating strategy
Supplemental Figure 1. (A) The localization of Cre DNA recombinase in the testis of Cyp19a1-Cre mice was detected by immunohistchemical analyses
 The localization of Cre DNA recombinase in the testis of Cyp19a1-Cre mice was detected by immunohistchemical analyses") Supplemental Figure 1. (A) The localization of Cre DNA recombinase in the testis of Cyp19a1-Cre mice was detected by immunohistchemical analyses using an anti-cre antibody; testes at 1 week (left panel),
Supplemental Figure 1. (A) The localization of Cre DNA recombinase in the testis of Cyp19a1-Cre mice was detected by immunohistchemical analyses using an anti-cre antibody; testes at 1 week (left panel),
SUPPLEMENTARY INFORMATION
 doi:1.138/nature1554 a TNF-α + in CD4 + cells [%] 1 GF SPF 6 b IL-1 + in CD4 + cells [%] 5 4 3 2 1 Supplementary Figure 1. Effect of microbiota on cytokine profiles of T cells in GALT. Frequencies of TNF-α
SUPPLEMENTARY INFORMATION
 SUPPLEENTRY INFORTION DOI: 1.138/ncb2577 Early Telophase Late Telophase B icrotubules within the ICB (percent of total cells in telophase) D G ultinucleate cells (% total) 8 6 4 2 2 15 1 5 T without gaps
label the basement membrane). Different fixation methods of EB-perfused P8 mice to optimize the combination
. Different fixation methods of EB-perfused P8 mice to optimize the combination") Supplementary Figure 1 Optimization of the tissue fixation protocol to combine EB perfusion and IB4 endothelial tip cell staining in the postnatal mouse brain. a-l Labeling of EB-perfused P8 mice with
Supplementary Figure 1 Optimization of the tissue fixation protocol to combine EB perfusion and IB4 endothelial tip cell staining in the postnatal mouse brain. a-l Labeling of EB-perfused P8 mice with
Type of file: PDF Title of file for HTML: Supplementary Information Description: Supplementary Figures
 Type of file: PDF Title of file for HTML: Supplementary Information Description: Supplementary Figures Type of file: MOV Title of file for HTML: Supplementary Movie 1 Description: NLRP3 is moving along