Figure S1, related to Figure 1. Escaper p38a-expressing cancer cells repopulate the tumors (A) Scheme of the mt/mg reporter that expresses a
|
|
|
- Gyles Dustin Norton
- 5 years ago
- Views:
Transcription
1 Cancer Cell, Volume 33 Supplemental Information Targeting p38a Increases DNA Damage, Chromosome Instability, and the Anti-tumoral Response to Taxanes in Breast Cancer Cells Begoña Cánovas, Ana Igea, Alessandro A. Sartori, Roger R. Gomis, Tanya T. Paull, Michitaka Isoda, Héctor Pérez-Montoyo, Violeta Serra, Eva González-Suárez, Travis H. Stracker, and Angel R. Nebreda
 Scheme of the mt/mg reporter that expresses a loxp-flanked Tomato, which is excised upon Cre activation allowing the tracing of")
2 1 Figure S1, related to Figure 1. Escaper p38a-expressing cancer cells repopulate the tumors (A) Scheme of the mt/mg reporter that expresses a loxp-flanked Tomato, which is excised upon Cre activation allowing the tracing of recombined cells by the expression of GFP. (B) Representative images of the mt/mg reporter expression in tumors from p38ad mice at the indicated days. Bar =100 µm (C) Representative workflow for the mt/mg reporter line by FACS analysis. CD326-APC antibody was used to detect epithelial cells. Rectangles indicate the gated epithelial cells. (D) Percentage of recombined (green) and not recombined (red) epithelial cells in the mammary tumor. Day 0, n=2; day 15, n=3; day 40, n=2. Barplots represent mean ± SEM.
3 2
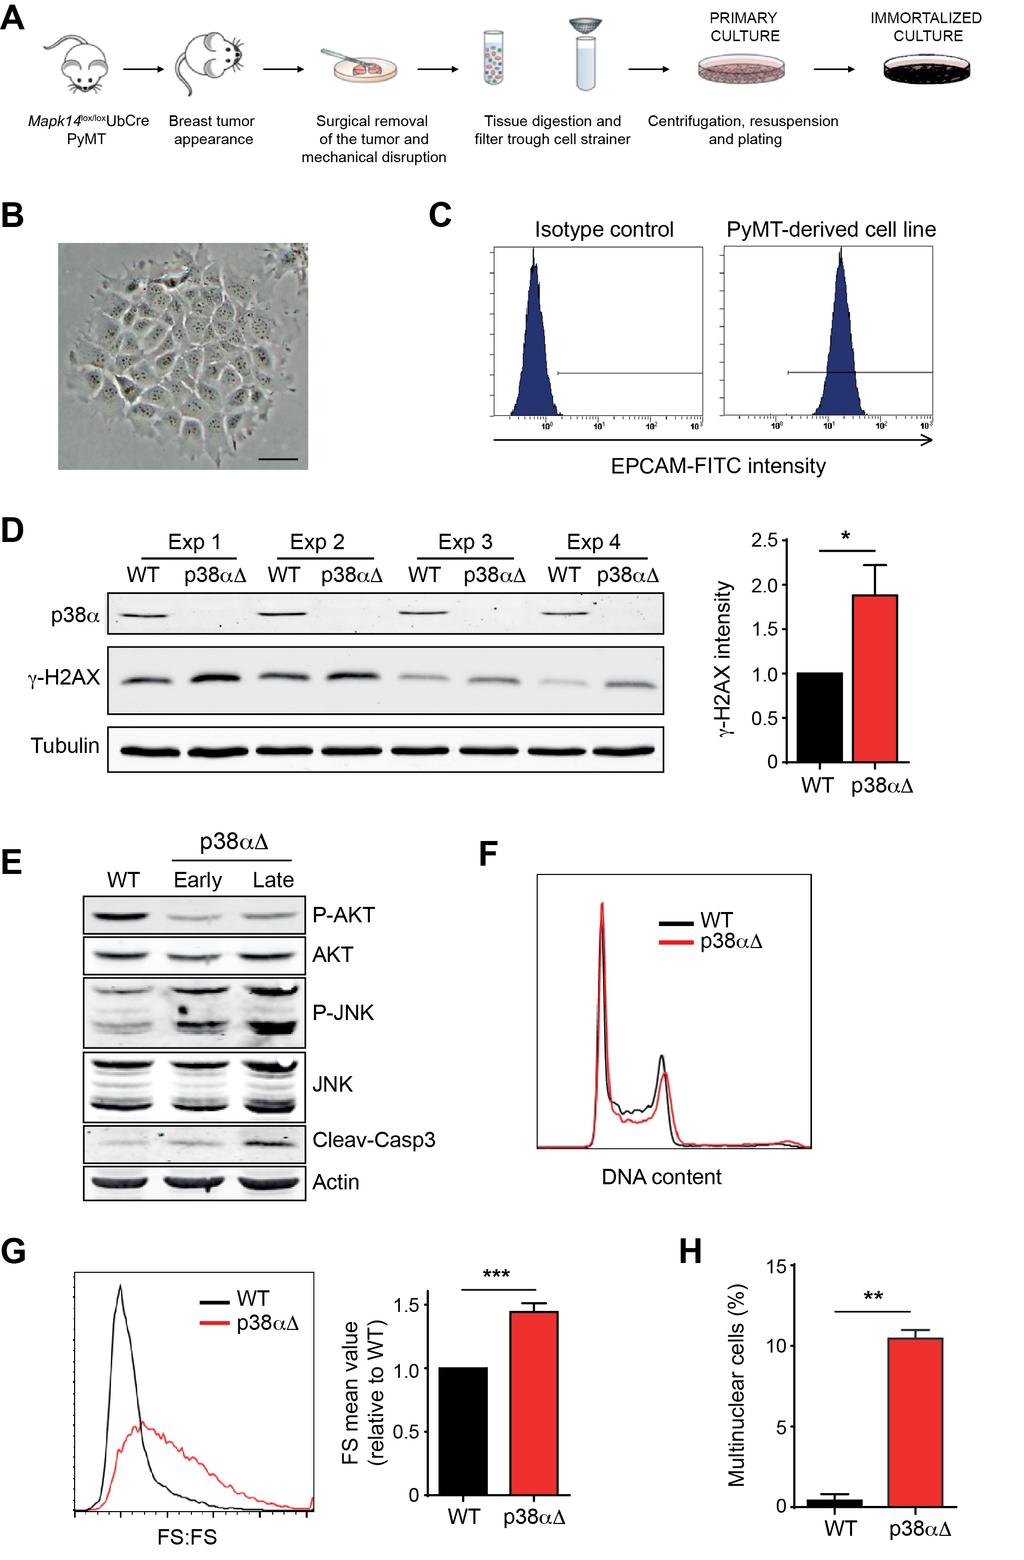
4 Figure S2, related to Figure 2. Characterization of epithelial cell lines derived from mammary tumors (A) Scheme of the protocol used to derive cancer cell lines from PyMT-induced mammary tumors. (B) Representative bright field image of cancer cells derived from PyMT-induced mammary tumors. Bar = 25 µm. (C) EPCAM-FITC fluorescence intensity of cancer cells derived from PyMT-induced mammary tumors and its corresponding isotype control. (D) Levels of g-h2ax were analyzed by immunoblotting in lysates from four independent sets of WT and p38ad cancer cells. Quantifications are shown in the histogram referring to the g-h2ax intensity in the corresponding WT cells, which was given the value of 1. (E) WT and p38a-deficient cancer cells were analyzed by immunoblotting using antibodies against the indicated proteins. (F) Cell cycle profile analysis of WT and p38a-deficient cancer cells. (G) Representative graph of the forward-scatter (FS) of WT and p38a-deficient cancer cells. The histogram shows the values from five independent experiments. (H) The percentages of multinuclear cells in WT and p38a-deficient cancer cells were calculated using E-cadherin and DAPI staining. Histogram shows the quantification of two independent experiments. Histograms represent mean ± SEM. 3
 ROS levels detected using the DCFDA probe in WT and p38a-deficient cancer cells derived from")
5 4 Figure S3, related to Figure 3. Oxidative stress does not mediate the deleterious effects of p38a deletion in mammary cancer cells (A) ROS levels detected using the DCFDA probe in WT and p38a-deficient cancer cells derived from PyMT-induced mammary tumors. Histogram shows the mean ± SEM of two independent experiments. Representative DCF intensity plot is shown including H2O2 treated WT cells as positive control. (B) Levels of 8-hydroxy-2 -deoxyguanosine (8-OHdG) in WT and p38a-deficient cancer cells. The histogram shows the median values ± SEM of three independent experiments. Representative 8-OHdG fluorescence intensity plot is shown including H2O2 treated WT cells as positive control. (C) Representative images of 8-OHdG staining in WT and p38a-deficient cancer cells. H2O2 treated cells were used as positive control. Bars = 50 µm. (D) Efficiency of anti-oxidants (AOX) was evaluated by treating cells with H2O2 in the presence or absence of AOX. ROS levels were detected by FACS using the DCFDA probe.
6 (E) Distribution of nuclear g-h2ax intensity in p38ad cells either non-treated or treated with AOX, and in WT cells. The midlines show median values. (F) DNA fiber assays were performed in p38ad cells either non-treated or treated with AOX, and in WT cells, and fork rate was determined. The midlines show median values. 5
 Purified WT and T847A CtIP proteins were phosphorylated in vitro with purified active p38a and immunoblotted with antibodies for phospho-ser/thr, CtIP-pT847 or total CtIP.")
7 Figure S4, related to Figure 4. p38a phosphorylates CtIP (A) Scheme indicating the CtIP sites phosphorylated by p38a in vitro, as determined by mass spectrometry analysis. (B) Purified WT and T847A CtIP proteins were phosphorylated in vitro with purified active p38a and immunoblotted with antibodies for phospho-ser/thr, CtIP-pT847 or total CtIP. (C) Purified N-terminal CtIP was phosphorylated in vitro with p38a, and then analyzed by immunoblotting with the indicated phospho-antibodies. A representative Coomassie staining is shown. (D) WT and p38a-deficient cancer cells were treated 1 µm camptothecin (CPT) for 2 hr, and then analyzed by immunofluorescence using the CtIP-pT315 antibody. The percentages of cells with an intensity value higher than 45 (blue boxes) are indicated. Midlines represent the median values. 6
8 7
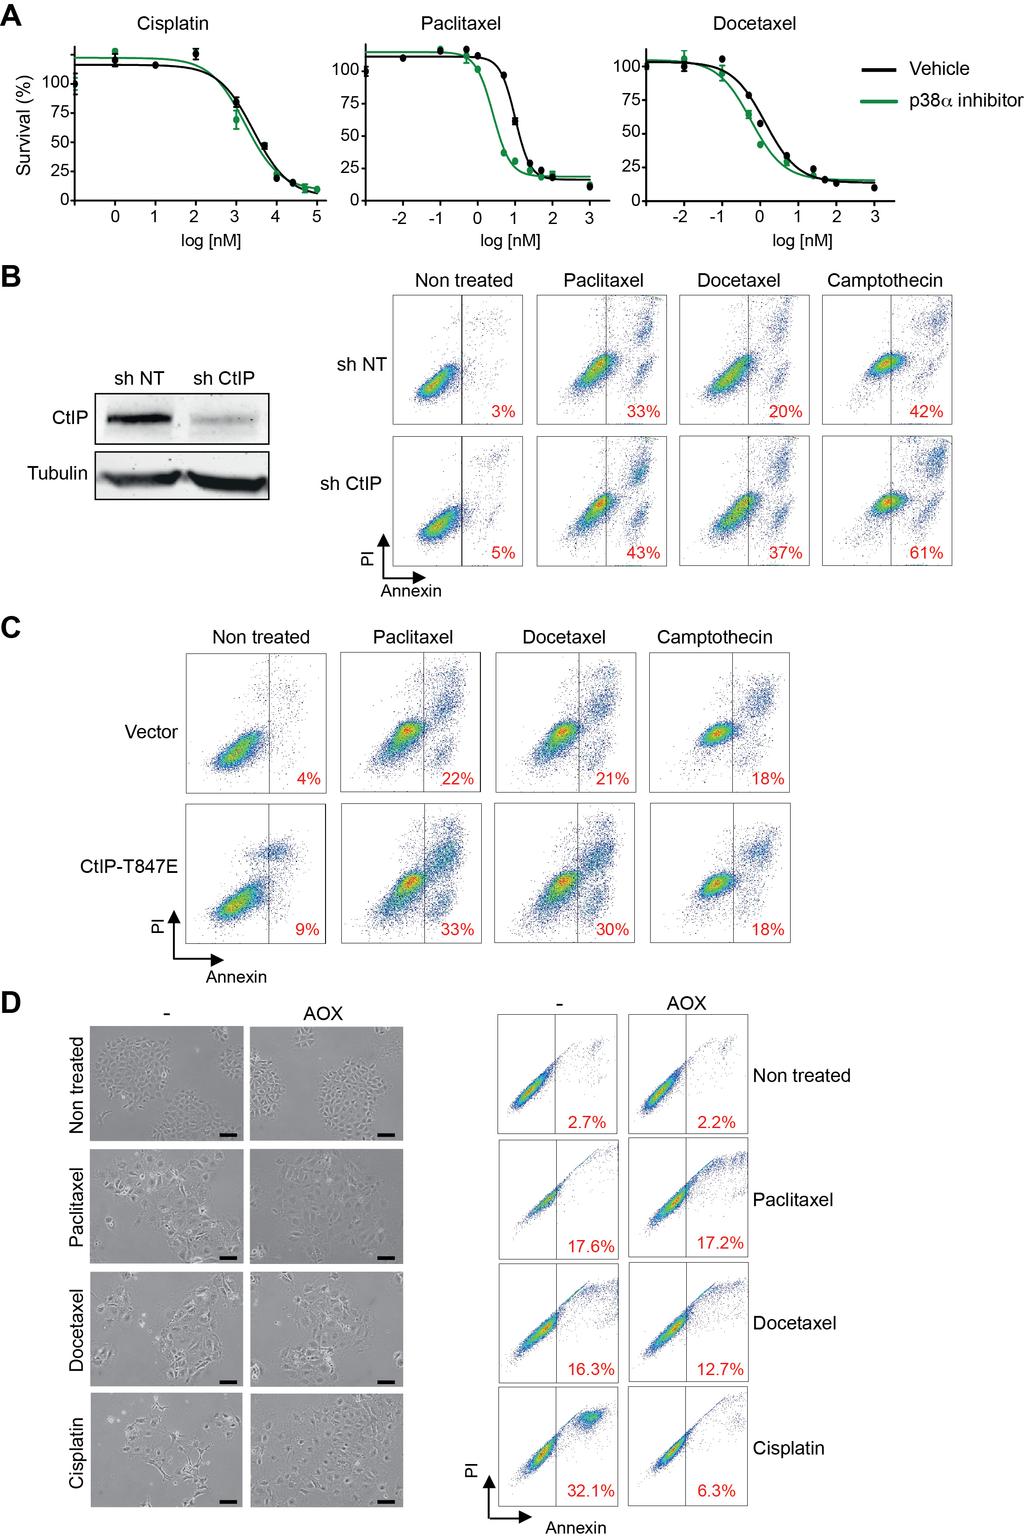
9 Figure S5, related to Figure 6. CtIP but not ROS is involved in taxane-induced cancer cell death (A) Cancer cells derived from PyMT-induced mammary tumors were treated with increasing concentrations of cisplatin, paclitaxel, or docetaxel for 72 hr in the presence or absence of the p38a inhibitor LY Cell viability was measured using the CyQuant NF proliferation kit and dose-response curves were analyzed using GraphPad Prism. Data represent mean ± SEM. (B) Cancer cells derived from PyMT-induced mammary tumors were treated with control (NT) or CtIP shrnas, and then incubated with either paclitaxel 25 nm, docetaxel 10 nm or camptothecin 1 µm for 72 hr. CtIP levels were analyzed by immunoblotting (left panel), and cell death was measured by Annexin V/PI staining (right panel). The total percentage of Annexin V + cells is indicated in red. The experiment was repeated twice with similar results. (C) Cancer cells derived from PyMT-induced mammary tumors were infected with lentivirus expressing CtIP-T847E or the empty vector, and then treated with paclitaxel 25 nm, docetaxel 10 nm or camptothecin 500 nm for 72 hr. The total percentage of Annexin V + cells is indicated in red. The experiment was repeated twice with similar results (D) Cancer cells derived from PyMT-induced mammary tumors were treated with either paclitaxel 50 nm, docetaxel 10 nm or cisplatin 10 µm, with or without antioxidants (AOX) for 48 hr. Representative images after treatment are shown (left panel). Scale bar = 100 µm. Cell death was measured by Annexin V/PI staining (right panel). The total percentage of Annexin V + cells is indicated in red. The experiment was repeated twice with similar results. 8
10 Figure S6, related to Figure 6. MK2 inhibition does not sensitize PyMT mammary tumors to taxanes. (A) Growth curve of PyMT-induced mammary tumors in mice treated with vehicle or inhibitors for MK2 (MK2i, PF ) or p38a (p38i, PH797804). (B) Efficacy of the inhibitors was verified by immunoblotting with phospho-hsp27 antibody using lung tissue, which immediately after resection was incubated in NaCl (300 mm) for 15 min and then snap frozen. (C) Growth curve of PyMT-induced mammary tumors in mice treated with paclitaxel (upper panel) or docetaxel (lower panel) either alone or together with daily administration of the MK2 inhibitor. The same vehicle-treated animals are represented in both graphs. 9
11 (D) DNA damage was measured using g-h2ax staining. Histograms represent the g-h2ax + area in animals treated with paclitaxel (upper panel) or docetaxel (lower panel). At least four independent mammary tumors were quantified, with a minimum of 15 fields per tumor. (E) Mitotic figures were analyzed at the end of the treatment using phospho-h3 staining. Histograms show the percentage of missegregating cells in animals treated with paclitaxel (upper panel) or docetaxel (lower panel). At least three independent mammary tumors were analyzed, with at least 10 fields quantified per tumor. Data represent mean ± SEM. 10
 Representative images of sections from the human breast cancer PDXs stained as indicated.")
12 11 Figure S7, related to Figure 7. Characterization of the PDX models, design of combination treatments, and lack of toxicity of PH and taxanes. (A) Representative images of sections from the human breast cancer PDXs stained as indicated. TN, Triple negative; Lum, Luminal; HE, Hematoxylin and eosin; ERa, Estrogen
13 receptor-a; PgR, Progesterone receptor; Ecad, E-cadherin; SMA, Smooth muscle actin. Bars = 50 µm. (B) Experimental design of the combination treatments. (C) Mouse weights were recorded once a week and values were normalized to the initial body weight of each mouse. Graphs show the weight evolution of two representative PDX models, using 4 mice per group for TN1 and 3 mice per group for LUM2. Data represent mean ± SEM. 12
14 13
15 Figure S8, related to Figure 7. Effect of p38a and MK2 inhibitors combined with paclitaxel or docetaxel in the different PDX models (A - C) NOD/Scid female mice implanted with the indicated PDXs were treated with paclitaxel or docetaxel either alone or in combination with daily administration of the p38a inhibitor PH (A), the p38a inhibitor LY (B), or the MK2 inhibitor PF (C) for 21 days. The relative tumor growth for each treatment and PDX is shown. Tumor growth was followed for up to 20 days for the inhibitor alone, and up to 100 days or when one of the treatments reached twice the initial tumor size for the taxane and combination treatments. For each model, the same vehicle-treated animals are represented in all panels. n is indicated in Tables S1 and S3. Data represent mean ± SEM. 14
16 15 Table S1, related to Figure 7. Number of animals (n) of each PDX model used in Figures 7A and S8A. Numbers in brackets indicate the tumors analyzed. TN 1 TN 2 TN 3 TN 4 TN 5 Lum 1 Lum 2 Lum 3 Lum 4 Day 17/20 Day 23/ 29 Day 59 Day 79 Day 99 VEH n=13 (25) n=8 (13) n= 4 (6) n=6 (11) n=11 (19) n= 6 (11) n=6 (10) n=4 (8) n=5 (10) PH n=12 (24) n=7 (14) n=4 (6) n=7 (11) n=11 (22) n=6 (11) n=5 (10) n=5 (9) n=7 (13) DTX n=9 (18) n=7 (14) n=5 (7) n=6 (10) n=6 (12) n=7 (11) n=4 (8) n=8 (16) n=4 (8) DTX+PH n=7 (14) n=7 (14) n=5 (9) n=6 (12) n=8 (15) n=5 (10) n=5 (8) n=8 (15) n=4 (8) PACL n=7 (12) n=7 (14) n=5 (7) n=5 (9) n=4 (8) n=7 (10) n=9 (16) n=8 (16) n=3 (6) PACL+PH n=4 (8) n=8 (15) n=5 (7) n=6 (11) n=5 (10) n=7 (10) n=9 (16) n=7 (14) n=3 (6) DTX n=6 (11) n.a. n=5 (7) n=5 (8) n.a. n=5 (8) n=4 (8) n=6 (12) n.a. DTX+PH n=5 (10) n.a. n=5 (9) n=6 (12) n.a. n=3 (6) n=5 (8) n=6 (11) n.a. PACL n.a. n.a. n=5 (7) n=5 (9) n.a. n=4 (7) n=6 (10) n=3 (6) n.a. PACL+PH n.a. n.a. n=5 (7) n=6 (11) n.a. n=4 (6) n=7 (12) n=3 (6) n.a. DTX n=1 (2) n.a. n.a. n=4 (6) n.a. n=4 (6) n.a. n.a. n.a. DTX+PH n=1 (2) n.a. n.a. n=6 (12) n.a. n=2 (4) n.a. n.a. n.a. PACL n.a. n.a. n.a. n=5 (9) n.a. n=4 (7) n=6 (10) n.a. n.a. PACL+PH n.a. n.a. n.a. n=6 (11) n.a. n=4 (6) n=7 (12) n.a. n.a. DTX n.a. n.a. n.a. n=2 (3) n.a. n.a. n.a. n.a. n.a. DTX+PH n.a. n.a. n.a. n=5 (10) n.a. n.a. n.a. n.a. n.a. PACL n.a. n.a. n.a. n=3 (5) n.a. n=2 (3) n=5 (8) n.a. n.a. PACL+PH n.a. n.a. n.a. n=3 (5) n.a. n=3 (4) n=6 (10) n.a. n.a. n.a., not available (mice were sacrificed before this time point) Table S2, related to Figure 7. Number of tumors analyzed in Figures 7B and 7C g-h2ax Phospho-H3 TN 1 TN 2 TN 5 Lum 1 Lum 2 Lum 3 Vehicle Paclitaxel Paclitaxel+PH Docetaxel Docetaxel+PH Vehicle Paclitaxel Paclitaxel+PH Docetaxel Docetaxel+PH
17 16 Table S3, related to Figure 7. Number of animals (n) of each PDX model used in Figures S8B and S8C. Numbers in brackets indicate the tumors analyzed. TN 1 TN 2 Lum 1 Lum 2 Day 17/20 Day 23/ 29 Day 59 Day 79 Day 99 LY n=4 (7) n=3 (6) n=4 (8) n=3 (4) MK2i n=3 (6) n=3 (6) n=3 (5) n=3 (4) DTX+LY n=5 (10) n=4 (8) n=5 (8) n=3 (4) DTX+MK2i n=3 (6) n=4 (8) n=3 (4) n=3 (4) PACL+LY n=3 (6) n=4 (8) n=3 (6) n=3 (6) PACL+MK2i n=3 (6) n=4 (7) n=3 (5) n=3 (5) DTX+LY n=5 (10) n.a. n=3 (4) n=3 (4) DTX+MK2i n=3 (6) n.a. n=3 (4) n=3 (4) PACL+LY n.a. n.a. n=3 (6) n=3 (6) PACL+MK2i n.a. n.a. n=3 (5) n=3 (5) DTX+LY n=5 (10) n.a. n=4 (6) n.a. DTX+MK2i n=2 (4) n.a. n=2 (4) n.a. PACL+LY n.a. n.a. n=3 (6) n.a. PACL+MK2i n.a. n.a. n=3 (5) n.a. DTX+LY n.a. n.a. n.a. n.a. DTX+MK2i n.a. n.a. n.a. n.a. PACL+LY n.a. n.a. n=3 (6) n.a. PACL+MK2i n.a. n.a. n=2 (3) n.a. n.a., not available (mice were sacrificed before this time point) Table S4, related to Figure 8. Number of tumors analyzed in Figures 8A-8C TN 1 TN 2 TN 3 TN 4 TN 5 Lum 1 Lum 2 Lum 3 Lum 4 Aneuploidy rate g-h2ax + area Missegregation rate
SHREE ET AL, SUPPLEMENTAL MATERIALS. (A) Workflow for tumor cell line derivation and orthotopic implantation.
 Workflow for tumor cell line derivation and orthotopic implantation.") SHREE ET AL, SUPPLEMENTAL MATERIALS SUPPLEMENTAL FIGURE AND TABLE LEGENDS Supplemental Figure 1. Derivation and characterization of TS1-TGL and TS2-TGL PyMT cell lines and development of an orthotopic
SHREE ET AL, SUPPLEMENTAL MATERIALS SUPPLEMENTAL FIGURE AND TABLE LEGENDS Supplemental Figure 1. Derivation and characterization of TS1-TGL and TS2-TGL PyMT cell lines and development of an orthotopic
Supplementary Table; Supplementary Figures and legends S1-S21; Supplementary Materials and Methods
 Silva et al. PTEN posttranslational inactivation and hyperactivation of the PI3K/Akt pathway sustain primary T cell leukemia viability Supplementary Table; Supplementary Figures and legends S1-S21; Supplementary
Supplementary Figure 1. Characterization of NMuMG-ErbB2 and NIC breast cancer cells expressing shrnas targeting LPP. NMuMG-ErbB2 cells (a) and NIC
 and NIC") Supplementary Figure 1. Characterization of NMuMG-ErbB2 and NIC breast cancer cells expressing shrnas targeting LPP. NMuMG-ErbB2 cells (a) and NIC cells (b) were engineered to stably express either a LucA-shRNA
Supplementary Figure 1. Characterization of NMuMG-ErbB2 and NIC breast cancer cells expressing shrnas targeting LPP. NMuMG-ErbB2 cells (a) and NIC cells (b) were engineered to stably express either a LucA-shRNA
Supplementary Figure 1
 Supplementary Figure 1 a γ-h2ax MDC1 RNF8 FK2 BRCA1 U2OS Cells sgrna-1 ** 60 sgrna 40 20 0 % positive Cells (>5 foci per cell) b ** 80 sgrna sgrna γ-h2ax MDC1 γ-h2ax RNF8 FK2 MDC1 BRCA1 RNF8 FK2 BRCA1
SUPPLEMENTARY INFORMATION
 DOI: 1.138/ncb3355 a S1A8 + cells/ total.1.8.6.4.2 b S1A8/?-Actin c % T-cell proliferation 3 25 2 15 1 5 T cells Supplementary Figure 1 Inter-tumoral heterogeneity of MDSC accumulation in mammary tumor
Figure S1. Generation of inducible PTEN deficient mice and the BMMCs (A) B6.129 Pten loxp/loxp mice were mated with B6.
 B6.129 Pten loxp/loxp mice were mated with B6.") Figure S1. Generation of inducible PTEN deficient mice and the BMMCs (A) B6.129 Pten loxp/loxp mice were mated with B6.129-Gt(ROSA)26Sor tm1(cre/ert2)tyj /J mice. To induce deletion of the Pten locus,
Figure S1. Generation of inducible PTEN deficient mice and the BMMCs (A) B6.129 Pten loxp/loxp mice were mated with B6.129-Gt(ROSA)26Sor tm1(cre/ert2)tyj /J mice. To induce deletion of the Pten locus,
Supplementary Materials for
 www.sciencetranslationalmedicine.org/cgi/content/full/4/117/117ra8/dc1 Supplementary Materials for Notch4 Normalization Reduces Blood Vessel Size in Arteriovenous Malformations Patrick A. Murphy, Tyson
HCC1937 is the HCC1937-pcDNA3 cell line, which was derived from a breast cancer with a mutation
 SUPPLEMENTARY INFORMATION Materials and Methods Human cell lines and culture conditions HCC1937 is the HCC1937-pcDNA3 cell line, which was derived from a breast cancer with a mutation in exon 20 of BRCA1
Supplementary Figures
 Supplementary Figures Supplementary Figure 1 DOT1L regulates the expression of epithelial and mesenchymal markers. (a) The expression levels and cellular localizations of EMT markers were confirmed by
Supplementary Figure 1. A. Bar graph representing the expression levels of the 19 indicated genes in the microarrays analyses comparing human lung
 Supplementary Figure 1. A. Bar graph representing the expression levels of the 19 indicated genes in the microarrays analyses comparing human lung immortalized broncho-epithelial cells (AALE cells) expressing
(a) Schematic diagram of the FS mutation of UVRAG in exon 8 containing the highly instable
 Schematic diagram of the FS mutation of UVRAG in exon 8 containing the highly instable") Supplementary Figure 1. Frameshift (FS) mutation in UVRAG. (a) Schematic diagram of the FS mutation of UVRAG in exon 8 containing the highly instable A 10 DNA repeat, generating a premature stop codon
Supplementary Figure 1. Frameshift (FS) mutation in UVRAG. (a) Schematic diagram of the FS mutation of UVRAG in exon 8 containing the highly instable A 10 DNA repeat, generating a premature stop codon
Supplementary Figures
 Supplementary Figures Supplementary Figure 1. Confirmation of Dnmt1 conditional knockout out mice. a, Representative images of sorted stem (Lin - CD49f high CD24 + ), luminal (Lin - CD49f low CD24 + )
Supplementary Materials
 Supplementary Materials Figure S1. MTT Cell viability assay. To measure the cytotoxic potential of the oxidative treatment, the MTT [3-(4,5-dimethylthiazol- 2-yl)-2,5-diphenyl tetrazolium bromide] assay
SUPPLEMENTARY INFORMATION
 SUPPLEMENTARY INFORMATION doi:10.1038/nature11429 S1a 6 7 8 9 Nlrc4 allele S1b Nlrc4 +/+ Nlrc4 +/F Nlrc4 F/F 9 Targeting construct 422 bp 273 bp FRT-neo-gb-PGK-FRT 3x.STOP S1c Nlrc4 +/+ Nlrc4 F/F casp1
Supplementary Figure 1. Validation of astrocytes. Primary astrocytes were
 Supplementary Figure 1. Validation of astrocytes. Primary astrocytes were separated from the glial cultures using a mild trypsinization protocol. Anti-glial fibrillary acidic protein (GFAP) immunofluorescent
Inhibition of TGFβ enhances chemotherapy action against triple negative breast cancer by abrogation of
 SUPPLEMENTAL DATA Inhibition of TGFβ enhances chemotherapy action against triple negative breast cancer by abrogation of cancer stem cells and interleukin-8 Neil E. Bhola 1, Justin M. Balko 1, Teresa C.
Supplementary Figure 1.TRIM33 binds β-catenin in the nucleus. a & b, Co-IP of endogenous TRIM33 with β-catenin in HT-29 cells (a) and HEK 293T cells
 and HEK 293T cells") Supplementary Figure 1.TRIM33 binds β-catenin in the nucleus. a & b, Co-IP of endogenous TRIM33 with β-catenin in HT-29 cells (a) and HEK 293T cells (b). TRIM33 was immunoprecipitated, and the amount of
Supplementary Figure 1.TRIM33 binds β-catenin in the nucleus. a & b, Co-IP of endogenous TRIM33 with β-catenin in HT-29 cells (a) and HEK 293T cells (b). TRIM33 was immunoprecipitated, and the amount of
Supplementary Figure 1. Basal level EGFR across a panel of ESCC lines. Immunoblots demonstrate the expression of phosphorylated and total EGFR as
 Supplementary Figure 1. Basal level EGFR across a panel of ESCC lines. Immunoblots demonstrate the expression of phosphorylated and total EGFR as well as their downstream effectors across a panel of ESCC
hexahistidine tagged GRP78 devoid of the KDEL motif (GRP78-His) on SDS-PAGE. This
 on SDS-PAGE. This") SUPPLEMENTAL FIGURE LEGEND Fig. S1. Generation and characterization of. (A) Coomassie staining of soluble hexahistidine tagged GRP78 devoid of the KDEL motif (GRP78-His) on SDS-PAGE. This protein was expressed
SUPPLEMENTAL FIGURE LEGEND Fig. S1. Generation and characterization of. (A) Coomassie staining of soluble hexahistidine tagged GRP78 devoid of the KDEL motif (GRP78-His) on SDS-PAGE. This protein was expressed
Expanded View Figures
 Shao-Ming Shen et al Role of I in MT of cancers MO reports xpanded View igures igure V1. nalysis of the expression of I isoforms in cancer cells and their interaction with PTN. RT PR detection of Ish and
Supplementary Figure 1. BMS enhances human T cell activation in vitro in a
 Supplementary Figure 1. BMS98662 enhances human T cell activation in vitro in a concentration-dependent manner. Jurkat T cells were activated with anti-cd3 and anti-cd28 antibody in the presence of titrated
Supplemental Figure 1. Intracranial transduction of a modified ptomo lentiviral vector in the mouse
 Supplemental figure legends Supplemental Figure 1. Intracranial transduction of a modified ptomo lentiviral vector in the mouse hippocampus targets GFAP-positive but not NeuN-positive cells. (A) Stereotaxic
Supplementary Figure 1: si-craf but not si-braf sensitizes tumor cells to radiation.
 Supplementary Figure 1: si-craf but not si-braf sensitizes tumor cells to radiation. (a) Embryonic fibroblasts isolated from wildtype (WT), BRAF -/-, or CRAF -/- mice were irradiated (6 Gy) and DNA damage
(a) Significant biological processes (upper panel) and disease biomarkers (lower panel)
 Significant biological processes (upper panel) and disease biomarkers (lower panel)") Supplementary Figure 1. Functional enrichment analyses of secretomic proteins. (a) Significant biological processes (upper panel) and disease biomarkers (lower panel) 2 involved by hrab37-mediated secretory
Supplementary Figure 1. Functional enrichment analyses of secretomic proteins. (a) Significant biological processes (upper panel) and disease biomarkers (lower panel) 2 involved by hrab37-mediated secretory
Supplemental Figure S1. RANK expression on human lung cancer cells.
 Supplemental Figure S1. RANK expression on human lung cancer cells. (A) Incidence and H-Scores of RANK expression determined from IHC in the indicated primary lung cancer subgroups. The overall expression
Supplemental Figure 1. Western blot analysis indicated that MIF was detected in the fractions of
 Supplemental Figure Legends Supplemental Figure 1. Western blot analysis indicated that was detected in the fractions of plasma membrane and cytosol but not in nuclear fraction isolated from Pkd1 null
a 10 4 Link et al. Supplementary Figure 1 Nature Immunology: doi: /ni.1842 Cells per mouse ( 10 5 ) TRPV2KO anti-gr1 anti-gr anti-f4/80
 TRPV2KO anti-gr1 anti-gr anti-f4/80") a 10 4 WT 10 4 TRPV2KO 10 3 10 3 anti-gr1 10 2 10 1 anti-gr1 10 2 10 1 10 0 10 0 10 1 10 2 10 3 10 4 anti-f4/80 42.3 45.2 10 0 10 0 10 1 10 2 10 3 10 4 anti-f4/80 10 4 10 4 40 42.5 anti-cd11b 10 3 10 2
a 10 4 WT 10 4 TRPV2KO 10 3 10 3 anti-gr1 10 2 10 1 anti-gr1 10 2 10 1 10 0 10 0 10 1 10 2 10 3 10 4 anti-f4/80 42.3 45.2 10 0 10 0 10 1 10 2 10 3 10 4 anti-f4/80 10 4 10 4 40 42.5 anti-cd11b 10 3 10 2
TEB. Id4 p63 DAPI Merge. Id4 CK8 DAPI Merge
 a Duct TEB b Id4 p63 DAPI Merge Id4 CK8 DAPI Merge c d e Supplementary Figure 1. Identification of Id4-positive MECs and characterization of the Comma-D model. (a) IHC analysis of ID4 expression in the
SUPPLEMENTARY INFORMATION
 doi: 10.1038/nature06994 A phosphatase cascade by which rewarding stimuli control nucleosomal response A. Stipanovich*, E. Valjent*, M. Matamales*, A. Nishi, J.H. Ahn, M. Maroteaux, J. Bertran-Gonzalez,
Supplementary Figure 1. Characterization of human carotid plaques. (a) Flash-frozen human plaques were separated into vulnerable (V) and stable (S),
 Flash-frozen human plaques were separated into vulnerable (V) and stable (S),") Supplementary Figure 1. Characterization of human carotid plaques. (a) Flash-frozen human plaques were separated into vulnerable (V) and stable (S), regions which were then quantified for mean fluorescence
Supplementary Figure 1. Characterization of human carotid plaques. (a) Flash-frozen human plaques were separated into vulnerable (V) and stable (S), regions which were then quantified for mean fluorescence
Supplementary Fig. 1: ATM is phosphorylated in HER2 breast cancer cell lines. (A) ATM is phosphorylated in SKBR3 cells depending on ATM and HER2
 ATM is phosphorylated in SKBR3 cells depending on ATM and HER2") Supplementary Fig. 1: ATM is phosphorylated in HER2 breast cancer cell lines. (A) ATM is phosphorylated in SKBR3 cells depending on ATM and HER2 activity. Upper panel: Representative histograms for FACS
Supplementary Fig. 1: ATM is phosphorylated in HER2 breast cancer cell lines. (A) ATM is phosphorylated in SKBR3 cells depending on ATM and HER2 activity. Upper panel: Representative histograms for FACS
Supplementary Figure 1: Neuregulin 1 increases the growth of mammary organoids compared to EGF. (a) Mammary epithelial cells were freshly isolated,
 Mammary epithelial cells were freshly isolated,") 1 2 3 4 5 6 7 8 9 10 Supplementary Figure 1: Neuregulin 1 increases the growth of mammary organoids compared to EGF. (a) Mammary epithelial cells were freshly isolated, embedded in matrigel and exposed
1 2 3 4 5 6 7 8 9 10 Supplementary Figure 1: Neuregulin 1 increases the growth of mammary organoids compared to EGF. (a) Mammary epithelial cells were freshly isolated, embedded in matrigel and exposed
T H E J O U R N A L O F C E L L B I O L O G Y
 T H E J O U R N A L O F C E L L B I O L O G Y Supplemental material Krenn et al., http://www.jcb.org/cgi/content/full/jcb.201110013/dc1 Figure S1. Levels of expressed proteins and demonstration that C-terminal
Title: Smooth muscle cell-specific Tgfbr1 deficiency promotes aortic aneurysm formation by stimulating multiple signaling events
 Title: Smooth muscle cell-specific Tgfbr1 deficiency promotes aortic aneurysm formation by stimulating multiple signaling events Pu Yang 1, 3, radley M. Schmit 1, Chunhua Fu 1, Kenneth DeSart 1, S. Paul
Pearson r = P (one-tailed) = n = 9
 = n = 9") 8F4-Specific Lysis, % 1 UPN1 UPN3 8 UPN7 6 Pearson r =.69 UPN2 UPN5 P (one-tailed) =.192 4 UPN8 n = 9 2 UPN9 UPN4 UPN6 5 1 15 2 25 8 8F4, % Max MFI Supplementary Figure S1. AML samples UPN1-UPN9 show variable
8F4-Specific Lysis, % 1 UPN1 UPN3 8 UPN7 6 Pearson r =.69 UPN2 UPN5 P (one-tailed) =.192 4 UPN8 n = 9 2 UPN9 UPN4 UPN6 5 1 15 2 25 8 8F4, % Max MFI Supplementary Figure S1. AML samples UPN1-UPN9 show variable
SUPPLEMENTARY INFORMATION
 DOI: 10.1038/ncb2607 Figure S1 Elf5 loss promotes EMT in mammary epithelium while Elf5 overexpression inhibits TGFβ induced EMT. (a, c) Different confocal slices through the Z stack image. (b, d) 3D rendering
Supplementary Materials. for Garmy-Susini, et al, Integrin 4 1 signaling is required for lymphangiogenesis and tumor metastasis
 Supplementary Materials for Garmy-Susini, et al, Integrin 4 1 signaling is required for lymphangiogenesis and tumor metastasis 1 Supplementary Figure Legends Supplementary Figure 1: Integrin expression
Supplementary Table S1. Tumor samples used for analysis Tumor size (cm) BNG (grade) ERα PR. pn-
 BNG (grade) ERα PR. pn-") Supplementary Table S1. Tumor samples used for analysis Sample# Age Tumor size (cm) pn- Stage Stage BNG (grade) ERα PR HER2 (FISH) Triple negative T1 46 3 N1a III 2 Pos Neg N T2 58 1 N(i-) I 3 Pos Neg
Supplementary Table S1. Tumor samples used for analysis Sample# Age Tumor size (cm) pn- Stage Stage BNG (grade) ERα PR HER2 (FISH) Triple negative T1 46 3 N1a III 2 Pos Neg N T2 58 1 N(i-) I 3 Pos Neg
Supplementary Information. Tissue-wide immunity against Leishmania. through collective production of nitric oxide
 Supplementary Information Tissue-wide immunity against Leishmania through collective production of nitric oxide Romain Olekhnovitch, Bernhard Ryffel, Andreas J. Müller and Philippe Bousso Supplementary
(A) RT-PCR for components of the Shh/Gli pathway in normal fetus cell (MRC-5) and a
 RT-PCR for components of the Shh/Gli pathway in normal fetus cell (MRC-5) and a") Supplementary figure legends Supplementary Figure 1. Expression of Shh signaling components in a panel of gastric cancer. (A) RT-PCR for components of the Shh/Gli pathway in normal fetus cell (MRC-5) and
Supplementary figure legends Supplementary Figure 1. Expression of Shh signaling components in a panel of gastric cancer. (A) RT-PCR for components of the Shh/Gli pathway in normal fetus cell (MRC-5) and
Rapid parallel measurements of macroautophagy and mitophagy in
 Supplemental Figures Rapid parallel measurements of macroautophagy and mitophagy in mammalian cells using a single fluorescent biosensor Sargsyan A, Cai J, Fandino LB, Labasky ME, Forostyan T, Colosimo
Atg5 flox/flox ; CAG-Cre, 19M brain heart lung. spleen stomach colon. Takamura_Fig. S1
 Takamura_Fig. S1 brain heart lung spleen stomach colon kidney SM Supplemental Figure 1 Histological findings of tg5 flox/flox ;CG-Cre mouse tissues. H&E staining of the brain, heart, lung, spleen, stomach,
Supplementary Information
 Supplementary Information Supplementary Figure 1. Effect of mir mimics and anti-mirs on DTPs a, Representative fluorescence microscopy images of GFP vector control or mir mimicexpressing parental and DTP
Supplementary Information
 Supplementary Information Targeted Disruption of the EZH2/EED Complex Inhibits EZH2- dependent Cancer Woojin Kim 1,2,3, Gregory H. Bird 2,3,4, Tobias Neff 5, Guoji Guo 1,2,3, Marc A. Kerenyi 1,2,3, Loren
Supplemental Materials. STK16 regulates actin dynamics to control Golgi organization and cell cycle
 Supplemental Materials STK16 regulates actin dynamics to control Golgi organization and cell cycle Juanjuan Liu 1,2,3, Xingxing Yang 1,3, Binhua Li 1, Junjun Wang 1,2, Wenchao Wang 1, Jing Liu 1, Qingsong
Supplementary Figure 1. Successful excision of genes from WBM lysates and
 Supplementary Information: Supplementary Figure 1. Successful excision of genes from WBM lysates and survival of mice with different genotypes. (a) The proper excision of Pten, p110α, p110α and p110δ was
VEGFR2-Mediated Vascular Dilation as a Mechanism of VEGF-Induced Anemia and Bone Marrow Cell Mobilization
 Cell Reports, Volume 9 Supplemental Information VEGFR2-Mediated Vascular Dilation as a Mechanism of VEGF-Induced Anemia and Bone Marrow Cell Mobilization Sharon Lim, Yin Zhang, Danfang Zhang, Fang Chen,
Supplementary Figure 1. Double-staining immunofluorescence analysis of invasive colon and breast cancers. Specimens from invasive ductal breast
 Supplementary Figure 1. Double-staining immunofluorescence analysis of invasive colon and breast cancers. Specimens from invasive ductal breast carcinoma (a) and colon adenocarcinoma (b) were staining
SUPPLEMENTARY INFORMATION
 DOI: 10.1038/ncb3021 Supplementary figure 1 Characterisation of TIMPless fibroblasts. a) Relative gene expression of TIMPs1-4 by real time quantitative PCR (RT-qPCR) in WT or ΔTimp fibroblasts (mean ±
Nature Structural and Molecular Biology: doi: /nsmb Supplementary Figure 1
 Supplementary Figure 1 Mutational analysis of the SA2-Scc1 interaction in vitro and in human cells. (a) Autoradiograph (top) and Coomassie stained gel (bottom) of 35 S-labeled Myc-SA2 proteins (input)
Figure S1. PMVs from THP-1 cells expose phosphatidylserine and carry actin. A) Flow
 Flow") SUPPLEMENTARY DATA Supplementary Figure Legends Figure S1. PMVs from THP-1 cells expose phosphatidylserine and carry actin. A) Flow cytometry analysis of PMVs labelled with annexin-v-pe (Guava technologies)
SUPPLEMENTARY DATA Supplementary Figure Legends Figure S1. PMVs from THP-1 cells expose phosphatidylserine and carry actin. A) Flow cytometry analysis of PMVs labelled with annexin-v-pe (Guava technologies)
Supplementary Figure 1. Normal T lymphocyte populations in Dapk -/- mice. (a) Normal thymic development in Dapk -/- mice. Thymocytes from WT and Dapk
 Normal thymic development in Dapk -/- mice. Thymocytes from WT and Dapk") Supplementary Figure 1. Normal T lymphocyte populations in Dapk -/- mice. (a) Normal thymic development in Dapk -/- mice. Thymocytes from WT and Dapk -/- mice were stained for expression of CD4 and CD8.
Supplementary Figure 1. Normal T lymphocyte populations in Dapk -/- mice. (a) Normal thymic development in Dapk -/- mice. Thymocytes from WT and Dapk -/- mice were stained for expression of CD4 and CD8.
Supplementary Figure 1 CD4 + T cells from PKC-θ null mice are defective in NF-κB activation during T cell receptor signaling. CD4 + T cells were
 Supplementary Figure 1 CD4 + T cells from PKC-θ null mice are defective in NF-κB activation during T cell receptor signaling. CD4 + T cells were isolated from wild type (PKC-θ- WT) or PKC-θ null (PKC-θ-KO)
Fig. S1. Upregulation of K18 and K14 mrna levels during ectoderm specification of hescs. Quantitative real-time PCR analysis of mrna levels of OCT4
 Fig. S1. Upregulation of K18 and K14 mrna levels during ectoderm specification of hescs. Quantitative real-time PCR analysis of mrna levels of OCT4 (n=3 independent differentiation experiments for each
Zhu et al, page 1. Supplementary Figures
 Zhu et al, page 1 Supplementary Figures Supplementary Figure 1: Visual behavior and avoidance behavioral response in EPM trials. (a) Measures of visual behavior that performed the light avoidance behavior
(A) Dose response curves of HMLE_shGFP (blue circle), HMLE_shEcad (red square),
 Dose response curves of HMLE_shGFP (blue circle), HMLE_shEcad (red square),") Supplementary Figures and Tables Figure S1. Validation of EMT-selective small molecules (A) Dose response curves of HMLE_shGFP (blue circle), HMLE_shEcad (red square), and HMLE_Twist (black diamond) cells
Supplementary Figures and Tables Figure S1. Validation of EMT-selective small molecules (A) Dose response curves of HMLE_shGFP (blue circle), HMLE_shEcad (red square), and HMLE_Twist (black diamond) cells
SUPPLEMENTARY INFORMATION. Supplementary Figures S1-S9. Supplementary Methods
 SUPPLEMENTARY INFORMATION SUMO1 modification of PTEN regulates tumorigenesis by controlling its association with the plasma membrane Jian Huang 1,2#, Jie Yan 1,2#, Jian Zhang 3#, Shiguo Zhu 1, Yanli Wang
Suppl Video: Tumor cells (green) and monocytes (white) are seeded on a confluent endothelial
 and monocytes (white) are seeded on a confluent endothelial") Supplementary Information Häuselmann et al. Monocyte induction of E-selectin-mediated endothelial activation releases VE-cadherin junctions to promote tumor cell extravasation in the metastasis cascade
Supplementary Information Häuselmann et al. Monocyte induction of E-selectin-mediated endothelial activation releases VE-cadherin junctions to promote tumor cell extravasation in the metastasis cascade
sequences of a styx mutant reveals a T to A transversion in the donor splice site of intron 5
 sfigure 1 Styx mutant mice recapitulate the phenotype of SHIP -/- mice. (A) Analysis of the genomic sequences of a styx mutant reveals a T to A transversion in the donor splice site of intron 5 (GTAAC
Supplementary Figure 1
 Supplementary Figure 1 Dox Cis Cam Pac 0 15 1 15 1 15 1 15 1 15 µmole/l Ub p53 Cytotoxic anticancer agents increase p53 levels but do not generally promote the accumulation of ubiquitinated. Western blots
Supplemental Figure S1A Notch1
 Supplemental Figure S1A Notch1 erage) epth of Cove ormalized De Log1(No Notch exons Figure S1: A) Relative coverage of Notch1 and Notch 2 exons in HCC2218, HCC1187, MB157, MDA-MB157 cell lines. Blue color
(A) PCR primers (arrows) designed to distinguish wild type (P1+P2), targeted (P1+P2) and excised (P1+P3)14-
 PCR primers (arrows) designed to distinguish wild type (P1+P2), targeted (P1+P2) and excised (P1+P3)14-") 1 Supplemental Figure Legends Figure S1. Mammary tumors of ErbB2 KI mice with 14-3-3σ ablation have elevated ErbB2 transcript levels and cell proliferation (A) PCR primers (arrows) designed to distinguish
1 Supplemental Figure Legends Figure S1. Mammary tumors of ErbB2 KI mice with 14-3-3σ ablation have elevated ErbB2 transcript levels and cell proliferation (A) PCR primers (arrows) designed to distinguish
Supplementary Materials for
 www.sciencesignaling.org/cgi/content/full/7/308/ra4/dc1 Supplementary Materials for Antipsychotics Activate mtorc1-dependent Translation to Enhance Neuronal Morphological Complexity Heather Bowling, Guoan
Supplementary figure legends
 Supplementary figure legends Supplementary Figure 1. Exposure of CRT occurs independently from the apoptosisassociated loss of the mitochondrial membrane potential (MMP). (A) HeLa cells treated with MTX
Supplementary Table 1. Characterization of HNSCC PDX models established at MSKCC
 Supplementary Table 1. Characterization of HNSCC PDX models established at MSKCC Supplementary Table 2. Drug content and loading efficiency estimated with F-NMR and UV- Vis Supplementary Table 3. Complete
CD14 + S100A9 + Monocytic Myeloid-Derived Suppressor Cells and Their Clinical Relevance in Non-Small Cell Lung Cancer
 CD14 + S1A9 + Monocytic Myeloid-Derived Suppressor Cells and Their Clinical Relevance in Non-Small Cell Lung Cancer Po-Hao, Feng M.D., Kang-Yun, Lee, M.D. Ph.D., Ya-Ling Chang, Yao-Fei Chan, Lu- Wei, Kuo,Ting-Yu
Supplementary Materials for
 www.sciencesignaling.org/cgi/content/full/8/364/ra18/dc1 Supplementary Materials for The tyrosine phosphatase (Pez) inhibits metastasis by altering protein trafficking Leila Belle, Naveid Ali, Ana Lonic,
Supplementary Figure 1. Efficient DC depletion in CD11c.DOG transgenic mice
 Supplementary Figure 1. Efficient DC depletion in CD11c.DOG transgenic mice (a) CD11c.DOG transgenic mice (tg) were treated with 8 ng/g body weight (b.w.) diphtheria toxin (DT) i.p. on day -1 and every
Supplementary Figure 1
 Supplementary Figure 1 YAP negatively regulates IFN- signaling. (a) Immunoblot analysis of Yap knockdown efficiency with sh-yap (#1 to #4 independent constructs) in Raw264.7 cells. (b) IFN- -Luc and PRDs
GFP-LC3 +/+ CLU -/- kda CLU GFP. Actin. GFP-LC3 +/+ CLU -/- kda CLU GFP. Actin
 Supplementary Fig. 1 a CQ treatment ScrB OGX11 MG132 I II AZD5363 I II b GFP / / GFP / / GFP / / GFP / / GFP GFP Actin Actin ctrl CQ GFP / / GFP / / GFP / / GFP / / GFP GFP Actin Actin rapamycin rapamycincq
Pharmacologic inhibition of histone demethylation as a therapy for pediatric brainstem glioma
 Supplementary information for: Pharmacologic inhibition of histone demethylation as a therapy for pediatric brainstem glioma Rintaro Hashizume 1, Noemi Andor 2, Yuichiro Ihara 2, Robin Lerner 2, Haiyun
SUPPLEMENTARY INFORMATION
 b 350 300 250 200 150 100 50 0 E0 E10 E50 E0 E10 E50 E0 E10 E50 E0 E10 E50 Number of organoids per well 350 300 250 200 150 100 50 0 R0 R50 R100 R500 1st 2nd 3rd Noggin 100 ng/ml Noggin 10 ng/ml Noggin
Supplementary Figure 1 Induction of cellular senescence and isolation of exosome. a to c, Pre-senescent primary normal human diploid fibroblasts
 Supplementary Figure 1 Induction of cellular senescence and isolation of exosome. a to c, Pre-senescent primary normal human diploid fibroblasts (TIG-3 cells) were rendered senescent by either serial passage
pro-b large pre-b small pre-b CCCP (µm) Rag1 -/- ;33.C9HCki
 Rag1 -/- ;33.C9HCki") a TMRM FI (Median) b TMRM FI (Median) c 20 15 10 5 0 8 6 4 2 0 pro-b large pre-b small pre-b 0 10 20 30 40 50 60 70 80 90 100 TMRM (nm) pro-b large pre-b small pre-b 0 1 2 4 8 16 32 64 128 256 CCCP (mm)
a TMRM FI (Median) b TMRM FI (Median) c 20 15 10 5 0 8 6 4 2 0 pro-b large pre-b small pre-b 0 10 20 30 40 50 60 70 80 90 100 TMRM (nm) pro-b large pre-b small pre-b 0 1 2 4 8 16 32 64 128 256 CCCP (mm)
SUPPLEMENTARY FIGURES
 SUPPLEMENTARY FIGURES 1 Supplementary Figure 1, Adult hippocampal QNPs and TAPs uniformly express REST a-b) Confocal images of adult hippocampal mouse sections showing GFAP (green), Sox2 (red), and REST
Extracellular vesicles are transferred from melanocytes to keratinocytes after UVA irradiation
 Supplementary material; Title; Extracellular vesicles are transferred from melanocytes to keratinocytes after UVA irradiation Authors; Petra Wäster 1, Ida Eriksson 1, Linda Vainikka 1, Inger Rosdahl 2,
F-actin VWF Vinculin. F-actin. Vinculin VWF
 a F-actin VWF Vinculin b F-actin VWF Vinculin Supplementary Fig. 1. WPBs in HUVECs are located along stress fibers and at focal adhesions. (a) Immunofluorescence images of f-actin (cyan), VWF (yellow),
5K ALDEFLUOR-positive/ CXCR1-negative. 5K ALDEFLUOR-positive/ CXCR1-positive BAAA BAAA CXCR1-APC BAAA BAAA CXCR1-APC
 A +DEAB -DEAB K ALDEFLUOR-positive/ CXCR-negative BAAA BAAA CXCR-APC B +DEAB -DEAB K ALDEFLUOR-positive/ CXCR-positive BAAA BAAA CXCR-APC C Supplemental Figure. Tumorigenicity of the ALDEFLUOR-positive/CXCR-positive
Supplementary Information. Induction of human pancreatic beta cell replication by inhibitors of dual specificity tyrosine regulated kinase
 Journal: Nature Medicine Supplementary Information Induction of human pancreatic beta cell replication by inhibitors of dual specificity tyrosine regulated kinase 1,2 Peng Wang PhD, 1,2 Juan-Carlos Alvarez-Perez
Aggregated neutrophil extracellular traps limit inflammation by degrading cytokines and chemokines
 CORRECTION NOTICE Nat. Med. doi:10.1038/nm.3547; corrected online 25 August 2014 Aggregated neutrophil extracellular traps limit inflammation by degrading cytokines and chemokines Christine Schauer, Christina
Supplementary information
 Supplementary information Lipid peroxidation causes endosomal antigen release for cross-presentation Ilse Dingjan 1, Daniëlle RJ Verboogen 1, Laurent M Paardekooper 1, Natalia H Revelo 1, Simone P Sittig
(A) Cells grown in monolayer were fixed and stained for surfactant protein-c (SPC,
 Cells grown in monolayer were fixed and stained for surfactant protein-c (SPC,") Supplemental Figure Legends Figure S1. Cell line characterization (A) Cells grown in monolayer were fixed and stained for surfactant protein-c (SPC, green) and co-stained with DAPI to visualize the nuclei.
Supplemental Figure Legends Figure S1. Cell line characterization (A) Cells grown in monolayer were fixed and stained for surfactant protein-c (SPC, green) and co-stained with DAPI to visualize the nuclei.
p = formed with HCI-001 p = Relative # of blood vessels that formed with HCI-002 Control Bevacizumab + 17AAG Bevacizumab 17AAG
 A.. Relative # of ECs associated with HCI-001 1.4 1.2 1.0 0.8 0.6 0.4 0.2 0.0 ol b p < 0.001 Relative # of blood vessels that formed with HCI-001 1.4 1.2 1.0 0.8 0.6 0.4 0.2 0.0 l b p = 0.002 Control IHC:
fl/+ KRas;Atg5 fl/+ KRas;Atg5 fl/fl KRas;Atg5 fl/fl KRas;Atg5 Supplementary Figure 1. Gene set enrichment analyses. (a) (b)
 (b)") KRas;At KRas;At KRas;At KRas;At a b Supplementary Figure 1. Gene set enrichment analyses. (a) GO gene sets (MSigDB v3. c5) enriched in KRas;Atg5 fl/+ as compared to KRas;Atg5 fl/fl tumors using gene set
KRas;At KRas;At KRas;At KRas;At a b Supplementary Figure 1. Gene set enrichment analyses. (a) GO gene sets (MSigDB v3. c5) enriched in KRas;Atg5 fl/+ as compared to KRas;Atg5 fl/fl tumors using gene set
Supplemental Figures:
 Supplemental Figures: Figure 1: Intracellular distribution of VWF by electron microscopy in human endothelial cells. a) Immunogold labeling of LC3 demonstrating an LC3-positive autophagosome (white arrow)
Supplementary Figures
 Supplementary Figures a b c d PDI activity in % ERp72 activity in % 4 3 2 1 1 1 ERp activity in % e ΔRFU min -1 1 1 ERp7 activity in % 1 1 Supplementary Figure 1. Selectivity of the bepristat-mediated
Nature Neuroscience: doi: /nn Supplementary Figure 1. Splenic atrophy and leucopenia caused by T3 SCI.
 Supplementary Figure 1 Splenic atrophy and leucopenia caused by T3 SCI. (a) Gross anatomy of representative spleens from control and T3 SCI mice at 28 days post-injury. (b and c) Hematoxylin and eosin
Supplemental Table S1
 Supplemental Table S. Tumorigenicity and metastatic potential of 44SQ cell subpopulations a Tumorigenicity b Average tumor volume (mm ) c Lung metastasis d CD high /4 8. 8/ CD low /4 6./ a Mice were injected
Supplementary Table 1
 Supplementary Table 1 Flow Cytometry Antibodies Antibody Fluorochrome Clone Vendor CD45 PE-cyanine 7 30-F11 D ioscience CD3 Pacific lue 17A2 iolegend (San Diego, CA) CD11b APC M1/70 iolegend (San Diego,
Supplemental Figures Supplemental Figure 1:
 Supplemental Figures Supplemental Figure 1: Representative FACS data showing Concurrent Brain cell type Acquisition using either Percoll PLUS (top row) or myelin removal beads (bottom two rows). Debris
Supplementary Figure 1
 Supplementary Figure 1 14 12 SEM4C PLXN2 8 SEM4C C 3 Cancer Cell Non Cancer Cell Expression 1 8 6 6 4 log2 ratio Expression 2 1 4 2 2 p value.1 D Supplementary Figure 1. Expression of Sema4C and Plexin2
Supplementary Figure 1. IL-12 serum levels and frequency of subsets in FL patients. (A) IL-12
 IL-12") 1 Supplementary Data Figure legends Supplementary Figure 1. IL-12 serum levels and frequency of subsets in FL patients. (A) IL-12 serum levels measured by multiplex ELISA (Luminex) in FL patients before
1 Supplementary Data Figure legends Supplementary Figure 1. IL-12 serum levels and frequency of subsets in FL patients. (A) IL-12 serum levels measured by multiplex ELISA (Luminex) in FL patients before
A. Generation and characterization of Ras-expressing autophagycompetent
 Supplemental Material Supplemental Figure Legends Fig. S1 A. Generation and characterization of Ras-expressing autophagycompetent and -deficient cell lines. HA-tagged H-ras V12 was stably expressed in
Supplementary Figure 1. Repression of hepcidin expression in the liver of mice treated with
 Supplementary Figure 1. Repression of hepcidin expression in the liver of mice treated with DMN Immunohistochemistry for hepcidin and H&E staining (left). qrt-pcr assays for hepcidin in the liver (right).
SUPPLEMENTARY INFORMATION
 doi:10.1038/nature11095 Supplementary Table 1. Summary of the binding between Angptls and various Igdomain containing receptors as determined by flow cytometry analysis. The results were summarized from
SUPPLEMENTARY LEGENDS...
 TABLE OF CONTENTS SUPPLEMENTARY LEGENDS... 2 11 MOVIE S1... 2 FIGURE S1 LEGEND... 3 FIGURE S2 LEGEND... 4 FIGURE S3 LEGEND... 5 FIGURE S4 LEGEND... 6 FIGURE S5 LEGEND... 7 FIGURE S6 LEGEND... 8 FIGURE
SUPPLEMENTARY INFORMATION
 DOI:.38/ncb2822 a MTC02 FAO cells EEA1 b +/+ MEFs /DAPI -/- MEFs /DAPI -/- MEFs //DAPI c HEK 293 cells WCE N M C P AKT TBC1D7 Lamin A/C EEA1 VDAC d HeLa cells WCE N M C P AKT Lamin A/C EEA1 VDAC Figure
SUPPLEMENTARY FIGURE LEGENDS
 SUPPLEMENTARY FIGURE LEGENDS Supplementary Figure 1. Hippocampal sections from new-born Pten+/+ and PtenFV/FV pups were stained with haematoxylin and eosin (H&E) and were imaged at (a) low and (b) high
Supplementary Figure 1
 Supplementary Figure 1 AAV-GFP injection in the MEC of the mouse brain C57Bl/6 mice at 4 months of age were injected with AAV-GFP into the MEC and sacrificed at 7 days post injection (dpi). (a) Brains
Breeding scheme, transgenes, histological analysis and site distribution of SB-mutagenized osteosarcoma.
 Supplementary Figure 1 Breeding scheme, transgenes, histological analysis and site distribution of SB-mutagenized osteosarcoma. (a) Breeding scheme. R26-LSL-SB11 homozygous mice were bred to Trp53 LSL-R270H/+