3) Table_S1: Clinical Characteristics of Breast Cancer Patients. 5) Table_S3: Primer sequences used for qt-pcr of ChIP samples
|
|
|
- Gwen Holmes
- 5 years ago
- Views:
Transcription
1 Supplemental Section: 1) Eight supplemental figures and legends 2) Supplemental Materials and Methods 3) Table_S1: Clinical Characteristics of Breast Cancer Patients 4) Table_S2: Oligonucleotide sequences for transient RNAi 5) Table_S3: Primer sequences used for qt-pcr of ChIP samples
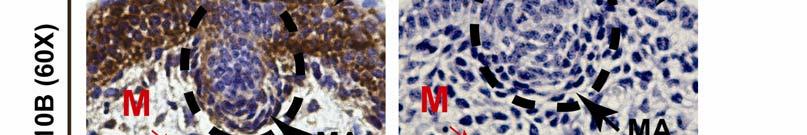
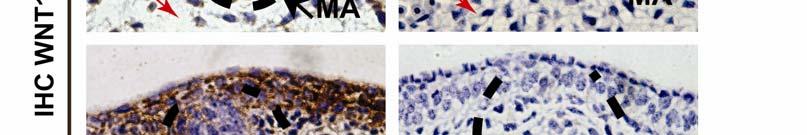
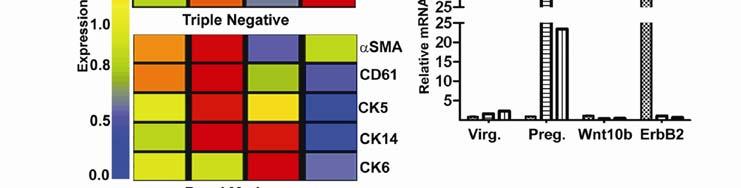
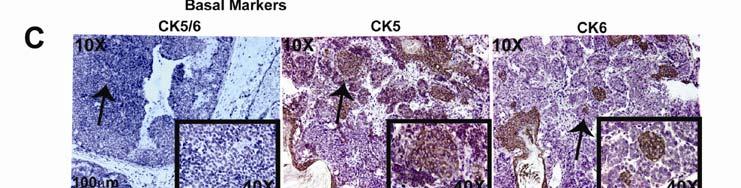
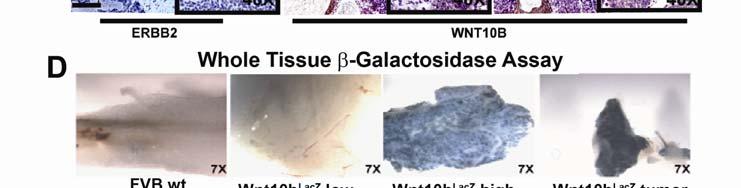
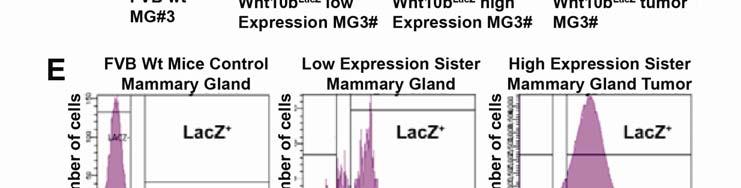
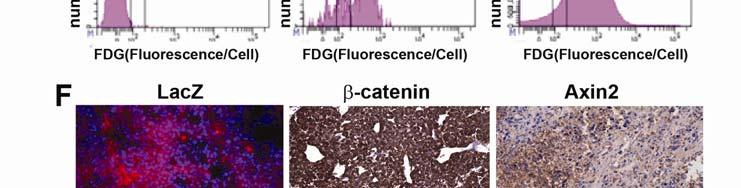
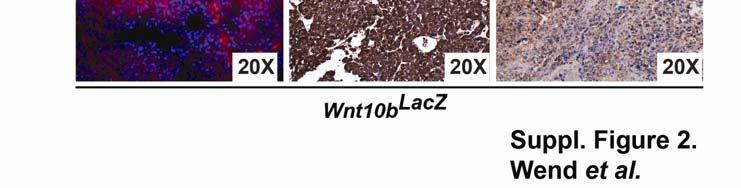
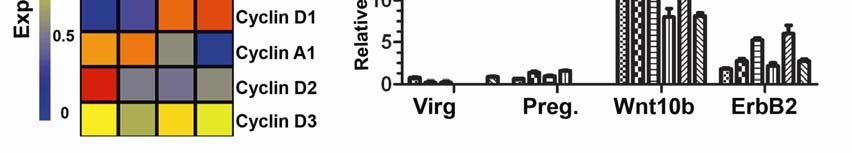
2 Figure S1. Verification of WNT10B-antibody specificity by WNT10B expression analysis in mammary tumor samples, cell lines and embryonic mammary anlagen. (A) Western blot analysis verifying expression of WNT10B on the following was conducted: Wnt10b LacZ tumor samples (1 : primary tumor, 2 : transplanted secondary tumor), a Wnt10b LacZ tumor-derived cell line (WZA LacZ ), parental NMG vs. NMG-10b-overexpressing cells, and human TNBC cell lines MDA-MB-231 and MDA-MB-468. Actin served as a loading control. Molecular weights are indicated in kda on the left side. Note that the predicted molecular weight of WNT10B is 43 kda. (B) IHC of WNT10B in wildtype and Wnt10b-knockout (Wnt10b -/- ) mammary gland anlagen (MA) at embryonic day Dashed black lines indicate MA. Note that the WNT10B antibody does not stain the epidermal layer (EL) and MA of Wnt10b -/- mice. The WNT10B antibody shows no cross-reactivity with other Wnt ligands that are coexpressed in these regions at the same time (e.g., Wnt 3, 4, 5, 6, 7a, 7b, 10a, 11, 16) (Reddy et al. 2001). Bar = 50 µm. Figure S2. Wnt10b-driven tumors are consistent with a triple-negative (ER - PR - HER2 - ) and basalepithelial expression phenotype and Wnt10b LacZ -induced tumors show active Wnt/β-catenin signaling. (A) Hierarchical cluster analysis of 10-week old virgin mammary gland, 12-day pregnant mammary tissue, MMTV-Wnt10b TG, and MMTV-ErbB2 TG mouse tumors. Triplicate samples were processed for microarray analysis and data was analyzed by GeneSpring TM. (B) QT-PCR validates array data for ErbB2, PR and ERα. Experiments were normalized to GADPH (n=3). Values represent fold induction of over wild type 10 week old virgin mammary gland values. Values represent the means ± 2 standard deviations. (C) Verification of CK5 and CK6 expression levels by IHC in Wnt10b TG -driven tumors. CK5 + and CK6 + cells are not detectable in ErbB2 TG tumors. Insets show 40X magnifications. (D) Whole-mount β-galactosidase staining of wildtype (FVB, left) and Wnt10b LacZ transgenic mammary glands (line WZ6 [low] and line WZA [high], and a mammary tumor [WZA, right]). 7X magnifications are shown. (E) Analysis of β-galactosidase (LacZ) activity in tissues from virgin 10 month aged-match FVB wildtype mammary gland #3, transgenic MMTV-Wnt10b LacZ founder WZA88F mammary gland #3 (low expression sister) and founder WZA89F mammary gland #3 tumor (high expression sister). (F) Adjacent sections from Wnt10b LacZ -induced mammary tumors were analyzed by IF for the expression of β Galactosidase/LacZ and by IHC for the expression of β-catenin and the Wnt/β-catenin target gene Axin2. Figure S3. Wnt/β-catenin signaling is essential for the growth and the expression of a specific set of cell cycle regulators in triple-negative breast cancer cells. (A) Hierarchical cluster analysis of microarray data from 10-week old virgin mammary tissue, 12-day pregnant mammary tissue, and primary
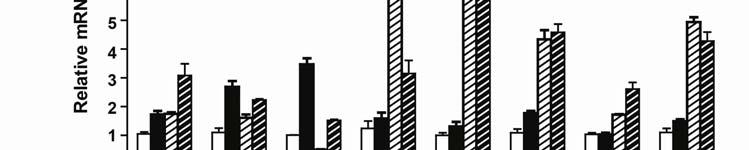
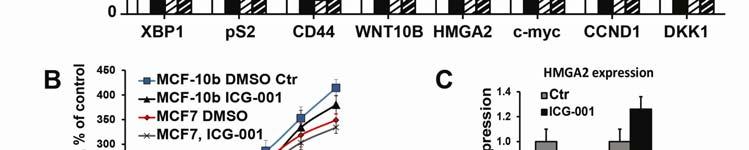
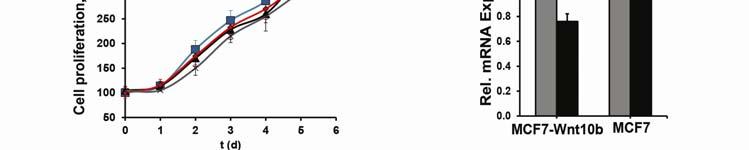
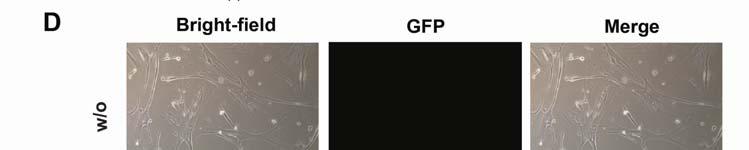
3 mammary gland tumors from MMTV-Wnt10b TG and MMTV-ErbB2 TG mice, respectively. Mean expression levels of 11 signature genes involved in proliferation ( intrinsic gene signature ) and cell cycle regulation are shown that distinguish MMTV-Wnt10b TG mammary tumors from MMTV-ErbB2 TG tumors and wildtype mammary tissue (each group n=3, data analyzed with GeneSpring TM ). (B) Verification of microarray gene expression data by qt-pcr for virgin and pregnant mammary tissue and for mammary tumors from MMTV-Wnt10b TG and MMTV-ErbB2 TG mice. Error bars represent the means and the standard deviations from three independent experiments. (C) shrna-mediated knockdown of Hmga2 leads to attenuated growth of NMG-10b cells. Shown is one shhmga2 clone compared to control NMG-10b and parental NMG cells. Error bars represent the means and the standard deviations from three independent experiments. (D) Reduced expression of Hmga2 in two different WZA LacZ clones after shrna-mediated knockdown of Hmga2, as determined by qt-pcr. Error bars represent the means and the standard deviations from three independent experiments; p-value: ***= versus shgfp control cells (Student s t-test). (E) Proliferation of WZA LacZ mammary tumor cells upon treatment with the Wnt/βcatenin inhibitor ICG-001 (10 µm). Error bars represent the means and the standard deviations from three independent experiments. (F) Reduced expression of Ccna2 in two different WZA LacZ clones after shrna-mediated knockdown of Hmga2, as determined by qt-pcr. Error bars represent the means and the standard deviations from three independent experiments; p-value: ***= versus shgfp control cells (Student s t-test). P values of <0.05 were considered to be statistically significant (D, F). Figure S4. Wnt10b-overexpressing MCF7 cells show increased expression of HMGA2 and Wnt target genes and still respond to estrogen treatment. BTL10 cells show active Wnt/β-catenin signaling, and unchanged proliferation of HUMEC cells upon treatment with ICG-001. (A) Analysis of mrna expression levels of estrogen signaling targets (XBP1 and ps2), HMGA2 and Wnt target genes upon 17β-estradiol (E2) treatment, as analyzed by qt-pcr. Error bars represent the means and the standard deviations from three independent experiments. (B) Proliferation of MCF7 and MCF7-Wnt10b cells upon treatment with the Wnt/β-catenin inhibitor ICG-001 (10 µm in 1% DMSO). Error bars represent the means and the standard deviations from three independent experiments. (C) Analysis of Hmga2 mrna expression levels in MCF7-Wnt10b and MCF7 cells upon ICG-001 treatment, as analyzed by qt-pcr. Error bars represent the means and the standard deviations from three independent experiments. (D) Human triple negative BTL10 breast cancer cells show active Wnt/β-catenin signaling, as visualized using a lentiviral-transduced TCF/LEF GFP reporter system. Percentage indicates GFPpositive BTL10 cells. (E) Proliferation of non-tumorigenic human HUMEC mammary cells upon
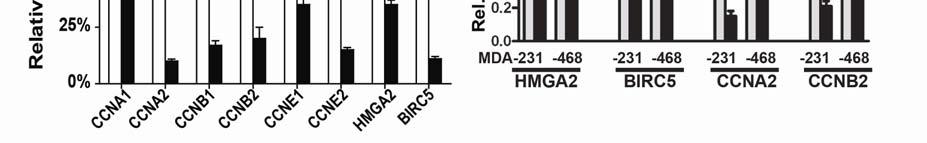
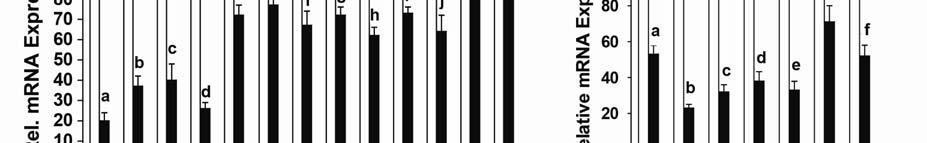
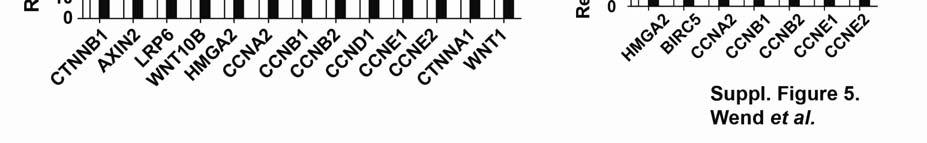
4 treatment with the Wnt/β-catenin inhibitor ICG-001 (10 µm in 1% DMSO). Error bars represent the means and the standard deviations from three independent experiments. Figure S5. Wnt/β-catenin signaling is essential for the expression of a specific set of cell cycle regulators in triple-negative breast cancer cells. (A, B) Expression of genes regulating cell cycle and self-renewal in MDA-MB 231 and MDA-MB 468 cells after ICG-001 treatment (10 μm). Error bars represent the means and the standard deviations from three independent experiments. (C) Effect of sirna-mediated knockdown of β-catenin on expression of genes involved in Wnt/β-catenin signaling and cell cycle regulation in MDA-MB231 cells, as analyzed by qt-pcr. Cells were transfected with 30 nm sirna, mrnas were analyzed after 48 hr. Error bars represent the means and the standard deviations from three independent experiments; p-values: a=0.01, b=0.04, c=0.03, d=0.01, e=0.02, f=0.02, g=0.02, h=0.04, i=0.03, j=0.02 versus si-luciferase control cells (Student s t-test). (D) Expression of genes regulating cell cycle and self-renewal in BTL-10 cells upon control (1% DMSO) or ICG-001 (10 µm) treatment. Error bars represent the means and the standard deviations from three independent experiments; p-values: a=0.03, b=0.03, c=0.04, d=0.02, e=0.01, f=0.04 versus control treatment (Student s t-test). P values of <0.05 were considered to be statistically significant (C, D). Figure S6. HMGA2 is highly and specifically expressed in triple-negative (ER - PR - ErbB2 - ) human breast cancer. (A-C) IHC shows expression of nuclear HMGA2 in human TNBC samples from different patient groups. Hematoxylin-Eosin (HE) staining from an adjacent section is shown on the left. Bar, 50 µm. (D) Absence of HMGA2 expression in adjacent normal human breast tissue from four independent patient samples diagnosed with TNBC (i-iv). (E) HMGA2 is predominantly expressed in the nucleus of human TNBC. The graph demonstrates the relative frequency of nuclear HMGA2 immuno-reactivity in TNBCs (n=59). Figure S7. TNBC patients expressing high levels of WNT10B or HMGA2 have an unfavorable clinical outcome. (A-D) Associations between WNT10B and HMGA2 expression (determined by IHC in TNBC patients) and clinical parameters such as tumor size (>1.5 cm), proliferation (Ki67%), nuclear grade and metastasis were measured on a continuous (A, B) or ordinal scale (C, D) and were evaluated using Kendall s Tau (A-C) or Fisher s exact test (D). Kendall s Tau ( ), p-value (p) and sample size (n) are depicted separately for each test. Additional clinical information on patient samples is provided in Supplemental Table 1. P values of <0.05 were considered to be statistically significant (A-D).
5 Figure S8. Human triple-negative breast cancers specifically express high levels of cytoplasmic and nuclear β-catenin as well as AXIN 2 indicating active Wnt/β-catenin signaling. (A, B) The subcellular localization of β-catenin in TNBC and other subtypes of human breast cancer (ER +, PR +, HER +, and triple-positive [TP + ]) was analyzed by IHC using antibodies detecting all β-catenin protein (A) or exclusively activated β-catenin (B). A colorectal carcinoma (CRC) is shown as a positive control for β-catenin accumulation in the cytosol and nuclei. Arrows highlight tumor cells with cytoplasmic (yellow) and nuclear β-catenin (red). In ER +, PR +, HER +, and TP + tumors β-catenin is observed predominantly at the membrane (A) or is only hardly detectable (B). Bar, 50 μm. (C) IHC analysis of AXIN 2 (a Wnt/βcatenin target gene) in TNBC and other subtypes of human breast cancer (ER +, PR +, HER +, and TP + ), as analyzed by IHC. A colorectal carcinoma (CRC) is shown as a positive control for AXIN2 expression. In ER +, PR +, HER +, and TP + tumors AXIN2 expression is very low or undetectable. Bar, 50 μm.


6
7
8
9
10
11
12
13
14 Supplemental Material and Methods: Human Breast Cancer Tissues: Breast tumor specimens from patients with primary triple-negative breast carcinoma were evaluated. Archival formalin-fixed paraffin-embedded tissues were obtained from the surgical pathology archive of the University of Chicago, USA (H.S.), Cedars-Sinai Medical Center, Los Angeles, USA (S.B.), and Charité University Medicine, Berlin, Germany (C.L.). Tumor staging and grading was performed according to current clinical and pathological classifications. Clinical characteristics of breast cancer patients can be found in Table S1. Human Tissue Micro Arrays: For immunohistochemistry studies, normal human breast tissue and primary human breast cancer samples from different breast cancer subtypes were obtained from University of Chicago Tissue Bank and from Ohio State University Human Tissue Bank. All specimens were previously stained via Hematoxylin and Eosin and reviewed by study-assigned pathologist s samples. Cell isolation for FACS analysis: Freshly dissected wildtype mammary glands or mammary tumors from mutant mice were minced and digested for 4 hrs at 37 C in EpiCult-B with 5% fetal bovine serum (FBS), 300 U/ml collagenase and 100 U/ml hyaluronidase (Stem Cell Inc.). Thereafter, epithelial organoids were incubated with 0.25 % trypsin in citrate (Stem Cell Inc.) followed by a treatment with 5 mg/ml dispase II (Stem Cell Inc.) plus 0.1 mg/ml DNase I (Sigma). After lysis of the red blood cells in ice-cold 0.8% NH4Cl (PBS), cells were washed with staining buffer (1% FBS/PBS) and filtered through a 40 µm mesh. Thereafter, cells were stained for LacZ + / -galactosidase (FluoReporter lacz Kit, Molecular Probes) according to the manufacture s protocol. Cells were sorted using FACS Aria (BD Biosciences) and data was analyzed using CELLQuest (BD Biosciences) or FlowJo (Tree Star) softwares. Apoptotic cells were excluded by elimination of DAPI-positive cells. Cell Culture and Cell proliferation assay: The BTL-10 cell line was established from direct culture of a stage 3 triple-negative breast cancer Caucasian patient and can be obtained from J.L.L. upon request. For the cell proliferation assay cells were seeded at a density of 1x10 3 cells in 100 μl of medium into each well of 96-well plates and cells were treated accordingly. 10 μl of WST-1 solution was added to each
15 well, and samples were incubated at 37 C for 3.5 h. A plate reader was used to detect 414 nm (detection wavelength) and 630 nm (reference wavelength) values, respectively (n=3, test medium served as blank). Mammosphere formation assay (MSA): MSA cultures were carried according to manufacturer s protocol (Stemcell Technologies). Briefly, 2x10 5 cells were seeded in ultra-low adherence 6-well culture dishes (Nalge Nunc) and cultured for 10 days in complete Mammocult culture medium (Stem Cell Inc.) containing ICG-001 (10μM) or DMSO (1:1000) as control (each n=3). Lin - LacZ + cells of mouse Wnt10b LacZ mammary tumors were seeded at a density of 2x10 3 cells in 200 μl into each well of ultra-low adherence 96-well plate (Corning) and cultured for 15 days in complete Mammocult culture medium (Stem Cell Inc.) containing ICG-001 (10μM) or DMSO (1:1000) as control. MSA was evaluated using an inverted microscope (Leica DMI6000 B). Immunohistochemistry (IHC): Tumor tissue and 7-week age-matched whole mammary gland were fixed in 4% paraformaldehyde and embedded in paraffin. A standard deparafinization and staining procedure was used as described (Miranda-Carboni et al, 2008). As primary antibodies were used: WNT10B (ab A7, Abcam), -Catenin (C2206, Sigma), Non-phospho (Active) β-catenin (#8814, Cell Signaling), AXIN2 (ab32197, Abcam), Ki67 (Labvision), Beta-Galactosidase (RGAL-45A-Z, Immunology Consultants Lab), CK5 (PRB-160P, Covance), CK6 (PRB-169P, Covance), HMGA2 (ab52039, Abcam), ERα (MC-20, Santa Cruz), PR (ab2764 PR-AT 4.14, Abcam), and HER2 (OP15, Millipore). Anti-mouse or anti-rabbit secondary antibodies and DAB-based IHC staining solutions were used (K4001, K4003, K3468, DAKO) and counterstaining was conducted with Hematoxylin QS (Vector Labs). ISH was performed as described (Huelsken et al, 2000) and sections were counterstained using nuclear fast red (Vector Labs). Imaging: Immunohistochemically stained tissue sections were mainly visualized on a Nikon ECLIPSE microscope (Nikon Instruments Inc., USA) using Nikon NIS Elements software. Brightfield microscopic image acquisition of nuclear structures and β-catenin signals was visualized on a Leica DMRE upright microscope (Leica Microsystems, Wetzlar, Germany) equipped with a water immersion objective (HCX APO 63x/0.90 NA) and a Nuance EX flexible bandwidth multispectral imaging system (CRi/Caliper Life
16 Sciences, Woburn, MA). Images were captured automatically by 10 nm increments from 450 nm to 750 nm under constant light illumination. The resulting spectral imaging data set was unmixed and analyzed with the vendor's software allowing spectral characterization for each of the multi-labeled components in the image. Western blotting: Cells were lysed as previously described (Miranda-Carboni et al, 2008) µg of protein were loaded per lane and separated by SDS-PAGE 10% gels. After transfer, Immobilon-P (Millipore) was immunoblotted using the following primary antibodies: HMGA2 (#5269, Cell Signaling), PCNA (#2586, Cell Signaling), Cyclin A2 (E23.1, sc-53228, Santa Cruz), Cyclin B1 (H-433, sc-752, Santa Cruz), Cyclin E1 (M-20, sc-481, Santa Cruz), Cdk2 (D-12, sc-6248, Santa Cruz), Cdk4 (C-22, sc- 260, Santa Cruz), E2F-1 (C-20, sc-193, Santa Cruz), p-rb (Ser807/811, sc-807/811, Santa Cruz), Rb (C- 15, sc-50, Santa Cruz), β-catenin (H-102, sc-7199, Santa Cruz), CBP (A-22, sc-369, Santa Cruz), -actin (20-33 A5060, Sigma). ImmunoPure-peroxidase conjugated secondary antibodies (Thermo Scientific) were used according to manufacturer's protocols. Chromatin immunoprecipitation (ChIP). ChIP was performed as previously described (Krum et al, 2008a; Krum et al, 2008b) Briefly, cross-linked chromatin was isolated from each plate and separate precipitation reactions were set up for each target protein complex using specific antisera. DNA was amplified by QT-PCR using the Applied Biosystems Power SYBR Green amplification system. Immunoprecipitated chromatin was amplified in triplicate for each target gene and run on an icycler thermocycler, as described above. Normalization was conducted to input chromatin, and to the mgapdh or to hhbb minimal promoters. Antibodies used included RNA pol II (#17-672, Millipore) and β-catenin (sc-7199 H-102, Santa Cruz). Each experiment was repeated at least 3 times. Primer pairs for each gene are provided in Supplemental Table S4. RNA and Real-Time PCR: Isolation of total RNA was performed using TRIzol (Invitrogen) according to manufacturer s protocol. RNA was treated with DNA-free kit (Ambion) and converted to cdna with iscript cdna Synthesis Kit (BioRad) or Maxima First Strand cdna Synthesis Kit (Fermentas) according to manufacturer s protocol. cdna was subjected to quantitative PCR (qt-pcr) using the
17 icycler thermocycler (BioRad) or Realplex2 cycler (Eppendorf). qt-pcr was conducted in a final volume of 20 µl using Maxima SYBR Green/ROX qpcr Master Mix (Fermentas) according to manufacturer's protocols. Amplification conditions were: 95 C (5'), 40 cycles of 95 C (30s), 55 C (60s) and 72 C (60s). Primer pairs for each gene are provided in Supplemental Table S3. Reporter Gene Assay: A GFP-based reporter assay was used to measure transcriptional activity of Wnt/ catenin signaling. For TCF/LEF-mediated transcription, a Cignal TM Lenti TCF/LEF Reporter (GFP) reporter assay kit (Cat# CLS-018G, SABiosciences) was used according to the manufacturer's protocol. GFP signal was measured by immunofluorescence microscopy. Affymetrix Microarrays. The samples were processed by UCLA s DNA Microarray Core Facility ( The procedures for probe preparation, hybridization, washing, scanning and signal intensity normalization was by manufactures protocols using GeneChip Operating Software (GCOS) v1.1.1 Affymetrix (Santa Clara, CA). Analysis was conducted on the Affymetrix GeneChip Mouse Genome arrays in triplicates for virgin and pregnant tissue and/or wnt10b/erbb2 derived tumors. Bioinformatics. MAIME structure Using GeneSpring GX 7.3 software (Agilent Corp.) the log of ratio normalized expression data was analyzed with cross-gene error model turned on and normalized per manufacture protocol. Calculations without the assumption of equality of variances were done using Welch s approximate t test and 1-way-ANOVA, with p value cutoff of Benjamini and Hochberg false discovery rate was used. Hierarchical clustering analysis was performed the averagelinkage method (Eisen, 1998 #208). Additional hypothesis-driven analyses were conducted using a conjoint Boolean consistency so noise ratio could be decreased and looking at gene expression 1.6 fold or greater over virgin samples.
18 Table S1: Clinical Characteristics of Breast Cancer Patients 1 No Origin Age at Diagnosis Tumor size, mm Ki67 % Nuclear grade Metastasis (1-yes, 0-no) WNT10B intensity 2 HMGA2 intensity 2 1 CS LA % 2 0 Medium Medium 2 CS LA % 3 1 Medium Medium 3 CS LA % 3 0 High High 4 CS LA % 2 0 High High 5 CS LA % 3 1 High High 6 CS LA % 3 0 Medium Low 7 CS LA % 3 1 High High 8 CS LA % 3 0 High High 9 CS LA % 3 0 High Medium 10 CS LA % 3 0 High High 11 CS LA % 3 0 Low Low 12 CS LA % 3 0 High High 13 CS LA % 3 1 High High 14 CS LA % na 1 High High 15 CS LA % 3 1 High High 16 CS LA % 2 0 Low Low 17 CS LA % 2 0 Medium Medium 18 CS LA % na 0 Medium High 19 CS LA % 3 0 Low Low 20 CS LA % 3 0 Low Medium 21 CS LA % 3 0 High High 22 CS LA % 3 1 Medium Medium 23 CS LA % 2 0 Low Low 24 CS LA % 1 0 Low Low 25 CS LA % 3 0 High Medium 26 CS LA % na 1 High High 27 CS LA % 3 1 High High 28 CS LA % 3 0 High High 29 CS LA % 3 0 Medium Medium 30 CS LA 47 6 na na 0 High High 31 CS LA na na 0 Medium Medium 32 U Chicago na na 0 Low Low 33 U Chicago na na 0 Low Low 34 U Chicago na na 0 Medium High 35 U Chicago na na 0 Medium Medium 36 U Chicago na na 0 High Medium 37 U Chicago na na 0 Medium Medium 38 U Chicago na na 1 Medium Medium 39 U Chicago na na 0 Medium Medium 40 U Chicago na na 0 Medium High 41 U Chicago na na 1 Medium High 42 U Chicago na na 0 High High 43 U Chicago na na 1 High High 44 U Chicago na na 0 High High 45 U Chicago na na 0 High High 46 Ch Berlin 5 50 na 50% na na Medium High
19 47 Ch Berlin 58 na 90% na na High High 48 Ch Berlin 55 na 40% na na High High 49 Ch Berlin 48 na 40% na na Medium Low 50 Ch Berlin 71 na 95% na na High High 51 Ch Berlin 51 na 35% na na Low Medium 52 Ch Berlin 87 na 15% na na Low Low 53 Ch Berlin 38 na 60% na na Medium Medium 54 Ch Berlin 92 na 30% na na Medium Medium 55 Ch Berlin 76 na 40% na na Medium Medium 56 Ch Berlin 44 na 80% na na High High 57 Ch Berlin 68 na 15% na na Low Medium 58 Ch Berlin 69 na 40% na na Low Medium 59 Ch Berlin 60 na 80% na na High High 1 Tumor specimens from 59 female patients with grade 3 primary triple-negative breast tumors (i.e., negative for ER, PR, Her2) were evaluated. Tumor staging and grading was performed according to current clinical and pathological classifications. 2 Scoring was based on intensity and percentage of positively stained cells for WNT10B and HMGA2 by immunohistochemistry, Low; 1-30%, Medium; 30-70%, High; 70% 3 Dept. of Pathology and Laboratory Medicine, Cedars Sinai Medical Center, Los Angeles, USA 4 Dept. of Pathology, The University of Chicago, Chicago, IL 60637, USA 5 Institute of Pathology, Charité University Medicine/UKBF, Berlin, Germany Table S2: Oligonucleotide sequences for transient RNAi: Gene Oligo No. Target Sequence CTNNB GCUGAAACAUGCAGUUGUAUU GAUAAAGGCUACUGUUGGAUU CCACUAAUGUCCAGCGUUUUU ACAAGUAGCUGAUAUUGAUUU-3 Luciferase 1 5 -CACUUACGCUGAGUACUUCGAdTdT UCGAAGUACUCAGCGUAAGUGdTdT- Table S3. Primer sequences used for qt-pcr: Primer Sequence Orientation haxin2 5 -TCA AGT GCA AAC TTT CGC CAA CCG-3 S 5 -TGG TGC AAA GAC ATA GCC AGA ACC-3 h -actin 5 GGACTTCGAGCAAGAGATGG-3 S 5 -AGC ACT GTG TTG GCG TAC AG-3 m -actin 5 -AGC CAT GTA CGT AGC CAT CC-3 S
20 5 -CTC TCA GCT GTG GTG GTG AA-3 hbirc5 5 -CCG CAT CTC TAC ATT CAA GAA CTG GC- S 5 -TTG ACA GAA AGG AAA GCG CAA CCG-3 hbmi1 5 -TGC CTA AAA GCG GGT ACT ACC-3 S 5 TGC AAA GGT CGA ACC AGT TGG GA-3 hc-myc 5 -TCT CCA CAC ATC AGC ACA ACT ACG-3 S 5 -TGT GTT CGC CTC TTG ACA TTC TCC-3 mc-myc 5 -TCC TGA AGC AGA TCA GCA ACA ACC-3 S 5 -TGC TTG AAT GGA CAG GAT GTA GGC-3 hccna1 5 -TGT CTG TTC TGA GAG GGA AAC TGC-3 S 5 -AAG GAG AAA CTG GTT GGT GGT TGG-3 hccna2 5 -CCA ATA CTT TCT GCA TCA GCA GCC-3 S 5 -AAT GAT TCA GGC CAG CTT TGT CCC-3 hccnb1 5 -ATT GTG TGC CCA AGA AGA TGC TGC-3 S 5 -TTA GAT GCT CTC CGA AGG AAG TGC-3 hccnb2 5 -TTT ACA GGT TCA GCC AGT TTC CCG-3 S 5 -TGC TCG CCT TAA GAA GTG TAG TGG-3 hccnd1 5 -AAG TTC ATT TCC AAC CCA CCC TCC-3 S 5 -AGA AGG GCT TCA ATC TGT TCC TGG-3 mccnd1 5 -GAC TGC CGA GAA GTT GTG CAT-3 S 5 -GTT CAC CAG AAG CAG TTC CAT TT-3 hccne1 5 -TTA CCC AAA CTC AAC GTG CAA GCC-3 S 5 -AGA GGG TGT TGC TCA AGA AAG TGC-3 hccne2 5 -TGA GGT CCA TAC TTC TAG ACT GGC-3 S 5 -GAT ATC CTC TTC ACT GCA AGC ACC-3 hctnna1 5 -AGC TTG TTC GAA TGT CTG CAA GCC-3 S 5 -ATC GAC AGC ATC TGT GAG AAC ACG-3 hctnnb1 5 -TTC GAA ATC TTG CCC TTT GTC CCG-3 S 5 -AAT TCG GTT GTG AAC ATC CCG AGC-3 hdkk1 5 -TGT TGT GCT AGA CAC TTC TGG TCC-3 S 5 -TTT CTG TAT CCG GCA AGA CAG ACC-3 mer- 5 -GCCAAGGAGACTCGCTACTG-3 S 5 -CTCCGGTTCTTGTCAATGGT-3 merbb2 5 -GTTGCTCCCCTGGCCTGCAG-3 S 5 -GGCAGTGCCTGCTCTGGGTG-3 hgapdh 5 -AAC AGC GAC ACC CAT CCT C-3 S 5 -CAT ACC AGG AAA TGA GCT TGA mgapdh 5 -GGGAAGCCCATCACCATCTT-3 S 5 -ACATACTCAGCACCGGCCTC-3 hhmga1 5 -GGG GCC GAC CAA AGG GAA GC-3 S 5 -GGC ACG CAT GGG TCA CTG CT-3 mhmga1 5 -GGG GCC GAC CAA AGG GAA GC-3 S 5 -GGG GCC GAC CAA AGG GAA GC-3 hhmga2 5 -GCC CCA GGA AGC AGC AGC AA-3 S
21 5 -TCG AAC GTT GGC GCC CCC TA-3 mhmga2 5 -CCG CTG GAC GTC CGG TGT G-3 S 5 -CGC CCA GCA CCT TTC GGG AG-3 hlrp6 5 -AAA TCG GCA GGC AGT GGT TAA AGG-3 S 5 -CAT GGA TTT GTG GCA TTT GGC TGC-3 5 -ACT GCC AGA TGG ATT GGA AGT GC-3 hps2 5 -TTGTGGTTTTCCTGGTGTCA-3 S 5 -CCGAGCTCTGGGACTAATCA-3 mpr 5 -GGT GGA GGT CGT ACA AGC AT-3 S 5 -CTC ATG GGT CAC CTG GAG TT-3 hwnt1 5 -ACG GCG TTT ATC TTC GCT ATC ACC-3 S 5 -GTT GTG AAG GTT CAT GAG GAA GCG-3 hwnt10b 5 -TGG GAT GTG TAG CCT TCT CC-3 S 5 -CCC AGC CAA AAG GAG TAT GA-3 mwnt10b 5 -ATG CGG ATC CAC AAC AAC AG-3 S 5 -TGA CGT TCC ATG GCA TTT G-3 hxbp1 5 -TTGTGGTTTTCCTGGTGTCA-3 S 5 -CCGAGCTCTGGGACTAATCA-3 Legend: Antisense (), Sense (S), human (h) and mouse (m) Table S4. Primer sequences used for qt-pcr of ChIP samples Primer Sequence Orientation mhmga2 promoter 5 -TCCACCGAGGGTTGCCCGAA-3 S 5 -GGTCGCTCTTTTCCCGGGGC-3 mhmga2-6kb prom 5 -TTCCATCTCCTTACAGATGGTGGC-3 S 5 -GTCTTGCCAGGAGGAATAATGTGC-3 mmyc promoter 5 -TGCCCAGTCAACATAACTGTACGACC-3 S 5 -AGAGCCACTTAGGGATAAACAGCC-3 mgapdh promoter 5 -ACGGCGGTTCATTCATTTCCTTCC-3 S 5 -TGCATACCTTTGCGCATCATCTCC-3 hhmga2 promoter 5 -ACTTGGCAGAAAGAGAGTTCTCAGGC-3 S 5 -TTCTCCAGGAAAGACTAGAGGCAACC-3 hhbb promoter 5 -TGGTATGGGGCCAAGAGATA-3 S 5 -TAGATGGCTCTGCCCTGACT-3 Legend: Antisense (), Sense (S), human (h) and mouse (m)
Supplementary Table 3. 3 UTR primer sequences. Primer sequences used to amplify and clone the 3 UTR of each indicated gene are listed.
 Supplemental Figure 1. DLKI-DIO3 mirna/mrna complementarity. Complementarity between the indicated DLK1-DIO3 cluster mirnas and the UTR of SOX2, SOX9, HIF1A, ZEB1, ZEB2, STAT3 and CDH1with mirsvr and PhastCons
c Tuj1(-) apoptotic live 1 DIV 2 DIV 1 DIV 2 DIV Tuj1(+) Tuj1/GFP/DAPI Tuj1 DAPI GFP
 apoptotic live 1 DIV 2 DIV 1 DIV 2 DIV Tuj1(+) Tuj1/GFP/DAPI Tuj1 DAPI GFP") Supplementary Figure 1 Establishment of the gain- and loss-of-function experiments and cell survival assays. a Relative expression of mature mir-484 30 20 10 0 **** **** NCP mir- 484P NCP mir- 484P b Relative
Supplementary Figure 1 Establishment of the gain- and loss-of-function experiments and cell survival assays. a Relative expression of mature mir-484 30 20 10 0 **** **** NCP mir- 484P NCP mir- 484P b Relative
a) Primary cultures derived from the pancreas of an 11-week-old Pdx1-Cre; K-MADM-p53
 Primary cultures derived from the pancreas of an 11-week-old Pdx1-Cre; K-MADM-p53") 1 2 3 4 5 6 7 8 9 10 Supplementary Figure 1. Induction of p53 LOH by MADM. a) Primary cultures derived from the pancreas of an 11-week-old Pdx1-Cre; K-MADM-p53 mouse revealed increased p53 KO/KO (green,
1 2 3 4 5 6 7 8 9 10 Supplementary Figure 1. Induction of p53 LOH by MADM. a) Primary cultures derived from the pancreas of an 11-week-old Pdx1-Cre; K-MADM-p53 mouse revealed increased p53 KO/KO (green,
Supplemental Data. Shin et al. Plant Cell. (2012) /tpc YFP N
 /tpc YFP N") MYC YFP N PIF5 YFP C N-TIC TIC Supplemental Data. Shin et al. Plant Cell. ()..5/tpc..95 Supplemental Figure. TIC interacts with MYC in the nucleus. Bimolecular fluorescence complementation assay using
MYC YFP N PIF5 YFP C N-TIC TIC Supplemental Data. Shin et al. Plant Cell. ()..5/tpc..95 Supplemental Figure. TIC interacts with MYC in the nucleus. Bimolecular fluorescence complementation assay using
Supplementary Figure 1. ROS induces rapid Sod1 nuclear localization in a dosagedependent manner. WT yeast cells (SZy1051) were treated with 4NQO at
 were treated with 4NQO at") Supplementary Figure 1. ROS induces rapid Sod1 nuclear localization in a dosagedependent manner. WT yeast cells (SZy1051) were treated with 4NQO at different concentrations for 30 min and analyzed for
Supplementary Figure 1. ROS induces rapid Sod1 nuclear localization in a dosagedependent manner. WT yeast cells (SZy1051) were treated with 4NQO at different concentrations for 30 min and analyzed for
Supplementary Appendix
 Supplementary Appendix This appendix has been provided by the authors to give readers additional information about their work. Supplement to: Sherman SI, Wirth LJ, Droz J-P, et al. Motesanib diphosphate
Abbreviations: P- paraffin-embedded section; C, cryosection; Bio-SA, biotin-streptavidin-conjugated fluorescein amplification.
 Supplementary Table 1. Sequence of primers for real time PCR. Gene Forward primer Reverse primer S25 5 -GTG GTC CAC ACT ACT CTC TGA GTT TC-3 5 - GAC TTT CCG GCA TCC TTC TTC-3 Mafa cds 5 -CTT CAG CAA GGA
Supplementary Figure 1 MicroRNA expression in human synovial fibroblasts from different locations. MicroRNA, which were identified by RNAseq as most
 Supplementary Figure 1 MicroRNA expression in human synovial fibroblasts from different locations. MicroRNA, which were identified by RNAseq as most differentially expressed between human synovial fibroblasts
Figure S1. Analysis of genomic and cdna sequences of the targeted regions in WT-KI and
 Figure S1. Analysis of genomic and sequences of the targeted regions in and indicated mutant KI cells, with WT and corresponding mutant sequences underlined. (A) cells; (B) K21E-KI cells; (C) D33A-KI cells;
Nature Structural & Molecular Biology: doi: /nsmb Supplementary Figure 1
 Supplementary Figure 1 U1 inhibition causes a shift of RNA-seq reads from exons to introns. (a) Evidence for the high purity of 4-shU-labeled RNAs used for RNA-seq. HeLa cells transfected with control
Supplementary Figures
 Supplementary Figures Supplementary Figure 1. H3F3B expression in lung cancer. a. Comparison of H3F3B expression in relapsed and non-relapsed lung cancer patients. b. Prognosis of two groups of lung cancer
Supplementary Figure 1 a
 Supplementary Figure a Normalized expression/tbp (A.U.).6... Trip-br transcripts Trans Trans Trans b..5. Trip-br Ctrl LPS Normalized expression/tbp (A.U.) c Trip-br transcripts. adipocytes.... Trans Trans
Supplementary Document
 Supplementary Document 1. Supplementary Table legends 2. Supplementary Figure legends 3. Supplementary Tables 4. Supplementary Figures 5. Supplementary References 1. Supplementary Table legends Suppl.
CD31 5'-AGA GAC GGT CTT GTC GCA GT-3' 5 ' -TAC TGG GCT TCG AGA GCA GT-3'
 Table S1. The primer sets used for real-time RT-PCR analysis. Gene Forward Reverse VEGF PDGFB TGF-β MCP-1 5'-GTT GCA GCA TGA ATC TGA GG-3' 5'-GGA GAC TCT TCG AGG AGC ACT T-3' 5'-GAA TCA GGC ATC GAG AGA
Supplementary Materials
 Supplementary Materials 1 Supplementary Table 1. List of primers used for quantitative PCR analysis. Gene name Gene symbol Accession IDs Sequence range Product Primer sequences size (bp) β-actin Actb gi
Toluidin-Staining of mast cells Ear tissue was fixed with Carnoy (60% ethanol, 30% chloroform, 10% acetic acid) overnight at 4 C, afterwards
 overnight at 4 C, afterwards") Toluidin-Staining of mast cells Ear tissue was fixed with Carnoy (60% ethanol, 30% chloroform, 10% acetic acid) overnight at 4 C, afterwards incubated in 100 % ethanol overnight at 4 C and embedded in
Toluidin-Staining of mast cells Ear tissue was fixed with Carnoy (60% ethanol, 30% chloroform, 10% acetic acid) overnight at 4 C, afterwards incubated in 100 % ethanol overnight at 4 C and embedded in
Table S1. Oligonucleotides used for the in-house RT-PCR assays targeting the M, H7 or N9. Assay (s) Target Name Sequence (5 3 ) Comments
 Target Name Sequence (5 3 ) Comments") SUPPLEMENTAL INFORMATION 2 3 Table S. Oligonucleotides used for the in-house RT-PCR assays targeting the M, H7 or N9 genes. Assay (s) Target Name Sequence (5 3 ) Comments CDC M InfA Forward (NS), CDC M
SUPPLEMENTAL INFORMATION 2 3 Table S. Oligonucleotides used for the in-house RT-PCR assays targeting the M, H7 or N9 genes. Assay (s) Target Name Sequence (5 3 ) Comments CDC M InfA Forward (NS), CDC M
SUPPLEMENTARY INFORMATION
 doi: 10.1038/nature05883 SUPPLEMENTARY INFORMATION Supplemental Figure 1 Prostaglandin agonists and antagonists alter runx1/cmyb expression. a-e, Embryos were exposed to (b) PGE2 and (c) PGI2 (20μM) and
Nature Immunology: doi: /ni.3836
 Supplementary Figure 1 Recombinant LIGHT-VTP induces pericyte contractility and endothelial cell activation. (a) Western blot showing purification steps for full length murine LIGHT-VTP (CGKRK) protein:
Citation for published version (APA): Oosterveer, M. H. (2009). Control of metabolic flux by nutrient sensors Groningen: s.n.
: Oosterveer, M. H. (2009). Control of metabolic flux by nutrient sensors Groningen: s.n.") University of Groningen Control of metabolic flux by nutrient sensors Oosterveer, Maaike IMPORTANT NOTE: You are advised to consult the publisher's version (publisher's PDF) if you wish to cite from it.
University of Groningen Control of metabolic flux by nutrient sensors Oosterveer, Maaike IMPORTANT NOTE: You are advised to consult the publisher's version (publisher's PDF) if you wish to cite from it.
Plasmids Western blot analysis and immunostaining Flow Cytometry Cell surface biotinylation RNA isolation and cdna synthesis
 Plasmids psuper-retro-s100a10 shrna1 was constructed by cloning the dsdna oligo 5 -GAT CCC CGT GGG CTT CCA GAG CTT CTT TCA AGA GAA GAA GCT CTG GAA GCC CAC TTT TTA-3 and 5 -AGC TTA AAA AGT GGG CTT CCA GAG
SUPPLEMENTARY DATA. Supplementary Table 1. Primer sequences for qrt-pcr
 Supplementary Table 1. Primer sequences for qrt-pcr Gene PRDM16 UCP1 PGC1α Dio2 Elovl3 Cidea Cox8b PPARγ AP2 mttfam CyCs Nampt NRF1 16s-rRNA Hexokinase 2, intron 9 β-actin Primer Sequences 5'-CCA CCA GCG
A smart acid nanosystem for ultrasensitive. live cell mrna imaging by the target-triggered intracellular self-assembly
 Electronic Supplementary Material (ESI) for Chemical Science. This journal is The Royal Society of Chemistry 2017 A smart ZnO@polydopamine-nucleic acid nanosystem for ultrasensitive live cell mrna imaging
BHP 2-7 and Nthy-ori 3-1 cells were grown in RPMI1640 medium (Hyclone) supplemented with 10% fetal bovine serum (Gibco), 2mM L-glutamine, and 100 U/mL
 supplemented with 10% fetal bovine serum (Gibco), 2mM L-glutamine, and 100 U/mL") 1 2 3 4 Materials and Methods Cell culture BHP 2-7 and Nthy-ori 3-1 cells were grown in RPMI1640 medium (Hyclone) 5 supplemented with 10% fetal bovine serum (Gibco), 2mM L-glutamine, and 100 U/mL 6 penicillin-streptomycin.
1 2 3 4 Materials and Methods Cell culture BHP 2-7 and Nthy-ori 3-1 cells were grown in RPMI1640 medium (Hyclone) 5 supplemented with 10% fetal bovine serum (Gibco), 2mM L-glutamine, and 100 U/mL 6 penicillin-streptomycin.
BIOLOGY 621 Identification of the Snorks
 Name: Date: Block: BIOLOGY 621 Identification of the Snorks INTRODUCTION: In this simulation activity, you will examine the DNA sequence of a fictitious organism - the Snork. Snorks were discovered on
Supplementary Figure 1a
 Supplementary Figure 1a Hours: E-cadherin TGF-β On TGF-β Off 0 12 24 36 48 24 48 72 Vimentin βactin Fig. S1a. Treatment of AML12 cells with TGF-β induces EMT. Treatment of AML12 cells with TGF-β results
Supplementary Figure 1
 Supplementary Figure 1 3 3 3 1 1 Bregma -1.6mm 3 : Bregma Ref) Http://www.mbl.org/atlas165/atlas165_start.html Bregma -.18mm Supplementary Figure 1 Schematic representation of the utilized brain slice
Supplementary Figure 1
 Supplementary Figure 1 Supplementary Figure 1. Lats1/2 deleted ihbs and ihps showed decreased transcripts of hepatocyte related genes (a and b) Western blots (a) and recombination PCR (b) of control and
Supplementary Materials and Methods
 DD2 suppresses tumorigenicity of ovarian cancer cells by limiting cancer stem cell population Chunhua Han et al. Supplementary Materials and Methods Analysis of publicly available datasets: To analyze
Supplementary Table 2. Conserved regulatory elements in the promoters of CD36.
 Supplementary Table 1. RT-qPCR primers for CD3, PPARg and CEBP. Assay Forward Primer Reverse Primer 1A CAT TTG TGG CCT TGT GCT CTT TGA TGA GTC ACA GAA AGA ATC AAT TC 1B AGG AAA TGA ACT GAT GAG TCA CAG
ice-cold 70% ethanol with gentle vortexing, incubated at -20 C for 4 hours, and washed with PBS.
 Cell cycle analysis For cell cycle analysis, single cell suspensions of E12.5 fetal liver cells were suspended in 4 ml ice-cold 7% ethanol with gentle vortexing, incubated at -2 C for 4 hours, and washed
Cross-talk between mineralocorticoid and angiotensin II signaling for cardiac
 ONLINE SUPPLEMENT TO Crosstalk between mineralocorticoid and angiotensin II signaling for cardiac remodeling An Di ZHANG,,3, Aurelie NGUYEN DINH CAT*,,3, Christelle SOUKASEUM *,,3, Brigitte ESCOUBET, 4,
Supplemental Information. Cancer-Associated Fibroblasts Neutralize. the Anti-tumor Effect of CSF1 Receptor Blockade
 Cancer Cell, Volume 32 Supplemental Information Cancer-Associated Fibroblasts Neutralize the Anti-tumor Effect of CSF1 Receptor Blockade by Inducing PMN-MDSC Infiltration of Tumors Vinit Kumar, Laxminarasimha
Culture Density (OD600) 0.1. Culture Density (OD600) Culture Density (OD600) Culture Density (OD600) Culture Density (OD600)
 0.1. Culture Density (OD600) Culture Density (OD600) Culture Density (OD600) Culture Density (OD600)") A. B. C. D. E. PA JSRI JSRI 2 PA DSAM DSAM 2 DSAM 3 PA LNAP LNAP 2 LNAP 3 PAO Fcor Fcor 2 Fcor 3 PAO Wtho Wtho 2 Wtho 3 Wtho 4 DTSB Low Iron 2 4 6 8 2 4 6 8 2 22 DTSB Low Iron 2 4 6 8 2 4 6 8 2 22 DTSB
A. B. C. D. E. PA JSRI JSRI 2 PA DSAM DSAM 2 DSAM 3 PA LNAP LNAP 2 LNAP 3 PAO Fcor Fcor 2 Fcor 3 PAO Wtho Wtho 2 Wtho 3 Wtho 4 DTSB Low Iron 2 4 6 8 2 4 6 8 2 22 DTSB Low Iron 2 4 6 8 2 4 6 8 2 22 DTSB
Astaxanthin prevents and reverses diet-induced insulin resistance and. steatohepatitis in mice: A comparison with vitamin E
 Supplementary Information Astaxanthin prevents and reverses diet-induced insulin resistance and steatohepatitis in mice: A comparison with vitamin E Yinhua Ni, 1,2 Mayumi Nagashimada, 1 Fen Zhuge, 1 Lili
Phylogenetic analysis of human and chicken importins. Only five of six importins were studied because
 Supplementary Figure S1 Phylogenetic analysis of human and chicken importins. Only five of six importins were studied because importin-α6 was shown to be testis-specific. Human and chicken importin protein
Supplementary Figure 1
 Metastatic melanoma Primary melanoma Healthy human skin Supplementary Figure 1 CD22 IgG4 Supplementary Figure 1: Immunohisochemical analysis of CD22+ (left) and IgG4 (right), cells (shown in red and indicated
Supplemental Information. Th17 Lymphocytes Induce Neuronal. Cell Death in a Human ipsc-based. Model of Parkinson's Disease
 Cell Stem Cell, Volume 23 Supplemental Information Th17 Lymphocytes Induce Neuronal Cell Death in a Human ipsc-based Model of Parkinson's Disease Annika Sommer, Franz Maxreiter, Florian Krach, Tanja Fadler,
Journal of Cell Science Supplementary information. Arl8b +/- Arl8b -/- Inset B. electron density. genotype
 J. Cell Sci. : doi:.4/jcs.59: Supplementary information E9. A Arl8b /- Arl8b -/- Arl8b Arl8b non-specific band Gapdh Tbp E7.5 HE Inset B D Control al am hf C E Arl8b -/- al am hf E8.5 F low middle high
 www.lessonplansinc.com Topic: Protein Synthesis - Sentence Activity Summary: Students will simulate transcription and translation by building a sentence/polypeptide from words/amino acids. Goals & Objectives:
Supplementary Information
 Supplementary Information Remodeling of heterochromatin structure slows neuropathological progression and prolongs survival in an animal model of Huntington s disease Junghee Lee, Yu Jin Hwang, Yunha Kim,
Supplementary Figure 1
 Supplementary Figure 1 Supplementary Figure 1: Cryopreservation alters CD62L expression by CD4 T cells. Freshly isolated (left) or cryopreserved PBMCs (right) were stained with the mix of antibodies described
A basic helix loop helix transcription factor controls cell growth
 A basic helix loop helix transcription factor controls cell growth and size in root hairs Keke Yi 1,2, Benoît Menand 1,3, Elizabeth Bell 1, Liam Dolan 1,4 Supplementary note Low soil phosphate availability
SUPPORTING INFORMATION
 SUPPORTING INFORMATION Biology is different in small volumes: endogenous signals shape phenotype of primary hepatocytes cultured in microfluidic channels Amranul Haque, Pantea Gheibi, Yandong Gao, Elena
Development of RT-qPCR-based molecular diagnostic assays for therapeutic target selection of breast cancer patients
 Development of RT-qPCR-based molecular diagnostic assays for therapeutic target selection of breast cancer patients Sangjung Park The Graduate School Yonsei University Department of Biomedical Laboratory
CIRCRESAHA/2004/098145/R1 - ONLINE 1. Validation by Semi-quantitative Real-Time Reverse Transcription PCR
 CIRCRESAHA/2004/098145/R1 - ONLINE 1 Expanded Materials and Methods Validation by Semi-quantitative Real-Time Reverse Transcription PCR Expression patterns of 13 genes (Online Table 2), selected with respect
Loyer, et al. microrna-21 contributes to NASH Suppl 1/15
 Loyer, et al. microrna-21 contributes to NASH Suppl 1/15 SUPPLEMENTARY MATERIAL: Liver MicroRNA-21 is Overexpressed in Non Alcoholic Steatohepatitis and Contributes to the Disease in Experimental Models
Supplementary Information. Bamboo shoot fiber prevents obesity in mice by. modulating the gut microbiota
 Supplementary Information Bamboo shoot fiber prevents obesity in mice by modulating the gut microbiota Xiufen Li 1,2, Juan Guo 1, Kailong Ji 1,2, and Ping Zhang 1,* 1 Key Laboratory of Tropical Plant Resources
without LOI phenotype by breeding female wild-type C57BL/6J and male H19 +/.
 Sakatani et al. 1 Supporting Online Material Materials and methods Mice and genotyping: H19 mutant mice with C57BL/6J background carrying a deletion in the structural H19 gene (3 kb) and 10 kb of 5 flanking
Supporting Information
 Supporting Information Malapeira et al. 10.1073/pnas.1217022110 SI Materials and Methods Plant Material and Growth Conditions. A. thaliana seedlings were stratified at 4 C in the dark for 3 d on Murashige
*To whom correspondence should be addressed. This PDF file includes:
 www.sciencemag.org/cgi/content/full/science.1212182/dc1 Supporting Online Material for Partial Retraction to Detection of an Infectious Retrovirus, XMRV, in Blood Cells of Patients with Chronic Fatigue
Description of Supplementary Files. File Name: Supplementary Information Description: Supplementary Figures and Supplementary Tables
 Description of Supplementary Files File Name: Supplementary Information Description: Supplementary Figures and Supplementary Tables Supplementary Figure 1: (A), HCT116 IDH1-WT and IDH1-R132H cells were
Formylpeptide receptor2 contributes to colon epithelial homeostasis, inflammation, and tumorigenesis
 Supplementary Data Formylpeptide receptor2 contributes to colon epithelial homeostasis, inflammation, and tumorigenesis Keqiang Chen, Mingyong Liu, Ying Liu, Teizo Yoshimura, Wei Shen, Yingying Le, Scott
Expression of Selected Inflammatory Cytokine Genes in Bladder Biopsies
 Borneo Journal of Resource Science and Technology (2013) 3(2): 15-20 Expression of Selected Inflammatory Cytokine Genes in Bladder Biopsies EDMUND UI-HANG SIM *1, NUR DIANA ANUAR 2, TENG-AIK ONG 3, GUAN-
PATIENTS AND METHODS. Subjects
 PATIENTS AND METHODS Subjects Twenty-nine morbidly obese subjects involved in a gastric surgery program were enrolled in the study between October 25 and March 21. Bariatric surgery was performed in patients
Lezione 10. Sommario. Bioinformatica. Lezione 10: Sintesi proteica Synthesis of proteins Central dogma: DNA makes RNA makes proteins Genetic code
 Lezione 10 Bioinformatica Mauro Ceccanti e Alberto Paoluzzi Lezione 10: Sintesi proteica Synthesis of proteins Dip. Informatica e Automazione Università Roma Tre Dip. Medicina Clinica Università La Sapienza
McAlpine PERK-GSK3 regulates foam cell formation. Supplemental Material. Supplementary Table I. Sequences of real time PCR primers.
 Mclpine PERK-GSK3 regulates foam cell formation Supplemental Material Supplementary Table I. Sequences of real time PCR primers. Primer Name Primer Sequences (5-3 ) Product Size (bp) GRP78 (human) Fwd:
Nucleotide Sequence of the Australian Bluetongue Virus Serotype 1 RNA Segment 10
 J. gen. Virol. (1988), 69, 945-949. Printed in Great Britain 945 Key words: BTV/genome segment lo/nucleotide sequence Nucleotide Sequence of the Australian Bluetongue Virus Serotype 1 RNA Segment 10 By
Supplemental Figures: Supplemental Figure 1
 Supplemental Figures: Supplemental Figure 1 Suppl. Figure 1. BM-DC infection with H. pylori does not induce cytotoxicity and treatment of BM-DCs with H. pylori sonicate, but not heat-inactivated bacteria,
Genome-wide identification of TCF7L2/TCF4 target mirnas reveals a role for mir-21 in Wnt-driven epithelial cancer
 INTERNATIONAL JOURNAL OF ONCOLOGY 40: 519-526, 2012 Genome-wide identification of TCF7L2/TCF4 target mirnas reveals a role for mir-21 in Wnt-driven epithelial cancer FENGMING LAN 1-3*, XIAO YUE 1-3,5*,
SUPPLEMENTARY RESULTS
 SUPPLEMENTARY RESULTS Supplementary Table 1. hfpr1- Flpln-CHO hfpr2-flpln-cho pec 50 E max (%) Log( /K A) Log( /K A) N pec 50 E max (%) Log( /K A) Log( /K A) n ERK1/2 phosphorylation fmlp 9.0±0.6 80±7
SUPPLEMENTAL METHODS Cell culture RNA extraction and analysis Immunohistochemical analysis and laser capture microdissection (LCM)
") SUPPLEMENTAL METHODS Cell culture Human peripheral blood mononuclear cells were isolated from healthy donors by Ficoll density gradient centrifugation. Monocyte differentiation to resting macrophages ()
SUPPLEMENTAL METHODS Cell culture Human peripheral blood mononuclear cells were isolated from healthy donors by Ficoll density gradient centrifugation. Monocyte differentiation to resting macrophages ()
Supplementary information
 Supplementary information Unique polypharmacology nuclear receptor modulator blocks inflammatory signaling pathways Mi Ra Chang 1, Anthony Ciesla 1, Timothy S. Strutzenberg 1, Scott J. Novick 1, Yuanjun
Beta Thalassemia Sami Khuri Department of Computer Science San José State University Spring 2015
 Bioinformatics in Medical Product Development SMPD 287 Three Beta Thalassemia Sami Khuri Department of Computer Science San José State University Hemoglobin Outline Anatomy of a gene Hemoglobinopathies
TetR repressor-based bioreporters for the detection of doxycycline using Escherichia
 Supplementary materials TetR repressor-based bioreporters for the detection of doxycycline using Escherichia coli and Acinetobacter oleivorans Hyerim Hong and Woojun Park * Department of Environmental
University of Groningen. Vasoregression in incipient diabetic retinopathy Pfister, Frederick
 University of Groningen Vasoregression in incipient diabetic retinopathy Pfister, Frederick IMPORTANT NOTE: You are advised to consult the publisher's version (publisher's PDF) if you wish to cite from
Relationship of the APOA5/A4/C3/A1 gene cluster and APOB gene polymorphisms with dyslipidemia
 elationship of the APOA5/A4/C3/A1 gene cluster and APOB gene polymorphisms with dyslipidemia H.J. Ou 1, G. Huang 2, W. Liu 3, X.L. Ma 2, Y. Wei 4, T. Zhou 5 and Z.M. Pan 3 1 Department of Neurology, The
Single-Molecule Analysis of Gene Expression Using Two-Color RNA- Labeling in Live Yeast
 Supplemental Figures, Tables and Results Single-Molecule Analysis of Gene Expression Using Two-Color RNA- Labeling in Live Yeast Sami Hocine 1, Pascal Raymond 2, Daniel Zenklusen 2, Jeffrey A. Chao 1 &
Cancer Genetics 204 (2011) 45e52
 45e52") Cancer Genetics 204 (2011) 45e52 Exon scanning by reverse transcriptaseepolymerase chain reaction for detection of known and novel EML4eALK fusion variants in nonesmall cell lung cancer Heather R. Sanders
Cancer Genetics 204 (2011) 45e52 Exon scanning by reverse transcriptaseepolymerase chain reaction for detection of known and novel EML4eALK fusion variants in nonesmall cell lung cancer Heather R. Sanders
Resistance to Tetracycline Antibiotics by Wangrong Yang, Ian F. Moore, Kalinka P. Koteva, Donald W. Hughes, David C. Bareich and Gerard D. Wright.
 Supplementary Data for TetX is a Flavin-Dependent Monooxygenase Conferring Resistance to Tetracycline Antibiotics by Wangrong Yang, Ian F. Moore, Kalinka P. Koteva, Donald W. Hughes, David C. Bareich and
SUPPLEMENTARY INFORMATION
 BASELINE ISCHAEMIA a b Phd2 +/- c d Collateral growth and maintenance SMC recruitment SMC proliferation Phd2 +/- NF- B off NF- B on NF- B on NF- B on Endothelial cell Smooth muscle cell Pro-arteriogenic
TITLE: Identification of pro-differentiation p53 target genes and evaluation of expression in normal and malignant mammary gland
 AD Award Number: TITLE: Identification of pro-differentiation p53 target genes and evaluation of expression in normal and malignant mammary gland PRINCIPAL INVESTIGATOR: Hua Li CONTRACTING ORGANIZATION:
(a) Significant biological processes (upper panel) and disease biomarkers (lower panel)
 Significant biological processes (upper panel) and disease biomarkers (lower panel)") Supplementary Figure 1. Functional enrichment analyses of secretomic proteins. (a) Significant biological processes (upper panel) and disease biomarkers (lower panel) 2 involved by hrab37-mediated secretory
Supplementary Figure 1. Functional enrichment analyses of secretomic proteins. (a) Significant biological processes (upper panel) and disease biomarkers (lower panel) 2 involved by hrab37-mediated secretory
Beta Thalassemia Case Study Introduction to Bioinformatics
 Beta Thalassemia Case Study Sami Khuri Department of Computer Science San José State University San José, California, USA sami.khuri@sjsu.edu www.cs.sjsu.edu/faculty/khuri Outline v Hemoglobin v Alpha
(A) PCR primers (arrows) designed to distinguish wild type (P1+P2), targeted (P1+P2) and excised (P1+P3)14-
 PCR primers (arrows) designed to distinguish wild type (P1+P2), targeted (P1+P2) and excised (P1+P3)14-") 1 Supplemental Figure Legends Figure S1. Mammary tumors of ErbB2 KI mice with 14-3-3σ ablation have elevated ErbB2 transcript levels and cell proliferation (A) PCR primers (arrows) designed to distinguish
1 Supplemental Figure Legends Figure S1. Mammary tumors of ErbB2 KI mice with 14-3-3σ ablation have elevated ErbB2 transcript levels and cell proliferation (A) PCR primers (arrows) designed to distinguish
Supporting Information. Mutational analysis of a phenazine biosynthetic gene cluster in
 Supporting Information for Mutational analysis of a phenazine biosynthetic gene cluster in Streptomyces anulatus 9663 Orwah Saleh 1, Katrin Flinspach 1, Lucia Westrich 1, Andreas Kulik 2, Bertolt Gust
Baseline clinical characteristics for the 81 CMML patients Routine diagnostic testing and statistical analyses... 3
 Next-Generation Sequencing Technology Reveals a Characteristic Pattern of Molecular Mutations in 72.8% of Chronic Myelomonocytic Leukemia (CMML) by Detecting Frequent Alterations in TET2, CBL, RAS, and
Supplementary Materials for
 www.sciencesignaling.org/cgi/content/full/10/473/eaai7696/dc1 Supplementary Materials for Astrocyte-shed extracellular vesicles regulate the peripheral leukocyte response to inflammatory brain lesions
WNT10B/b-catenin signalling induces HMGA2 and proliferation in metastatic triple-negative breast cancer
 TRANSPARENT PROCESS OPEN ACCESS WNT10B/b-catenin signalling induces HMGA2 and proliferation in metastatic triple-negative breast cancer Peter Wend 1, Stephanie Runke 1, Korinna Wend 2, Brenda Anchondo
The Clinical Performance of Primary HPV Screening, Primary HPV Screening Plus Cytology Cotesting, and Cytology Alone at a Tertiary Care Hospital
 The Clinical Performance of Primary HPV Screening, Primary HPV Screening Plus Cytology Cotesting, and Cytology Alone at a Tertiary Care Hospital Jung-Woo Choi MD, PhD; Younghye Kim MD, PhD; Ju-Han Lee
Isolate Sexual Idiomorph Species
 SUPLEMENTARY TABLE 1. Isolate identification, sexual idiomorph and species of each isolate used for MAT locus distribution in Paracoccidioides species. Isolate Sexual Idiomorph Species Pb01 MAT1-1 P. lutzii
What do you think of when you here the word genome?
 What do you think of when you here the word genome? What do you think of when you here the word genome? Personal Genomics Outline Review of pre-lab work Genomics and Medicine Case Overview & Assignment
Supplementary Figure 1: Neuregulin 1 increases the growth of mammary organoids compared to EGF. (a) Mammary epithelial cells were freshly isolated,
 Mammary epithelial cells were freshly isolated,") 1 2 3 4 5 6 7 8 9 10 Supplementary Figure 1: Neuregulin 1 increases the growth of mammary organoids compared to EGF. (a) Mammary epithelial cells were freshly isolated, embedded in matrigel and exposed
1 2 3 4 5 6 7 8 9 10 Supplementary Figure 1: Neuregulin 1 increases the growth of mammary organoids compared to EGF. (a) Mammary epithelial cells were freshly isolated, embedded in matrigel and exposed
Mechanistic and functional insights into fatty acid activation in Mycobacterium tuberculosis SUPPLEMENTARY INFORMATION
 Mechanistic and functional insights into fatty acid activation in Mycobacterium tuberculosis Pooja Arora 1, Aneesh Goyal 2, Vivek T atarajan 1, Eerappa Rajakumara 2, Priyanka Verma 1, Radhika Gupta 3,
Mutation analysis of a Chinese family with oculocutaneous albinism
 /, 2016, Vol. 7, (No. 51), pp: 84981-84988 Mutation analysis of a Chinese family with oculocutaneous albinism Xiong Wang 1, Yaowu Zhu 1, Na Shen 1, Jing Peng 1, Chunyu Wang 1, Haiyi Liu 2, Yanjun Lu 1
Malignant Amelanotic Melanoma of the Pleura without Primary Skin Lesion: An Autopsy Case Report. a a*
 2009 63 6 379 384 Malignant Amelanotic Melanoma of the Pleura without Primary Skin Lesion: An Autopsy Case Report a b a a a* a b 380 63 6 Chest x ray and computed tomography (CT). A, Chest x ray on admission
Enhanced detection and serotyping of Streptococcus pneumoniae using multiplex polymerase chain reaction
 Original article http://dx.doi.org/10.3345/kjp.2012.55.11.424 Korean J Pediatr 2012;55(11):424-429 eissn 1738-1061 pissn 2092-7258 Enhanced detection and serotyping of Streptococcus pneumoniae using multiplex
HCV Persistence and Immune Evasion in the Absence of Memory T Cell Help.
 SOM Text HCV Persistence and Immune Evasion in the Absence of Memory T Cell Help. Arash Grakoui 1, Naglaa H. Shoukry 2, David J. Woollard 2, Jin-Hwan Han 1, Holly L. Hanson 1, John Ghrayeb 3, Krishna K.
Mutation Screening and Association Studies of the Human UCP 3 Gene in Normoglycemic and NIDDM Morbidly Obese Patients
 Mutation Screening and Association Studies of the Human UCP 3 Gene in Normoglycemic and NIDDM Morbidly Obese Patients Shuichi OTABE, Karine CLEMENT, Séverine DUBOIS, Frederic LEPRETRE, Veronique PELLOUX,
SUPPLEMENTAL FIGURE 1
 SUPPLEMENTL FIGURE 1 C Supplemental Figure 1. pproach for removal of snorns from Rpl13a gene. () Wild type Rpl13a exonintron structure is shown, with exo in black and intronic snorns in red rectangles.
Viral hepatitis, which affects half a billion people
 GASTROENTEROLOGY 2006;130:435 452 BASIC LIVER, PANCREAS, AND BILIARY TRACT Natural Killer Cells Ameliorate Liver Fibrosis by Killing Activated Stellate Cells in NKG2D-Dependent and Tumor Necrosis Factor
Supplementary information
 Supplementary information Full methods The conduct of the study was approved by an NHS research ethical committee prior to commencement (reference 12/WS/0288) and was conducted according to the principles
Ho Young Jung Hye Seung Han Hyo Bin Kim 1 Seo Young Oh 1 Sun-Joo Lee 2 Wook Youn Kim
 Journal of Pathology and Translational Medicine 2016; 50: 138-146 ORIGINAL ARTICLE Comparison of Analytical and Clinical Performance of HPV 9G DNA Chip, PANArray HPV Genotyping Chip, and Hybrid-Capture
INTERLEUKIN-10 FACILITATES BOTH CHOLESTEROL UPTAKE AND EFFLUX IN MACROPHAGES
 SUPPLEMENTAL DATA INTERLEUKIN-10 FACILITATES BOTH CHOLESTEROL UPTAKE AND EFFLUX IN MACROPHAGES Xinbing Han, Shiro Kitamoto, Qingyu Lian and William A. Boisvert Vascular Medicine Research Unit, Brigham
Integration Solutions
 Integration Solutions (1) a) With no active glycosyltransferase of either type, an ii individual would not be able to add any sugars to the O form of the lipopolysaccharide. Thus, the only lipopolysaccharide
A Rapid and Sensitive Chip-based Assay for Detection of rpob Gene Mutations Conferring Rifampicin Resistance in Mycobacterium tuberculosis (TB).
.") A Rapid and Sensitive Chip-based Assay for Detection of rpob Gene Mutations Conferring Rifampicin Resistance in Mycobacterium tuberculosis (TB). Wanyuan Ao, Steve Aldous, Evelyn Woodruff, Brian Hicke,
A Rapid and Sensitive Chip-based Assay for Detection of rpob Gene Mutations Conferring Rifampicin Resistance in Mycobacterium tuberculosis (TB). Wanyuan Ao, Steve Aldous, Evelyn Woodruff, Brian Hicke,
Advanced Subsidiary Unit 1: Lifestyle, Transport, Genes and Health
 Write your name here Surname Other names Edexcel GCE Centre Number Candidate Number Biology Advanced Subsidiary Unit 1: Lifestyle, Transport, Genes and Health Thursday 8 January 2009 Morning Time: 1 hour
Supplementary Figure 1: GPCR profiling and G q signaling in murine brown adipocytes (BA). a, Number of GPCRs with 2-fold lower expression in mature
. a, Number of GPCRs with 2-fold lower expression in mature") Supplementary Figure 1: GPCR profiling and G q signaling in murine brown adipocytes (BA). a, Number of GPCRs with 2-fold lower expression in mature BA vs. preadipocytes. b, Number of GPCRs with 2-fold
Supplementary Figure 1: GPCR profiling and G q signaling in murine brown adipocytes (BA). a, Number of GPCRs with 2-fold lower expression in mature BA vs. preadipocytes. b, Number of GPCRs with 2-fold
Supplementary Figure S1
 Supplementry Figure S Tissue weights (g).... Liver Hert Brin Pncres Len mss (g) 8 6 -% +% 8 6 Len mss Len mss (g) (% ody weight) Len mss (% ody weight) c Tiilis nterior weight (g).6...... Qudriceps weight
SUPPLEMENTARY INFORMATION
 SUPPLEMENTARY INFORMATION doi:10.1038/nature10743 Supplementary Figures and Legends Supplementary Figure 1. CYP17A1 (red boxes) lies at the intersection of steroid hormone biosynthetic pathways. CYP17A1