Ctrl CCT7 CCT2 GAPDH * * ** ** * Ctrl Size of LC3 dots (a.u.) mrfp GFP mrfp-gfp-lc3 CCT5 KD CCT7 KD
|
|
|
- Charles Joseph
- 5 years ago
- Views:
Transcription
 CCT7 CCT7 /GAPH deitometry (a.u.")
 a CCT7 Primary cortical neuro 55 CCT5 55 CCT7 55 CCT7 55 55 55 c 3 25 2 DMSO 2 8")

 CCT depletion efficiency in HeLa cells.")

 CCT depletion efficiency in mouse primary cortical neuro.")
1 CCT7 Size of dots (a.u.) CCT7 CCT7 /GAPH deitometry (a.u.) /GAPH deitometry (a.u.) a CCT7 Primary cortical neuro 55 CCT5 55 CCT7 55 CCT c DMSO 2 8 Bafilomycin A d mrfpgfp Synthesis Fusion Phagophore Autophagosome f mrfp GFP mrfp Autolysosome e CCT5 CCT7 GFP dots mrfp dots mrfpgfp mrfp GFP mrfpgfp Supplementary Fig.. CCT knockdown efficiency. (a) CCT depletion efficiency in HeLa cells. HeLa cells treated with sirnas targeting individual CCT suunits were lotted for various suunits of the complex. Knockdown of one suunit can also impact on the levels of the others. was used as loading control. () CCT depletion efficiency in mouse primary cortical neuro. Primary cortical neuro were traduced with two different shrnas targeting control ( sh# and sh#2) or the mouse suunit ( sh# and sh#2). was used as loading control. (c) II/ deitometry for HeLa cells, related to Fig. a. The graphs show the mean ± SEM of independent iological replicates in the asence (n=6) or presence (n=4) of Bafilomycin A. (P<., P<.5; twotailed ttest).
2 (d) Schematic model for HeLa cells staly expressing mrfpgfp. In this cell line, due to the different pka of the two tags (< 4.5 for mrfp and around 6 for GFP), the autophagosomes emit oth red (mrfp) and green (GFP) fluorescence, while the autolysosomes lose the GFP signal due to its rapid quenching in the acidic lysosomal compartment and are visualized as redonly vesicles y microscopy (Kimura et al., 27; Sarkar et al., 2). (e) Size of GFP dots (autophagosomes/nonacidified lysosomes) and mrfp only dots (autolysosomes). HeLa cells staly expressing mrfpgfp were treated as in Fig. e, then seeded in a 96 well plate and sujected to Cellomics visualization analysis. The graphs show the results for one representative experiment: 2 wells of 2 cells each were analysed per sample. Similar data was seen in other two independent experiments. Bars represent the mea ± SEM (n=2; P<.; twotailed ttest). (f) Representative Cellomics fields for the experiment in (e). Scale ar throughout the panel is µm. 2

 sh# CCT7")


 and LAMP")


3 sh#2 sh# sh#2 LAMP colocalization (Pearson s coefficient) sh# CCT7 LAMP colocalization (Pearson s coefficient) a Basal LAMP merged Nocodazole Basal Nocodazole CCT7 c Lamp merged d sh# sh#2 sh# sh#2 Supplementary Fig. 2. Loss of CCT function does not alter the autophagosomelysosome fusion (a) (antimouse Alexa 488) and LAMP (antirait Alexa 568) colocalization in HeLa cells. Cells depleted for or CCT7 were coimunostained for LAMP and. The cells were then exposed to nocodazole treatment 2 µm, 3 hours. Scale ar throughout the panel is µm. () Quantification of colocalization for the experiment in (a). The Pearson s coefficient was quantified for more than 3 cells per each condition for oth asal and nocodazole treated cells. Bars represent the mean ± SEM (P<., P<.5, not significant; twotailed ttest). Similar results were achieved in at least two independent experiments. (c) (antimouse Alexa 488) and LAMP (antirait Alexa 647) colocalization in mouse primary cortical neuro. The cortical neuro were traduced with two independent shrnas targeting control or the mouse. Scale ar throughout the panel is µm. (d) Pearson s coefficients for the experiment in (c). 235 neuro were coidered per condition. Bars represent the mean ± SEM (P<., not significant; twotailed ttest). The experiment was repeated with similar results. 3


 P62 (antirait")


, were")


")


4 p62cd63 colocalization coefficients, BafA, BafA a CD63 p62 merged CD63 p62 merged , BafA, BafA.3.2. PC M Supplementary Fig. 3. CCT depletion increases the p62 delivery into lysosomes. (a) P62 (antirait Alexa 488) and CD63 (antimouse Alexa 568) colocalization in HeLa cells. Cells depleted for CCT5, in the asence or presence of Bafilomycin A (BafA), were coimunostained for CD63 and p62. Scale ar throughout the panel is µm. () Quantification of colocalization for the experiment in (a). The Pearson s (PC) and Mander s (M represents the p62 localization in the lysosomal compartment) coefficients were quantified for more than 4 cells per each condition. Bars represent the mean ± SEM (P<., P<.5; twotailed ttest). The experiment was repeated with similar results. 4


 GFP")


 Quantification of")
.")

5 a merged CD63 p62 GFP, BafA, BafA Pearson s colocalization coefficients Mander s colocalization coefficients , BafA, BafA p62/cd63 GFP/ 2 p62/ 3 CD63 GFP p62 in CD63 GFP 2 in p62 3 in CD63 GFP Supplementary Fig. 4. CCT depletion increases the p62 delivery into autophagosomes/autolysosomes. (a) P62 (antirait Alexa 594) CD63 (antimouse Alexa 647) GFP colocalization in HeLa cells staly expressing GFP. Cells depleted for CCT5, in the asence or presence of Bafilomycin A (BafA), were coimunostained for CD63 and p62. Scale ar throughout the panel is µm. () Quantification of colocalization for the experiment in (a). The Pearson s and Mander s coefficients were quantified for more than 2 cells per each condition. Bars represent the mean ± SEM (P<., P<.5; twotailed ttest). The experiment was repeated with similar results. 5
 Cathepsin L (CTSL) maturation immunolot in and 7 knockdown HeLa cells.")
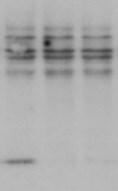
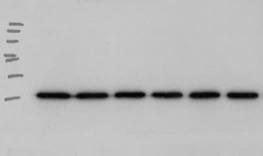
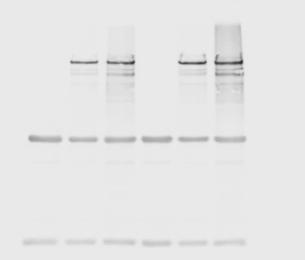
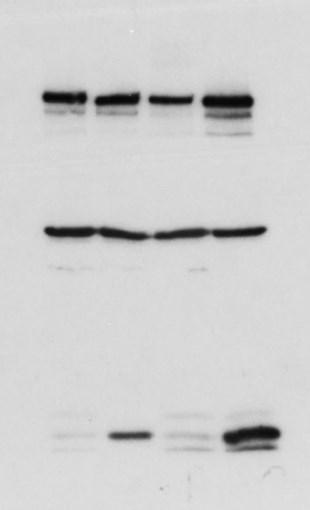
6 Ctsl Ctsl activity (a.u.) CTSL CTSL activity (a.u) a pro. im. m. Bafilomycin A CCT CCT7 c Bafilomycin A d 2 pro. im. m. M.Ctsl/ ratio: M.Ctsl/pro.Ctsl ratio: sh# sh# sh#2 BafA Inhiitor Supplementary Fig. 5. Loss of CCT function reduces cathepsin L maturation. (a) Cathepsin L (CTSL) maturation immunolot in and 7 knockdown HeLa cells. was used as loading control. () In vitro cathepsin L activity. HeLa cells depleted for and 7 were sujected to the cathepsin L activity kit and the fluorescence inteity was expressed as percentage of control. Bars represent the mean ± SD for one representative experiment (n=3; P<.; twotailed ttest). (c) Cathepsin L (Ctsl) maturation immunolot in depleted primary mouse cortical neuro. was used as loading control. (d) In vitro cathepsin L activity in primary cortical neuro exposed to shrna lentiviral treatment as indicated. Bars represent the mean ± SD (n=3; P<., P<., P<.5; twotailed ttest). 6


7 c a LAMP CTSD Calnexin merged CTSD merged CCT7 g sh# sh# sh#2 merged sh#2 Lysoseor TPMT YB CCT7 CTSD Lamp Va sh# f Calnexin.5 e.35 d.6 sh#2 CTSD/LAMP colocalization (Pearson s coeffcient) CTSD/Calnexin colocalization (Pearson s coefficient) CCT7 CCT7 merged BafA sh# sh#2 sh# sh#2 Colocalization coefficients Fluorescence ratio Yellow/Blue (a.u.) BafA sh# sh#2 sh# PC sh#2 M Supplementary Fig. 6. Cathepsin L maturation and lysosomal ph defects in CCT depleted cells. (a) Cathepsin D (CTSD, antimouse Alexa 488) LAMP (antirait Alexa 568) doule immunostaining in or CCT7 knockdown HeLa cells. Scale ar throughout the panel is µm. 7
8 () CTSDLAMP colocalization for the experiment in (a). At least 4 cells were quantified per experiment (each experiment was performed at least twice with similar results). Bars represent the mean ± SEM (P<.; twotailed ttest). (c) Cathepsin D (antimouse Alexa 488) Calnexin (antirait Alexa 568) doule immunostaining in or CCT7 knockdown HeLa cells. Scale ar throughout the panel is µm. (d) CTSDCalnexin colocalization for the experiment in (c). At least 4 cells were quantified per experiment (each experiment was performed at least twice with similar results). Bars represent the mean ± SEM (P<., P<.; twotailed ttest). (e) Enlarged image of cathepsin D (antimouse Alexa 488) calnexin (antirait Alexa 568) doule immunostaining from Fig. 2d. Scale ar throughout the panel is µm. (f) Representative images for the Lysosomal ph assay performed in depleted primary cortical neuro using the Lysoseor YellowBlue. TPMT states for the Bright Field/DIC image. Scale ar throughout the panel is µm. See Fig. 2f. (g) Voa (antirait Alexa555) and Lamp (antirat Alexa647) doule immunostaining in mouse primary cortical neuro. Neuro were plated and treated as in Fig. 2g. At least 3 neuro were counted per condition. PC states for the Pearson s coefficient, while M is the Mander s coefficient, which indicates the Voa localization in the Lamp compartment. Bars represent the mean ± SEM (P<.; twotailed ttest). Scale ar throughout the panel is µm. 8
")
 DMSO Ctsl")

 II/ deitometry (a.u.")
 a CCT7.")


9 Cytochalasin D DMSO CTSD and Calnexin colocalization (PC) Cytochalasin D CTSD and LAMP colocalization (PC) DMSO Ctsl M.Ctsl / Pro. Ctsl deitometry (a.u.) Ctsl/ deitometry (a.u.) II/ deitometry (a.u.) II/ deitometry (a.u.) Actin Actin Tuulin Size of dots (a.u.) a CCT7.6 GFP dots mrfp dots c e g Bafilomycin A Latrunculin A I II Latrunculin A Higher exp. pro. im. m. LAMP CSTD merged d f DMSO DMSO DMSO Latrunculin A Latrunculin A DMSO Latrunculin A Cytochalasin D Bafilomycin A DMSO DMSO Latrunculin A Latrunculin A m. Ctsl/ pro.ctsl/.6 Pearson s coefficient DMSO Cytochalasin D h Calnexin CSTD merged.3 Pearson s coefficient DMSO Cytochalasin D Supplementary Fig. 7. Actin depolymerising drugs locks autophagy. 9
10 Supplementary Fig. 7. Actin depolymerising drugs locks autophagy. (a) Cytoskeleton immunostaining in CCT knockdown cells. Scale ar throughout the panel is µm. () Size of GFP dots (autophagosomes/nonacidified lysosomes) and mrfp only dots (autolysosomes) in mrfpgfp stale HeLa cells independently treated with the actin depolymerising drugs latrunculin A and cytochalasin D for 3 hours at µm concentration each, and sujected to Cellomics visualization analysis. The graphs show the results for one representative experiment: 8 wells of 2 cells each were analysed per sample. The experiment was repeated with similar results. Bars represent the mea ± SEM (n=8; P<., P<.5; twotailed ttest). (c) II levels in mouse primary cortical neuro treated with latrunculin A. Primary cortical neuro (DIV 7) were exposed to Latrunculin A ( µm) for 6 hours in the presence or asence of Bafilomycin A (4 nm, 6 hours). (d) II/ deitometry for the experiment in (c). Bars represent the mean ± SD (n=3; P<.5; twotailed one sample ttest). (e) Cathepsin L (Ctsl) maturation immunolot in primary neuro treated with Latrunculin A ( µm) for 6 hours (pro = procathepsin L, im = intermediate Cathepsin L, m = mature Cathepsin L). (f) Quantification of m.ctsl/pro.ctsl, m.ctsl/ and pro.ctsl/ ratios in primary cortical neuro treated as in (e). For the first two, the statistical analysis was ased on twotailed one sample ttest and for the pro.ctsl/ ratio, onetailed one sample ttest (n=3; P<.5). (g) Cathepsin D (CTSD, antimouse Alexa 488) and LAMP (antirait Alexa 568) doule immunostaining in µm cytochalasin Dtreated cells for 3 hours. The quantification of colocalization is displayed on the right panel. At least 3 cells were counted per experiment (each experiment was performed at least twice). Bars represent the mean ± SEM (P<.; twotailed ttest). Scale ar throughout the panel is µm. (h) Cathepsin D (antimouse Alexa 488) and calnexin (antirait Alexa 568) doule immunostaining in µm cytochalasin D treated cells for 3 hours. The quantification of colocalization is displayed on the right panel. At least 3 cells were counted per experiment (each experiment was performed at least twice). Bars represent the mean ± SEM (P<.; twotailed ttest). Scale ar throughout the panel is µm.

 aggregates normalized to control % EGFPpositive ATG6L cells with")
 a d g 2 5 5 ATG6L ATG6L (lower exp.")

 aggregation through autophagy.")

, while each experiment was performed in triplicates.")

11 % GFPpositive HeLa cells with HTT(Q3)GFP aggregates % GFPpositive HeLa cells with HTT(Q97)GFP aggregates Chymotrypsinlike proteasome activity ATG6L ATG6L % EGFP positive Atg6L / MEFs with EGFPHTT(Q74) aggregates % EGFP positive HeLa cells with EGFPHTT(Q74) aggregates % EGFPpositive cells with EGFPHTT(Q74) aggregates normalized to control % EGFPpositive ATG6L cells with EGFPHTT(Q74) aggregates normalized to control % EGFPpositive ATG6L cells with EGFPHTT(Q74) aggregates (.5 µg DNA) a d g ATG6L ATG6L (lower exp.) ATG6L I II HeLa (ATG6L) EGFPQ74 CCT5 CCT e I II ATG6L WT MEFs CCT5 CCT7 c Atg6L / MEFs DMSO MG32 DMSO MG f h ATG6L 2 DMSO MG32 5 CCT5 CCT7 45 DMSO 4 MG ATG6L ATG6L 5 i ATG6L ATG6L ATG6L ATG6L 2 Supplementary Fig. 8. CCT knockdown monitors the EGFPHTT(Q74) aggregation through autophagy. (a) EGFPHTT(Q74) aggregation in HeLa (ATG6L) cells exposed to sirna targeting different CCT suunits. The ars represent the mean of data from 3 independent experiments (iological replicates) ± SD (n=3; P<., P<.5; one sample ttest), while each experiment was performed in triplicates. () EGFPHTT(Q74) aggregation in (ATG6L) CRISPR/Cas9 HeLa cells exposed to sirna targeting different CCT suunits. The ars represent the mean of data from 3 independent experiments ± SD (n=3; not significant; one sample ttest), while each experiment was performed in triplicates. j (min) CtrL MG32 MG32 µg 2 µg
12 (c) EGFPHTT(Q74) aggregation in (ATG6L) CRISPR/Cas9 HeLa cells exposed to sirna targeting different CCT suunits. The experiment was performed in parallel with the one shown in Fig. 5. The cells were seeded on coverslips in triplicates, trafected with sirnas targeting control or individual CCT suunits and followed y.5 µg of EGFPHTT(Q74). The ars represent the mean of the percentages of cells with aggregates ± SD (n=3; not significant; twotailed ttest). (d) Biochemical assessment of ATG6L HeLa. CRISPR/Cas9 mediated degradation of ATG6L in HeLa cells shows no residual autophagy or ATG6L. was used as loading control. (e) Validation of depletion in WT and Atg6L / MEFs. The MEFs were traduced with lentiviral particles targeting control or the mouse suunit (two independent shrnas). II and levels were assessed y western lot. was used as loading control. (f) ATG6L and ATG6L HeLa cells were seeded on coverslips in triplicates and trafected with µg of EGFPHTT(Q74) and treated with vehicle (DMSO) or MG32 ( µm) for the last 2 hours. The ars represent the mean of the percentages of cells with aggregates ± SD (n=3; P<., P<.5; twotailed t test). Treatment with MG32 further increased the percentage of ATG6L HeLa cells with EGFP HTT(Q74) aggregates. (g) Representative images for DMSO and MG32 treated cells as in (f). Scale ar throughout the panel is µm. The cells with aggregates are indicated with white lines or arrows. (h) Atg6L/ MEFs were seeded on coverslips in triplicates and trafected with µg or 2 µg of EGFP HTT(Q74) and treated with vehicle (DMSO) or MG32 ( µm) for the last 2 hours. Left: The ars represent the mean of the percentages of cells with aggregates ± SD (n=3; P<., P<.5; twotailed t test). Treatment with MG32 increased the percentage of Atg6L/ MEFs with Q74GFP aggregates. (i) N73QGFP (left) and N797QPGFP (right) aggregation in CCTdepleted ATG6L and ATG6L HeLa cells from one representative experiment performed in triplicates. The ars represent the mean of the percentages of cells with aggregates ± SD (n=3; P<.5, not significant; one sample t test). Similar results were achieved in other three independent experiments. (j) Chymotrypsinlike proteasome activity in CCT5 knockdown HeLa cells (n=3; not significant; twotailed ttest). 2
 Atg6L / MEFs WT MEFs a sh# sh# sh#2 EGFPQ74 DAPI")
GFP ATG6L ATG6L 3 d ATG6L MG32 (2 hours) IB:")
 IP: GFPHtt(Q38) 3 3 IP: FlagHtt(Q38) 3")
 3 FlagHtt(Q38) CCT5 3 55 %GFPHtt(Q38)")
 immunoprecipitated relative to total")
 aggregates in CCT knockdown cells (a)")
 aggregates for the experiment presented in")

 and trafected with")

13 Total Lysates Total Lysates Total Lysates ATG6L HeLa (ATG6L) Atg6L / MEFs WT MEFs a sh# sh# sh#2 EGFPQ74 DAPI CCT7 EGFPQ74 EGFPQ74 c Htt(Q38)GFP GFPvector CCT5 sirna IB: Htt(Q38)GFP ATG6L ATG6L 3 d ATG6L MG32 (2 hours) IB: GFPHtt(Q38) IP: FlagHtt(Q38) 3 3 ATG6L MG32 (2 hours) IB: FlagHtt(Q38) IP: GFPHtt(Q38) 3 3 IP: FlagHtt(Q38) 3 GFPHtt(Q38) 3 FlagHtt(Q38) 3 Htt(Q38)GFP 3 FlagHtt(Q38) 3 GFPHtt(Q38) 3 FlagHtt(Q38) CCT %GFPHtt(Q38) immunoprecipitated relative to total lysates. 3.4 %FlagHtt(Q38) immunoprecipitated relative to total lysates Supplementary Fig. 9. EGFPHTT(Q74) aggregates in CCT knockdown cells (a) Representative images of WT and Atg6L / MEFs with EGFPHTT(Q74) aggregates for the experiment presented in Fig. 5c. Cells were seeded on coverslips in triplicates, traduced with lentiviral particles targeting control or the mouse suunit (two independent shrnas) and trafected with EGFPHTT(Q74). Similar data was achieved in other two independent experiments. () Upper: Representative images of HeLa (ATG6L) cells with Q74GFP aggregates treated with sirna targeting various CCT suunits, as indicated in Fig. 5a. 3
14 Bottom: Representative images of (ATG6L) CRISPR/Cas9 HeLa cells with EGFPHTT(Q74) aggregates treated with sirna targeting various CCT suunits, as indicated in Fig. B. The dotted lines indicate the cells with EGFPHTT(Q74) aggregates. Scale ar throughout the panel is µm. (c) Full westernlot for Fig. 6a. (d) Oligomerization of mutant htt in ATG6L HeLa cells exposed to either vehicle (DMSO) or MG32 ( µm) for the last 2 hours (see Methods and Fig. 6ac). Treatment with MG32 enhanced the amount of coimunoprecipitated of mutant HTT(548) tagged to GFP with Flagtagged mutant HTT(588) see left panel, and viceversa see right panel, in the autophagy null cells. 4
 P62/ deitometry (a.u.")
 sh#2.4.2.8.6.4.2 ATG6L sh# sh#.8.6.4.2.8.6.4.2 sh#2 HeLa (ATG6L).2.8.6.4.2 ATG6L Supplementary Fig.")
15 WT MEFs WT MEFs Proportion of EGFP positive cells with EGFPQ74 aggregates (a.u.) P62/ deitometry (a.u.) % GFPpositive HeLa cells with GFPATXN3(Q84) aggregates a 35 3 c Primary cortical neuro BafA p62 64 p62 64 d p62 5 ATG6L ATG6L 2 WT MEFs Atg6L / MEFs WT MEFs 5 5 P62/: Atg6L / MEFs e WT Atg6L / p62 MG32 64 f sh# EGFPA9 DAPI sh# sh#2 sh#2 g sh# sh# HeLa (ATG6L) sh# ATG6L sh# sh# sh#2 HeLa (ATG6L) ATG6L Supplementary Fig.. CCT depletion increases the accumulation of autophagy sustrates (a) GFPATXN3(Q84) aggregation in ATG6L and ATG6L HeLa cells. Cells seeded on coverslips in triplicates, were exposed to either control or CCT5 sirna and trafected with GFPATXN3(Q84). The ars represent the mean of percentages of cells with aggregates ± SD (n=3; P<., not significant; twotailed ttest). Similar results were achieved in other three independent experiments. () P62 levels in HeLa cells traiently trafected with sirna targeting individual CCT suunits. (c) P62 levels in mouse primary cortical neuro. Primary cortical neuro were traduced with lentiviral particles targeting. Two independent shrnas were used per each condition. Bafilomycin A (4nM for 2 hours) was used as a positive control for the accumulation of the autophagy sustrates, p62. P62/ deitometry is shown ellow. (d) P62 levels in WT and Atg6L/ MEFs traduced with shrna lentiviral particles targeting control or the mouse suunit. The ars represent the mean of three independent experiments ± SD (n=3; P<.5, not significant; twotailed one sample ttest). (e) P62 levels in WT and Atg6L / MEFs treated with vehicle (DMSO) or MG32 ( µm) for 4 hours. MG32 increases the p62 levels in oth WT and Atg6L / MEFs. 5
16 (f) Representative images of EGFPA9 aggregates in WT MEFs traduced with shrna lentiviral particles targeting control or the mouse suunit. Similar data was achieved in other two independent experiments. (g) EGFPHTT(Q74) aggregation in ATG6L and ATG6L HeLa cells exposed to either control or CCT5 sirna and treated with the autophagy inducers: caramazepine (5 µm) and TatBeclin peptide (2 µm). HeLa cells were exposed to two round of sirna, trafected with EGFPHTT(Q74) and treated with autophagy inducers for the last hours. The percentage of trafected cells with aggregates was scored and the control data were normalised to to enale compariso. Note that the effects in CCTdepleted cells were oserved in two independent triplicate experiments. Data are shown for representative triplicate experiments with ttests. 6
17 Deitometry (a.u.) Deitometry (a.u.) a IGFR integrin 3.5 EGFR IGFR β integrin EGFR Time (h) EGF CHX EGFR Time post EGF wash (h) 2 Supplementary Fig.. Accumulation of endocytic sustrates upon CCT5 depletion (a) Protein levels of known endocytic route cargos in CCT5 sirna knockdown HeLa cells. significantly increased the levels of IGFR, βintegrin and EGFR. The ars represent the mean of data ± SD (n=3; P<.5; twotailed one sample ttest). () EGFR degradation assay in HeLa cells exposed to either or CCT5 sirna. HeLa cells were serum starved (DMEM with.2% FBS) for 4 hours efore loading with the receptor ligand EGF ( ng/ml for 3 min) in the presence of cyclohexamide (CHX, 4 µg/ml). After, the cells were washed twice with PBS, and further incuated in serumfree media in the presence of cyclohexamide for another or 2 hours. At time the cells were lysed immediately after the PBS wash. The graph represents the quantification of EGFR degradation in HeLa cells exposed to either or CCT5 sirna. For each individual time point we normalized the data to time (EGF/CHX) and used twotailed ttest to assess the protein level differences etween and CCT5 depleted cells. ANOVA two ways was performed to assess the overall significance of EGFR degradation. The ars represent the mean of data ± SD (n=3; P<., P<.; two tailed one sample ttest). reduces the EGFR degradation. See Materials and Methods. 7
 Ref(2)p 3 3 (light exp.")

. The VDRC w 8 line (stock numer 6) was used as ackground control.")
P levels in Atg8a mutant fat odies.")
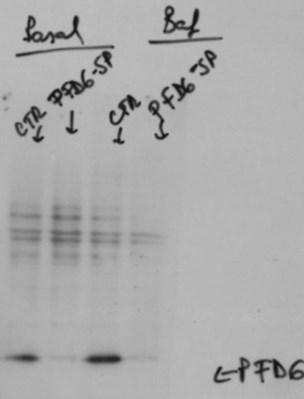
18 a CgGAL4 UASGFPRef(2)P Atg8a KG7569 CgGAL4 UASGFPRef(2)P c w 8 GFPRef(2)P TOPRO3 GFPRef(2)P endog. Ref(2)P 3 GFPRef(2)P endogenous Ref(2)P (light exp.) Ref(2)p 3 3 (light exp.) Ref(2)P 3 Act Atg8aI x Atg8aII Cct Ponceau Red Cct7 KK Act d CgGAL4 UASGFPRef(2)P w 8 Atg8a KG7569 Cct7 KK Atg8a KG7569, Cct7 KK KK Atg8a KG7569, KK NIG Supplementary Fig. 2. CCT depletion locks autophagy in Drosophila. (a) Biochemical assessment of autophagy in the fat ody of CgGAL4 UASGFPRef(2)P third itar larvae upon Cct7 knockdown, either alone (Cct7 KK ) or in an Atg8a mutant ackground (Atg8a KG7569 ). The VDRC w 8 line (stock numer 6) was used as ackground control. Ref(2)P (oth GFPtagged and endogenous forms) accumulated upon Cct7 knockdown (Cct7 KK ) and in Atg8a mutants. Atg8II levels increase in Cct7depleted fat odies. There was no ovious effect of Cct7 knockdown on Ref(2)P levels in Atg8a mutant fat odies. Actin was used as loading control. () Biochemical assessment of endogenous and GFPtagged Ref(2)P upon knockdown in the fat ody of third itar larvae expressing GFPRef(2)P (CgGAL4::UASGFPRef(2)P) and RNAi ( KK or NIG ). The VDRC w 8 (stock numer 6) was used as a ackground control. 8
19 The western lot analysis was performed using a % polyacrylamide gel, to etter separate the GFPtagged from the endogenous Ref2(P). PonceauRed staining validates actin as a loading control in Drosophila fat odies. (c) Representative confocal images showing GFPRef(2)P in the fat ody larval progeny of CgGAL4 UAS GFPRef2(P) crossed to either w 8 or Cct7 KK. GFPRef2(P) positive aggregates accumulates in Cct7 depleted cells. Scale ar throughout the panel is µm. (d) Macroscopic images showing GFPRef2(P) aggregates in CgGAL4::UASGFPRef(2)P and Atg8a KG75569 ;CgGAL4::UAS GFPRef(2)P larvae depleted for Cct7 (Cct7 KK ) or (either KK or NIG ). Scale ar throughout the panel is 2 µm. 9
")

")


20 (Total lysates) (Total lysates) GFP (Total lysates) (IP) GFP (Total lysates) GFP (IP) (IP) GFP (IP) Cytochalasin D Supplementary Fig. 3 Fig. a Fig. a Fig. 2 Fig. 3a Latrunculin A Cathepsin L Fig. 3a Fig. c Primary cortical neuro Fig. a CCT7 Fig. 4e Fig. 4g Fig. 5f Fig. 4a CCT5 PFD6 PFD6 Fig. 5g GFP (IP) Fig. 6a Fig. 6a GFP (Total lysates) Flag (IP) Flag (Total lysates) 2


21 Supplementary Fig. 3 continued Fig. 6 Fig. 6d IP Total lysates Fig. 7d (right) Flag (IP) (IP) (IP) GFP (IP) GFP (Total lysates) Flag (Total lysates) Fig. 7d (left) IP Total lysates GFP (Total lysates) (Total lysates) (Total lysates) Fig. 7e CCT5 GFP Fig. 7d (right) GFP (IP) GFP (Total lysates) P62 () P62 (CCT7 ) () (CCT7 ) CCT7 Drosophila Fig. 8a (Drosophila) Atg8a Ref(2)P (Lighter exp.) Ref(2)P Atg8a 2


22 Cathepsin L Supplementary Fig. a CCT7 CCT7 CCT7 Supplementary Fig. 5c Supplementary Fig. 3 continued Supplementary Fig. a Primary cortical neuro Supplementary Fig. 5a Cathepsin L Cathepsin L CCT7 Supplementary Fig. 8d Supplementary Fig. 7c Supplementary Fig. 7e ATG6L Cathepsin L Cathepsin L ATG6L Supplementary Fig. 8e Supplementary Fig. 9d GFP (IP) ATG6L Flag (IP) ATG6L Flag (Total lysates) ATG6L Flag (IP) ATG6L GFP (IP) ATG6L GFP (Total lysates) ATG6L Flag (Total lysates) ATG6L GFP (Total lysates) ATG6L Supplementary Fig. Supplementary Fig. d Supplementary Fig. c MEFs p62 p62 p62 p62 22
")


23 (Lighter exp.) integrin EGFR Ref(2)P (Ligtherr exp.) Supplementary Fig. 3 continued Supplementary Fig. e Supplementary Fig. a Supplementary Fig. EGFR p62 IGFR Supplementary Fig. 2a (Lighter exp.) EGFR Ref(2)P Cct7 Supplementary Fig. 2 Atg8a Ref(2)P Ref(2)P Atg8a Supplementary Fig. 3. Full sca of uncropped lots. 23
IP: anti-gfp VPS29-GFP. IP: anti-vps26. IP: anti-gfp - + +
 FAM21 Strump. WASH1 IP: anti- 1 2 3 4 5 6 FAM21 Strump. FKBP IP: anti-gfp VPS29- GFP GFP-FAM21 tail H H/P P H H/P P c FAM21 FKBP Strump. VPS29-GFP IP: anti-gfp 1 2 3 FKBP VPS VPS VPS VPS29 1 = VPS29-GFP
Tumor suppressor Spred2 interaction with LC3 promotes autophagosome maturation and induces autophagy-dependent cell death
 www.impactjournals.com/oncotarget/ Oncotarget, Supplementary Materials 2016 Tumor suppressor Spred2 interaction with LC3 promotes autophagosome maturation and induces autophagy-dependent cell death Supplementary
Supplementary Fig. 1 V-ATPase depletion induces unique and robust phenotype in Drosophila fat body cells.
 Supplementary Fig. 1 V-ATPase depletion induces unique and robust phenotype in Drosophila fat body cells. a. Schematic of the V-ATPase proton pump macro-complex structure. The V1 complex is composed of
Supplementary Figure 1.TRIM33 binds β-catenin in the nucleus. a & b, Co-IP of endogenous TRIM33 with β-catenin in HT-29 cells (a) and HEK 293T cells
 and HEK 293T cells") Supplementary Figure 1.TRIM33 binds β-catenin in the nucleus. a & b, Co-IP of endogenous TRIM33 with β-catenin in HT-29 cells (a) and HEK 293T cells (b). TRIM33 was immunoprecipitated, and the amount of
Supplementary Figure 1.TRIM33 binds β-catenin in the nucleus. a & b, Co-IP of endogenous TRIM33 with β-catenin in HT-29 cells (a) and HEK 293T cells (b). TRIM33 was immunoprecipitated, and the amount of
Supplementary information
 Supplementary information 1 Supplementary Figure 1. CALM regulates autophagy. (a). Quantification of LC3 levels in the experiment described in Figure 1A. Data are mean +/- SD (n > 3 experiments for each
Supplemental Materials. STK16 regulates actin dynamics to control Golgi organization and cell cycle
 Supplemental Materials STK16 regulates actin dynamics to control Golgi organization and cell cycle Juanjuan Liu 1,2,3, Xingxing Yang 1,3, Binhua Li 1, Junjun Wang 1,2, Wenchao Wang 1, Jing Liu 1, Qingsong
Supplementary Figure 1. Spatial distribution of LRP5 and β-catenin in intact cardiomyocytes. (a) and (b) Immunofluorescence staining of endogenous
 and (b) Immunofluorescence staining of endogenous") Supplementary Figure 1. Spatial distribution of LRP5 and β-catenin in intact cardiomyocytes. (a) and (b) Immunofluorescence staining of endogenous LRP5 in intact adult mouse ventricular myocytes (AMVMs)
Supplementary Figure 1. Spatial distribution of LRP5 and β-catenin in intact cardiomyocytes. (a) and (b) Immunofluorescence staining of endogenous LRP5 in intact adult mouse ventricular myocytes (AMVMs)
Supplementary Fig. 1. GPRC5A post-transcriptionally down-regulates EGFR expression. (a) Plot of the changes in steady state mrna levels versus
 Plot of the changes in steady state mrna levels versus") Supplementary Fig. 1. GPRC5A post-transcriptionally down-regulates EGFR expression. (a) Plot of the changes in steady state mrna levels versus changes in corresponding proteins between wild type and Gprc5a-/-
Supplementary Fig. 1. GPRC5A post-transcriptionally down-regulates EGFR expression. (a) Plot of the changes in steady state mrna levels versus changes in corresponding proteins between wild type and Gprc5a-/-
Supplementary Figure S1 Supplementary Figure S2
 Supplementary Figure S A) The blots shown in Figure B were qualified by using Gel-Pro analyzer software (Rockville, MD, USA). The ratio of LC3II/LC3I to actin was then calculated. The data are represented
(a) Significant biological processes (upper panel) and disease biomarkers (lower panel)
 Significant biological processes (upper panel) and disease biomarkers (lower panel)") Supplementary Figure 1. Functional enrichment analyses of secretomic proteins. (a) Significant biological processes (upper panel) and disease biomarkers (lower panel) 2 involved by hrab37-mediated secretory
Supplementary Figure 1. Functional enrichment analyses of secretomic proteins. (a) Significant biological processes (upper panel) and disease biomarkers (lower panel) 2 involved by hrab37-mediated secretory
SUPPLEMENTARY INFORMATION
 DOI:.38/ncb2822 a MTC02 FAO cells EEA1 b +/+ MEFs /DAPI -/- MEFs /DAPI -/- MEFs //DAPI c HEK 293 cells WCE N M C P AKT TBC1D7 Lamin A/C EEA1 VDAC d HeLa cells WCE N M C P AKT Lamin A/C EEA1 VDAC Figure
Loss of RhoA promotes skin tumor formation. Supplementary Figure 1. Loss of RhoA does not impair F-actin organization.
 Supplementary Figure Legends Supplementary Figure 1. Loss of RhoA does not impair F-actin organization. a. Representative IF images of F-actin staining of big and small control (left) and RhoA ko tumors
Supplementary information. MARCH8 inhibits HIV-1 infection by reducing virion incorporation of envelope glycoproteins
 Supplementary information inhibits HIV-1 infection by reducing virion incorporation of envelope glycoproteins Takuya Tada, Yanzhao Zhang, Takayoshi Koyama, Minoru Tobiume, Yasuko Tsunetsugu-Yokota, Shoji
SUPPLEMENTARY FIGURES
 SUPPLEMENTARY FIGURES Supplementary Figure 1. (A) Left, western blot analysis of ISGylated proteins in Jurkat T cells treated with 1000U ml -1 IFN for 16h (IFN) or left untreated (CONT); right, western
Supplementary Figure 1. Rab27a-KD inhibits speed and persistence of HEp3 cells migrating in the chick CAM. (a) Western blot analysis of Rab27a
 Western blot analysis of Rab27a") Supplementary Figure 1. Rab27a-KD inhibits speed and persistence of HEp3 cells migrating in the chick CAM. (a) Western blot analysis of Rab27a expression in GFP-expressing HEp3 cells. (b) Representative
Supplementary Figure 1. Rab27a-KD inhibits speed and persistence of HEp3 cells migrating in the chick CAM. (a) Western blot analysis of Rab27a expression in GFP-expressing HEp3 cells. (b) Representative
a Anti-Dab2 RGD Merge
 a Anti-Da Merge *** ** Percentage of cells adhered 8 6 4 RGE RAD RGE RAD Supplementary Figure Da are localized at clusters. (a) Endogenous Da is localized at clusters. (), ut not RGE nor RAD peptides can
SUPPLEMENTARY INFORMATION
 doi:10.1038/nature12652 Supplementary Figure 1. PRDM16 interacts with endogenous EHMT1 in brown adipocytes. Immunoprecipitation of PRDM16 complex by flag antibody (M2) followed by Western blot analysis
* * A3027. A4623 e A3507 A3507 A3507
 a c L A327 d e A37 A37 A37 Supplementary Figure 1. Clinical manifestations of individuals with mutations. (a) Renal ultrasound of right kidney in A327 reveals small renal cysts, loss of corticomedullary
T H E J O U R N A L O F C E L L B I O L O G Y
 T H E J O U R N A L O F C E L L B I O L O G Y Supplemental material Krenn et al., http://www.jcb.org/cgi/content/full/jcb.201110013/dc1 Figure S1. Levels of expressed proteins and demonstration that C-terminal
Supplementary Figure 1. MAT IIα is Acetylated at Lysine 81.
 IP: Flag a Mascot PTM Modified Mass Error Position Gene Names Score Score Sequence m/z [ppm] 81 MAT2A;AMS2;MATA2 35.6 137.28 _AAVDYQK(ac)VVR_ 595.83-2.28 b Pre-immu After-immu Flag- WT K81R WT K81R / Flag
Supplementary Figure 1
 Supplementary Figure 1 AAV-GFP injection in the MEC of the mouse brain C57Bl/6 mice at 4 months of age were injected with AAV-GFP into the MEC and sacrificed at 7 days post injection (dpi). (a) Brains
Supplementary Information
 Supplementary Information Supplementary Figure 1: cholesterol manipulation alters the positioning of autophagosomes in cells, related to figure 1. (a) HeLa cells were treated for 24h under conditions reducing
Supplementary Figure 1. MLN8237 treatments show an unusual camel-back response pattern.
 Supplementary Figure 1. MLN8237 treatments show an unusual camel-ack response pattern. NCI-H1819 cells were treated with serial concentrations of MLN8237 and four days after treatment, cell viaility was
(a) Schematic diagram of the FS mutation of UVRAG in exon 8 containing the highly instable
 Schematic diagram of the FS mutation of UVRAG in exon 8 containing the highly instable") Supplementary Figure 1. Frameshift (FS) mutation in UVRAG. (a) Schematic diagram of the FS mutation of UVRAG in exon 8 containing the highly instable A 10 DNA repeat, generating a premature stop codon
Supplementary Figure 1. Frameshift (FS) mutation in UVRAG. (a) Schematic diagram of the FS mutation of UVRAG in exon 8 containing the highly instable A 10 DNA repeat, generating a premature stop codon
Supplemental information
 Carcinoemryonic antigen-related cell adhesion molecule 6 (CEACAM6) promotes EGF receptor signaling of oral squamous cell carcinoma metastasis via the complex N-glycosylation y Chiang et al. Supplemental
Supplemental Figures:
 Supplemental Figures: Figure 1: Intracellular distribution of VWF by electron microscopy in human endothelial cells. a) Immunogold labeling of LC3 demonstrating an LC3-positive autophagosome (white arrow)
Supplementary Figure 1 Maschalidi et al.
 a 1% 5% % 1% 5% % OVAb βgal activity A.U. (x1 4 ) 2 1 5 βgal activity A.U. (x1 4 ) 2 1 BSAb 2 hours 4 hours OVAb BSAb OVAb BSAb,1 1 1 1 SIINFEKL (ng/ml) CFSE b Beads Alexa488 (%) 8 6 4 2 ** ** 1:1 5:1
Supplementary Information. Cofilin Regulates Nuclear Architecture through a Myosin-II Dependent Mechanotransduction Module
 Supplementary Information Cofilin Regulates Nuclear Architecture through a Myosin-II Dependent Mechanotransduction Module O Neil Wiggan, Bryce Schroder, Diego Krapf, James R. Bamurg and Jennifer G. DeLuca
Boucher et al NCOMMS B
 1 Supplementary Figure 1 (linked to Figure 1). mvegfr1 constitutively internalizes in endothelial cells. (a) Immunoblot of mflt1 from undifferentiated mouse embryonic stem (ES) cells with indicated genotypes;
T H E J O U R N A L O F C E L L B I O L O G Y
 Supplemental material Jewell et al., http://www.jcb.org/cgi/content/full/jcb.201007176/dc1 T H E J O U R N A L O F C E L L B I O L O G Y Figure S1. IR Munc18c association is independent of IRS-1. (A and
Supplementary Figure 1. PD-L1 is glycosylated in cancer cells. (a) Western blot analysis of PD-L1 in breast cancer cells. (b) Western blot analysis
 Western blot analysis of PD-L1 in breast cancer cells. (b) Western blot analysis") Supplementary Figure 1. PD-L1 is glycosylated in cancer cells. (a) Western blot analysis of PD-L1 in breast cancer cells. (b) Western blot analysis of PD-L1 in ovarian cancer cells. (c) Western blot analysis
Supplementary Figure 1. PD-L1 is glycosylated in cancer cells. (a) Western blot analysis of PD-L1 in breast cancer cells. (b) Western blot analysis of PD-L1 in ovarian cancer cells. (c) Western blot analysis
GFP-LC3 +/+ CLU -/- kda CLU GFP. Actin. GFP-LC3 +/+ CLU -/- kda CLU GFP. Actin
 Supplementary Fig. 1 a CQ treatment ScrB OGX11 MG132 I II AZD5363 I II b GFP / / GFP / / GFP / / GFP / / GFP GFP Actin Actin ctrl CQ GFP / / GFP / / GFP / / GFP / / GFP GFP Actin Actin rapamycin rapamycincq
Supplementary information. The Light Intermediate Chain 2 Subpopulation of Dynein Regulates Mitotic. Spindle Orientation
 Supplementary information The Light Intermediate Chain 2 Subpopulation of Dynein Regulates Mitotic Spindle Orientation Running title: Dynein LICs distribute mitotic functions. Sagar Mahale a, d, *, Megha
effects on organ development. a-f, Eye and wing discs with clones of ε j2b10 show no
 Supplementary Figure 1. Loss of function clones of 14-3-3 or 14-3-3 show no significant effects on organ development. a-f, Eye and wing discs with clones of 14-3-3ε j2b10 show no obvious defects in Elav
genome edited transient transfection, CMV promoter
 Supplementary Figure 1. In the absence of new protein translation, overexpressed caveolin-1-gfp is degraded faster than caveolin-1-gfp expressed from the endogenous caveolin 1 locus % loss of total caveolin-1-gfp
Supplementary Figure 1: si-craf but not si-braf sensitizes tumor cells to radiation.
 Supplementary Figure 1: si-craf but not si-braf sensitizes tumor cells to radiation. (a) Embryonic fibroblasts isolated from wildtype (WT), BRAF -/-, or CRAF -/- mice were irradiated (6 Gy) and DNA damage
Supplementary Figure 1. Characterization of NMuMG-ErbB2 and NIC breast cancer cells expressing shrnas targeting LPP. NMuMG-ErbB2 cells (a) and NIC
 and NIC") Supplementary Figure 1. Characterization of NMuMG-ErbB2 and NIC breast cancer cells expressing shrnas targeting LPP. NMuMG-ErbB2 cells (a) and NIC cells (b) were engineered to stably express either a LucA-shRNA
Supplementary Figure 1. Characterization of NMuMG-ErbB2 and NIC breast cancer cells expressing shrnas targeting LPP. NMuMG-ErbB2 cells (a) and NIC cells (b) were engineered to stably express either a LucA-shRNA
Supplementary Materials for
 www.sciencesignaling.org/cgi/content/full/7/308/ra4/dc1 Supplementary Materials for Antipsychotics Activate mtorc1-dependent Translation to Enhance Neuronal Morphological Complexity Heather Bowling, Guoan
Nature Structural & Molecular Biology: doi: /nsmb.3218
 Supplementary Figure 1 Endogenous EGFR trafficking and responses depend on biased ligands. (a) Lysates from HeLa cells stimulated for 2 min. with increasing concentration of ligands were immunoblotted
Nature Structural and Molecular Biology: doi: /nsmb Supplementary Figure 1
 Supplementary Figure 1 Mutational analysis of the SA2-Scc1 interaction in vitro and in human cells. (a) Autoradiograph (top) and Coomassie stained gel (bottom) of 35 S-labeled Myc-SA2 proteins (input)
SUPPLEMENTARY FIGURE LEGENDS
 SUPPLEMENTARY FIGURE LEGENDS Supplemental FIG. 1. Localization of myosin Vb in cultured neurons varies with maturation stage. A and B, localization of myosin Vb in cultured hippocampal neurons. A, in DIV
THE ROLE OF ALTERED CALCIUM AND mtor SIGNALING IN THE PATHOGENESIS OF CYSTINOSIS
 Research Foundation, 18 month progress report THE ROLE OF ALTERED CALCIUM AND mtor SIGNALING IN THE PATHOGENESIS OF CYSTINOSIS Ekaterina Ivanova, doctoral student Elena Levtchenko, MD, PhD, PI Antonella
Supplementary Figure 1
 Supplementary Figure 1 YAP negatively regulates IFN- signaling. (a) Immunoblot analysis of Yap knockdown efficiency with sh-yap (#1 to #4 independent constructs) in Raw264.7 cells. (b) IFN- -Luc and PRDs
Prolonged mitotic arrest induces a caspase-dependent DNA damage
 SUPPLEMENTARY INFORMATION Prolonged mitotic arrest induces a caspase-dependent DNA damage response at telomeres that determines cell survival Karolina O. Hain, Didier J. Colin, Shubhra Rastogi, Lindsey
Supplementary Figure S1 (a) (b)
 (b)") Supplementary Figure S1: IC87114 does not affect basal Ca 2+ level nor nicotineinduced Ca 2+ influx. (a) Bovine chromaffin cells were loaded with Fluo-4AM (1 μm) in buffer A containing 0.02% of pluronic
Supplementary Figure S1: IC87114 does not affect basal Ca 2+ level nor nicotineinduced Ca 2+ influx. (a) Bovine chromaffin cells were loaded with Fluo-4AM (1 μm) in buffer A containing 0.02% of pluronic
Supplementary Materials for
 www.sciencesignaling.org/cgi/content/full/6/283/ra57/dc1 Supplementary Materials for JNK3 Couples the Neuronal Stress Response to Inhibition of Secretory Trafficking Guang Yang,* Xun Zhou, Jingyan Zhu,
Time after injection (hours) ns ns
 ns ns") Platelet life span (% iotinylated platelets) 1 8 6 4 2 4 24 48 72 96 Time after injection (hours) 6 4 2 IgG GPIα GPIβ GPII GPVI Receptor expression (GeoMean, fluorescence inteity) Supplementary figure
Platelet life span (% iotinylated platelets) 1 8 6 4 2 4 24 48 72 96 Time after injection (hours) 6 4 2 IgG GPIα GPIβ GPII GPVI Receptor expression (GeoMean, fluorescence inteity) Supplementary figure
Supplementary Figure 1 Expression of Crb3 in mouse sciatic nerve: biochemical analysis (a) Schematic of Crb3 isoforms, ERLI and CLPI, indicating the
 Schematic of Crb3 isoforms, ERLI and CLPI, indicating the") Supplementary Figure 1 Expression of Crb3 in mouse sciatic nerve: biochemical analysis (a) Schematic of Crb3 isoforms, ERLI and CLPI, indicating the location of the transmembrane (TM), FRM binding (FB)
Supplementary Figure 1 Expression of Crb3 in mouse sciatic nerve: biochemical analysis (a) Schematic of Crb3 isoforms, ERLI and CLPI, indicating the location of the transmembrane (TM), FRM binding (FB)
Supplemental information
 Supplemental information PI(3)K p11δ controls the sucellular compartmentalization of TLR4 signaling and protects from endotoxic shock Ezra Aksoy, Salma Taoui, David Torres, Sandrine Delauve, Aderrahman
SUPPLEMENTARY LEGENDS...
 TABLE OF CONTENTS SUPPLEMENTARY LEGENDS... 2 11 MOVIE S1... 2 FIGURE S1 LEGEND... 3 FIGURE S2 LEGEND... 4 FIGURE S3 LEGEND... 5 FIGURE S4 LEGEND... 6 FIGURE S5 LEGEND... 7 FIGURE S6 LEGEND... 8 FIGURE
SUPPLEMENTARY INFORMATION. Supplementary Figures S1-S9. Supplementary Methods
 SUPPLEMENTARY INFORMATION SUMO1 modification of PTEN regulates tumorigenesis by controlling its association with the plasma membrane Jian Huang 1,2#, Jie Yan 1,2#, Jian Zhang 3#, Shiguo Zhu 1, Yanli Wang
Expanded View Figures
 PEX13 functions in selective autophagy Ming Y Lee et al Expanded View Figures Figure EV1. PEX13 is required for Sindbis virophagy. A, B Quantification of mcherry-capsid puncta per cell (A) and GFP-LC3
SUPPLEMENTARY INFORMATION
 DOI: 10.1038/ncb2566 Figure S1 CDKL5 protein expression pattern and localization in mouse brain. (a) Multiple-tissue western blot from a postnatal day (P) 21 mouse probed with an antibody against CDKL5.
SUPPLEMENTARY INFORMATION
 Supplementary Figures Supplementary Figure S1. Binding of full-length OGT and deletion mutants to PIP strips (Echelon Biosciences). Supplementary Figure S2. Binding of the OGT (919-1036) fragments with
Rapid parallel measurements of macroautophagy and mitophagy in
 Supplemental Figures Rapid parallel measurements of macroautophagy and mitophagy in mammalian cells using a single fluorescent biosensor Sargsyan A, Cai J, Fandino LB, Labasky ME, Forostyan T, Colosimo
SUPPLEMENTARY INFORMATION
 DOI: 1.13/ncb22 a starvation protocol 1, 5 min HBSS aa recovery,5min complete deprivation,5min 1μm colocalisation / colocalisation, % b 12 1 6 2 c complete deprivation,5min aa recovery,5min complete deprivation,5min
Supplementary Figure S1: Defective heterochromatin repair in HGPS progeroid cells
 Supplementary Figure S1: Defective heterochromatin repair in HGPS progeroid cells Immunofluorescence staining of H3K9me3 and 53BP1 in PH and HGADFN003 (HG003) cells at 24 h after γ-irradiation. Scale bar,
supplementary information
 DOI: 10.1038/ncb1875 Figure S1 (a) The 79 surgical specimens from NSCLC patients were analysed by immunohistochemistry with an anti-p53 antibody and control serum (data not shown). The normal bronchi served
Supplementary Figure 1. PAQR3 knockdown inhibits SREBP-2 processing in CHO-7 cells CHO-7 cells were transfected with control sirna or a sirna
 Supplementary Figure 1. PAQR3 knockdown inhibits SREBP-2 processing in CHO-7 cells CHO-7 cells were transfected with control sirna or a sirna targeted for hamster PAQR3. At 24 h after the transfection,
SUPPLEMENTARY INFORMATION
 SUPPLEMENTARY INFORMATION doi:1.138/nature9814 a A SHARPIN FL B SHARPIN ΔNZF C SHARPIN T38L, F39V b His-SHARPIN FL -1xUb -2xUb -4xUb α-his c Linear 4xUb -SHARPIN FL -SHARPIN TF_LV -SHARPINΔNZF -SHARPIN
Supplementary Information
 Supplementary Information Supplementary Figure 1. EBV-gB 23-431 mainly exists as trimer in HEK 293FT cells. (a) Western blotting analysis for DSS crosslinked FLAG-gB 23-431. HEK 293FT cells transfected
SUPPLEMENTARY INFORMATION
 DOI: 10.1038/ncb2988 Supplementary Figure 1 Kif7 L130P encodes a stable protein that does not localize to cilia tips. (a) Immunoblot with KIF7 antibody in cell lysates of wild-type, Kif7 L130P and Kif7
McWilliams et al., http :// /cgi /content /full /jcb /DC1
 Supplemental material JCB McWilliams et al., http ://www.jcb.org /cgi /content /full /jcb.201603039 /DC1 THE JOURNAL OF CELL BIOLOGY Figure S1. In vitro characterization of mito-qc. (A and B) Analysis
hexahistidine tagged GRP78 devoid of the KDEL motif (GRP78-His) on SDS-PAGE. This
 on SDS-PAGE. This") SUPPLEMENTAL FIGURE LEGEND Fig. S1. Generation and characterization of. (A) Coomassie staining of soluble hexahistidine tagged GRP78 devoid of the KDEL motif (GRP78-His) on SDS-PAGE. This protein was expressed
SUPPLEMENTAL FIGURE LEGEND Fig. S1. Generation and characterization of. (A) Coomassie staining of soluble hexahistidine tagged GRP78 devoid of the KDEL motif (GRP78-His) on SDS-PAGE. This protein was expressed
LPS LPS P6 - + Supplementary Fig. 1.
 P6 LPS - - - + + + - LPS + + - - P6 + Supplementary Fig. 1. Pharmacological inhibition of the JAK/STAT blocks LPS-induced HMGB1 nuclear translocation. RAW 267.4 cells were stimulated with LPS in the absence
El Azzouzi et al., http ://www.jcb.org /cgi /content /full /jcb /DC1
 Supplemental material JCB El Azzouzi et al., http ://www.jcb.org /cgi /content /full /jcb.201510043 /DC1 THE JOURNAL OF CELL BIOLOGY Figure S1. Acquisition of -phluorin correlates negatively with podosome
Supplementary Figure 1
 Supplementary Figure 1 a γ-h2ax MDC1 RNF8 FK2 BRCA1 U2OS Cells sgrna-1 ** 60 sgrna 40 20 0 % positive Cells (>5 foci per cell) b ** 80 sgrna sgrna γ-h2ax MDC1 γ-h2ax RNF8 FK2 MDC1 BRCA1 RNF8 FK2 BRCA1
Supplementary Figures
 Supplementary Figures Supplementary Figure 1 Characterization of stable expression of GlucB and sshbira in the CT26 cell line (a) Live cell imaging of stable CT26 cells expressing green fluorescent protein
A. List of selected proteins with high SILAC (H/L) ratios identified in mass
 ratios identified in mass") Supplementary material Figure S1. Interaction between UBL5 and FANCI A. List of selected proteins with high SILAC (H/L) ratios identified in mass spectrometry (MS)-based analysis of UBL5-interacting proteins,
Supplementary material Figure S1. Interaction between UBL5 and FANCI A. List of selected proteins with high SILAC (H/L) ratios identified in mass spectrometry (MS)-based analysis of UBL5-interacting proteins,
Live cell imaging of trafficking of the chaperone complex vaccine to the ER. BMDCs were incubated with ER-Tracker Red (1 M) in staining solution for
 in staining solution for") Live cell imaging of trafficking of the chaperone complex vaccine to the ER. BMDCs were incubated with ER-Tracker Red (1 M) in staining solution for 15 min at 37 C and replaced with fresh complete medium.
Live cell imaging of trafficking of the chaperone complex vaccine to the ER. BMDCs were incubated with ER-Tracker Red (1 M) in staining solution for 15 min at 37 C and replaced with fresh complete medium.
RAW264.7 cells stably expressing control shrna (Con) or GSK3b-specific shrna (sh-
 or GSK3b-specific shrna (sh-") 1 a b Supplementary Figure 1. Effects of GSK3b knockdown on poly I:C-induced cytokine production. RAW264.7 cells stably expressing control shrna (Con) or GSK3b-specific shrna (sh- GSK3b) were stimulated
1 a b Supplementary Figure 1. Effects of GSK3b knockdown on poly I:C-induced cytokine production. RAW264.7 cells stably expressing control shrna (Con) or GSK3b-specific shrna (sh- GSK3b) were stimulated
S1a S1b S1c. S1d. S1f S1g S1h SUPPLEMENTARY FIGURE 1. - si sc Il17rd Il17ra bp. rig/s IL-17RD (ng) -100 IL-17RD
 -100 IL-17RD") SUPPLEMENTARY FIGURE 1 0 20 50 80 100 IL-17RD (ng) S1a S1b S1c IL-17RD β-actin kda S1d - si sc Il17rd Il17ra rig/s15-574 - 458-361 bp S1f S1g S1h S1i S1j Supplementary Figure 1. Knockdown of IL-17RD enhances
SUPPLEMENTARY FIGURE 1 0 20 50 80 100 IL-17RD (ng) S1a S1b S1c IL-17RD β-actin kda S1d - si sc Il17rd Il17ra rig/s15-574 - 458-361 bp S1f S1g S1h S1i S1j Supplementary Figure 1. Knockdown of IL-17RD enhances
Supplemental Information. Autophagy in Oncogenic K-Ras. Promotes Basal Extrusion. of Epithelial Cells by Degrading S1P. Current Biology, Volume 24
 Current Biology, Volume 24 Supplemental Information Autophagy in Oncogenic K-Ras Promotes Basal Extrusion of Epithelial Cells by Degrading S1P Gloria Slattum, Yapeng Gu, Roger Sabbadini, and Jody Rosenblatt
BMDCs were generated in vitro from bone marrow cells cultured in 10 % RPMI supplemented
 Supplemental Materials Figure S1. Cultured BMDCs express CD11c BMDCs were generated in vitro from bone marrow cells cultured in 10 % RPMI supplemented with 15 ng/ml GM-CSF. Media was changed and fresh
Fig. S1. Subcellular localization of overexpressed LPP3wt-GFP in COS-7 and HeLa cells. Cos7 (top) and HeLa (bottom) cells expressing for 24 h human
 and HeLa (bottom) cells expressing for 24 h human") Fig. S1. Subcellular localization of overexpressed LPP3wt-GFP in COS-7 and HeLa cells. Cos7 (top) and HeLa (bottom) cells expressing for 24 h human LPP3wt-GFP, fixed and stained for GM130 (A) or Golgi97
Fig. S1. Subcellular localization of overexpressed LPP3wt-GFP in COS-7 and HeLa cells. Cos7 (top) and HeLa (bottom) cells expressing for 24 h human LPP3wt-GFP, fixed and stained for GM130 (A) or Golgi97
Schwarz et al. Activity-Dependent Ubiquitination of GluA1 Mediates a Distinct AMPAR Endocytosis
 Schwarz et al Activity-Dependent Ubiquitination of GluA1 Mediates a Distinct AMPAR Endocytosis and Sorting Pathway Supplemental Data Supplemental Fie 1: AMPARs undergo activity-mediated ubiquitination
SUPPLEMENTARY FIGURES
 SUPPLEMENTARY FIGURES Supplementary Figure S1: Fibroblast-induced elongation of cancer cells requires direct contact with living fibroblasts. A. Representative images of HT29-GFP cultured in the presence
Cells and reagents. Synaptopodin knockdown (1) and dynamin knockdown (2)
 and dynamin knockdown (2)") Supplemental Methods Cells and reagents. Synaptopodin knockdown (1) and dynamin knockdown (2) podocytes were cultured as described previously. Staurosporine, angiotensin II and actinomycin D were all obtained
Supplemental Methods Cells and reagents. Synaptopodin knockdown (1) and dynamin knockdown (2) podocytes were cultured as described previously. Staurosporine, angiotensin II and actinomycin D were all obtained
Appendix. Table of Contents
 Appendix Table of Contents Appendix Figures Figure S1: Gp78 is not required for the degradation of mcherry-cl1 in Hela Cells. Figure S2: Indel formation in the MARCH6 sgrna targeted HeLa clones. Figure
Supplementary Materials
 Supplementary Materials Supplementary Figure S1 Regulation of Ubl4A stability by its assembly partner A, The translation rate of Ubl4A is not affected in the absence of Bag6. Control, Bag6 and Ubl4A CRISPR
p = formed with HCI-001 p = Relative # of blood vessels that formed with HCI-002 Control Bevacizumab + 17AAG Bevacizumab 17AAG
 A.. Relative # of ECs associated with HCI-001 1.4 1.2 1.0 0.8 0.6 0.4 0.2 0.0 ol b p < 0.001 Relative # of blood vessels that formed with HCI-001 1.4 1.2 1.0 0.8 0.6 0.4 0.2 0.0 l b p = 0.002 Control IHC:
Supplementary Information
 1 Supplementary Information A role for primary cilia in glutamatergic synaptic integration of adult-orn neurons Natsuko Kumamoto 1,4,5, Yan Gu 1,4, Jia Wang 1,4, Stephen Janoschka 1,2, Ken-Ichi Takemaru
Supplements. Figure S1. B Phalloidin Alexa488
 Supplements A, DMSO, PP2, PP3 Crk-myc Figure S1. (A) Src kinase activity is necessary for recruitment of Crk to Nephrin cytoplasmic domain. Human podocytes expressing /7-NephrinCD () were treated with
SUPPLEMENTARY INFORMATION
 DOI: 1.138/ncb222 / b. WB anti- WB anti- ulin Mitotic index (%) 14 1 6 2 T (h) 32 48-1 1 2 3 4 6-1 4 16 22 28 3 33 e. 6 4 2 Time (min) 1-6- 11-1 > 1 % cells Figure S1 depletion leads to mitotic defects
Tumor stage : I II III IV. well differentiated. moderately differentiated. adenocarcinoma. normal colon (adjacent to cancer) Log (T/H) SLAP mrna level
 Log (T/H) SLAP mrna level") moderately differentiated well differentiated Log (T/H) mrna level a Tumor stage : I II III IV.4.4.8 1.2 1.6 2. 2.4 2.8 3.2 N 1 2 3 4 5 6 7 8 9 1 11 12 13 14 15 16 17 # patient b normal colon (adjacent
moderately differentiated well differentiated Log (T/H) mrna level a Tumor stage : I II III IV.4.4.8 1.2 1.6 2. 2.4 2.8 3.2 N 1 2 3 4 5 6 7 8 9 1 11 12 13 14 15 16 17 # patient b normal colon (adjacent
Nature Structural & Molecular Biology: doi: /nsmb Supplementary Figure 1. Differential expression of mirnas from the pri-mir-17-92a locus.
 Supplementary Figure 1 Differential expression of mirnas from the pri-mir-17-92a locus. (a) The mir-17-92a expression unit in the third intron of the host mir-17hg transcript. (b,c) Impact of knockdown
Figure S1. (A) SDS-PAGE separation of GST-fusion proteins purified from E.coli BL21 strain is shown. An equal amount of GST-tag control, LRRK2 LRR
 SDS-PAGE separation of GST-fusion proteins purified from E.coli BL21 strain is shown. An equal amount of GST-tag control, LRRK2 LRR") Figure S1. (A) SDS-PAGE separation of GST-fusion proteins purified from E.coli BL21 strain is shown. An equal amount of GST-tag control, LRRK2 LRR and LRRK2 WD40 GST fusion proteins (5 µg) were loaded
Figure S1. (A) SDS-PAGE separation of GST-fusion proteins purified from E.coli BL21 strain is shown. An equal amount of GST-tag control, LRRK2 LRR and LRRK2 WD40 GST fusion proteins (5 µg) were loaded
Neocortex Zbtb20 / NFIA / Sox9
 Neocortex / NFIA / Sox9 Supplementary Figure 1. Expression of, NFIA, and Sox9 in the mouse neocortex at. The lower panels are higher magnification views of the oxed area. Arrowheads indicate triple-positive
tom tom 24hpf tom tom 48hpf tom 60hpf tom tom 72hpf tom
 a 24hpf c 48hpf d e 60hpf f g 72hpf h i j k ISV ISV Figure 1. Vascular integrity defects and endothelial regression in mutant emryos. (a,c,e,g,i) Bright-field and (,d,f,h,j) corresponding fluorescent micrographs
Interleukin-6 promotes pancreatic cancer cell migration by rapidly activating the small GTPase CDC42
 Interleukin-6 promotes pancreatic cancer cell migration by rapidly activating the small GTPase CDC42 Gina L. Razidlo, Kevin M. Burton, and Mark A. McNiven SUPPORTING INFORMATION Figure S1. IL-6 promotes
Figure S1. Reduction in glomerular mir-146a levels correlate with progression to higher albuminuria in diabetic patients.
 Supplementary Materials Supplementary Figures Figure S1. Reduction in glomerular mir-146a levels correlate with progression to higher albuminuria in diabetic patients. Figure S2. Expression level of podocyte
TFEB-mediated increase in peripheral lysosomes regulates. Store Operated Calcium Entry
 TFEB-mediated increase in peripheral lysosomes regulates Store Operated Calcium Entry Luigi Sbano, Massimo Bonora, Saverio Marchi, Federica Baldassari, Diego L. Medina, Andrea Ballabio, Carlotta Giorgi
SUPPLEMENTARY INFORMATION
 doi: 10.1038/nature05732 SUPPLEMENTARY INFORMATION Supplemental Data Supplement Figure Legends Figure S1. RIG-I 2CARD undergo robust ubiquitination a, (top) At 48 h posttransfection with a GST, GST-RIG-I-2CARD
Nature Medicine: doi: /nm.4322
 1 2 3 4 5 6 7 8 9 10 11 Supplementary Figure 1. Predicted RNA structure of 3 UTR and sequence alignment of deleted nucleotides. (a) Predicted RNA secondary structure of ZIKV 3 UTR. The stem-loop structure
SUPPLEMENTARY INFORMATION
 doi:10.1038/nature11700 Figure 1: RIP3 as a potential Sirt2 interacting protein. Transfected Flag-tagged Sirt2 was immunoprecipitated from cells and eluted from the Sepharose beads using Flag peptide.
WT Xid (h) poly(da:dt) Alum. Poly(dA:dT) 0.05
 poly(da:dt) Alum. Poly(dA:dT) 0.05") IL1 (ng/ml) (1 x 1 3 cells) DMSO LFMA13 R46 IL1 (ng/ml) Control shrna TNFa (ng/ml) Alum Nigericin ATP IL1 (ng/ml) IL1 (ng/ml) IL1 (ng/ml) a c f 3 2 1 1 8 6 4 2 Sup 1 8 6 4 DMSO Alum/DMSO Alum/LFMA13 ***
IL1 (ng/ml) (1 x 1 3 cells) DMSO LFMA13 R46 IL1 (ng/ml) Control shrna TNFa (ng/ml) Alum Nigericin ATP IL1 (ng/ml) IL1 (ng/ml) IL1 (ng/ml) a c f 3 2 1 1 8 6 4 2 Sup 1 8 6 4 DMSO Alum/DMSO Alum/LFMA13 ***
SUPPLEMENTARY INFORMATION
 DOI:.38/ncb3399 a b c d FSP DAPI 5mm mm 5mm 5mm e Correspond to melanoma in-situ Figure a DCT FSP- f MITF mm mm MlanaA melanoma in-situ DCT 5mm FSP- mm mm mm mm mm g melanoma in-situ MITF MlanaA mm mm
Effects of UBL5 knockdown on cell cycle distribution and sister chromatid cohesion
 Supplementary Figure S1. Effects of UBL5 knockdown on cell cycle distribution and sister chromatid cohesion A. Representative examples of flow cytometry profiles of HeLa cells transfected with indicated
Supplementary Figure 1: Characterisation of phospho-fgfr-y463 antibody. (A)
") Supplementary Figure 1: Characterisation of phospho-fgfr-y463 antibody. (A) Cells over-expressing hfgfr1-pcdna3 (+) or pcdna3 (-) were stimulated for 10 minutes with 50ng/ml FGF2 and lysates immunoblotted
Supplementary Figure 1: Characterisation of phospho-fgfr-y463 antibody. (A) Cells over-expressing hfgfr1-pcdna3 (+) or pcdna3 (-) were stimulated for 10 minutes with 50ng/ml FGF2 and lysates immunoblotted
F-actin VWF Vinculin. F-actin. Vinculin VWF
 a F-actin VWF Vinculin b F-actin VWF Vinculin Supplementary Fig. 1. WPBs in HUVECs are located along stress fibers and at focal adhesions. (a) Immunofluorescence images of f-actin (cyan), VWF (yellow),