Supplementary Figure 1
|
|
|
- Ashlie Felicity Pope
- 5 years ago
- Views:
Transcription
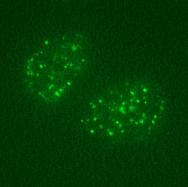
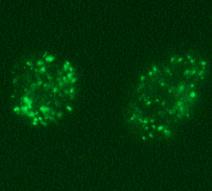
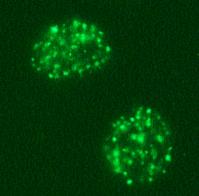
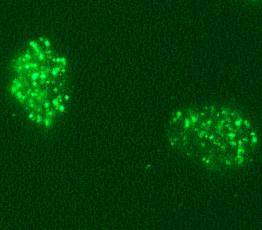
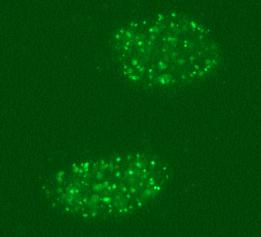
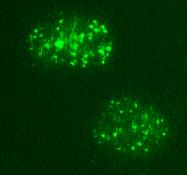

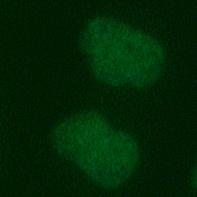
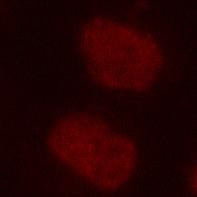

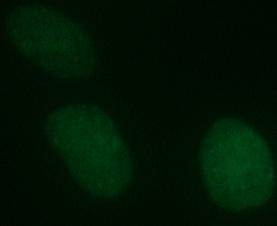
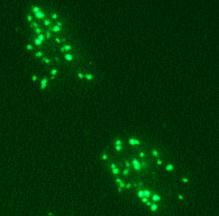
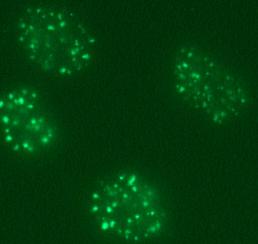
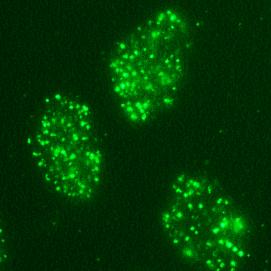
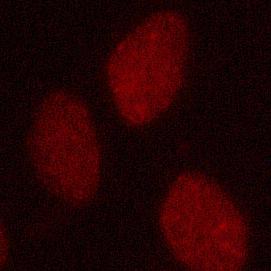
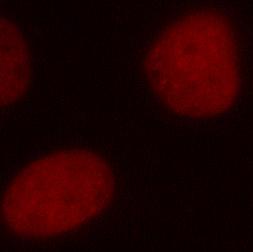
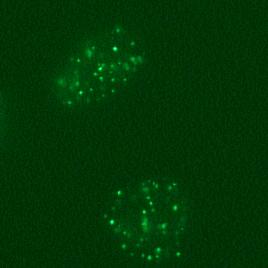
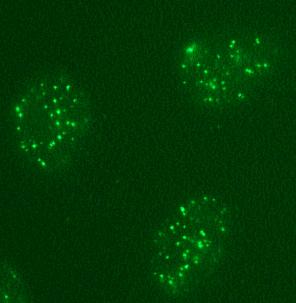
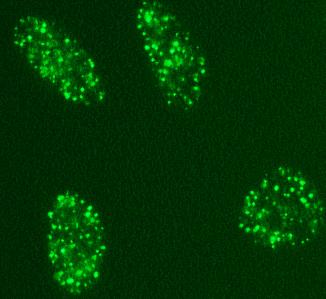
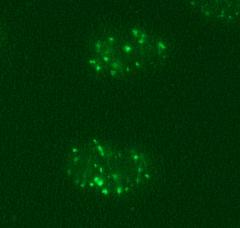
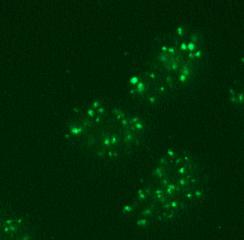
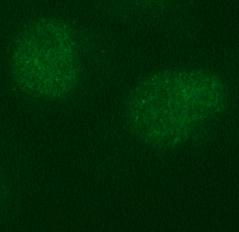
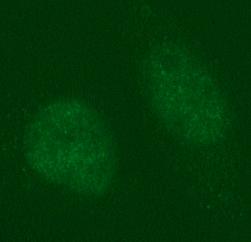
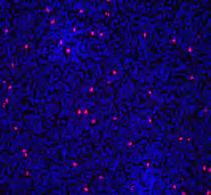
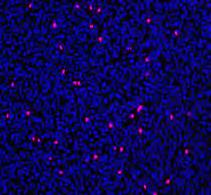
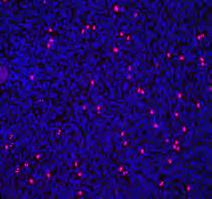
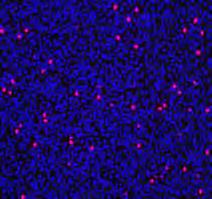
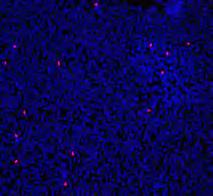
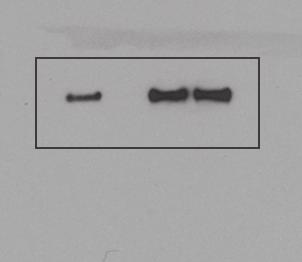
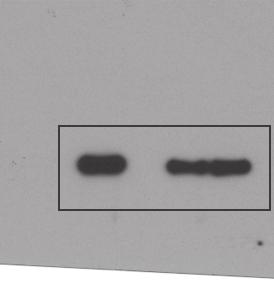
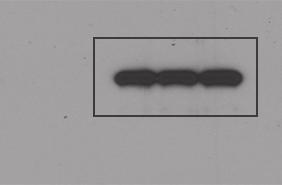
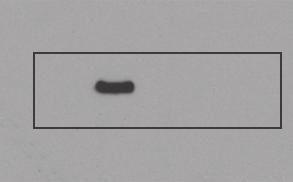
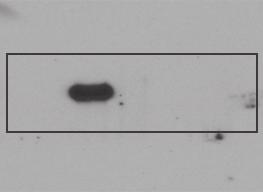
1 Supplementary Figure 1 a γ-h2ax MDC1 RNF8 FK2 BRCA1 U2OS Cells sgrna-1 ** 60 sgrna % positive Cells (>5 foci per cell) b ** 80 sgrna sgrna γ-h2ax MDC1 γ-h2ax RNF8 FK2 MDC1 BRCA1 RNF8 FK2 BRCA1 HeLa Cells sgrna-1 sgrna sgrna ** ** 60 sgrna γ-h2ax MDC1 RNF8 FK2 BRCA1 80 % positive Cells (>5 foci per cell)
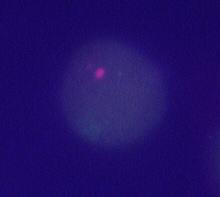
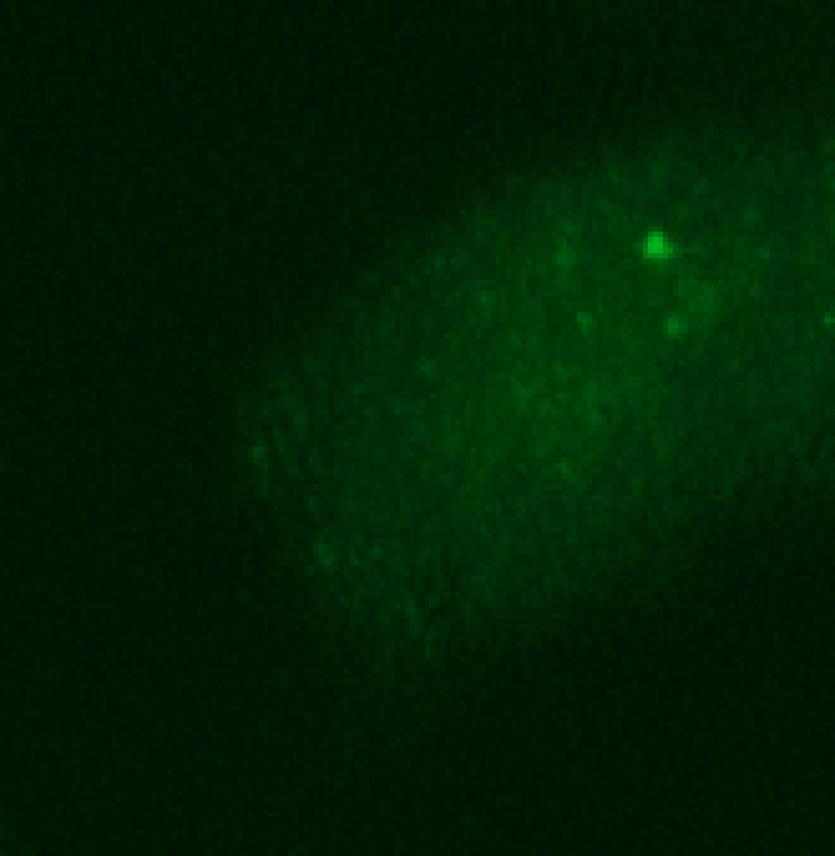
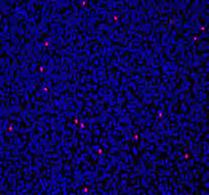
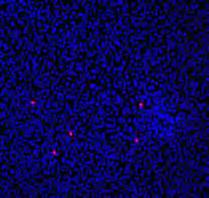
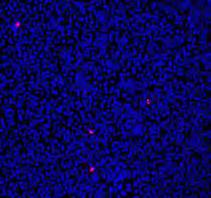
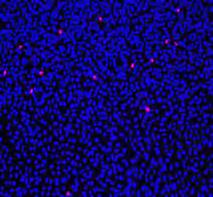
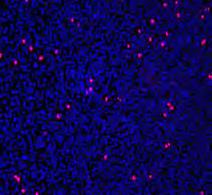
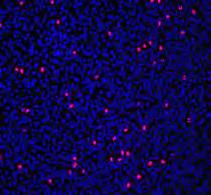
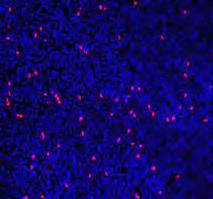
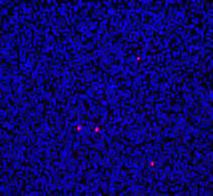
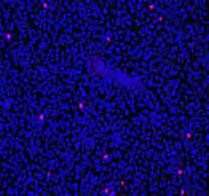
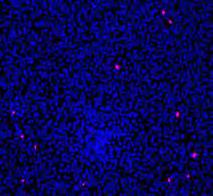
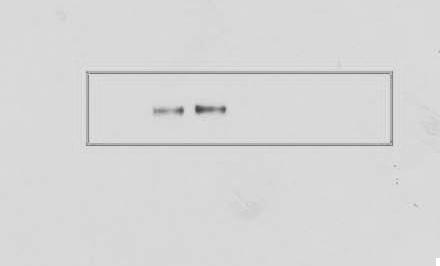
2 Supplementary Figure 1. regulates -BRCA1 foci formation in response to cisplatin. (a-b) Control or knockout U2OS (a) or HeLa (b) cells were treated with cisplatin and foci formation of the indicated factors were detected by immunofluorescence with indicated antibodies. Representative images are shown in the upper panels. Scale bar, 10 μm. Quantification of the percentage of cells displaying foci formation is shown in the lower left panels. expression in these cells were examined by western blot and is shown in the lower right panel. Error bars represent SEM from three independent experiments. **P < >200 cells were counted per experiment. Statistical analyses were performed with the ANOVA.


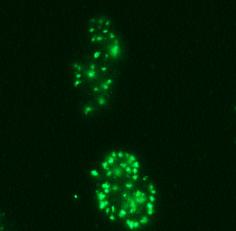
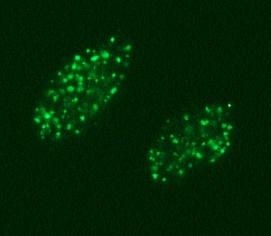
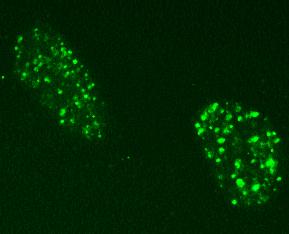
3 Supplementary Figure 2 a γ-h2ax BRCA1 CCDC98 % positive Cells (>5 foci per cell) sgrna sgrna Olaparib c 80 γ-h2ax MDC1 BRCA1 sgrna 20 γ-h2ax b sgrna: sgrna 10uM d sgrna sgrna (hrs) 1uM sgrna H3 I-SceI BRCA1 MERIT 40 Ƴ-H2AX CCDC98 CCDC98 BRCA1 Chromatin BRCA1 10uM ** ** 40 IR: 1uM sgrna 60 0 IR treated (2Gy) sgrna ** Merge
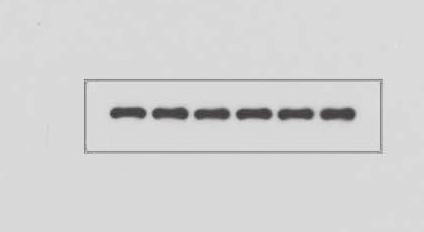
4 Supplementary Figure 2. regulates BRCA1-A complex recruitment to DSBs. (a) Control or knockout EFO-27 cells were treated with IR (2Gy) and foci formation of the indicated factors were detected by immunofluorescence with indicated antibodies. Representative images are shown in the left panels. Quantification of the percentage of cells displaying foci formation is shown in the right panels. Scale bar, 10 μm. Error bars represent SEM from three independent experiments. **P < >200 cells were counted per experiment. Statistical analyses were performed with the ANOVA. (b) Control or knockout EFO-27 cells were treated with IR (2Gy). Whole cell lysates and chromatin fractions were prepared and blotted with the indicated antibodies. (c) Control or knockout EFO-27 cells were treated with olaparib at indicated concentrations for 6 hr. Foci formation of the indicated factors was detected by immunofluorescence with indicated antibodies. Scale bar, 10 μm. (d) Colocalization of BRCA1 with γ-h2ax at DSB site created by I-SceI was examined in control or knockout cells. Scale bar, 10 μm. expression in these cells was examined by western blot and is shown in the panel to the left.
 GFP- GFP- b")

5 Supplementary Figure 3 a (sec) GFP- GFP- b Relative fluorescence intensity GFP- GFP (s)
6 Supplementary Figure 3. Recruitment kinetics of and. (a-b) Cells expressing GFP- or GFP- were subjected to laser microirradiation. Laser stripes were examined at the indicated time points. Scale bar, 10 μm. The intensity of each laser stripe at each time point was determined by averaging values from 10 cells and is graphed in (b).


 anti-ub U2OS")


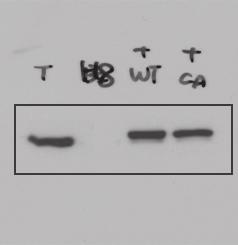
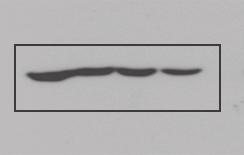
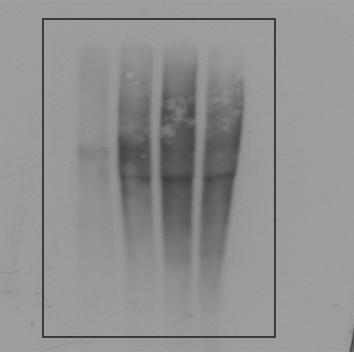
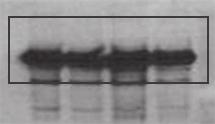
7 Supplementarg Figure 4 a sgrna: HA- - - WT CA b sgrna: HA- - - WT CA d IP: IgG sgrna: anti-ub HeLa c γ-h2ax WT CA sgrna IP: Lysate % positive Cells (>5 foci per cell) anti-ub U2OS 120 sgrna+ WT γ-h2ax sgrna+ CA ** 2 1 IP: Lysate BRCA1 CCDC98 MERIT 40 anti-ub BRCA1 CCDC98 MERIT IP Input
8 Supplementary Figure 4. Deubiquitination of by affects foci formation but not BRCA1-A complex stabilization. (a-b) HeLa (a) or U2OS (b) cells stably expressing control, sgrna, or sgrna with the indicated constructs, were lysed under denaturing conditions and was immunoprecipitated. Blots were probed with the indicated antibodies. (c) EFO-27 cells stably expressing sgrna with the indicated constructs were treated with cisplatin and foci formation of the indicated factors were detected by immunofluorescence with indicated antibodies. Representative images are shown in the left panel. Scale bar, 10 μm. Quantification of the percentage of cells displaying foci formation is shown in the right panel. Error bars represent SEM from three independent experiments. **P < >200 cells were counted per experiment. Statistical analyses were performed with the Student s t-test. (d) Cell lysates from control () or knockout EFO-27 cells were subjected to immunoprecipitation with control IgG or antibodies. The western blots were then blotted with the indicated antibodies.

9 Supplementary Figure 5 a 0Gy 2Gy d 0Gy 2Gy sgrna sgrna sgrna sgrna sgrna + WT sgrna sgrna + CA sgrna + sgrna sgrna: sgrna : b c Surivival Fraction (%) 10 sgrna sgrna sgrna+ WT Surivival Fraction (%) 10 sgrna sgrna sgrna+ WT 1 IR: sgrna+ CA HeLa (Gy) 1 IR: sgrna+ CA U2OS (Gy)
10 Supplementary Figure 5. regulates G2/M checkpoint and radiosensitivity. (a) The representative data for Fig 3a. Scale bar, 0 μm. (b-c) HeLa (b) or U2OS (c) cells stably expressing control, sgrna, or sgrna with the indicated constructs were generated. Sensitivity of these cells to IR was assessed using colony formation assay. Error bars represent SEM from three independent experiments. (d) The representative data for Fig 3d. Scale bar, 0 μm. and expression in these cells were examined by western blot and is shown in the lower panel.
11 Supplementary Figure 6 sgrna sgrna a Homologous Recombination (Normalize to 1) HA- - - WT CA sgrna: HA- - - WT CA sgrna: sgrna+wt sgrna+ca b Homologous Recombination (Normalize to 1) Spautin-1: sgrna: Spautin-1: n.s. sgrna: - sgrna Spautin-1 sgrna+spautin-1
12 Supplementary Figure 6. regulates HR. (a) HR-mediated DSB repair capacity of control, knockout, and knockout cells stably expressing the indicated constructs were assessed using a reporter system. (b) HR-mediated DSB repair capacity of control and knockout cells treated with or without Spautin-1 was assessed using a reporter system. Error bars represent SEM from three independent experiments. *P < Statistical analyses were performed with the ANOVA.
 WT 5KR-1")
 5KR-3")
 3KR (K75/90/112R) d")


13 Supplementary Figure 7 a sgrna: Olaparib: anti-ub b HA (um) WT 5KR-1 (K20/31/75/90/112R) 2 1 5KR-2 (K5146/232/245/374/382R) 5KR-3 (K544/567/587/607/635R) IP: Lysate c HA- sgrna: anti-ub HA WT 2KR (K20/31R) 3KR (K75/90/112R) d HA- WT 2 1 K75R IP:FLAG Lysate K90R e GST--WT GST--3KR His-K48 Ub chain His-K63 Ub chain K112R anti-his 3KR (K75/90/112R) GST GST His-pulldown Input sgrna: sgrna: anti-ub 2 1 IP:FLAG anti-ub 2 1 IP:FLAG HA Lysate HA Lysate
14 Supplementary Figure 7. Identification of the deubiquitination sites targeted by. (a) Control and knockout cells treated with olaparib at different concentrations were lysed under denaturing conditions and was immunoprecipitated. Blots were probed with the indicated antibodies. (b-d) Control and knockout cells were transfected with indicated constructs. Cells were lysed under denaturing conditions and HA- was immunoprecipitated. Blots were probed with the indicated antibodies. (e) GST- WT and 3KR mutant proteins were subjected to pull down assay by incubating with indicated His-Ub chains conjugated with Ni-NTA beads. After washing, proteins bound on beads were subjected to western blot with indicated antibodies.
 80 60 40 20 0")


 1.2 1 0.8 0.6 0.")


15 Supplementary Figure 8 cisplatin p-sq/tq e a % positive Cells (>5 foci per cell) HeLa Ku55933 phosphatase IP: b cisplatin p-sq/tq U2OS Ku55933 phosphatase sgrna sgrna sgrna+ WT sgrna+ T196A 0 γ-h2ax CCDC98 HA- - - WT T196A BRCA1 sgrna: IP: c HA- cisplatin p-t196 HA f Homologous Recombination (Normalize to 1) WT T196A sgrna: d HA- - - WT TA cisplatin IP:HA anti-ub 2 1 IP: Lysate sgrna: HA- - - WT T196A g sgrna sgrna sgrna+wt sgrna+t196a MDC1 shrna h i MDC1 Ƴ-H2AX I-SceI Merge 2 Surivival Fraction (%) 10 1 Olaparib: sgrna sgrna sgrna+wt sgrna+ T196A (um) shrna MDC1 shrna
16 Supplementary Figure 8. Phosphorylation of regulates DDR. (a-b) HeLa (a) or U2OS (b) cells were pretreated with DMSO or 25μM Ku55933 for 2 hrs following which they were left untreated or treated with cisplatin. After an additional 1 hr, was immunoprecipitated, left untreated or treated with phosphatase, and immunoblotted with phospho-sq/tq (psq/tq) antibody. (c) HEK293T cells transfected with HA- WT or T196A mutant were left untreated or treated with cisplatin. HA- was immunoprecipitated and immunoblotted with T196 phospho-specific antibody. (d) Control and knockout cells were transfected with the indicated constructs. Cells were lysed under denaturing conditions and was immunoprecipitated. Blots were probed with the indicated antibodies. (e) EFO- 27 cells stably expressing, sgrna or sgrna with the indicated constructs were treated with cisplatin and foci formation of the indicated factors were detected by immunofluorescence with the indicated antibodies. Error bars represent SEM from three independent experiments. >200 cells were counted per experiment. (f-g) Control, knockout, and knockout cells stably expressing the indicated constructs were subjected to DR-GFP based HR assay. Error bars represent SEM from three independent experiments. **P < 0.01, *P<0.05. Statistical analyses were performed with the ANOVA. expression is shown in the right panel. The representative FACS data is shown in (g). (h) Control, knockout, and knockout cells stably expressing the indicated constructs were subjected to colony formation assay to assess the sensitivity of cells to olaparib. Error bars represent SEM from three independent experiments. (i) Co-localization of with γ-h2ax at DSB site created by I-SceI was examined in control or MDC1 knockdown cells. Scale bar, 5 μm. MDC1 expression in these cells was examined by western blot and is shown in the right upper panel.

17 Supplementary Figure 9 a log2 copy number units log2 copy number units CCDC98 log2 copy number units BRCA1 Normal (561 cases) Ovarian carcinoma (607 cases) Normal (561 cases) Ovarian carcinoma (607 cases) Normal (561 cases) Ovarian carcinoma (607 cases) log2 copy number units MERIT40 log2 copy number units BRCC45 b Normal (561 cases) Ovarian carcinoma (607 cases) Normal (561 cases) Ovarian carcinoma (607 cases)
18 Supplementary Figure 9. The expression of in ovarian cancer. (a) The expression of BRCA1-A complex in normal and ovarian carcinoma (Oncomine data). (b) Gene copy-number and mutation data of and BRCA1-A complex in ovarian cancer (TCGA data).

19 Supplementary Figure 10 a HOSE EFO-27 SKOV-3 FU-OV-1 OVCAR-3 A2780 b HOSE EFO-27 SKOV-3 FU-OV-1 OVCAR-3 A PTEN anti-ub 1 c Survival Fraction (%) 10 shrna USP10 shrna shrna shrna+spautin-1 USP10 shrna+spautin-1 shrna+spautin-1 1 Olaparib: (um) d Absorbance (590nm) (Normalize day 1 to 1) ctrl sgrna sgrna-1 sgrna (Days) e Cell Number sgrna sgrna-1 sgrna-2 G1:43.9 S: G2/M: 8.91 G1:44.12 S: G2/M: 9.69 G1:42.9 S: G2/M: Channels (PI-A)
20 Supplementary Figure 10. regulates chemoresistance in ovarian cancer. (a) The human ovarian epithelial cell line (HOSE) and ovarian carcinoma cell lines were lysed under denaturing conditions and was immunoprecipitated. Blots were probed with the indicated antibodies. (b) Expression of PTEN in human ovarian epithelial cell line and ovarian carcinoma cell lines. (c) Control, knockdown, and USP10 knockdown cells were subjected to colony formation assay to assess the sensitivity of cells to olaparib or olaparib with spautin-1. (d) Growth curves of EFO-27 cells stably expressed ctrl or sgrnas were measured by MTS assay. (c-d) Error bars represent SEM from three independent experiments. (e) Cell cycle profile of EFO-27 cell stably expressed ctrl or sgrnas.


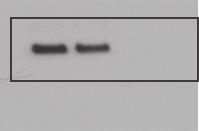
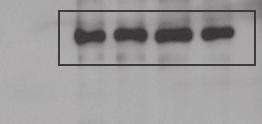

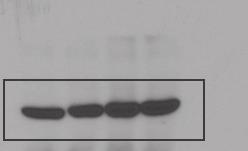
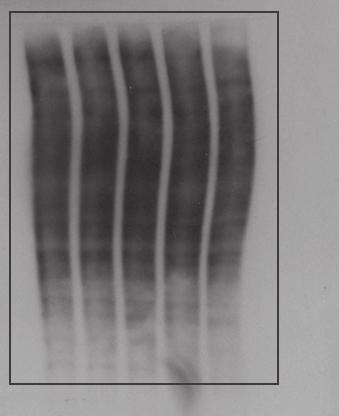
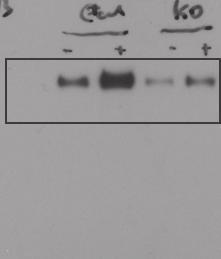
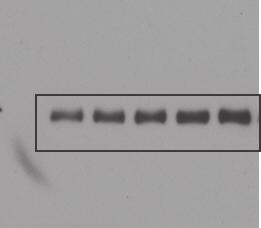
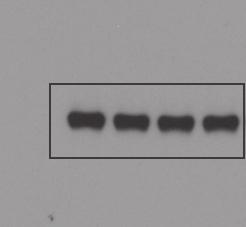
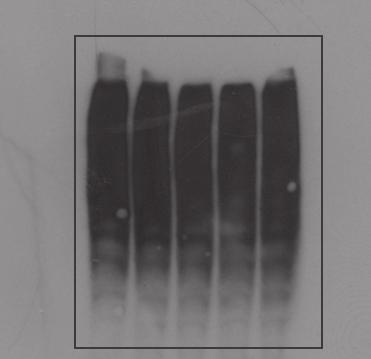
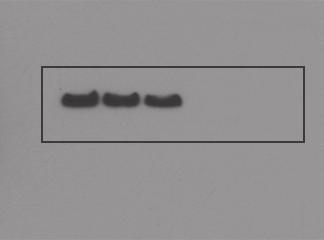
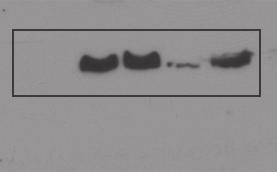
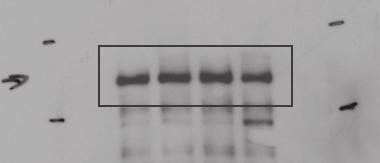
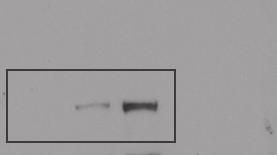
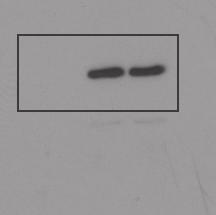
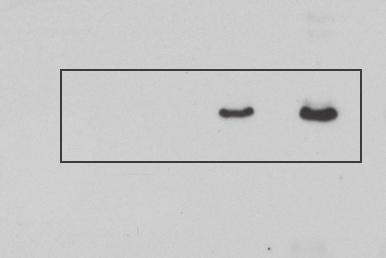
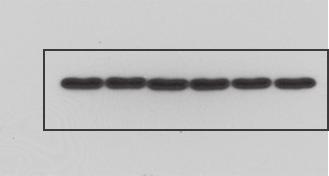
21 Supplementary Figure 11 Fig 1b sgrna -1-2 Fig 2a IP IgG Input IgG Fig 2b Fig 2c sgrna: IP: IgG IgG sgrna: HA- - - WT CA IP: Ub blot Fig 2d sgrna: Spautin-1: Fig 2e IP: - WT CA HA- Ub blot His-Ub blot GST- Fig 2f His-Ub: - K48 K63 K63R 13sgRNA: IP: His-Ub blot His-Ub Input
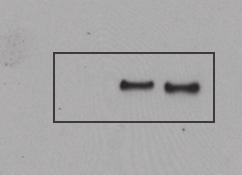
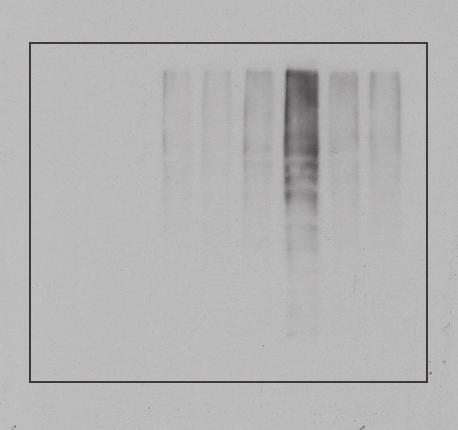
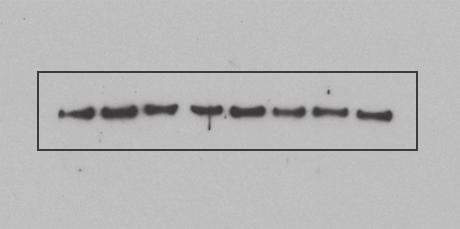
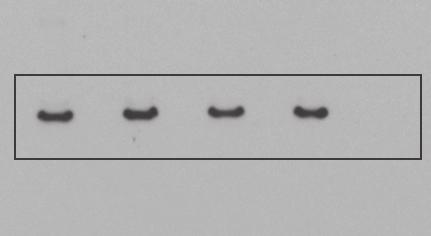
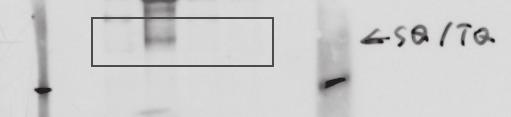
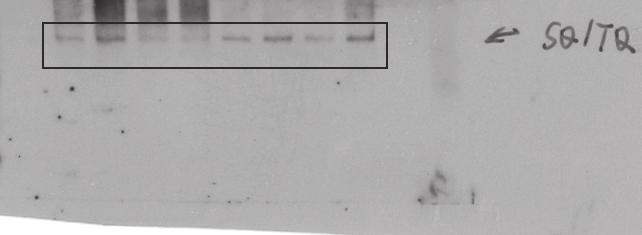
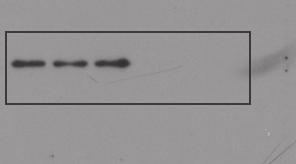
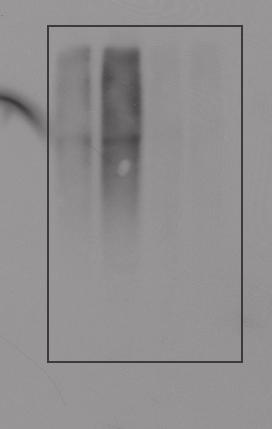
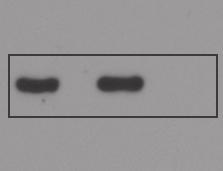
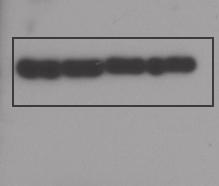
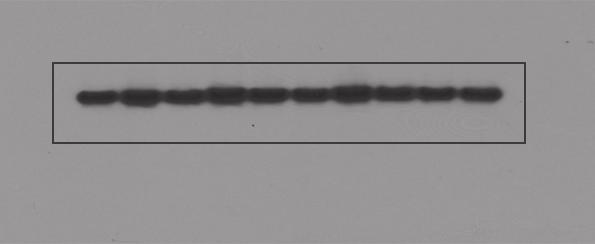
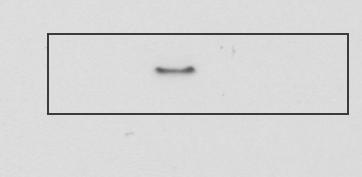
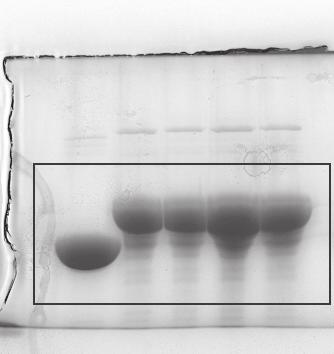
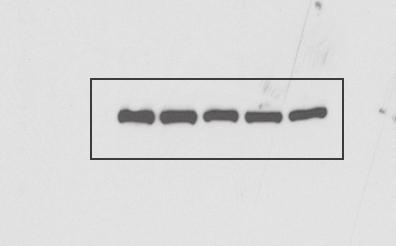
22 Supplementary Figure 11. Original scan of the blots presented in the main text. Related to Figure 1 and 2.

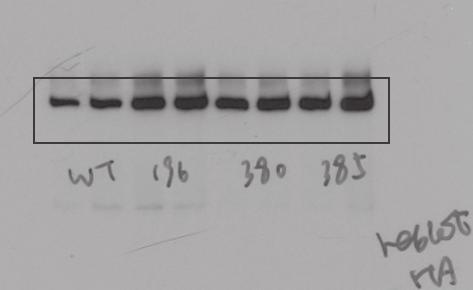
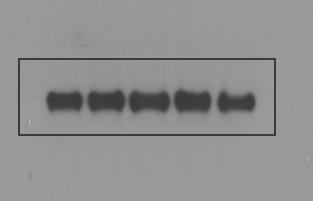
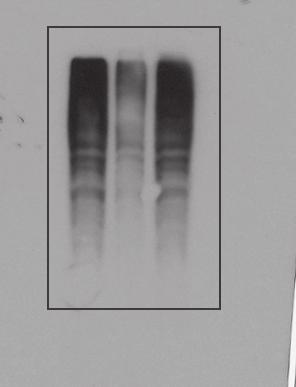
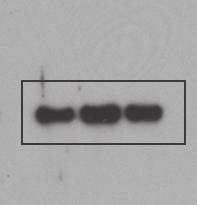
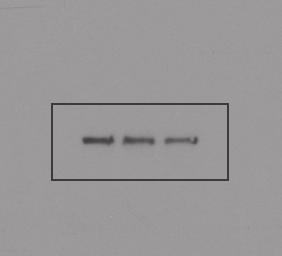
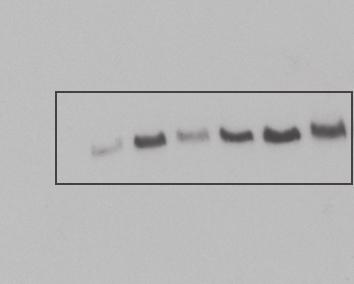
23 Supplementary Figure 12 Fig 4a sgrna: Cisplatin: IP: Fig 4b sgrna: Ub chain K48 K63 Cisplatin: Ub Blot His-Ub pulldown Input Fig 4d HA- WT 3KR Fig 4f sgrna: sgrna: Ub chain K48 K63 HA-: WT WT 3KR WT 3KR IP:HA- HA- Input His-Ub pulldown Ub Blot HA- Fig 5a cisplatin Ku55933 phosphatase Fig 5b HA- WT T196A T380A T385A cisplatin p-sq/tq p-sq/tq IP: IP:HA-
24 Supplementary Figure 12. Original scan of the blots presented in the main text. Related to Figure 4 and 5.
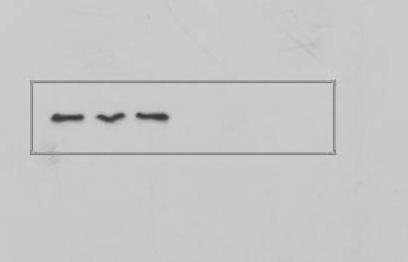

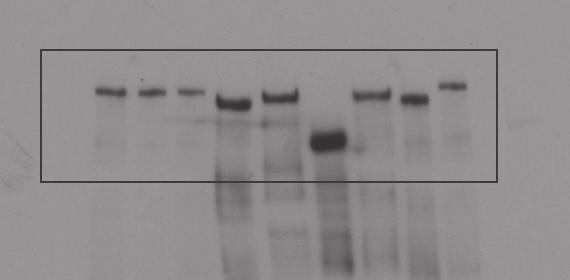

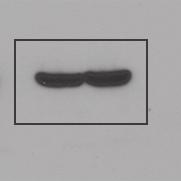
25 Supplementary Figure 13 Fig 5c ATM+/+ ATM-/- - IR Cisplatin - IR Cisplatin Fig 5d WT T196A HA Fig 5f cisplatin: HA-MDC Input ATM IP:HA-MDC1 p-sq/tq Fig 5h HA-: WT T196A Cisplatin: HA- HA- Input IP: Fig 5g MDC1-FHA GST GST-pulldown Fig 5i Conjugated Peptides Fig 6f T196 p-t196 Input HA-MDC1: - WT D1 D2 D3 D4 D5 D6 D7 D8 GST HA- IP:HA-MDC1 Fig 6b Incubated with GST-MDC1 -FHA HOSE EFO-27 SKOV-3 FU-OV-1 OVCAR-3 A2780 Input
26 Supplementary Figure 13. Original scan of the blots presented in the main text. Related to Figure 5 and 6.
SUPPLEMENTAL FIGURE LEGENDS
 SUPPLEMENTAL FIGURE LEGENDS Supplemental Figure S1: Endogenous interaction between RNF2 and H2AX: Whole cell extracts from 293T were subjected to immunoprecipitation with anti-rnf2 or anti-γ-h2ax antibodies
File Name: Supplementary Information Description: Supplementary Figures and Supplementary Tables. File Name: Peer Review File Description:
 File Name: Supplementary Information Description: Supplementary Figures and Supplementary Tables File Name: Peer Review File Description: Primer Name Sequence (5'-3') AT ( C) RT-PCR USP21 F 5'-TTCCCATGGCTCCTTCCACATGAT-3'
Supplementary Figure 1: si-craf but not si-braf sensitizes tumor cells to radiation.
 Supplementary Figure 1: si-craf but not si-braf sensitizes tumor cells to radiation. (a) Embryonic fibroblasts isolated from wildtype (WT), BRAF -/-, or CRAF -/- mice were irradiated (6 Gy) and DNA damage
A. List of selected proteins with high SILAC (H/L) ratios identified in mass
 ratios identified in mass") Supplementary material Figure S1. Interaction between UBL5 and FANCI A. List of selected proteins with high SILAC (H/L) ratios identified in mass spectrometry (MS)-based analysis of UBL5-interacting proteins,
Supplementary material Figure S1. Interaction between UBL5 and FANCI A. List of selected proteins with high SILAC (H/L) ratios identified in mass spectrometry (MS)-based analysis of UBL5-interacting proteins,
SUPPLEMENTARY INFORMATION
 DOI:.38/ncb2822 a MTC02 FAO cells EEA1 b +/+ MEFs /DAPI -/- MEFs /DAPI -/- MEFs //DAPI c HEK 293 cells WCE N M C P AKT TBC1D7 Lamin A/C EEA1 VDAC d HeLa cells WCE N M C P AKT Lamin A/C EEA1 VDAC Figure
Prolonged mitotic arrest induces a caspase-dependent DNA damage
 SUPPLEMENTARY INFORMATION Prolonged mitotic arrest induces a caspase-dependent DNA damage response at telomeres that determines cell survival Karolina O. Hain, Didier J. Colin, Shubhra Rastogi, Lindsey
RAW264.7 cells stably expressing control shrna (Con) or GSK3b-specific shrna (sh-
 or GSK3b-specific shrna (sh-") 1 a b Supplementary Figure 1. Effects of GSK3b knockdown on poly I:C-induced cytokine production. RAW264.7 cells stably expressing control shrna (Con) or GSK3b-specific shrna (sh- GSK3b) were stimulated
1 a b Supplementary Figure 1. Effects of GSK3b knockdown on poly I:C-induced cytokine production. RAW264.7 cells stably expressing control shrna (Con) or GSK3b-specific shrna (sh- GSK3b) were stimulated
SUPPLEMENTARY INFORMATION
 SUPPLEMENTARY INFORMATION doi:1.138/nature9814 a A SHARPIN FL B SHARPIN ΔNZF C SHARPIN T38L, F39V b His-SHARPIN FL -1xUb -2xUb -4xUb α-his c Linear 4xUb -SHARPIN FL -SHARPIN TF_LV -SHARPINΔNZF -SHARPIN
(A) SW480, DLD1, RKO and HCT116 cells were treated with DMSO or XAV939 (5 µm)
 SW480, DLD1, RKO and HCT116 cells were treated with DMSO or XAV939 (5 µm)") Supplementary Figure Legends Figure S1. Tankyrase inhibition suppresses cell proliferation in an axin/β-catenin independent manner. (A) SW480, DLD1, RKO and HCT116 cells were treated with DMSO or XAV939
Supplementary Figure Legends Figure S1. Tankyrase inhibition suppresses cell proliferation in an axin/β-catenin independent manner. (A) SW480, DLD1, RKO and HCT116 cells were treated with DMSO or XAV939
(a) Schematic diagram of the FS mutation of UVRAG in exon 8 containing the highly instable
 Schematic diagram of the FS mutation of UVRAG in exon 8 containing the highly instable") Supplementary Figure 1. Frameshift (FS) mutation in UVRAG. (a) Schematic diagram of the FS mutation of UVRAG in exon 8 containing the highly instable A 10 DNA repeat, generating a premature stop codon
Supplementary Figure 1. Frameshift (FS) mutation in UVRAG. (a) Schematic diagram of the FS mutation of UVRAG in exon 8 containing the highly instable A 10 DNA repeat, generating a premature stop codon
Nature Structural and Molecular Biology: doi: /nsmb Supplementary Figure 1
 Supplementary Figure 1 Mutational analysis of the SA2-Scc1 interaction in vitro and in human cells. (a) Autoradiograph (top) and Coomassie stained gel (bottom) of 35 S-labeled Myc-SA2 proteins (input)
Schwarz et al. Activity-Dependent Ubiquitination of GluA1 Mediates a Distinct AMPAR Endocytosis
 Schwarz et al Activity-Dependent Ubiquitination of GluA1 Mediates a Distinct AMPAR Endocytosis and Sorting Pathway Supplemental Data Supplemental Fie 1: AMPARs undergo activity-mediated ubiquitination
Supplementary Figure 1. MAT IIα is Acetylated at Lysine 81.
 IP: Flag a Mascot PTM Modified Mass Error Position Gene Names Score Score Sequence m/z [ppm] 81 MAT2A;AMS2;MATA2 35.6 137.28 _AAVDYQK(ac)VVR_ 595.83-2.28 b Pre-immu After-immu Flag- WT K81R WT K81R / Flag
Supplemental Figure 1. Western blot analysis indicated that MIF was detected in the fractions of
 Supplemental Figure Legends Supplemental Figure 1. Western blot analysis indicated that was detected in the fractions of plasma membrane and cytosol but not in nuclear fraction isolated from Pkd1 null
SUPPLEMENTARY INFORMATION
 DOI: 10.1038/ncb3076 Supplementary Figure 1 btrcp targets Cep68 for degradation during mitosis. a) Cep68 immunofluorescence in interphase and metaphase. U-2OS cells were transfected with control sirna
293T cells were transfected with indicated expression vectors and the whole-cell extracts were subjected
 SUPPLEMENTARY INFORMATION Supplementary Figure 1. Formation of a complex between Slo1 and CRL4A CRBN E3 ligase. (a) HEK 293T cells were transfected with indicated expression vectors and the whole-cell
William C. Comb, Jessica E. Hutti, Patricia Cogswell, Lewis C. Cantley, and Albert S. Baldwin
 Molecular Cell, Volume 45 Supplemental Information p85 SH2 Domain Phosphorylation by IKK Promotes Feedback Inhibition of PI3K and Akt in Response to Cellular Starvation William C. Comb, Jessica E. Hutti,
Predictive PP1Ca binding region in BIG3 : 1,228 1,232aa (-KAVSF-) HEK293T cells *** *** *** KPL-3C cells - E E2 treatment time (h)
 HEK293T cells *** *** *** KPL-3C cells - E E2 treatment time (h)") Relative expression ERE-luciferase activity activity (pmole/min) activity (pmole/min) activity (pmole/min) activity (pmole/min) MCF-7 KPL-3C ZR--1 BT-474 T47D HCC15 KPL-1 HBC4 activity (pmole/min) a d
Relative expression ERE-luciferase activity activity (pmole/min) activity (pmole/min) activity (pmole/min) activity (pmole/min) MCF-7 KPL-3C ZR--1 BT-474 T47D HCC15 KPL-1 HBC4 activity (pmole/min) a d
Supplementary Fig. 1: ATM is phosphorylated in HER2 breast cancer cell lines. (A) ATM is phosphorylated in SKBR3 cells depending on ATM and HER2
 ATM is phosphorylated in SKBR3 cells depending on ATM and HER2") Supplementary Fig. 1: ATM is phosphorylated in HER2 breast cancer cell lines. (A) ATM is phosphorylated in SKBR3 cells depending on ATM and HER2 activity. Upper panel: Representative histograms for FACS
Supplementary Fig. 1: ATM is phosphorylated in HER2 breast cancer cell lines. (A) ATM is phosphorylated in SKBR3 cells depending on ATM and HER2 activity. Upper panel: Representative histograms for FACS
Supplementary Figure S1 Supplementary Figure S2
 Supplementary Figure S A) The blots shown in Figure B were qualified by using Gel-Pro analyzer software (Rockville, MD, USA). The ratio of LC3II/LC3I to actin was then calculated. The data are represented
SUPPLEMENTARY INFORMATION
 Supplementary Discussion The cell cycle machinery and the DNA damage response network are highly interconnected and co-regulated in assuring faithful duplication and partition of genetic materials into
Supplementary Figure 1 Induction of cellular senescence and isolation of exosome. a to c, Pre-senescent primary normal human diploid fibroblasts
 Supplementary Figure 1 Induction of cellular senescence and isolation of exosome. a to c, Pre-senescent primary normal human diploid fibroblasts (TIG-3 cells) were rendered senescent by either serial passage
Supplementary Figure 1.TRIM33 binds β-catenin in the nucleus. a & b, Co-IP of endogenous TRIM33 with β-catenin in HT-29 cells (a) and HEK 293T cells
 and HEK 293T cells") Supplementary Figure 1.TRIM33 binds β-catenin in the nucleus. a & b, Co-IP of endogenous TRIM33 with β-catenin in HT-29 cells (a) and HEK 293T cells (b). TRIM33 was immunoprecipitated, and the amount of
Supplementary Figure 1.TRIM33 binds β-catenin in the nucleus. a & b, Co-IP of endogenous TRIM33 with β-catenin in HT-29 cells (a) and HEK 293T cells (b). TRIM33 was immunoprecipitated, and the amount of
condition. Left panel, the HCT-116 cells were lysed with RIPA buffer containing 0.1%
 FIGURE LEGENDS Supplementary Fig 1 (A) sumoylation pattern detected under denaturing condition. Left panel, the HCT-116 cells were lysed with RIPA buffer containing 0.1% SDS in the presence and absence
Supplementary Materials for
 www.sciencesignaling.org/cgi/content/full/6/283/ra57/dc1 Supplementary Materials for JNK3 Couples the Neuronal Stress Response to Inhibition of Secretory Trafficking Guang Yang,* Xun Zhou, Jingyan Zhu,
Supplementary Figures
 Supplementary Figures Supplementary Figure 1 Characterization of stable expression of GlucB and sshbira in the CT26 cell line (a) Live cell imaging of stable CT26 cells expressing green fluorescent protein
Supplementary Figure 1. Normal T lymphocyte populations in Dapk -/- mice. (a) Normal thymic development in Dapk -/- mice. Thymocytes from WT and Dapk
 Normal thymic development in Dapk -/- mice. Thymocytes from WT and Dapk") Supplementary Figure 1. Normal T lymphocyte populations in Dapk -/- mice. (a) Normal thymic development in Dapk -/- mice. Thymocytes from WT and Dapk -/- mice were stained for expression of CD4 and CD8.
Supplementary Figure 1. Normal T lymphocyte populations in Dapk -/- mice. (a) Normal thymic development in Dapk -/- mice. Thymocytes from WT and Dapk -/- mice were stained for expression of CD4 and CD8.
SUPPLEMENTARY INFORMATION
 DOI: 10.1038/ncb2566 Figure S1 CDKL5 protein expression pattern and localization in mouse brain. (a) Multiple-tissue western blot from a postnatal day (P) 21 mouse probed with an antibody against CDKL5.
Supplements. Figure S1. B Phalloidin Alexa488
 Supplements A, DMSO, PP2, PP3 Crk-myc Figure S1. (A) Src kinase activity is necessary for recruitment of Crk to Nephrin cytoplasmic domain. Human podocytes expressing /7-NephrinCD () were treated with
supplementary information
 DOI: 10.1038/ncb1875 Figure S1 (a) The 79 surgical specimens from NSCLC patients were analysed by immunohistochemistry with an anti-p53 antibody and control serum (data not shown). The normal bronchi served
Figure S1. Sorting nexin 9 (SNX9) specifically binds psmad3 and not psmad 1/5/8. Lysates from AKR-2B cells untreated (-) or stimulated (+) for 45 min
 specifically binds psmad3 and not psmad 1/5/8. Lysates from AKR-2B cells untreated (-) or stimulated (+) for 45 min") Figure S1. Sorting nexin 9 (SNX9) specifically binds psmad3 and not psmad 1/5/8. Lysates from AKR2B cells untreated () or stimulated () for 45 min with 5 ng/ml TGFβ or 10 ng/ml BMP4 were incubated with
Figure S1. Sorting nexin 9 (SNX9) specifically binds psmad3 and not psmad 1/5/8. Lysates from AKR2B cells untreated () or stimulated () for 45 min with 5 ng/ml TGFβ or 10 ng/ml BMP4 were incubated with
Supplementary Figure 1
 Supplementary Figure 1 6 HE-50 HE-116 E-1 HE-108 Supplementary Figure 1. Targeted drug response curves of endometrial cancer cells. Endometrial cancer cell lines were incubated with serial dilutions of
SUPPLEMENTARY INFORMATION. Supplementary Figures S1-S9. Supplementary Methods
 SUPPLEMENTARY INFORMATION SUMO1 modification of PTEN regulates tumorigenesis by controlling its association with the plasma membrane Jian Huang 1,2#, Jie Yan 1,2#, Jian Zhang 3#, Shiguo Zhu 1, Yanli Wang
SUPPLEMENTARY INFORMATION
 SUPPLEENTRY INFORTION DOI: 1.138/ncb2577 Early Telophase Late Telophase B icrotubules within the ICB (percent of total cells in telophase) D G ultinucleate cells (% total) 8 6 4 2 2 15 1 5 T without gaps
Appendix. Table of Contents
 Appendix Table of Contents Appendix Figures Figure S1: Gp78 is not required for the degradation of mcherry-cl1 in Hela Cells. Figure S2: Indel formation in the MARCH6 sgrna targeted HeLa clones. Figure
SUPPLEMENTARY INFORMATION
 Supplementary Figures Supplementary Figure S1. Binding of full-length OGT and deletion mutants to PIP strips (Echelon Biosciences). Supplementary Figure S2. Binding of the OGT (919-1036) fragments with
SUPPLEMENTARY INFORMATION
 doi:10.1038/nature12652 Supplementary Figure 1. PRDM16 interacts with endogenous EHMT1 in brown adipocytes. Immunoprecipitation of PRDM16 complex by flag antibody (M2) followed by Western blot analysis
S1a S1b S1c. S1d. S1f S1g S1h SUPPLEMENTARY FIGURE 1. - si sc Il17rd Il17ra bp. rig/s IL-17RD (ng) -100 IL-17RD
 -100 IL-17RD") SUPPLEMENTARY FIGURE 1 0 20 50 80 100 IL-17RD (ng) S1a S1b S1c IL-17RD β-actin kda S1d - si sc Il17rd Il17ra rig/s15-574 - 458-361 bp S1f S1g S1h S1i S1j Supplementary Figure 1. Knockdown of IL-17RD enhances
SUPPLEMENTARY FIGURE 1 0 20 50 80 100 IL-17RD (ng) S1a S1b S1c IL-17RD β-actin kda S1d - si sc Il17rd Il17ra rig/s15-574 - 458-361 bp S1f S1g S1h S1i S1j Supplementary Figure 1. Knockdown of IL-17RD enhances
Figure S1, related to Figure 1. Escaper p38a-expressing cancer cells repopulate the tumors (A) Scheme of the mt/mg reporter that expresses a
 Scheme of the mt/mg reporter that expresses a") Cancer Cell, Volume 33 Supplemental Information Targeting p38a Increases DNA Damage, Chromosome Instability, and the Anti-tumoral Response to Taxanes in Breast Cancer Cells Begoña Cánovas, Ana Igea, Alessandro
Cancer Cell, Volume 33 Supplemental Information Targeting p38a Increases DNA Damage, Chromosome Instability, and the Anti-tumoral Response to Taxanes in Breast Cancer Cells Begoña Cánovas, Ana Igea, Alessandro
Supplementary Materials
 Supplementary Materials Supplementary Figure S1 Regulation of Ubl4A stability by its assembly partner A, The translation rate of Ubl4A is not affected in the absence of Bag6. Control, Bag6 and Ubl4A CRISPR
Supplementary information. The Light Intermediate Chain 2 Subpopulation of Dynein Regulates Mitotic. Spindle Orientation
 Supplementary information The Light Intermediate Chain 2 Subpopulation of Dynein Regulates Mitotic Spindle Orientation Running title: Dynein LICs distribute mitotic functions. Sagar Mahale a, d, *, Megha
Supplementary Figure 1. Spatial distribution of LRP5 and β-catenin in intact cardiomyocytes. (a) and (b) Immunofluorescence staining of endogenous
 and (b) Immunofluorescence staining of endogenous") Supplementary Figure 1. Spatial distribution of LRP5 and β-catenin in intact cardiomyocytes. (a) and (b) Immunofluorescence staining of endogenous LRP5 in intact adult mouse ventricular myocytes (AMVMs)
Supplementary Figure 1. Spatial distribution of LRP5 and β-catenin in intact cardiomyocytes. (a) and (b) Immunofluorescence staining of endogenous LRP5 in intact adult mouse ventricular myocytes (AMVMs)
Interleukin-6 promotes pancreatic cancer cell migration by rapidly activating the small GTPase CDC42
 Interleukin-6 promotes pancreatic cancer cell migration by rapidly activating the small GTPase CDC42 Gina L. Razidlo, Kevin M. Burton, and Mark A. McNiven SUPPORTING INFORMATION Figure S1. IL-6 promotes
SUPPLEMENTARY FIGURES
 SUPPLEMENTARY FIGURES Supplementary Figure 1. (A) Left, western blot analysis of ISGylated proteins in Jurkat T cells treated with 1000U ml -1 IFN for 16h (IFN) or left untreated (CONT); right, western
p = formed with HCI-001 p = Relative # of blood vessels that formed with HCI-002 Control Bevacizumab + 17AAG Bevacizumab 17AAG
 A.. Relative # of ECs associated with HCI-001 1.4 1.2 1.0 0.8 0.6 0.4 0.2 0.0 ol b p < 0.001 Relative # of blood vessels that formed with HCI-001 1.4 1.2 1.0 0.8 0.6 0.4 0.2 0.0 l b p = 0.002 Control IHC:
Identified proteins interacting with TMBIM1 by mass spectrometry
 Supplementary Information Journal: Nature Medicine Article Title: Corresponding Author: A novel multivesicular body regulator TMBIM1 protects against non-alcoholic fatty liver disease in mice and monkeys
Supplemental Materials. STK16 regulates actin dynamics to control Golgi organization and cell cycle
 Supplemental Materials STK16 regulates actin dynamics to control Golgi organization and cell cycle Juanjuan Liu 1,2,3, Xingxing Yang 1,3, Binhua Li 1, Junjun Wang 1,2, Wenchao Wang 1, Jing Liu 1, Qingsong
SUPPLEMENTARY INFORMATION
 DOI: 1.138/ncb222 / b. WB anti- WB anti- ulin Mitotic index (%) 14 1 6 2 T (h) 32 48-1 1 2 3 4 6-1 4 16 22 28 3 33 e. 6 4 2 Time (min) 1-6- 11-1 > 1 % cells Figure S1 depletion leads to mitotic defects
Type of file: PDF Title of file for HTML: Supplementary Information Description: Supplementary Figures
 Type of file: PDF Title of file for HTML: Supplementary Information Description: Supplementary Figures Type of file: MOV Title of file for HTML: Supplementary Movie 1 Description: NLRP3 is moving along
Nature Immunology: doi: /ni.3866
 Nature Immunology: doi:10.1038/ni.3866 Supplementary Figure 1 The effect of TIPE2 on chemotaxis. a, The expression of TIPE2 in dhl-60c, dhl-60t, TIPE2-expressing and 15/16Q-expressing dhl-60t neutrophils
(a) Significant biological processes (upper panel) and disease biomarkers (lower panel)
 Significant biological processes (upper panel) and disease biomarkers (lower panel)") Supplementary Figure 1. Functional enrichment analyses of secretomic proteins. (a) Significant biological processes (upper panel) and disease biomarkers (lower panel) 2 involved by hrab37-mediated secretory
Supplementary Figure 1. Functional enrichment analyses of secretomic proteins. (a) Significant biological processes (upper panel) and disease biomarkers (lower panel) 2 involved by hrab37-mediated secretory
Blocking c-met mediated PARP1 phosphorylation enhances anti-tumor effects of PARP inhibitors
 CORRECTION NOTICE Nat. Med. 22, 194 21 (216) Blocking mediated phosphorylation enhances anti-tumor effects of PARP inhibitors Yi Du, Hirohito Yamaguchi, Yongkun Wei, Jennifer L Hsu, Hung-Ling Wang, Yi-Hsin
Supplementary Figure 1. PD-L1 is glycosylated in cancer cells. (a) Western blot analysis of PD-L1 in breast cancer cells. (b) Western blot analysis
 Western blot analysis of PD-L1 in breast cancer cells. (b) Western blot analysis") Supplementary Figure 1. PD-L1 is glycosylated in cancer cells. (a) Western blot analysis of PD-L1 in breast cancer cells. (b) Western blot analysis of PD-L1 in ovarian cancer cells. (c) Western blot analysis
Supplementary Figure 1. PD-L1 is glycosylated in cancer cells. (a) Western blot analysis of PD-L1 in breast cancer cells. (b) Western blot analysis of PD-L1 in ovarian cancer cells. (c) Western blot analysis
SLX4 + MUS81 SLX4 + GEN1 SLX4 CONTROL SLX4
 GEN MUS8 GEN MUS8 GEN MUS8 GEN MUS8 GEN C LM MUS8 XPF (loading control) D H2AX Frequency of -positive bridges (% of anaphase cells) 6 4 2 p =.8 x -4 GM855 p =.27 PSNF5 E H2AX Figure S. Analysis of anaphase
Supplemental Information. NRF2 Is a Major Target of ARF. in p53-independent Tumor Suppression
 Molecular Cell, Volume 68 Supplemental Information NRF2 Is a Major Target of ARF in p53-independent Tumor Suppression Delin Chen, Omid Tavana, Bo Chu, Luke Erber, Yue Chen, Richard Baer, and Wei Gu Figure
TRAF6 ubiquitinates TGFβ type I receptor to promote its cleavage and nuclear translocation in cancer
 Supplementary Information TRAF6 ubiquitinates TGFβ type I receptor to promote its cleavage and nuclear translocation in cancer Yabing Mu, Reshma Sundar, Noopur Thakur, Maria Ekman, Shyam Kumar Gudey, Mariya
Supplementary Information
 Supplementary Information mediates STAT3 activation at retromer-positive structures to promote colitis and colitis-associated carcinogenesis Zhang et al. a b d e g h Rel. Luc. Act. Rel. mrna Rel. mrna
Downregulation of the small GTPase SAR1A: a key event underlying alcohol-induced Golgi fragmentation in hepatocytes
 Downregulation of the small GTPase SAR1A: a key event underlying alcohol-induced Golgi fragmentation in hepatocytes Armen Petrosyan 1*, Pi-Wan Cheng 1,3, Dahn L. Clemens 2,3 & Carol A. Casey 2,3 1 Department
m 6 A mrna methylation regulates AKT activity to promote the proliferation and tumorigenicity of endometrial cancer
 SUPPLEMENTARY INFORMATION Articles https://doi.org/10.1038/s41556-018-0174-4 In the format provided by the authors and unedited. m 6 A mrna methylation regulates AKT activity to promote the proliferation
Supplementary Figure 1. A. Bar graph representing the expression levels of the 19 indicated genes in the microarrays analyses comparing human lung
 Supplementary Figure 1. A. Bar graph representing the expression levels of the 19 indicated genes in the microarrays analyses comparing human lung immortalized broncho-epithelial cells (AALE cells) expressing
SUPPLEMENTARY INFORMATION
 doi: 10.1038/nature05732 SUPPLEMENTARY INFORMATION Supplemental Data Supplement Figure Legends Figure S1. RIG-I 2CARD undergo robust ubiquitination a, (top) At 48 h posttransfection with a GST, GST-RIG-I-2CARD
T H E J O U R N A L O F C E L L B I O L O G Y
 Supplemental material Jewell et al., http://www.jcb.org/cgi/content/full/jcb.201007176/dc1 T H E J O U R N A L O F C E L L B I O L O G Y Figure S1. IR Munc18c association is independent of IRS-1. (A and
Supplementary Figure 1. The CagA-dependent wound healing or transwell migration of gastric cancer cell. AGS cells transfected with vector control or
 Supplementary Figure 1. The CagA-dependent wound healing or transwell migration of gastric cancer cell. AGS cells transfected with vector control or 3xflag-CagA expression vector were wounded using a pipette
Supplementary Figure 1. mir124 does not change neuron morphology and synaptic
 Supplementary Figure 1. mir124 does not change neuron morphology and synaptic density. Hippocampal neurons were transfected with mir124 (containing DsRed) or DsRed as a control. 2 d after transfection,
APC/C Cdh1 controls CtIP stability during the cell cycle and in response to DNA damage
 Article APC/C Cdh1 controls stability during the cell cycle and in response to DNA damage Lorenzo Lafranchi 1,, Harmen R de Boer 2,, Elisabeth GE de Vries 2, Shao-En Ong 3, Alessandro A Sartori 1,* & Marcel
Supplementary Materials
 Supplementary Materials Figure S1. MTT Cell viability assay. To measure the cytotoxic potential of the oxidative treatment, the MTT [3-(4,5-dimethylthiazol- 2-yl)-2,5-diphenyl tetrazolium bromide] assay
Expanded View Figures
 Shao-Ming Shen et al Role of I in MT of cancers MO reports xpanded View igures igure V1. nalysis of the expression of I isoforms in cancer cells and their interaction with PTN. RT PR detection of Ish and
hexahistidine tagged GRP78 devoid of the KDEL motif (GRP78-His) on SDS-PAGE. This
 on SDS-PAGE. This") SUPPLEMENTAL FIGURE LEGEND Fig. S1. Generation and characterization of. (A) Coomassie staining of soluble hexahistidine tagged GRP78 devoid of the KDEL motif (GRP78-His) on SDS-PAGE. This protein was expressed
SUPPLEMENTAL FIGURE LEGEND Fig. S1. Generation and characterization of. (A) Coomassie staining of soluble hexahistidine tagged GRP78 devoid of the KDEL motif (GRP78-His) on SDS-PAGE. This protein was expressed
Expanded View Figures
 MO reports PR3 dephosphorylates TZ Xian-o Lv et al xpanded View igures igure V1. PR3 dephosphorylates and inactivates YP/TZ., Overexpression of tight junction proteins Pals1 () or LIN7 () has no effect
The clathrin adaptor Numb regulates intestinal cholesterol. absorption through dynamic interaction with NPC1L1
 The clathrin adaptor Numb regulates intestinal cholesterol absorption through dynamic interaction with NPC1L1 Pei-Shan Li 1, Zhen-Yan Fu 1,2, Ying-Yu Zhang 1, Jin-Hui Zhang 1, Chen-Qi Xu 1, Yi-Tong Ma
HCC1937 is the HCC1937-pcDNA3 cell line, which was derived from a breast cancer with a mutation
 SUPPLEMENTARY INFORMATION Materials and Methods Human cell lines and culture conditions HCC1937 is the HCC1937-pcDNA3 cell line, which was derived from a breast cancer with a mutation in exon 20 of BRCA1
HA-Sin1-N (aa 1-137), HA-Sin1-CRIM (aa ) and HA-Sin1-RBD (aa ) were constructed by
, HA-Sin1-CRIM (aa ) and HA-Sin1-RBD (aa ) were constructed by") EXTENDED METHODS Plasmids HA-Sin1-N (aa 1-137), HA-Sin1-CRIM (aa 138-266) and HA-Sin1-RBD (aa 267-376) were constructed by cloning the corresponding cdnas into psuper-ha-cdna3 vector via BamHI/BglII and
EXTENDED METHODS Plasmids HA-Sin1-N (aa 1-137), HA-Sin1-CRIM (aa 138-266) and HA-Sin1-RBD (aa 267-376) were constructed by cloning the corresponding cdnas into psuper-ha-cdna3 vector via BamHI/BglII and
a b G75 G60 Sw-2 Sw-1 Supplementary Figure 1. Structure predictions by I-TASSER Server.
 a b G75 2 2 G60 Sw-2 Sw-1 Supplementary Figure 1. Structure predictions by I-TASSER Server. a. Overlay of top 10 models generated by I-TASSER illustrates the potential effect of 7 amino acid insertion
Control GST GST-RAP. α2-mg. 170 kda. b-actin. 42 kda LRP-1
 % of max Supplementary Figure 1 Control GST GST-RP 17 kda α2-mg 42 kda b-actin Gate: CD11c+ (DCs) Gate: F4/8+ (Mfs) IgG Cd11cCre + Lrp1 fl/fl LRP-1 Supplementary figure 1. () MDCs were pretreated with
Supplementary Materials for
 www.sciencesignaling.org/cgi/content/full/9/439/ra78/dc1 Supplementary Materials for Small heterodimer partner mediates liver X receptor (LXR) dependent suppression of inflammatory signaling by promoting
IP: anti-gfp VPS29-GFP. IP: anti-vps26. IP: anti-gfp - + +
 FAM21 Strump. WASH1 IP: anti- 1 2 3 4 5 6 FAM21 Strump. FKBP IP: anti-gfp VPS29- GFP GFP-FAM21 tail H H/P P H H/P P c FAM21 FKBP Strump. VPS29-GFP IP: anti-gfp 1 2 3 FKBP VPS VPS VPS VPS29 1 = VPS29-GFP
SUPPLEMENTARY INFORMATION
 SUPPLEMENTARY INFORMATION doi:10.1038/nature11429 S1a 6 7 8 9 Nlrc4 allele S1b Nlrc4 +/+ Nlrc4 +/F Nlrc4 F/F 9 Targeting construct 422 bp 273 bp FRT-neo-gb-PGK-FRT 3x.STOP S1c Nlrc4 +/+ Nlrc4 F/F casp1
SUPPLEMENTARY FIGURES
 SUPPLEMENTARY FIGURES Figure S1. Clinical significance of ZNF322A overexpression in Caucasian lung cancer patients. (A) Representative immunohistochemistry images of ZNF322A protein expression in tissue
Supplementary Figure 1. Confocal immunofluorescence showing mitochondrial translocation of Drp1. Cardiomyocytes treated with H 2 O 2 were prestained
 Supplementary Figure 1. Confocal immunofluorescence showing mitochondrial translocation of Drp1. Cardiomyocytes treated with H 2 O 2 were prestained with MitoTracker (red), then were immunostained with
Supplementary Figure S1: Defective heterochromatin repair in HGPS progeroid cells
 Supplementary Figure S1: Defective heterochromatin repair in HGPS progeroid cells Immunofluorescence staining of H3K9me3 and 53BP1 in PH and HGADFN003 (HG003) cells at 24 h after γ-irradiation. Scale bar,
Tel: ; Fax: ;
 Tel.: +98 216 696 9291; Fax: +98 216 696 9291; E-mail: mrasadeghi@pasteur.ac.ir Tel: +98 916 113 7679; Fax: +98 613 333 6380; E-mail: abakhshi_e@ajums.ac.ir A Soluble Chromatin-bound MOI 0 1 5 0 1 5 HDAC2
SUPPLEMENTARY INFORMATION
 DOI: 1.138/ncb3445 In the format provided by the authors and unedited. a b HIF1A 14 12 Pearson R =.5419 P
SUPPLEMENTARY INFORMATION
 doi: 10.1038/nature06994 A phosphatase cascade by which rewarding stimuli control nucleosomal response A. Stipanovich*, E. Valjent*, M. Matamales*, A. Nishi, J.H. Ahn, M. Maroteaux, J. Bertran-Gonzalez,
Legends for Supplemental Figures.
 1 Legends for Supplemental Figures. Supplemental Figure 1. Proteasome Inhibition does not abrogate the expression of FA core complex proteins or formation of the FA core complex. (Full-length blots are
Incorporation of photo-caged lysine (pc-lys) at K273 of human LCK allows specific control of the enzyme activity.
 at K273 of human LCK allows specific control of the enzyme activity.") Supplementary Figure 1 Incorporation of photo-caged lysine (pc-lys) at K273 of human LCK allows specific control of the enzyme activity. (a) Modeling of the kinase domain of LCK with ATP (left) or pc-lys
Supplementary Figure 1 Incorporation of photo-caged lysine (pc-lys) at K273 of human LCK allows specific control of the enzyme activity. (a) Modeling of the kinase domain of LCK with ATP (left) or pc-lys
F-actin VWF Vinculin. F-actin. Vinculin VWF
 a F-actin VWF Vinculin b F-actin VWF Vinculin Supplementary Fig. 1. WPBs in HUVECs are located along stress fibers and at focal adhesions. (a) Immunofluorescence images of f-actin (cyan), VWF (yellow),
Supplementary Figure 1. Characterization of NMuMG-ErbB2 and NIC breast cancer cells expressing shrnas targeting LPP. NMuMG-ErbB2 cells (a) and NIC
 and NIC") Supplementary Figure 1. Characterization of NMuMG-ErbB2 and NIC breast cancer cells expressing shrnas targeting LPP. NMuMG-ErbB2 cells (a) and NIC cells (b) were engineered to stably express either a LucA-shRNA
Supplementary Figure 1. Characterization of NMuMG-ErbB2 and NIC breast cancer cells expressing shrnas targeting LPP. NMuMG-ErbB2 cells (a) and NIC cells (b) were engineered to stably express either a LucA-shRNA
SUPPLEMENTARY FIGURES
 SUPPLEMENTARY FIGURES Supplementary Figure S1: Fibroblast-induced elongation of cancer cells requires direct contact with living fibroblasts. A. Representative images of HT29-GFP cultured in the presence
Supplementary Figure S1
 Supplementary Figure S1 Supplementary Figure S1. PARP localization patterns using GFP-PARP and PARP-specific antibody libraries GFP-PARP localization in non-fixed (A) and formaldehyde fixed (B) GFP-PARPx
SUPPLEMENTARY INFORMATION
 Supplementary Table 1. Cell sphingolipids and S1P bound to endogenous TRAF2. Sphingolipid Cell pmol/mg TRAF2 immunoprecipitate pmol/mg Sphingomyelin 4200 ± 250 Not detected Monohexosylceramide 311 ± 18
A. Generation and characterization of Ras-expressing autophagycompetent
 Supplemental Material Supplemental Figure Legends Fig. S1 A. Generation and characterization of Ras-expressing autophagycompetent and -deficient cell lines. HA-tagged H-ras V12 was stably expressed in
Supplementary Figure 1
 Supplementary Figure 1 Dox Cis Cam Pac 0 15 1 15 1 15 1 15 1 15 µmole/l Ub p53 Cytotoxic anticancer agents increase p53 levels but do not generally promote the accumulation of ubiquitinated. Western blots
SUPPLEMENTARY FIGURES AND TABLE
 SUPPLEMENTARY FIGURES AND TABLE Supplementary Figure S1: Characterization of IRE1α mutants. A. U87-LUC cells were transduced with the lentiviral vector containing the GFP sequence (U87-LUC Tet-ON GFP).
T H E J O U R N A L O F C E L L B I O L O G Y
 T H E J O U R N A L O F C E L L B I O L O G Y Supplemental material Krenn et al., http://www.jcb.org/cgi/content/full/jcb.201110013/dc1 Figure S1. Levels of expressed proteins and demonstration that C-terminal
Supplementary Figure 1 CD4 + T cells from PKC-θ null mice are defective in NF-κB activation during T cell receptor signaling. CD4 + T cells were
 Supplementary Figure 1 CD4 + T cells from PKC-θ null mice are defective in NF-κB activation during T cell receptor signaling. CD4 + T cells were isolated from wild type (PKC-θ- WT) or PKC-θ null (PKC-θ-KO)
Fig. S1. Subcellular localization of overexpressed LPP3wt-GFP in COS-7 and HeLa cells. Cos7 (top) and HeLa (bottom) cells expressing for 24 h human
 and HeLa (bottom) cells expressing for 24 h human") Fig. S1. Subcellular localization of overexpressed LPP3wt-GFP in COS-7 and HeLa cells. Cos7 (top) and HeLa (bottom) cells expressing for 24 h human LPP3wt-GFP, fixed and stained for GM130 (A) or Golgi97
Fig. S1. Subcellular localization of overexpressed LPP3wt-GFP in COS-7 and HeLa cells. Cos7 (top) and HeLa (bottom) cells expressing for 24 h human LPP3wt-GFP, fixed and stained for GM130 (A) or Golgi97
supplementary information
 DOI: 1.138/ncb1 Control Atg7 / NAC 1 1 1 1 (mm) Control Atg7 / NAC 1 1 1 1 (mm) Lamin B Gstm1 Figure S1 Neither the translocation of into the nucleus nor the induction of antioxidant proteins in autophagydeficient
Figure 6: TERT regulates MYC half-life and ubiquitination.
 TERT or IgG as indicated. For the western blots, representative images of n= independent experiments are shown. Student s t-test was used, and * indicates p
Tbk1-TKO! DN cells (%)! 15! 10!
! 15! 10!") a! T Cells! TKO! B Cells! TKO! b! CD4! 8.9 85.2 3.4 2.88 CD8! Tbk1-TKO! 1.1 84.8 2.51 2.54 c! DN cells (%)! 4 3 2 1 DP cells (%)! 9 8 7 6 CD4 + SP cells (%)! 5 4 3 2 1 5 TKO! TKO! TKO! TKO! 15 1 5 CD8
a! T Cells! TKO! B Cells! TKO! b! CD4! 8.9 85.2 3.4 2.88 CD8! Tbk1-TKO! 1.1 84.8 2.51 2.54 c! DN cells (%)! 4 3 2 1 DP cells (%)! 9 8 7 6 CD4 + SP cells (%)! 5 4 3 2 1 5 TKO! TKO! TKO! TKO! 15 1 5 CD8
SUPPLEMENTARY INFORMATION
 DOI: 1.138/ncb3355 a S1A8 + cells/ total.1.8.6.4.2 b S1A8/?-Actin c % T-cell proliferation 3 25 2 15 1 5 T cells Supplementary Figure 1 Inter-tumoral heterogeneity of MDSC accumulation in mammary tumor