Supplementary Figure 1. a. b. Relative cell viability. Nature Genetics: doi: /ng SCR shyap1-1 shyap
|
|
|
- Erik Bryan
- 5 years ago
- Views:
Transcription
 1e-05 1e-03 1e-01 1 0 1000 2000 3000 4000 5000 Genes")

1 Supplementary Figure 1. a. b. p-value for depletion in vehicle (DMSO) 1e-05 1e-03 1e Genes log2 normalized shrna counts in T sh1 shluc log2 normalized shrna counts in DMSO c HCC364 A2058 BRAF mutant cell lines HT29 WiDr KHM-5M HTC/C3 A549 H2347 SW1573 MOR/CPR SK-MEL-2 MM415 HPAF-II PANC RAS mutant cell lines
2 Supplementary Figure 1 Effects of 1 inhibition on cell growth. (a) Primary screen data showing that the 1 gene was not depleted over 10 d of vehicle (DMSO) treatment in HCC364 cells (DMSO versus T0). (b) Primary screening data showing that shrnas targeting 1 were not depleted over 10 d of vehicle (DMSO) treatment in HCC364 cells (DMSO versus T0). (c) Effect of 1 knockdown using two independent shrnas on cell growth in HCC364, A2058, HT29, WiDr, KHM-5M, HTC/C3, A549, H2347, SW1573, MOR/CPR, SK-MEL-2, MM415, HPAF-II and PANC02.03 cells, measured at 3 d by CellTiter-Glo assay.
 e. IC 50 Vemurafenib (nm) g.")
 800 600 400 200 0 shtead4-1")
 HCC364 (BRAF V600E ) shtead4-1 shtead4-2 0 100")
")
 shtead4-1 shtead4-2 DMSO Vemurafenib HCC364")
 shtead4-1 shtead4-2 0.")
3 Supplementary Figure 2. a. b. HCC364 (BRAF V600E ) HCC364 (BRAF V600E ) c. IC 50 Vemurafenib (nm) e. IC 50 Vemurafenib (nm) g HCC364 (BRAF V600E ) shtead2-1 shtead HCC364 (BRAF V600E ) shtead4-1 shtead4-2 Pemetrexed ( M) (BRAF V600E HCC364 ) shtead2-1 shtead Vemurafenib (nm) HCC364 (BRAF V600E ) shtead4-1 shtead Vemurafenib (nm) d. f. IC 50 IC Cisplatin (nm) (BRAF V600E HCC364 ) shtead2-1 h. shtead2-2 HCC364 (BRAF V600E ) shtead4-1 shtead4-2 DMSO Vemurafenib HCC364 (BRAF V600E ) shtead2-1 shtead (BRAF V600E HCC364 ) shtead4-1 shtead Trametinib Relative mrna expression TEAD2 shtead2-1 shtead2-2 Relative mrna expression TEAD4 shtead4-1 shtead shtead shtead
4 Supplementary Figure 2 The effects of silencing were specific to targeted inhibition of RAF-MEK signaling and are through transcriptional activity. (a) Effects of 1 knockdown using two independent shrnas on pemetrexed sensitivity in HCC364 lung cancer cells. (b) Effects of 1 knockdown using two independent shrnas on cisplatin sensitivity in HCC364 lung cancer cells. (c) Effects of TEAD2 knockdown using two independent shrnas on vemurafenib sensitivity in HCC364 lung cancer cells (shown are the IC 50 and relative cell viability). (d) Validation of the effects of TEAD2 knockdown on trametinib sensitivity in HCC364 BRAF-mutant lung cancer cells (shown are the IC 50 and cell viability). (e) Effects of TEAD4 knockdown using two independent shrnas on vemurafenib sensitivity in HCC364 lung cancer cells (shown are the IC 50 and relative cell viability). (f) Validation of the effects of TEAD4 knockdown on trametinib sensitivity in HCC364 BRAF-mutant lung cancer cells (shown are the IC 50 and cell viability). (g) mrna expression of TEAD2 and TEAD4 in cells expressing scrambled control shrna or shrna to TEAD2 or TEAD4. (h) Effects of TEAD2 and TEAD4 knockdown on vemurafenib and trametinib sensitivity in HCC364 BRAF-mutant lung cancer cells (shown is 7-d cell growth assessed by crystal violet staining assays, with quantification of the effects on viability under each condition).
 PARP (Nuclear marker) HCC364 Lung A2058 HT29 KHM-5M Melanoma Colon Thyroid b.")
5 Supplementary Figure 3. a. BRAF V600E lines C N C N C N C N GAPDH (Cytosol marker) PARP (Nuclear marker) HCC364 Lung A2058 HT29 KHM-5M Melanoma Colon Thyroid b. C RAS mutant lines N C N C N C N C N GAPDH (Cytosol marker) Parp (Nuclear marker) A549 H23 MOR/CPR Miapac2 MM415 Lung Pancreas Melanoma
6 Supplementary Figure 3 Nuclear expression in BRAF- and RAS-mutant cancer cell lines. Nuclear/cytoplasmic fractionation and immunoblot analysis of the indicated proteins in (a) BRAF V600E mutant cancer cell lines and (b) RASmutant cancer cell lines. Data represent three independent experiments.
7 Supplementary Figure 4. a. IC 50 Vemurafenib (nm) HCC364 (BRAF V600E ) EV TAZ EV 1 TAZ TAZ EV 1 TAZ HCC364 (BRAF V600E ) Vemurafenib (nm) b. HCC364 (BRAF V600E ) 1000 >1000 >1000 HCC364 (BRAF V600E ) IC EV TAZ EV 1 TAZ
8 Supplementary Figure 4 Exogenous expression of or TAZ promotes resistance to RAF-MEK inhibition. (a) Effects of 1 or TAZ overexpression on vemurafenib sensitivity in HCC364 lung cancer cells (shown are the IC 50 and relative cell viability). (b) Effects of 1 or TAZ overexpression on trametinib sensitivity in HCC364 lung cancer cells (shown are the IC 50 and relative cell viability).
9 Supplementary Figure 5. a. BRAF V600E Melanoma Colon Thyroid % Maximal growth inhibition in trametinib A2058 WM793 HT29 WiDr KHM-5M HTC/C3 b. NSCLC Melanoma Pancreas A549 KRASG12S H23 KRASG12C Calu6 KRASG12C SW1573 KRASG12C MOR/CPR KRASG12C % Maximal growth inhibition in trametinib H2347 NRASQ61R MM415 NRASQ61L SK-MEL-2 NRASQ61R HPAF-II KRASG12D PANC KRASG12D
10 Supplementary Figure 5 Increase in maximal growth inhibition upon trametinib treatment in 1-depleted cells. (a) Effects of 1 knockdown on trametinib sensitivity in the indicated BRAF-mutant cell lines, shown as percentage of maximal growth inhibition (n = 4, +s.e.m. for all cell viability data shown). (b) Effects of 1 knockdown on trametinib sensitivity in the indicated RAS-mutant cell lines, shown as percentage of maximal growth inhibition (n = 4, +s.e.m. for all cell viability data shown).


 sh-1 sh-2 BRAFV600E")


 BRAFV600E")
 HT29 sh-1 sh-2 WiDr")

11 Supplementary Figure 6. a. A2058 BRAFV600E Vemurafenib (nm) A2058 BRAFV600E A c. BRAFV600E A2058 DMSO Vemurafenib Trametinib b. BRAFV600E WM Vemurafenib (nm) sh-1 sh-2 BRAFV600E WM d. BRAFV600E WM793 DMSO Vemurafenib Trametinib e. f. g. h. HT29 BRAFV600E Vemurafenib (nm) BRAFV600E WiDr Vemurafenib (nm) BRAFV600E KHM-5M Vemurafenib (nm) BRAFV600E HTC/C Vemurafenib (nm) HT29 sh-1 sh-2 WiDr KHM-5M HTC/C3 sh-1 sh-2 BRAFV600E HT BRAFV600E WiDr BRAFV600E KHM-5M BRAFV600E HTC/C
12 Supplementary Figure 6 1 knockdown sensitizes cancer cells to RAF-MEK inhibition across multiple tumor types. (a,b) Effects of 1 knockdown using two independent shrnas on vemurafenib and trametinib sensitivity in (a) A2058 and (b) WM793 BRAF V600E mutant melanoma cancer cells. (c,d) Effects of 1 knockdown on vemurafenib and trametinib sensitivity in (c) A2058 and (d) WM793 BRAF V600E mutant melanoma cancer cells (shown is 7-d cell growth assessed by crystal violet staining assays, with quantification of the effects on viability under each condition). (e,f) Effects of 1 knockdown using two independent shrnas on vemurafenib and trametinib sensitivity in (e) HT29 and (f) WiDr BRAF V600E mutant colon cancer cells. (g,h) Effects of 1 knockdown using two independent shrnas on vemurafenib and trametinib sensitivity in (g) KHM-5M and (h) HTC/C3 BRAF V600E mutant thyroid cancer cells.
13 Supplementary Figure 7. a. Tumor volumes (mm 3 ) n.s 0 A2058 xenograft model 6 b. PLX4720 c. Fold change in tumor volume sh1 PLX4720 Trametinib sh1 Trametinib Trametinib Vemurafenib sh A2058 Xenograft tumors cl-parp d. -1 A2058 xenograft model e. f. Tumor volumes (mm 3 ) n.s 0 HT29 xenograft model Fold change in tumor volume PLX4720 sh1 PLX4720 HT29 xenograft model Trametinib sh1 Trametinib Trametinib Vemurafenib sh HT29 Xenograft tumors g. h. Fold change in tumor volume DMSO MOR/CPR xenograft model sh1 DMSO Trametinib sh1 Trametinib sh1 Trametinib MOR/CPR Xenograft tumors
14 Supplementary Figure 7 1 inhibition sensitizes tumors to RAF-MEK inhibition in vivo. (a) Average tumor volume of xenografts generated from A2058 cells infected with either scrambled control shrna or 1 shrna (n = 10/group, +s.e.m.). (b) Waterfall plot indicating fold change in tumor volume upon vemurafenib or trametinib treatment of A2058 xenografts infected with either scrambled control shrna or 1 shrna (n = 8 12/group, ±s.e.m.). (c) Immunoblot analysis for each indicated protein in lysates from representative A2058 xenograft tumors. d, Average tumor volume of xenografts generated from HT29 cells infected with either scrambled control shrna or 1 shrna (n = 10/group, +s.e.m.). (e) Waterfall plot indicating fold change in tumor volume upon vemurafenib or trametinib treatment of HT29 xenograft model infected with either scrambled control shrna or 1 shrna (n = 8 12/group, ±s.e.m.). (f) Immunoblot analysis for each indicated protein in lysates from representative HT29 xenograft tumors. (g) Waterfall plot indicating fold change in tumor volume upon trametinib treatment of MOR/CPR xenograft model infected with either scrambled control shrna or 1 shrna (n = 8 12/group, ±s.e.m.). (h) Immunoblot analysis for each indicated protein in lysates from representative MOR/CPR xenograft tumors.
15 Supplementary Figure 8. a. b. A2058 Vemurafenib +Erlotinib Vemurafenib (nm) A2058 Trametinib +Erlotinib c. d. KHM-5M Vemurafenib +Erlotinib Vemurafenib (nm) Trametinib +Erlotinib KHM-5M
16 Supplementary Figure 8 Effect of treatment with the EGFR kinase inhibitor erlotinib on RAF-MEK inhibitor sensitivity. (a,b) Effect of treatment with the EGFR kinase inhibitor erlotinib on (a) vemurafenib and (b) trametinib sensitivity in A2058 BRAF V600E mutant melanoma cells. (c,d) Effect of EGFR kinase inhibitor erlotinib on (c) vemurafenib and (d) trametinib sensitivity in KHM-5M BRAF V600E mutant thyroid cancer cells..


17 Supplementary Figure 9. a. b. NRASQ61L MM415 DMSO MM415 NRASQ61R SK-MEL-2 DMSO SK-MEL-2 c. HPAF-II e. f. NRASQ61L MM415 DMSO DMSO KRASG12D Trametinib d. KRASG12D PANC02.03 NRASQ61R SK-MEL-2 DMSO DMSO Trametinib
18 Supplementary Figure 9 1 knockdown sensitizes RAS-mutant melanoma and pancreatic cancer cells to MEK inhibition. (a,b) Effects of 1 knockdown using two independent shrnas on trametinib sensitivity in (a) MM415 NRAS Q61L mutant, (b) SK-MEL-2 NRAS Q61R mutant melanoma cells. (c,d) Effects of 1 knockdown using two independent shrnas on trametinib sensitivity in (c) HPAF-II KRAS G12D mutant and (d) Panc KRAS G12D mutant pancreatic cancer cells. (e,f) Effects of 1 knockdown using two independent shrnas on trametinib sensitivity in (e) MM415 NRAS Q61L mutant and (f) SK-MEL-2 NRAS Q61R mutant melanoma cells (shown is 7-d cell growth assessed by crystal violet staining assays, with quantification of the effects on viability under each condition).


19 Supplementary Figure 10. a. c. A549 KRASG12S sh-1 sh-2 A549 DMSO e. f. KRASG12C Calu-6 DMSO KRASG12C MOR/CPR sh-1 sh-2 Calu-6 MOR/CPR DMSO b. d. KRASG12C H23 sh-1 sh-2 H23 DMSO H2347 KRASG12C KRASG12C g. MOR/CPR h. i. SW1573 DMSO Trametinib DMSO Trametinib NRASQ61R H2347 DMSO SW1573 KRASG12C sh-1 sh-2 DMSO SW1573 NRASQ61R H2347 DMSO Trametinib
20 Supplementary Figure 10 1 knockdown sensitizes RAS-mutant NSCLC cells to MEK inhibition. (a f) Effects of 1 knockdown using two independent shrnas on trametinib sensitivity in (a) A549 KRAS G12S mutant, (b) H23 KRAS G12C mutant, (c) Calu-6 KRAS G12C mutant, (d) H2347 NRAS Q61R mutant, (e) MOR/CPR KRAS G12C mutant and (f) SW1573 KRAS G12C mutant NSCLC cell lines. (g i) Effects of 1 knockdown using two independent shrnas on trametinib sensitivity in (g) MOR/CPR KRAS G12C mutant cells, (h) SW1573 KRAS G12C mutant cells and (i) H2347 NRAS Q61R mutant cells (shown is 7-d cell growth assessed by crystal violet staining assays, with quantification of the effects on viability under each condition).
21 Supplementary Figure 11. a. c. Caspase activity/dmso Caspase activity/dmso WiDr (BRAF V600E ) WiDr ) Vemurafenib Trametinib b. d. Caspase activity/dmso Caspase activity/dmso Trametinib Trametinib (BRAF V600E A549 (KRAS G12S ) Calu-1 (KRAS G12C ) e. f. g. h. HCC364 (BRAF V600E ) A2058 (BRAF V600E ) A549 (KRAS G12S ) Calu-1 (KRAS G12C ) P<1 P<1 P<1 P<1 DMSO Vemurafenib Trametinib TW-37 Vemurafenib Trametinib +TW-37 DMSO Vemurafenib Trametinib TW-37 Vemurafenib Trametinib +TW-37 DMSO Trametinib ABT-263 TW-37 ABT-263 TW-37 +Trametinib DMSO Trametinib ABT-263 TW-37 ABT-263 TW-37 +Trametinib
22 Supplementary Figure 11 1 knockdown induces apoptosis upon RAF-MEK inhibition. (a,b) Effects of 1 knockdown on apoptosis induced upon (a) vemurafenib and (b) trametinib treatment in WiDr BRAF-mutant colon cancer cells as measured by caspase-3/7 activation. (c,d) Effects of 1 knockdown on apoptosis induced upon (c) vemurafenib and (d) trametinib treatment in A549 KRAS-mutant lung cancer cells as measured by caspase-3/7 activation. (e,f) Effects of pharmacological inhibition of BCL-xL using TW-37 on vemurafenib or trametinib sensitivity in (e) HCC364 BRAF-mutant lung cancer cells and (f) A2058 BRAF-mutant melanoma cells (n = 3, ±s.e.m. for all cell viability data shown; P values are indicated for statistical analysis). (g,h) Effects of pharmacological inhibition of BCL-xL using ABT-263 or TW-37 on trametinib sensitivity in (g) A549 KRAS G12S mutant and (h) Calu-1 KRAS G12C mutant lung cancer cells (n = 3, ±s.e.m. for all cell viability data shown; P values are indicated for statistical analysis).
23
24 Supplementary Figure 12 inhibition plus RAF-MEK inhibition suppresses BCL-xL expression. (a c) Effects of suppression and vemurafenib or trametinib treatment on BCL-xL levels by immunoblot analysis in BRAF V600E mutant (a) A2058 melanoma, (b) HT29 colon and (c) KHM-5M thyroid cancer cells. Results represent three independent experiments.
25 Supplementary Figure 13. a. b. IC 50 Vemurafenib (nm) GFP + control sirna BCL-xL + control sirna HCC364 (BRAF V600E ) GFP + 1 sirna BCL-xL + 1 sirna HCC364 (BRAF V600E ) 860 HCC364 (BRAF V600E ) GFP Control + sirna BCL-xL + Control sirna GFP + 1 sirna-2 BCL-xL + 1 sirna Vemurafenib (nm) HCC364 (BRAF V600E ) IC > GFP Control + sirna BCL-xL + Control sirna GFP + 1 sirna-2 BCL-xL + 1 sirna c. 0 GFP + control sirna Vemurafenib BCL-xL + control sirna 1 sirna GFP + 1 sirna NT sirna + + GFP BCL-xL BCL-xL + 1 sirna HCC364 (BRAF V600E ) BCL-xL Parp cl-parp
26 Supplementary Figure 13 BCL-xL expression rescues 1-depleted cells from growth suppression by RAF-MEK inhibition. (a,b) Effects of BCL-xL overexpression and 1 knockdown on (a) vemurafenib and (b) trametinib sensitivity in HCC364 lung cancer cells (shown are the IC 50 and relative cell viability). (c) Immunoblot analysis for each indicated protein in lysates from HCC364 cells overexpressing either GFP or BCL-xL and treated with either control sirna or 1 sirna.
27
28 Supplementary Figure 14 Gene sets enriched among the genes specifically altered by and MEK coinhibition. Pathway analysis indicating enriched gene sets among those genes whose expression was specifically decreased by and MEK coinhibition (Supplementary Table 5). The top six significantly represented pathways among these genes are shown (significance of pathway representation is shown as log q, with the red line indicating q < 5). The genes highlighted in the inset are the significantly altered apoptosis-related genes.
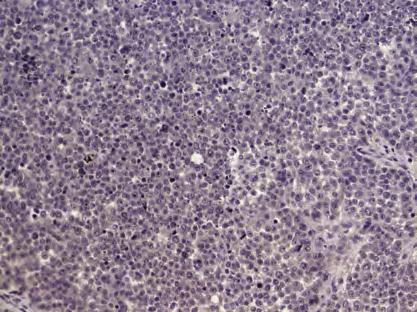
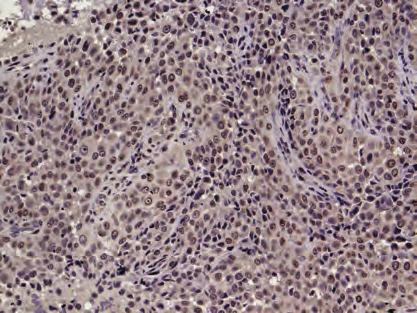
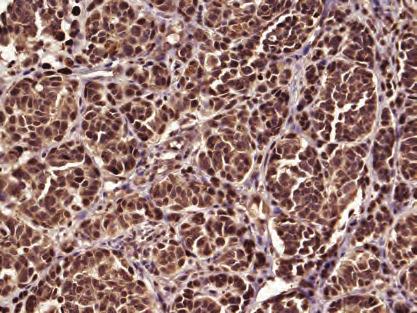
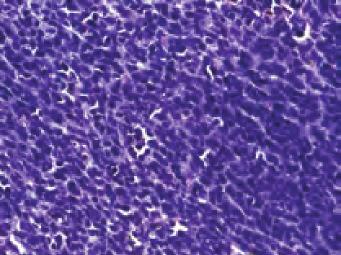
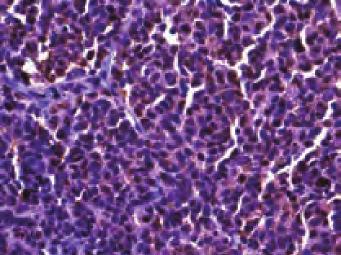
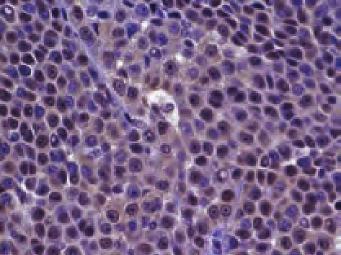
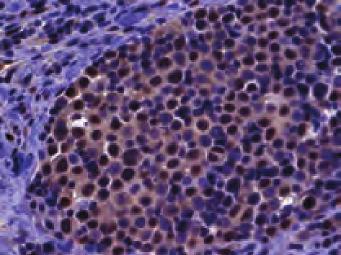
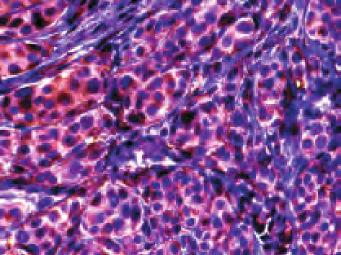
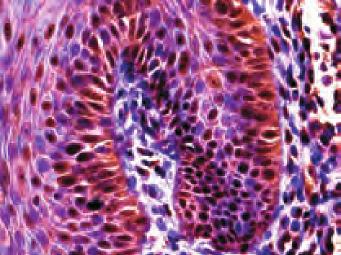
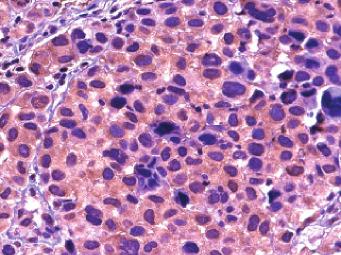
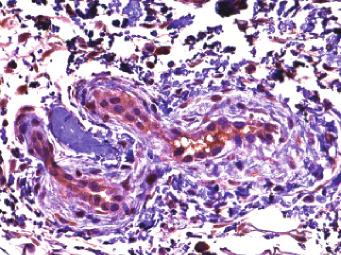
29 Supplementary Figure 15. a. b. staining Pre-treatment P1 Low P2 Intermediate P3 P4 High Acquired resistance
30 Supplementary Figure 15 protein expression in human tumor specimens by immunohistochemistry. (a) Representative images of immunohistochemistry staining of protein in representative human tumor specimens with low, intermediate and high staining (brown). (b) staining by immunohistochemistry in BRAF V600E mutant melanomas obtained before RAF or MEK inhibitor treatment and upon acquired resistance. Shown are the 4 out of 16 cases in which the pretreatment tumor did not harbor high levels of (showing either low or intermediate staining by immunohistochemistry). Bars represent 50 microns.
31 Supplementary Tables Supplementary Table 1. Gene targets included in the pooled shrna screening library. Supplementary Table 2. Primary screening hits, using a p-value of <05 for depletion in vemurafenib-treated cells. Gene Dropout p-value 1 0E-05 PCK1 2.00E-04 UPB1 2.00E-04 CHRNA9 3.00E-04 PLCB3 5.00E-04 SDHC 5.00E-04 WIPI1 6.00E-04 HSF2 8.00E-04 SUZ E-04 TLN1 8.00E-04 GAS6 011 SH2B2 012 NDUFA SLCO1A2 014 SLC13A5 015 HCLS1 018 BIRC5 02 MAP3K3 021 PARP1 025 MVP 028 TNFAIP3 028 NCOR1 029 SFRP2 03 PKMYT1 031 LDB1 033 TOP3B 04 GAB1 042 ST6GALNAC6 046
32 Supplementary Table 3. IC 50 of cell lines to BRAF inhibitor vemurafenib and MEK inhibitor trametinib infected with scramble shrna or 1 shrna. Cell lines Genotypes Vemurafenib IC 50 // Trametinib IC 50 // HCC364 BRAF V600E 800/100/200 10/2.1/4.03 A2058 BRAF V600E >5000/1500/ /1.5/2 WM793 BRAF V600E 3000/800/600 >1000/3/3 HT29 BRAF V600E >10000/6000/ /10/10 WiDr BRAF V600E 2500/200/700 2/0.5/0.5 KHM-5M BRAF V600E >10000/3000/5000 >1000/2.5/25 HTC/C3 BRAF V600E >5000/200/ /2/7 Cal-12T BRAF G466V 723/10.1/15.3 A549 KRAS G12S 75/30/30 H23 KRAS G12C 75/15/25 Calu-6 KRAS G12C 50/15/5 H2347 NRAS Q61R 9/2/3 SW1573 KRAS G12C >1000/200/180 MOR/CPR KRAS G12C >1000/150/150 MM415 NRAS Q61L 1.767/0.77/5 SK-MEL-2 NRAS Q61R 1.55/0.75/1 HPAF-II KRAS G12D 9/3.6/4.3 PANC KRAS G12D 40/6/15
33 Supplementary Table 4. Percentage of maximal growth inhibition upon MEK inhibitor trametinib treatment in cell lines infected with scramble shrna or 1 shrna. Cell lines Genotypes Trametinib maximal growth inhibition // HCC364 BRAF V600E 64.3%/94.6%/94.7% A2058 BRAF V600E 62%/84%/80% WM793 BRAF V600E 50%/76%/73% HT29 BRAF V600E 81%/88%/90% WiDr BRAF V600E 91%/96%/96% KHM-5M BRAF V600E 48%/85%/74% HTC/C3 BRAF V600E 54%/67%/65% Cal-12T BRAF G466V 53%/71%/72% A549 KRAS G12S 60%/82%/77% H23 KRAS G12C 68%/86%/82% Calu-6 KRAS G12C 70%/94%/85% H2347 NRAS Q61R 70%/94%/82% SW1573 KRAS G12C 42%/61%/65% MOR/CPR KRAS G12C 35%/73%/81% MM415 NRAS Q61L 89%/96%/95% SK-MEL-2 NRAS Q61R 92%/99%/95% HPAF-II KRAS G12D 89%/95%/96% PANC KRAS G12D 84%/93%/92%
34 Supplementary Table 5. Differentially expressed genes in BRAF V600E NSCLC cells (HCC364), upon either knockdown alone (by shrna), trametinib treatment alone, and combined knockdown + trametinib treatment. Gene name, fold change in expression (compared to scramble control), and adjusted p-value are listed for each gene that was significantly altered under any of the three conditions using the following significance criteria: adjusted p-value < 5 and at least 40% decreased expression or at least 66% increased expression, compared to the control. Columns H, I, J indicate whether each gene significantly altered under any condition was significantly altered in the other conditions. N = not altered. Y = altered. The genes specifically significantly altered by combined knockdown + trametinib treatment (those with N for both knockdown and trametinib treatment alone and Y for combined knockdown and trametinib) were subjected to pathway analysis (shown in Figure S15).
35 Supplementary Table 6. 1 expression as measured and scored by IHC in the human clinical specimens with complete response (CR) or incomplete response (IR, including partial response/pr and stable disease/sd) to MAPK pathway inhibitor treatment. Patients Treatment Type of responses score Cancer types 1 vemurafenib CR low melanoma 2 vemurafenib CR low melanoma 3 vemurafenib CR intermediate melanoma 4 vemurafenib CR high melanoma 5 dabrafenib + trametinib CR intermediate melanoma 6 vemurafenib CR intermediate melanoma 7 vemurafenib IR (PR) low melanoma 8 dabrafenib IR (PR) low melanoma 9 dabrafenib IR (PR) high melanoma 10 vemurafenib IR (PR) high melanoma 11 dabrafenib IR (PR) high melanoma 12 dabrafenib + trametinib IR (PR) high melanoma 13 dabrafenib IR (PR) high melanoma 14 dabrafenib + trametinib IR (PR) intermediate melanoma 15 dabrafenib + trametinib IR (PR) high melanoma 16 dabrafenib + trametinib IR (PR) high melanoma 17 dabrafenib + trametinib IR (PR) high melanoma 18 dabrafenib + trametinib IR (PR) high melanoma 19 dabrafenib + trametinib IR (PR) high melanoma 20 dabrafenib + trametinib IR (PR) high melanoma 21 dabrafenib + trametinib IR (PR) high melanoma 22 dabrafenib + trametinib IR (PR) high melanoma 23 dabrafenib + trametinib IR (SD) high melanoma 24 dabrafenib + trametinib IR (SD) high melanoma 25 dabrafenib + trametinib IR (SD) high melanoma 26 vemurafenib IR (PR) intermediate melanoma 27 vemurafenib IR (PR) high melanoma 28 vemurafenib IR (PR) high melanoma 29 vemurafenib IR (SD) high melanoma 30 vemurafenib IR (SD) high melanoma 31 LGX818+MEK162 IR (SD) intermediate melanoma 32 LGX818+MEK162 IR (SD) high melanoma 33 LGX818+MEK162 IR (PR) high melanoma 34 LGX818+MEK162 IR (PR) high melanoma 35 LGX818+MEK162 IR (PR) high melanoma 36 dabrafenib IR (PR) intermediate NSCLC 37 dabrafenib IR (PR) high NSCLC 38 dabrafenib IR (PR) high NSCLC 39 dabrafenib IR (PR) high NSCLC 40 dabrafenib IR (PR) high NSCLC
36 Supplementary Table 7. Melanoma patient information for acquired RAF-MEK inhibitor resistance analysis (average TTP of 9.9 months, consistent with prior studies 1-4 ). Patients Treatment score Time to progression Pretreatment Acquired resistance (TTP) P1 vemurafenib Low High 17 months P2 vemurafenib Intermediate High 10 months P3 vemurafenib Intermediate High 21 months P4 dabrafenib + trametinib P5 dabrafenib + trametinib Intermediate High 17 months High High 9 months P6 vemurafenib High High 2 months P7 dabrafenib + trametinib P8 dabrafenib + trametinib High High 3 months High High 2 months P9 vemurafenib High High 5 months P10 dabrafenib + trametinib High High 30 months P11 dabrafenib High High 7 months P12 dabrafenib + trametinib High High 10 months P13 vemurafenib High High 8 months P14 dabrafenib + trametinib P15 dabrafenib + trametinib High Intermediate N/A High Intermediate 3 months
37 P16 vemurafenib High Low 5 months Supplementary references 1. Flaherty, K.T. et al. Combined BRAF and MEK inhibition in melanoma with BRAF V600 mutations. N Engl J Med 367, (2012). 2. Flaherty, K.T. et al. Inhibition of mutated, activated BRAF in metastatic melanoma. N Engl J Med 363, (2010). 3. Flaherty, K.T. et al. Improved survival with MEK inhibition in BRAFmutated melanoma. N Engl J Med 367, (2012). 4. Sosman, J.A. et al. Survival in BRAF V600-mutant advanced melanoma treated with vemurafenib. N Engl J Med 366, (2012).
Complexity of intra- and inter-pathway loops in colon cancer and melanoma: implications for targeted therapies
 Complexity of intra- and inter-pathway loops in colon cancer and melanoma: implications for targeted therapies René Bernards The Netherlands Cancer Institute Amsterdam The Netherlands Molecular versus
Overexpression of Mcl-1 confers resistance to BRAFV600E inhibitors alone and in combination with MEK1/2 inhibitors in melanoma
 Overexpression of Mcl-1 confers resistance to BRAFV600E inhibitors alone and in combination with MEK1/2 inhibitors in melanoma The Harvard community has made this article openly available. Please share
mtor Inhibition Specifically Sensitizes Colorectal Cancers with KRAS or BRAF Mutations to BCL-2/BCL-
 Supplementary Material for mtor Inhibition Specifically Sensitizes Colorectal Cancers with KRAS or BRAF Mutations to BCL-2/BCL- XL Inhibition by Suppressing MCL-1 Anthony C. Faber 1,2 *, Erin M. Coffee
Supplementary Information Supplementary Fig. 1. Elevated Usp9x in melanoma and NRAS mutant melanoma cells are dependent on NRAS for 3D growth.
 Supplementary Information Supplementary Fig. 1. Elevated Usp9x in melanoma and NRAS mutant melanoma cells are dependent on NRAS for 3D growth. a. Immunoblot for Usp9x protein in NRAS mutant melanoma cells
Leucine Deprivation Reveals a Targetable Liability
 Cancer Cell, 19 Supplemental Information Defective Regulation of Autophagy upon Leucine Deprivation Reveals a Targetable Liability of Human Melanoma Cells In Vitro and In Vivo Joon-Ho Sheen, Roberto Zoncu,
Supplementary Information
 Supplementary Information Supplementary Figure 1. Effect of mir mimics and anti-mirs on DTPs a, Representative fluorescence microscopy images of GFP vector control or mir mimicexpressing parental and DTP
WNT5A enhances resistance of melanoma cells to targeted BRAF inhibitors
 Research article WNT5A enhances resistance of melanoma cells to targeted BRAF inhibitors Jamie N. Anastas, 1,2 Rima M. Kulikauskas, 3 Tigist Tamir, 4 Helen Rizos, 5 Georgina V. Long, 5 Erika M. von Euw,
Supplementary Figure 1. A. Bar graph representing the expression levels of the 19 indicated genes in the microarrays analyses comparing human lung
 Supplementary Figure 1. A. Bar graph representing the expression levels of the 19 indicated genes in the microarrays analyses comparing human lung immortalized broncho-epithelial cells (AALE cells) expressing
Supplementary Figure 1. Basal level EGFR across a panel of ESCC lines. Immunoblots demonstrate the expression of phosphorylated and total EGFR as
 Supplementary Figure 1. Basal level EGFR across a panel of ESCC lines. Immunoblots demonstrate the expression of phosphorylated and total EGFR as well as their downstream effectors across a panel of ESCC
Supplementary Figure 1
 A B D Relative TAp73 mrna p73 Supplementary Figure 1 25 2 15 1 5 p63 _-tub. MDA-468 HCC1143 HCC38 SUM149 MDA-468 HCC1143 HCC38 SUM149 HCC-1937 MDA-MB-468 ΔNp63_ TAp73_ TAp73β E C Relative ΔNp63 mrna TAp73
AWARD NUMBER: W81XWH TITLE: An in Vivo shrna-drug Screen to Identify Novel Targeted Therapy Combinations for KRAS Mutant Cancers
 AWARD NUMBER: W81XWH-12-1-0420 TITLE: An in Vivo shrna-drug Screen to Identify Novel Targeted Therapy Combinations for KRAS Mutant Cancers PRINCIPAL INVESTIGATOR: Ryan B. Corcoran, M.D., Ph.D. CONTRACTING
EPIGENETIC RE-EXPRESSION OF HIF-2α SUPPRESSES SOFT TISSUE SARCOMA GROWTH
 EPIGENETIC RE-EXPRESSION OF HIF-2α SUPPRESSES SOFT TISSUE SARCOMA GROWTH Supplementary Figure 1. Supplementary Figure 1. Characterization of KP and KPH2 autochthonous UPS tumors. a) Genotyping of KPH2
Supplementary Figure 1: si-craf but not si-braf sensitizes tumor cells to radiation.
 Supplementary Figure 1: si-craf but not si-braf sensitizes tumor cells to radiation. (a) Embryonic fibroblasts isolated from wildtype (WT), BRAF -/-, or CRAF -/- mice were irradiated (6 Gy) and DNA damage
Nature Medicine: doi: /nm.4078
 Supplementary Figure 1. Cetuximab induces ER stress response in DiFi cells. (a) Scheme of SILAC proteome. (b) MS-base read out of SILAC experiment. The histogram of log 2 -transformed normalized H/L ratios
SUPPLEMENTARY INFORMATION
 SUPPLEMENTARY INFORMATION doi:.38/nature83 Supplementary figure An Overview of Experimental Flow Hypothesis: The tumor microenvironment has a significant impact on cancer cell chemoresistance. Screen Coculture
Supplementary Figure 1. MLN8237 treatments show an unusual camel-back response pattern.
 Supplementary Figure 1. MLN8237 treatments show an unusual camel-ack response pattern. NCI-H1819 cells were treated with serial concentrations of MLN8237 and four days after treatment, cell viaility was
Supplementary Figure 1: Digitoxin induces apoptosis in primary human melanoma cells but not in normal melanocytes, which express lower levels of the
 Supplementary Figure 1: Digitoxin induces apoptosis in primary human melanoma cells but not in normal melanocytes, which express lower levels of the cardiac glycoside target, ATP1A1. (a) The percentage
AACR 101st Annual Meeting 2010, Washington D.C. Experimental and Molecular Therapeutics Section 29; Abstract #3855
 Investigation of the Growth Inhibitory Activity of the MEK Inhibitor ARRY-162 in Combination with Everolimus in a Variety of KRas and PI3K Pathway Mutant Cancers Brian Tunquist, Tyler Risom, Debbie Anderson,
Supplementary Figure 1. Blood glucose and insulin levels in mice during 4-day infusion.
 Supplementary Figure 1. Blood glucose and insulin levels in mice during 4-day infusion. (A-B) WT and HT mice infused with saline or glucose had overlapping achieved blood glucose and insulin levels, necessitating
Nature Medicine: doi: /nm.3559
 Supplementary Note 1. A sample alteration report. Each alteration nominated by PHIAL is curated to answer specific fields that are intended to guide physician interpretation. Gene Alteration Patient ID
Development of Rational Drug Combinations for Oncology Indications - An Industry Perspective
 Development of Rational Drug Combinations for Oncology Indications An Industry Perspective Stuart Lutzker, MDPhD Vice President Oncology Early Development Genentech Inc 1 Conventional Oncology Drug Development
Supplementary Figures
 Supplementary Figures Supplementary Figure 1 Characterization of stable expression of GlucB and sshbira in the CT26 cell line (a) Live cell imaging of stable CT26 cells expressing green fluorescent protein
Supplementary Online Content
 Supplementary Online Content Kris MG, Johnson BE, Berry LD, et al. Using Multiplexed Assays of Oncogenic Drivers in Lung Cancers to Select Targeted Drugs. JAMA. doi:10.1001/jama.2014.3741 etable 1. Trials
Supplementary Figure 1 Cell line TRIB2 status. Supplementary Figure 2 TRIB2 status has no impact on the cell cycle after PI3K inhibition. a. b.
 Supplementary Figure 1 Cell line TRIB2 status. TRIB2 protein expression to determine endogenous expression and to determine the effectiveness of each of our TRIB2 knockdown constructs. Supplementary Figure
Corporate Medical Policy
 Corporate Medical Policy BRAF Gene Variant Testing to Select Melanoma or Glioma Patients File Name: Origination: Last CAP Review: Next CAP Review: Last Review: braf_gene_variant_testing_to_select_melanoma_or_glioma_patients_for_targeted_
Supplemental Figure 1. Western blot analysis indicated that MIF was detected in the fractions of
 Supplemental Figure Legends Supplemental Figure 1. Western blot analysis indicated that was detected in the fractions of plasma membrane and cytosol but not in nuclear fraction isolated from Pkd1 null
Corporate Medical Policy
 Corporate Medical Policy BRAF Gene Mutation Testing to Select Melanoma or Glioma Patients File Name: Origination: Last CAP Review: Next CAP Review: Last Review: braf_gene_mutation_testing_to_select_melanoma_or_glioma_patients_for_targeted_
CONTRACTING ORGANIZATION: Massachusetts General Hospital Boston, MA
 AD Award Number: W81XWH-12-1-0420 TITLE: An in vivo shrna-drug screen to identify novel targeted therapy combinations for KRAS mutant cancers PRINCIPAL INVESTIGATOR: Ryan B. Corcoran, MD PhD CONTRACTING
Supplementary Figure 1.TRIM33 binds β-catenin in the nucleus. a & b, Co-IP of endogenous TRIM33 with β-catenin in HT-29 cells (a) and HEK 293T cells
 and HEK 293T cells") Supplementary Figure 1.TRIM33 binds β-catenin in the nucleus. a & b, Co-IP of endogenous TRIM33 with β-catenin in HT-29 cells (a) and HEK 293T cells (b). TRIM33 was immunoprecipitated, and the amount of
Supplementary Figure 1.TRIM33 binds β-catenin in the nucleus. a & b, Co-IP of endogenous TRIM33 with β-catenin in HT-29 cells (a) and HEK 293T cells (b). TRIM33 was immunoprecipitated, and the amount of
Supplementary Figure 1. Characterization of NMuMG-ErbB2 and NIC breast cancer cells expressing shrnas targeting LPP. NMuMG-ErbB2 cells (a) and NIC
 and NIC") Supplementary Figure 1. Characterization of NMuMG-ErbB2 and NIC breast cancer cells expressing shrnas targeting LPP. NMuMG-ErbB2 cells (a) and NIC cells (b) were engineered to stably express either a LucA-shRNA
Supplementary Figure 1. Characterization of NMuMG-ErbB2 and NIC breast cancer cells expressing shrnas targeting LPP. NMuMG-ErbB2 cells (a) and NIC cells (b) were engineered to stably express either a LucA-shRNA
Pro-apoptotic signalling through Toll-like receptor 3 involves TRIF-dependent
 Pro-apoptotic signalling through Toll-like receptor 3 involves TRIF-dependent activation of caspase-8 and is under the control of inhibitor of apoptosis proteins in melanoma cells Arnim Weber, Zofia Kirejczyk,
Normal RAS-RAF (MAPK) pathway signaling
 pathway signaling") BRAF-Mutations in Melanomas L. Mazzucchelli Istituto Cantonale di Patologia, Locarno 77. Annual Meeting Swiss Society of Pathology, Lucerne 2011 Sponsored by Roche Pharma Switzerland Melanoma has increased
BRAF-Mutations in Melanomas L. Mazzucchelli Istituto Cantonale di Patologia, Locarno 77. Annual Meeting Swiss Society of Pathology, Lucerne 2011 Sponsored by Roche Pharma Switzerland Melanoma has increased
Response and resistance to BRAF inhibitors in melanoma
 Response and resistance to BRAF inhibitors in melanoma Keith T. Flaherty, M.D. Massachusetts General Hospital Cancer Center Disclosures Roche/Genentech: consultant GlaxoSmithKline: consultant BRAF mutations
(A) SW480, DLD1, RKO and HCT116 cells were treated with DMSO or XAV939 (5 µm)
 SW480, DLD1, RKO and HCT116 cells were treated with DMSO or XAV939 (5 µm)") Supplementary Figure Legends Figure S1. Tankyrase inhibition suppresses cell proliferation in an axin/β-catenin independent manner. (A) SW480, DLD1, RKO and HCT116 cells were treated with DMSO or XAV939
Supplementary Figure Legends Figure S1. Tankyrase inhibition suppresses cell proliferation in an axin/β-catenin independent manner. (A) SW480, DLD1, RKO and HCT116 cells were treated with DMSO or XAV939
Supplementary Figures
 Supplementary Figures Supplementary Figure 1 DOT1L regulates the expression of epithelial and mesenchymal markers. (a) The expression levels and cellular localizations of EMT markers were confirmed by
1.Basis of resistance 2.Mechanisms of resistance 3.How to overcome resistance. 13/10/2017 Sara Redaelli
 Dott.ssa Sara Redaelli 13/10/2017 1.Basis of resistance 2.Mechanisms of resistance 3.How to overcome resistance Tumor Heterogeneity: Oncogenic Drivers in NSCLC The Promise of Genotype-Directed Therapy
BRAF Inhibition in Melanoma
 BRAF Inhibition in Melanoma New York City, Mar 22-23, 2013 Bartosz Chmielowski, MD, PhD Assistant Clinical Professor University of California Los Angeles Disclosures Speaker Bureau: BMS, Genentech, Prometheus
Supplementary Figure 1: Tissue of Origin analysis on 152 cell lines. (a) Heatmap representation of the 30 Tissue scores for the 152 cell lines.
 Heatmap representation of the 30 Tissue scores for the 152 cell lines.") Supplementary Figure 1: Tissue of Origin analysis on 152 cell lines. (a) Heatmap representation of the 30 Tissue scores for the 152 cell lines. The scores summarize the global expression of the tissue
Supplementary Figure 1: Tissue of Origin analysis on 152 cell lines. (a) Heatmap representation of the 30 Tissue scores for the 152 cell lines. The scores summarize the global expression of the tissue
SUPPLEMENTARY FIGURES
 SUPPLEMENTARY FIGURES Supplementary Figure S1: Fibroblast-induced elongation of cancer cells requires direct contact with living fibroblasts. A. Representative images of HT29-GFP cultured in the presence
Normal Skin. Tissue Samples and Melanoma Cell Lines. BRAF Mut. RAS Mut RAS WT /BRAF WT
 Supplemental Figure 1. MERTK gene expression in melanoma cell line panel from Cancer Cell Line Encyclopedia. A. Microarray analysis of melanoma cell lines from UNC collection grouped by oncogenic mutation.
Guangdong Medical University, Zhanjiang, China; 5 Guangxi Medical University, Nanning, China; 6 Department of Pathology, University of Michigan
 Overexpression of FAM83H-AS1 indicates poor patient survival and knockdown impairs cell proliferation and invasion via MET/EGFR signaling in lung cancer Jie Zhang 1,2, Shumei Feng 3, Wenmei Su 4, Shengbin
supplementary information
 DOI: 10.1038/ncb1875 Figure S1 (a) The 79 surgical specimens from NSCLC patients were analysed by immunohistochemistry with an anti-p53 antibody and control serum (data not shown). The normal bronchi served
(a) Significant biological processes (upper panel) and disease biomarkers (lower panel)
 Significant biological processes (upper panel) and disease biomarkers (lower panel)") Supplementary Figure 1. Functional enrichment analyses of secretomic proteins. (a) Significant biological processes (upper panel) and disease biomarkers (lower panel) 2 involved by hrab37-mediated secretory
Supplementary Figure 1. Functional enrichment analyses of secretomic proteins. (a) Significant biological processes (upper panel) and disease biomarkers (lower panel) 2 involved by hrab37-mediated secretory
K-Ras signalling in NSCLC
 Targeting the Ras-Raf-Mek-Erk pathway Egbert F. Smit MD PhD Dept. Pulmonary Diseases Vrije Universiteit VU Medical Centre Amsterdam, The Netherlands K-Ras signalling in NSCLC Sun et al. Nature Rev. Cancer
Supplementary Data Supplementary Table S1. IC 50 values of ipatasertib on cell viability in cell lines with
 Supplementary Data Supplementary Table S1. IC 50 values of ipatasertib on cell viability in cell lines with or without alterations in PTEN or PIK3CA. Cell Line Tissue Type Ipatasertib IC 50 (μmol/l) a
Identification of BRAF mutations in melanoma lesions with the Roche z480 instrument
 Identification of BRAF mutations in melanoma lesions with the Roche z480 instrument Márta Széll IAP, Siófok May 14, 2012 Multifactorial skin diseses: much more frequent then genodermatoses exhibit familial
SUPPLEMENTARY FIGURE LEGENDS. atypical adenomatous hyperplasias (AAH); Grade II: adenomas; Grade III: adenocarcinomas;
; Grade II: adenomas; Grade III: adenocarcinomas;") SUPPLEMENTARY FIGURE LEGENDS Supplementary Figure S1: Tumor grades in Ras G12D ; p53 / lung tumors. Representative histology (H&E) of K-Ras G12D ; p53 / lung tumors 13 weeks after tumor initiation. Grade
SUPPLEMENTARY FIGURE LEGENDS Supplementary Figure S1: Tumor grades in Ras G12D ; p53 / lung tumors. Representative histology (H&E) of K-Ras G12D ; p53 / lung tumors 13 weeks after tumor initiation. Grade
Nature Neuroscience: doi: /nn Supplementary Figure 1
 Supplementary Figure 1 EGFR inhibition activates signaling pathways (a-b) EGFR inhibition activates signaling pathways (a) U251EGFR cells were treated with erlotinib (1µM) for the indicated times followed
Description of Supplementary Files. File Name: Supplementary Information Description: Supplementary Figures and Supplementary Tables
 Description of Supplementary Files File Name: Supplementary Information Description: Supplementary Figures and Supplementary Tables Supplementary Figure 1: (A), HCT116 IDH1-WT and IDH1-R132H cells were
SUPPLEMENTARY FIGURES
 SUPPLEMENTARY FIGURES Figure S1. Clinical significance of ZNF322A overexpression in Caucasian lung cancer patients. (A) Representative immunohistochemistry images of ZNF322A protein expression in tissue
RAW264.7 cells stably expressing control shrna (Con) or GSK3b-specific shrna (sh-
 or GSK3b-specific shrna (sh-") 1 a b Supplementary Figure 1. Effects of GSK3b knockdown on poly I:C-induced cytokine production. RAW264.7 cells stably expressing control shrna (Con) or GSK3b-specific shrna (sh- GSK3b) were stimulated
1 a b Supplementary Figure 1. Effects of GSK3b knockdown on poly I:C-induced cytokine production. RAW264.7 cells stably expressing control shrna (Con) or GSK3b-specific shrna (sh- GSK3b) were stimulated
Supplementary Figures
 Supplementary Figures Supplementary Figure 1 Correlation between LKB1 and YAP expression in human lung cancer samples. (a) Representative photos showing LKB1 and YAP immunohistochemical staining in human
Rationale for co-targeting IGF-1R and ALK in ALK fusion positive lung cancer
 Supplemental Figures and Legends Rationale for co-targeting IGF-1R and ALK in ALK fusion positive lung cancer Christine M. Lovly 1,2, Nerina T. McDonald 1, Heidi Chen 2, Sandra Ortiz-Cuaran 3, Lukas C.
Supplementary Figure 1 ITGB1 and ITGA11 increase with evidence for heterodimers following HSC activation. (a) Time course of rat HSC activation
 Time course of rat HSC activation") Supplementary Figure 1 ITGB1 and ITGA11 increase with evidence for heterodimers following HSC activation. (a) Time course of rat HSC activation indicated by the detection of -SMA and COL1 (log scale).
Supplementary Figure 1 ITGB1 and ITGA11 increase with evidence for heterodimers following HSC activation. (a) Time course of rat HSC activation indicated by the detection of -SMA and COL1 (log scale).
Supplementary Figure 1: STAT3 suppresses Kras-induced lung tumorigenesis
 Supplementary Figure 1: STAT3 suppresses Kras-induced lung tumorigenesis (a) Immunohistochemical (IHC) analysis of tyrosine 705 phosphorylation status of STAT3 (P- STAT3) in tumors and stroma (all-time
Supplementary Materials
 Supplementary Materials Supplementary Figure S1 Regulation of Ubl4A stability by its assembly partner A, The translation rate of Ubl4A is not affected in the absence of Bag6. Control, Bag6 and Ubl4A CRISPR
CANCER THERAPEUTICS: A NOVEL APPROACH
 CANCER THERAPEUTICS: A NOVEL APPROACH Mary Dwyer, Ph.D. HBRI and ChemRegen, Inc. SCDMDG Meeting October 23, 212 Outline Introduction Hit, HBRI1: identification & characterization Leads, HBRI2 & HBRI3:
Type of file: PDF Size of file: 0 KB Title of file for HTML: Supplementary Information Description: Supplementary Figures
 Type of file: PDF Size of file: 0 KB Title of file for HTML: Supplementary Information Description: Supplementary Figures Supplementary Figure 1 mir-128-3p is highly expressed in chemoresistant, metastatic
Supplementary Figure 1. Repression of hepcidin expression in the liver of mice treated with
 Supplementary Figure 1. Repression of hepcidin expression in the liver of mice treated with DMN Immunohistochemistry for hepcidin and H&E staining (left). qrt-pcr assays for hepcidin in the liver (right).
Supplementary Information
 Supplementary Information Figure S1. Int6 gene silencing efficiency. (A) Western Blot analysis of Int6 expression at different times after sirna transfection. Int6 expression is strongly silenced in Int6
SUPPLEMENTARY FIGURES AND TABLES
 SUPPLEMENTARY FIGURES AND TABLES Supplementary Figure S1: CaSR expression in neuroblastoma models. A. Proteins were isolated from three neuroblastoma cell lines and from the liver metastasis of a MYCN-non
c Ischemia (30 min) Reperfusion (8 w) Supplementary Figure bp 300 bp Ischemia (30 min) Reperfusion (4 h) Dox 20 mg/kg i.p.
 Reperfusion (8 w) Supplementary Figure bp 300 bp Ischemia (30 min) Reperfusion (4 h) Dox 20 mg/kg i.p.") a Marker Ripk3 +/ 5 bp 3 bp b Ischemia (3 min) Reperfusion (4 h) d 2 mg/kg i.p. 1 w 5 w Sacrifice for IF size A subset for echocardiography and morphological analysis c Ischemia (3 min) Reperfusion (8
a Marker Ripk3 +/ 5 bp 3 bp b Ischemia (3 min) Reperfusion (4 h) d 2 mg/kg i.p. 1 w 5 w Sacrifice for IF size A subset for echocardiography and morphological analysis c Ischemia (3 min) Reperfusion (8
Dox. R26-rtTA Tyr-CreERT2. any ink/arf, no rtta (n=8) ink/arf +/+ (n=5) Day 0 Day 11 Day 18 Day 28
 ink/arf +/+ (n=5) Day 0 Day 11 Day 18 Day 28") A 4OHT Dox hraf iip tumors inras ddh 2 O -RT Ink/Arf / Pten l/ l R26-lsl-rtTA Tyr-reERT2 TetO-hRAF V6E Ink/Arf / Pten / R26-rtTA Tyr-reERT2 TetO-hRAF V6E Ink/Arf / Pten / R26-rtTA Tyr-reERT2 TetO-hRAF
A 4OHT Dox hraf iip tumors inras ddh 2 O -RT Ink/Arf / Pten l/ l R26-lsl-rtTA Tyr-reERT2 TetO-hRAF V6E Ink/Arf / Pten / R26-rtTA Tyr-reERT2 TetO-hRAF V6E Ink/Arf / Pten / R26-rtTA Tyr-reERT2 TetO-hRAF
SUPPLEMENTARY INFORMATION
 DOI: 10.1038/ncb2607 Figure S1 Elf5 loss promotes EMT in mammary epithelium while Elf5 overexpression inhibits TGFβ induced EMT. (a, c) Different confocal slices through the Z stack image. (b, d) 3D rendering
SUPPLEMENTARY INFORMATION
 DOI: 10.1038/ncb2535 Figure S1 SOX10 is expressed in human giant congenital nevi and its expression in human melanoma samples suggests that SOX10 functions in a MITF-independent manner. a, b, Representative
Figure S1. ERBB3 mrna levels are elevated in Luminal A breast cancers harboring ERBB3
 Supplemental Figure Legends. Figure S1. ERBB3 mrna levels are elevated in Luminal A breast cancers harboring ERBB3 ErbB3 gene copy number gain. Supplemental Figure S1. ERBB3 mrna levels are elevated in
Supplementary Figure 1 Induction of cellular senescence and isolation of exosome. a to c, Pre-senescent primary normal human diploid fibroblasts
 Supplementary Figure 1 Induction of cellular senescence and isolation of exosome. a to c, Pre-senescent primary normal human diploid fibroblasts (TIG-3 cells) were rendered senescent by either serial passage
Efficacy of IGFBP7 for Treatment of Metastatic Melanoma and other Cancers in Mouse Models and Human Cell Lines
 Published as: Mol Cancer Ther. 2009 November ; 8(11): 3009 3014. Efficacy of IGFBP7 for Treatment of Metastatic Melanoma and other Cancers in Mouse Models and Human Cell Lines Narendra Wajapeyee 1, Varun
RAS-MAPK dependence underlies a rational polytherapy strategy in EML4-ALK positive lung cancer
 A r t i c l e s RAS-MAPK dependence underlies a rational polytherapy strategy in EML4-positive lung cancer Gorjan Hrustanovic 1,2, Victor Olivas 1,2, Evangelos Pazarentzos 1,2, Asmin Tulpule 1,2, Saurabh
Supplementary Data. Supplementary Methods:
 Supplementary Data Supplementary Methods: Cell viability assay. Cells were seeded overnight at a density of 2,000 cells per well in 96-well plates in RPMI with 10% FBS and then treated with the relevant
Figure S1. Reduction in glomerular mir-146a levels correlate with progression to higher albuminuria in diabetic patients.
 Supplementary Materials Supplementary Figures Figure S1. Reduction in glomerular mir-146a levels correlate with progression to higher albuminuria in diabetic patients. Figure S2. Expression level of podocyte
m 6 A mrna methylation regulates AKT activity to promote the proliferation and tumorigenicity of endometrial cancer
 SUPPLEMENTARY INFORMATION Articles https://doi.org/10.1038/s41556-018-0174-4 In the format provided by the authors and unedited. m 6 A mrna methylation regulates AKT activity to promote the proliferation
SUPPLEMENTARY INFORMATION
 SUPPLEMENTARY NFORMATON n format provided by Melero et al. (AUGUST 2015) Supplementary nformation S3 Combinations including two or more immunotherapy agents based on PD-1/PD-L1 blockade. (Source: https://clinicaltrials.gov/
Template for Reporting Results of Biomarker Testing of Specimens From Patients With Melanoma
 Template for Reporting Results of Biomarker Testing of Specimens From Patients With Melanoma Template web posting date: February 2015 Authors Lynette M. Sholl, MD, FCAP* Department of Pathology, Brigham
Inhibition of TGFβ enhances chemotherapy action against triple negative breast cancer by abrogation of
 SUPPLEMENTAL DATA Inhibition of TGFβ enhances chemotherapy action against triple negative breast cancer by abrogation of cancer stem cells and interleukin-8 Neil E. Bhola 1, Justin M. Balko 1, Teresa C.
Pushing the boundaries-targeted therapies
 Pushing the boundaries-targeted therapies Professor Grant McArthur MB BS PhD Director Melanoma and Skin Cancer VCCC Parkville, Peter MacCallum Cancer Centre Lorenzo Galli Chair of Melanoma & Skin Cancers,
Supplementary Fig. 1. GPRC5A post-transcriptionally down-regulates EGFR expression. (a) Plot of the changes in steady state mrna levels versus
 Plot of the changes in steady state mrna levels versus") Supplementary Fig. 1. GPRC5A post-transcriptionally down-regulates EGFR expression. (a) Plot of the changes in steady state mrna levels versus changes in corresponding proteins between wild type and Gprc5a-/-
Supplementary Fig. 1. GPRC5A post-transcriptionally down-regulates EGFR expression. (a) Plot of the changes in steady state mrna levels versus changes in corresponding proteins between wild type and Gprc5a-/-
Supplemental File. TRAF6 is an amplified oncogene bridging the Ras and nuclear factor-κb cascade in human lung cancer
 Supplemental File TRAF6 is an amplified oncogene bridging the Ras and nuclear factor-κb cascade in human lung cancer Daniel T. Starczynowski, William W. Lockwood, Sophie Delehouzee, Raj Chari, Joanna Wegrzyn,
Supplementary Figures
 Supplementary Figures Figure S1. Validation of kinase regulators of ONC201 sensitivity. Validation and screen results for changes in cell viability associated with the combination of ONC201 treatment (1
effects on organ development. a-f, Eye and wing discs with clones of ε j2b10 show no
 Supplementary Figure 1. Loss of function clones of 14-3-3 or 14-3-3 show no significant effects on organ development. a-f, Eye and wing discs with clones of 14-3-3ε j2b10 show no obvious defects in Elav
The selective ERK inhibitor BVD-523 is active in models of MAPK pathway-dependent cancers, including those with intrinsic and acquired drug resistance
 The selective ERK inhibitor BVD-523 is active in models of MAPK pathway-dependent cancers, including those with intrinsic and acquired drug resistance Ursula Germann 1, Brinley Furey 2, Jeff Roix 3, William
Sample Report. Result: POSITIVE Mutations Detected: NRAS-G13V, TP53-R282W, TP53-G245D, TP53-R175H, BRAF-V600M, MSI-High
 Sample Report PATIENT INFORMATION Name: DOB: Age: Sex: Address: Doe, John 09/04/1969 49 Male South Plainfield, NJ, 07080 SAMPLE INFORMATION Date Collected: Date Received: Date of Report: lab ID: Testing
ras Multikinase Inhibitor Multikinase Inhibitor 0.1
 a ras ** * ** * ** ** ** ** un in et m lu Se ib SL G 32 W 7 So 50 ra 74 fe ni b LY W 294 or 0 tm 02 R an ap n a in Ev my er cin ol im BE us Z2 3 En P 5 za I13 st 0 au rin D as SP ati 60 nib C 012 is 5
SUPPLEMENTARY INFORMATION
 doi:10.1038/nature09626 Suppl. Table 1. Sequencing primers. B-RAF Forward Reverse Exon1 CGGCGACTTCTCGTCGTCTC CTGCATGACGGAGAGGGACA Exon2 CTGGCAGTTACTGTGATGTAGTTG CTTCCCAAATCTATTCCTAATCCCACC Exon3 GGACCATCTAGATATCACATATG
Targets & therapies for colorectal cancer
 Targets & therapies for colorectal cancer Jan Schellens Werkgroep "MOLECULAIRE DIAGNOSTIEK IN DE PATHOLOGIE 31-01-2014 Current treatment options for advanced colorectal cancer (CRC) First line: - CAPOX
Pharmacologic inhibition of histone demethylation as a therapy for pediatric brainstem glioma
 Supplementary information for: Pharmacologic inhibition of histone demethylation as a therapy for pediatric brainstem glioma Rintaro Hashizume 1, Noemi Andor 2, Yuichiro Ihara 2, Robin Lerner 2, Haiyun
Update on Targeted Therapy in Melanoma
 Update on Targeted Therapy in Melanoma Seville June 2013 James Larkin FRCP PhD London UK Overview What are the targets in melanoma? BRAF / KIT / NRAS / GNAQ / MEK DNA / microtubules CTLA4 / PD1 / PDL1
Final published version:
 Paradoxical activation of MEK/ERK signaling induced by B-Raf inhibition enhances DR5 expression and DR5 activation-induced apoptosis in Ras-mutant cancer cells Youtake Oh, Emory University Jiusheng Deng,
Supplemental information
 Carcinoemryonic antigen-related cell adhesion molecule 6 (CEACAM6) promotes EGF receptor signaling of oral squamous cell carcinoma metastasis via the complex N-glycosylation y Chiang et al. Supplemental
SUPPLEMENTAL FIGURE LEGENDS
 SUPPLEMENTAL FIGURE LEGENDS Supplemental Figure S1: Endogenous interaction between RNF2 and H2AX: Whole cell extracts from 293T were subjected to immunoprecipitation with anti-rnf2 or anti-γ-h2ax antibodies
Control shrna#9 shrna#12. shrna#12 CD14-PE CD14-PE
 a Control shrna#9 shrna#12 c Control shrna#9 shrna#12 e Control shrna#9 shrna#12 h 14 12 CFU-E BFU-E GEMM GM b Colony number 7 6 5 4 3 2 1 6 pm A pa pc CFU-E BFU-E GEMM GM pu pgm A p pg B d f CD11b-APC
a study of 754 cases highlighting potential pitfalls and guidelines for
 Histopathology 2016 DOI: 10.1111/his.12992 BRAF V600E and NRAS Q61L/Q61R mutation analysis in metastatic melanoma using immunohistochemistry: a study of 754 cases highlighting potential pitfalls and guidelines
Supplementary Information. Induction of p53-independent apoptosis by ectopic expression of HOXA5
 Supplementary Information Induction of p53-independent apoptosis by ectopic expression of in human liposarcomas Dhong Hyun Lee 1, *, Charles Forscher 1, Dolores Di Vizio 2, 3, and H. Phillip Koeffler 1,
7/6/2015. Cancer Related Deaths: United States. Management of NSCLC TODAY. Emerging mutations as predictive biomarkers in lung cancer: Overview
 Emerging mutations as predictive biomarkers in lung cancer: Overview Kirtee Raparia, MD Assistant Professor of Pathology Cancer Related Deaths: United States Men Lung and bronchus 28% Prostate 10% Colon
fl/+ KRas;Atg5 fl/+ KRas;Atg5 fl/fl KRas;Atg5 fl/fl KRas;Atg5 Supplementary Figure 1. Gene set enrichment analyses. (a) (b)
 (b)") KRas;At KRas;At KRas;At KRas;At a b Supplementary Figure 1. Gene set enrichment analyses. (a) GO gene sets (MSigDB v3. c5) enriched in KRas;Atg5 fl/+ as compared to KRas;Atg5 fl/fl tumors using gene set
KRas;At KRas;At KRas;At KRas;At a b Supplementary Figure 1. Gene set enrichment analyses. (a) GO gene sets (MSigDB v3. c5) enriched in KRas;Atg5 fl/+ as compared to KRas;Atg5 fl/fl tumors using gene set
Opposing activities of the Ras and Hippo pathways converge on regulation of YAP protein turnover
 The EMBO Journal Peer Review Process File - EMBO-2014-89385 Manuscript EMBO-2014-89385 Opposing activities of the Ras and Hippo pathways converge on regulation of YAP protein turnover Xin Hong, Hung Thanh
PRECISION INSIGHTS. Liquid GPS. Blood-based tumor profiling and quantitative monitoring. Reveal more with cfdna + cfrna.
 PRECISION INSIGHTS Liquid GPS Blood-based tumor profiling and quantitative monitoring Reveal more with cfdna + cfrna www.nanthealth.com Why Blood-Based Tumor Profiling? Although tissue-based molecular
SUPPLEMENTARY INFORMATION
 DOI: 10.1038/ncb2566 Figure S1 CDKL5 protein expression pattern and localization in mouse brain. (a) Multiple-tissue western blot from a postnatal day (P) 21 mouse probed with an antibody against CDKL5.
Lentiviral Delivery of Combinatorial mirna Expression Constructs Provides Efficient Target Gene Repression.
 Supplementary Figure 1 Lentiviral Delivery of Combinatorial mirna Expression Constructs Provides Efficient Target Gene Repression. a, Design for lentiviral combinatorial mirna expression and sensor constructs.
Rationale and results from. BRAFi and immunotherapy
 Rationale and results from emerging combinations of BRAFi and immunotherapy Antoni Ribas, M.D. rofessor of Medicine rofessor of Surgery rofessor of Molecular and Medical harmacology Director, Tumor Immunology