Supplementary Figure 1: Additional metabolic parameters of obesity mouse models and controls. (a) Body weight, (b) blood glucose and (c) insulin
|
|
|
- Antony Powers
- 5 years ago
- Views:
Transcription
1 Supplementary Figure 1: Additional metabolic parameters of obesity mouse models and controls. (a) Body weight, (b) blood glucose and (c) insulin resistance index of homeostatic model assessment (HOMA IR) of 20 week-old chow fed (Chow), diet-induced obese (DIO) C57BL/6 mice, and 23 week old ob/ob mice under study (n = 6 per group). (d) qpcr analysis of hepatic vigilin transcript levels. Data are shown as relative expression levels. All values are expressed as mean ± s.d. **P 0.01, ***P 0.001; p-values were determined ANOVA with Holm-Sidak post hoc analysis. 1
 Male C57BL/6 mice, 8 weeks of age, were injected with either Ad-GFP (n = 5) or Ad-VIGILIN (n = 5) and studied 7 days postinjection.")
2 Supplementary Figure 2: Gene expression and metabolic parameters following overexpression or silencing of vigilin. (a-f) Male C57BL/6 mice, 8 weeks of age, were injected with either Ad-GFP (n = 5) or Ad-VIGILIN (n = 5) and studied 7 days postinjection. (a) Multiple tissue immunoblot, (b) liver triglycerides, (c) liver oil red O stainings (scale bar = 10µm), (d) blood glucose, (e) insulin and (f) alanine transaminase (ALT) levels. (g-r) 10 week old chow fed and 20 week old diet-induced obese C57BL/6 mice (DIO) were injected with either Ad-shCtrl (n = 6, chow diet; n = 8, DIO), Ad-shVig (n = 6, chow diet; n = 8, DIO) or PBS (n = 3, chow diet and DIO) and studied 10 days postinjection. (g) Multiple tissue immunoblot indicating, (h) qpcr analysis of liver inflammation markers NfkB, 2
3 TNFa and IL6 and plasma ALT levels in (i) chow fed and (j) DIO mice. Blood glucose in (k) chow fed and (l) DIO mice as well as plasma insulin levels in (m) chow fed and (n) DIO mice. (o) Liver triglyceride levels and (p) respective liver oil red O stainings of chow fed mice (scale bar = 10µm). (q) Blood triglyceride and (r) non-esterified fatty acid (NEFA) levels in chow fed mice injected with Ad-shVig and control Ad-shCtrl or PBS. (s) d correlation of hepatic vigilin levels with plasma triglycerides, NEFA and cholesterol levels upon adenovirus-induced knockdown in DIO mice. All values are expressed as mean ± s.d. *P 0.05, **P 0.01, ***P 0.001; P-values were determined using student's t-test (b, d-f) or ANOVA with Holm-Sidak post hoc analysis (h-o, q, r). R 2 were determined by two-tailed Pearson s correlation test in s. 3
4 Supplementary Figure 3: Electrophoretic Mobility Shift Assays (EMSAs) using recombinant VIGILIN. (a) Spatial kernel density estimation of binding sites across CDS exons. On the y-axis the density distribution is shown, on the x-axis N is the number of binding sites in CDS exons (N = 1447) is shown with a smoothening 4
5 bandwidth of 5. The signal of the clusters (red line) shows an even distribution across the CDS exons within the probability range of the background distal distribution (blue and grey, color shaded according to probability percentiles). The black line indicates the average background probability distribution, dark blue indicates 50th percentile smoothened background distribution, bright blue indicates 75th percentile smoothened background distribution, grey lines indicate sampled individual background probabilities. (b-c) Synthetic RNAs (10 nm) were radiolabeled, incubated with 2 μm His 6 -tagged VIGILIN recombinant protein and separated on a 1% agarose gel. (b) An 18-nt long RNA sequence containing 5x CCU-repeats was systematically mutated at two adjacent sites with As (underlined) and used for EMSAs. Shifts were only observed with sequences containing a CYYC-2nt-CYYC RRE (in which Y=C/U). CYYC-2nt-CYYC RRE is indicated in bold letters. (c) EMSA using CCU-trinucleotides with various repeats (left and middle panel), and repeats with A-flanking sites indicate that sequences 18 nt containing 4 CCU repeats are required for efficient RNA binding. 5
6 6
7 Supplementary Figure 4: Characterization and regulation of strongest vigilin targets. (a) 78 of the top 100 vigilin targets identified by PAR-CLIP are secretory pathway proteins either containing a signal peptide (SignalP; 33), 1 transmembrane domains (26) or both (19). (b) Validation of MS-LFQ data by immunoblotting of six targets from medium of primary hepatocytes isolated from mice that were injected with either Ad-shCtrl or Ad-shVig. ApoM and apoa-i were used as loading controls. (c) Schematic representation illustrating distribution of vigilin binding sites on mrnas under study as identified by PAR-CLIP. Blue lines indicate sites of T-to-C conversion. Gene name, identifier, RPKM and total number of reads as well as T-to-C conversion rates are indicated. (d, e) qpcr analysis of secreted mrna targets among top 100 with highest downregulation of protein levels upon (d) overexpression (n = 6 per group) and (e) knockdown of vigilin (n = 6, Ad-shCtrl; n = 6, Ad-shVig; n = 3, PBS). Data are shown as relative expression levels and as the mean ± s.d. Statistical significance was assessed by student s t-testing (in d) or ANOVA with Holm-Sidak post hoc analysis (in e). All data are shown as the mean ± s.d. (f) Immunoblot analysis of targets from blood plasma in 20 week-old chow fed (Chow) or high-fat diet C57BL/6 (DIO) and in 23 week old ob/ob mice. 7
8 Supplementary Figure 5: Characterization of apob, fetuin-a and VLDL and triglyceride clearance. (a, b) Half-lives of apob and fetuin-a remained unchanged upon vigilin knockdown. Primary hepatocytes were treated with cycloheximide for translational inhibition and harvested at indicated time points for half-life assessment of (a) apob and (b) fetuin-a by immunoblotting (upper panel). Lower panel: Graphs illustrate densitometric readout from band intensities. (c) LPLactivities from overexpression and knockdown experiments (n = 6 per group). (d) VLDL clearance upon hepatic knockdown of vigilin using 10 week old mice. 3 H- radiolabeled VLDL was injected into mice treated with Ad-shCtrl or Ad-shVig (n = 6 per group) prior to blood collection at indicated time points postinjection. Extracted blood plasma samples were subjected to scintillation-counting for quantification of VLDL clearance rates. Statistical significance was assessed by student s t-testing or ANOVA with Tukey s post hoc analysis. Data in c and d are shown as the mean ± s.d. 8
9 Supplementary Figure 6: Characterization of long-term knockdown of hepatic vigilin in Ldlr / mice. (a) Tissue panel indicating liver specific knockdown of vigilin from mice treated with sivig-galnac#1 as opposed to PBS treated mice for 18 weeks starting at 4 weeks of age.. (b) Blood alanine transaminase (ALT) levels after 18 weeks of treatment with PBS, GalNAc#1 or GalNAc#2 (n = 8 per group). Statistical significance was determined by ANOVA with Holm-Sidak post hoc analysis. All data are shown as the mean ± s.d. 9
10 10
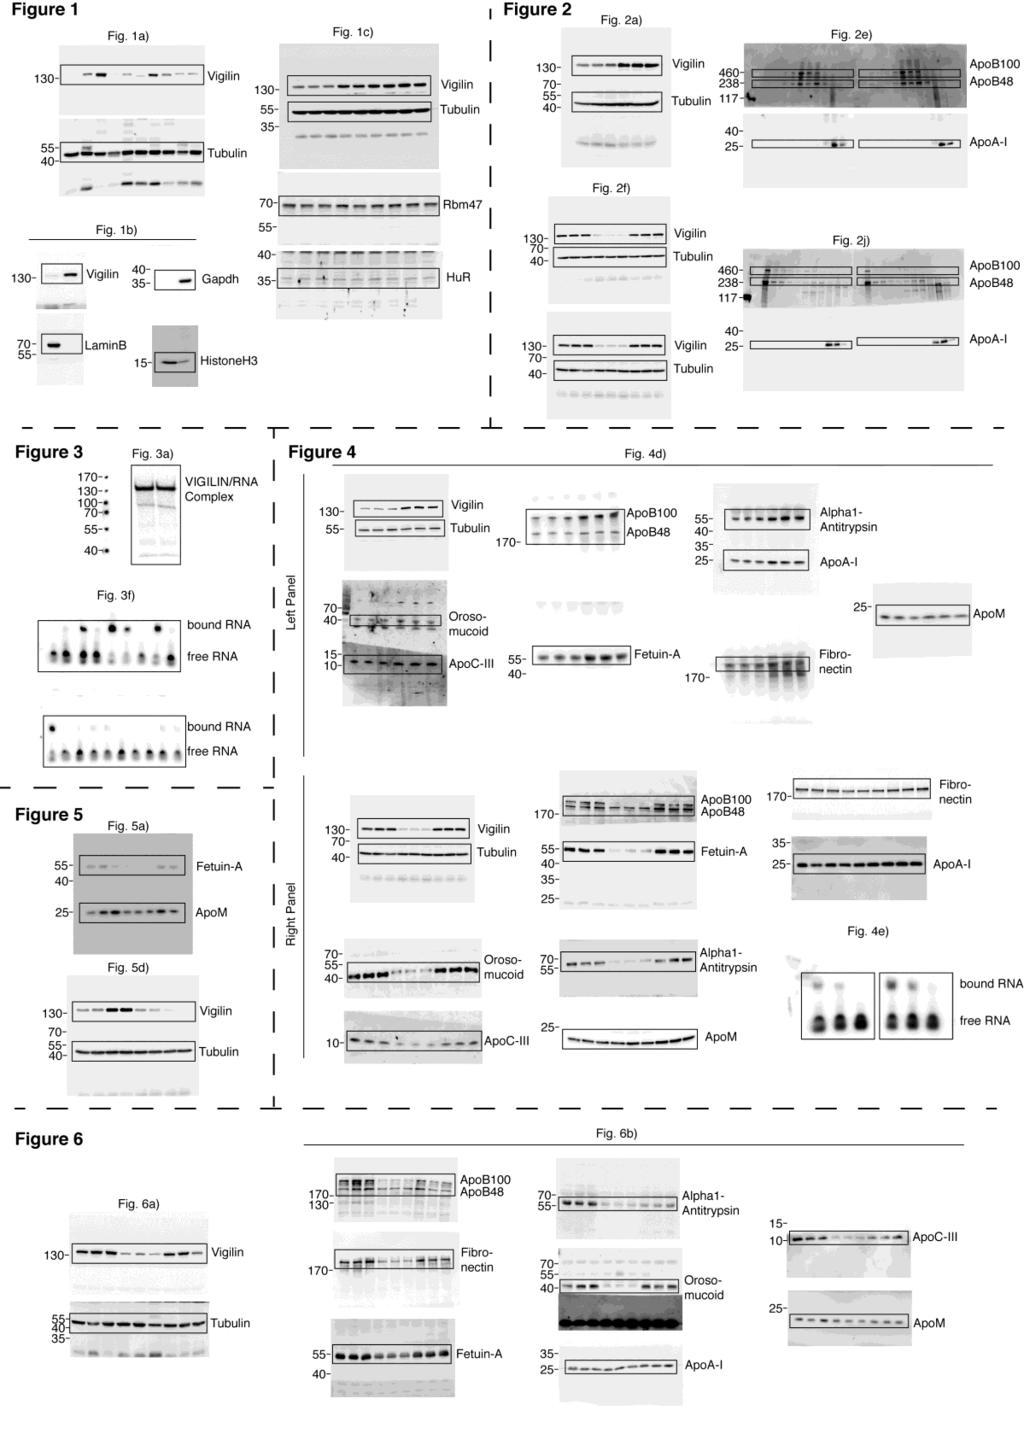
11 Supplementary Figure 7: Uncropped images of blots used in main figures. The number of the corresponding figure is shown above the panels. Regions used for figures are boxed. The position of the molecular mass markers is shown on the left in kda. 11
12 12
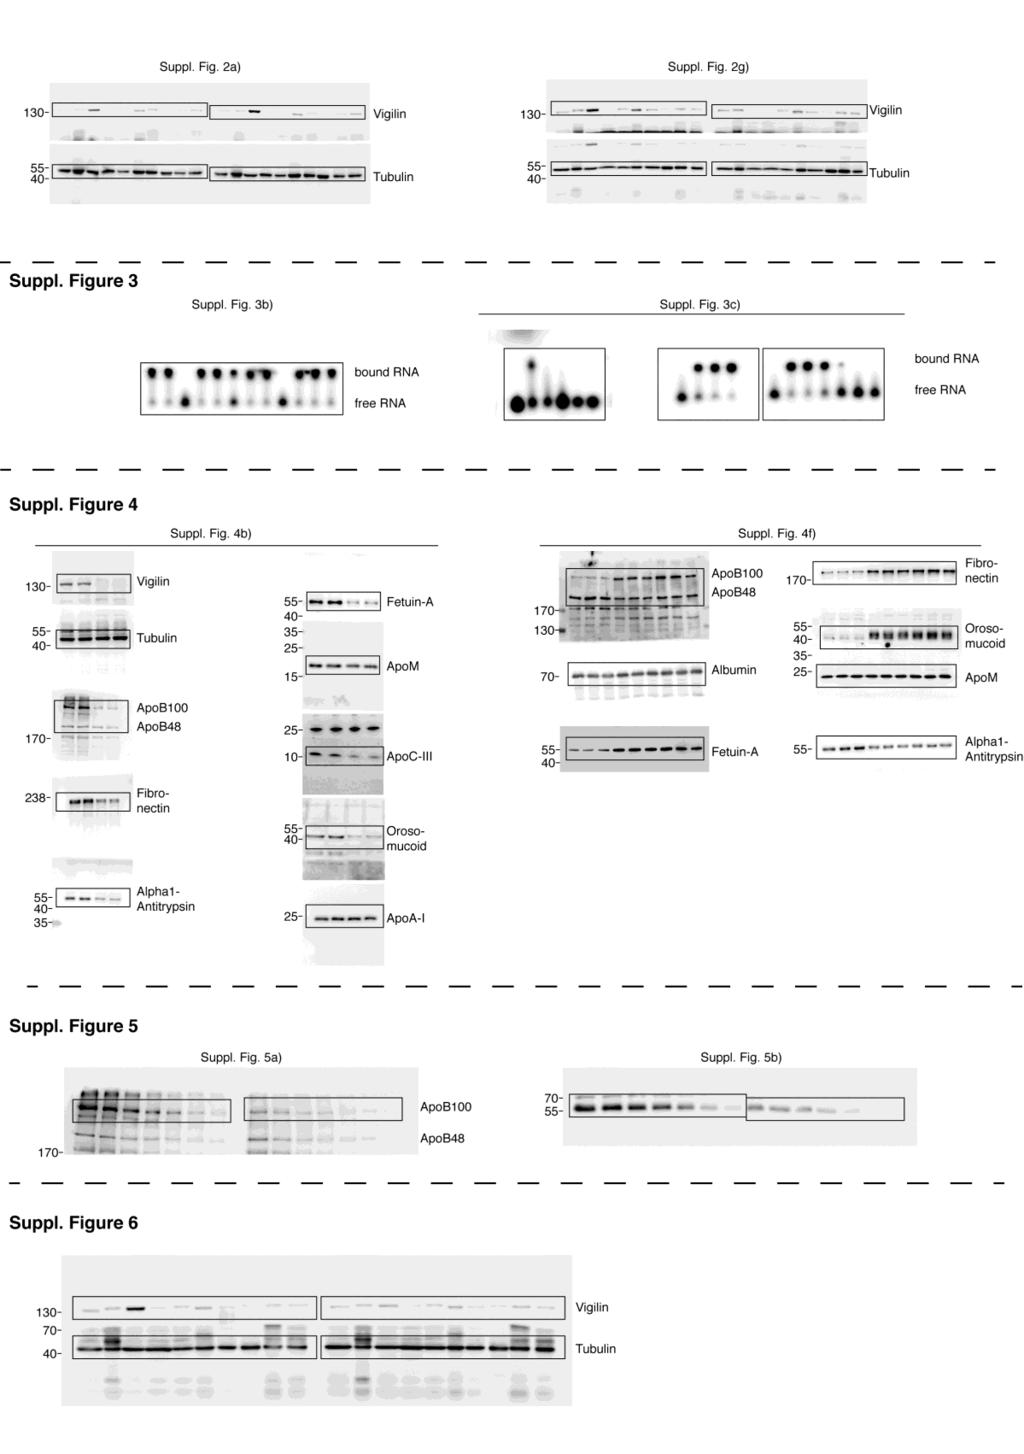
13 Supplementary Figure 8: Uncropped images of blots and gels used in supplemental figures. Number of the corresponding figure is shown above the panels. Regions used for figures are boxed. Position of the molecular mass markers is shown on the left in kda. 13
14 Diagnosis n %Steatosis BMI AST (U/L) ALT (U/L) Healthy ± ± ± ± 18.7 NAFLD ± ± ± ± 23.1 NASH ± ± ± ± 35.6 Supplementary Table 1: Human data including patients with non-alcoholic fatty liver disease (NAFLD) and non-alcoholic steatohepatitis (NASH). Liver biopsies from patients under study for VIGILIN expression (main figure) and their corresponding body mass index (BMI), degree of steatosis as well as blood alanine (ALT) and aspartate (AST) transaminase levels. All values are shown as mean ± s.d. 14
15 Supplementary Table 2 Oligo Sequences used for qpcr Gene Fw/Rev Sequence Serpina1b Forward CAATGGGGCTGACCTCTCT GCACAGCCTTATGCACAGC Fn1 Forward CGGAGAGAGTGCCCCTACTA CGATATTGGTGAATCGCAGA ApoA1 Forward TATGTGGATGCGGTCAAAGA TGAACCCAGAGTGTCCCAGT Orm1 Forward ATTTGTCGACTGGAAAAAGGAT TGAGTTGGGGAAGGAGACC ApoM Forward CCCAGACATGAAAACAGACCT GGGTGTGGTGACCGATTG Hdlbp Forward TCTGGCTAAAGATCAAGGTCTCT GCCAATAACAAAGCGATGGTG Ahsg Forward ATACCAACGTGGTCCACACC AACTCCACCAGAGTAGACACTGG Apob Forward TGTACAACTGGTCAGCCTCCTACAC TGGTGTAGAGATCCATCACAGGAC Actb Forward CTAAGGCCAACCGTGAAAAG ACCAGAGGCATACAGGGACA Apoc3 Forward CGCTAAGTAGCGTGCAGGA GGGATCTGAAGTGATTGTCCA Actb Forward CTAAGGCCAACCGTGAAAAG ACCAGAGGCATACAGGGACA Nfkb Forward GACCACTGCTCAGGTCCACT TGTCACTATCCCGGAGTTCA Tnfa Forward AAATGGCCTCCCTCTCATCA AGATAGCAAATCGGCTGACG Il6 Forward TGATGGATGCTACCAAACTGG TTCATGTACTCCAGGTAGCTATGG GalNAc conjugated sirnas 15
16 GalNAc#1 Sense: Antisense: 5'-3' GfsasGfaUfcAfaCfAfUfuGfaCfcAfuAfaAfL96 5'-3' usufsuafugfgufcafaugufugfaufcufcsusa GalNAc#2 Sense: Antisense: 5'-3' AfsgsGfaAfgAfuCfGfGfgCfuUfuAfaGfgAfL96 5'-3 uscfscufuafaafgcfccgafucfuufccfusgsc Nf n s L96 = 2 Fluoro bases = 2 O Methyl bases = Phosphorothioate = GalNAc trivalent shrna sequences in adenovirus sh.ctrl CAACAAGATGAAGAGCACCAACTCGAGTTGGTGCTCTTCATCT TGTTG shvig#1 GCTCGCATTAAGAAGATTTATCTCGAGATAAATCTTCTTAATGC GAGC shvig#2 CCAGAGGTTATCATCAACTTTCTCGAGAAAGTTGATGATAACCT CTGG Supplementary Table 2: List of sequences for DNA oligos, shrnas and GalNAc-conjugated sirnas used in this study. 16
Supplementary Figure 1
 Supplementary Figure 1 A B mir-141, human cell lines mir-2c, human cell lines mir-141, hepatocytes mir-2c, hepatocytes Relative RNA.1.8.6.4.2 Relative RNA.3.2.1 Relative RNA 1.5 1..5 Relative RNA 2. 1.5
Supplementary Figure 1. DNA methylation of the adiponectin promoter R1, Pparg2, and Tnfa promoter in adipocytes is not affected by obesity.
 Supplementary Figure 1. DNA methylation of the adiponectin promoter R1, Pparg2, and Tnfa promoter in adipocytes is not affected by obesity. (a) Relative amounts of adiponectin, Ppar 2, C/ebp, and Tnf mrna
Supplementary Figure S I: Effects of D4F on body weight and serum lipids in apoe -/- mice.
 Supplementary Figures: Supplementary Figure S I: Effects of D4F on body weight and serum lipids in apoe -/- mice. Male apoe -/- mice were fed a high-fat diet for 8 weeks, and given PBS (model group) or
Supplementary Figure 1
 Supplementary Figure 1 Supplementary Figure 1 Schematic depiction of the tandem Fc GDF15. Supplementary Figure 2 Supplementary Figure 2 Gfral mrna levels in the brains of both wild-type and knockout Gfral
Supplemental Table 1. Plasma NEFA and liver triglyceride levels in ap2-hif1ako and ap2-hif2ako mice under control and high fat diets.
 Supplemental Table 1. Plasma NEFA and liver triglyceride levels in Hif1aKO and Hif2aKO mice under control and high fat diets. Hif1a (n=6) Hif1aK O (n=6) Hif2a Hif2aK O Hif1a (n=5) Hif1aKO (n=5) Hif2a Hif2aK
Supplementary Table 1. Metabolic parameters in GFP and OGT-treated mice
 Supplementary Table 1. Metabolic parameters in GFP and OGT-treated mice Fasted Refed GFP OGT GFP OGT Liver G6P (mmol/g) 0.03±0.01 0.04±0.02 0.60±0.04 0.42±0.10 A TGs (mg/g of liver) 20.08±5.17 16.29±0.8
18s AAACGGCTACCACATCCAAG CCTCCAATGGATCCTCGTTA. 36b4 GTTCTTGCCCATCAGCACC AGATGCAGCAGATCCGCAT. Acc1 AGCAGATCCGCAGCTTG ACCTCTGCTCGCTGAGTGC
 Supplementary Table 1. Quantitative PCR primer sequences Gene symbol Sequences (5 to 3 ) Forward Reverse 18s AAACGGCTACCACATCCAAG CCTCCAATGGATCCTCGTTA 36b4 GTTCTTGCCCATCAGCACC AGATGCAGCAGATCCGCAT Acc1
1.5 ASK1KO fed. fasted 16 hrs w/o water. Fed. 4th. 4th WT ASK1KO N=29, 11(WT), ,5(ASK1KO) ASK1KO ASK1KO **** Time [h]
![1.5 ASK1KO fed. fasted 16 hrs w/o water. Fed. 4th. 4th WT ASK1KO N=29, 11(WT), ,5(ASK1KO) ASK1KO ASK1KO **** Time [h]](/thumbs/87/97258189.jpg "1.5 ASK1KO fed. fasted 16 hrs w/o water. Fed. 4th. 4th WT ASK1KO N=29, 11(WT), ,5(ASK1KO) ASK1KO ASK1KO **** Time [h]") 7: 13: 19: 1: 7: 151117 a 151117 4th 4th b c RQ.95 KO.9.85.8.75.7 light dark light dark.65 7: 19: 7: 19: 7: Means ± SEM, N=6 RQ 1..9.8.7.6.6 KO CL (-) CL (+) ibat weight ratio (/body weight) [%].5.4.3.2.1
7: 13: 19: 1: 7: 151117 a 151117 4th 4th b c RQ.95 KO.9.85.8.75.7 light dark light dark.65 7: 19: 7: 19: 7: Means ± SEM, N=6 RQ 1..9.8.7.6.6 KO CL (-) CL (+) ibat weight ratio (/body weight) [%].5.4.3.2.1
SUPPLEMENTARY INFORMATION
 DOI: 10.1038/ncb3461 In the format provided by the authors and unedited. Supplementary Figure 1 (associated to Figure 1). Cpeb4 gene-targeted mice develop liver steatosis. a, Immunoblot displaying CPEB4
Supplementary Fig. 1 eif6 +/- mice show a reduction in white adipose tissue, blood lipids and normal glycogen synthesis. The cohort of the original
 Supplementary Fig. 1 eif6 +/- mice show a reduction in white adipose tissue, blood lipids and normal glycogen synthesis. The cohort of the original phenotypic screening was n=40. For specific tests, the
Supplementary Figure 1. PAQR3 knockdown inhibits SREBP-2 processing in CHO-7 cells CHO-7 cells were transfected with control sirna or a sirna
 Supplementary Figure 1. PAQR3 knockdown inhibits SREBP-2 processing in CHO-7 cells CHO-7 cells were transfected with control sirna or a sirna targeted for hamster PAQR3. At 24 h after the transfection,
Identified proteins interacting with TMBIM1 by mass spectrometry
 Supplementary Information Journal: Nature Medicine Article Title: Corresponding Author: A novel multivesicular body regulator TMBIM1 protects against non-alcoholic fatty liver disease in mice and monkeys
SUPPLEMENTARY INFORMATION
 doi:10.1038/nature12652 Supplementary Figure 1. PRDM16 interacts with endogenous EHMT1 in brown adipocytes. Immunoprecipitation of PRDM16 complex by flag antibody (M2) followed by Western blot analysis
The RNA-binding protein vigilin regulates VLDL secretion through modulation of Apob mrna translation
 ARTICLE Received 26 Feb 216 Accepted 1 Aug 216 Published 26 Sep 216 DOI: 1.138/ncomms12848 OPEN The RNA-binding protein vigilin regulates VLDL secretion through modulation of Apob mrna translation Mehrpouya
Supplementary Figure 1
 Supplementary Figure 1 AAV-GFP injection in the MEC of the mouse brain C57Bl/6 mice at 4 months of age were injected with AAV-GFP into the MEC and sacrificed at 7 days post injection (dpi). (a) Brains
Supplementary Figure 1. Repression of hepcidin expression in the liver of mice treated with
 Supplementary Figure 1. Repression of hepcidin expression in the liver of mice treated with DMN Immunohistochemistry for hepcidin and H&E staining (left). qrt-pcr assays for hepcidin in the liver (right).
Supplementary Figure S1. Effect of Glucose on Energy Balance in WT and KHK A/C KO
 Supplementary Figure S1. Effect of Glucose on Energy Balance in WT and KHK A/C KO Mice. WT mice and KHK-A/C KO mice were provided drinking water containing 10% glucose or tap water with normal chow ad
Supplementary Figure 1. Expression of CUGBP1 in non-parenchymal liver cells treated with TGF-β
 Supplementary Figures Supplementary Figure 1. Expression of CUGBP1 in non-parenchymal liver cells treated with TGF-β and LPS. Non-parenchymal liver cells were isolated and treated with or without TGF-β
Ct=28.4 WAT 92.6% Hepatic CE (mg/g) P=3.6x10-08 Plasma Cholesterol (mg/dl)
 P=3.6x10-08 Plasma Cholesterol (mg/dl)") a Control AAV mtm6sf-shrna8 Ct=4.3 Ct=8.4 Ct=8.8 Ct=8.9 Ct=.8 Ct=.5 Relative TM6SF mrna Level P=.5 X -5 b.5 Liver WAT Small intestine Relative TM6SF mrna Level..5 9.6% Control AAV mtm6sf-shrna mtm6sf-shrna6
a Control AAV mtm6sf-shrna8 Ct=4.3 Ct=8.4 Ct=8.8 Ct=8.9 Ct=.8 Ct=.5 Relative TM6SF mrna Level P=.5 X -5 b.5 Liver WAT Small intestine Relative TM6SF mrna Level..5 9.6% Control AAV mtm6sf-shrna mtm6sf-shrna6
The clathrin adaptor Numb regulates intestinal cholesterol. absorption through dynamic interaction with NPC1L1
 The clathrin adaptor Numb regulates intestinal cholesterol absorption through dynamic interaction with NPC1L1 Pei-Shan Li 1, Zhen-Yan Fu 1,2, Ying-Yu Zhang 1, Jin-Hui Zhang 1, Chen-Qi Xu 1, Yi-Tong Ma
Supplementary Figure 1. AdipoR1 silencing and overexpression controls. (a) Representative blots (upper and lower panels) showing the AdipoR1 protein
 Representative blots (upper and lower panels) showing the AdipoR1 protein") Supplementary Figure 1. AdipoR1 silencing and overexpression controls. (a) Representative blots (upper and lower panels) showing the AdipoR1 protein content relative to GAPDH in two independent experiments.
Supplementary Figure 1. AdipoR1 silencing and overexpression controls. (a) Representative blots (upper and lower panels) showing the AdipoR1 protein content relative to GAPDH in two independent experiments.
Over-expression of MKP-3 and knockdown of MKP-3 and FOXO1 in primary rat. day, cells were transduced with adenoviruses expressing GFP, MKP-3 or shgfp,
 SUPPLEMENTAL METHODS Over-expression of MKP-3 and knockdown of MKP-3 and FOXO1 in primary rat hepatocytes Primary rat hepatocytes were seeded as described in experimental procedures. The next day, cells
a Supplementary Figure 1 Celastrol Withaferin A Individual drugs
 Supplementary Figure 1 a 17 27 HSPA1A SLC7A11 HMOX1 GSTA1 DUSP4 GML CHAC1 CDKN1A GSTA4 CA6 BHLHE41 NR1D1 HSPB1 PTX3 HP NFKBIA VDR MVD HAS2 ANGPT1 WDR6 TGFB3 IDI1 VCAM1 H1F HMGCS1 CXCL5 STEAP4 NOS2 b Enrichment
AAV-TBGp-Cre treatment resulted in hepatocyte-specific GH receptor gene recombination
 AAV-TBGp-Cre treatment resulted in hepatocyte-specific GH receptor gene recombination Supplementary Figure 1. Generation of the adult-onset, liver-specific GH receptor knock-down (alivghrkd, Kd) mouse
GFP/Iba1/GFAP. Brain. Liver. Kidney. Lung. Hoechst/Iba1/TLR9!
 Supplementary information a +KA Relative expression d! Tlr9 5!! 5! NSC Neuron Astrocyte Microglia! 5! Tlr7!!!! NSC Neuron Astrocyte! GFP/Sβ/! Iba/Hoechst Microglia e Hoechst/Iba/TLR9! GFP/Iba/GFAP f Brain
FH- FH+ DM. 52 Volunteers. Oral & IV Glucose Tolerance Test Hyperinsulinemic Euglycemic Clamp in Non-DM Subjects ACADSB MYSM1. Mouse Skeletal Muscle
 A 52 Volunteers B 6 5 4 3 2 FH- FH+ DM 1 Oral & IV Glucose Tolerance Test Hyperinsulinemic Euglycemic Clamp in Non-DM Subjects ZYX EGR2 NR4A1 SRF target TPM1 ACADSB MYSM1 Non SRF target FH- FH+ DM2 C SRF
Yun-Jung Choi, Jiangao Song, Jeff D. Johnson, Charles McWherter. NASH-TAG Conference Park City, Utah January 4, 2019
 Combination Therapy of Seladelpar and Liraglutide Attenuates Obesity, Hepatic Steatosis and Fibrosis in a Diet-induced and Biopsy-confirmed Mouse Model of NASH Yun-Jung Choi, Jiangao Song, Jeff D. Johnson,
General Laboratory methods Plasma analysis: Gene Expression Analysis: Immunoblot analysis: Immunohistochemistry:
 General Laboratory methods Plasma analysis: Plasma insulin (Mercodia, Sweden), leptin (duoset, R&D Systems Europe, Abingdon, United Kingdom), IL-6, TNFα and adiponectin levels (Quantikine kits, R&D Systems
Supplementary Figure 1. DJ-1 modulates ROS concentration in mouse skeletal muscle.
 Supplementary Figure 1. DJ-1 modulates ROS concentration in mouse skeletal muscle. (a) mrna levels of Dj1 measured by quantitative RT-PCR in soleus, gastrocnemius (Gastroc.) and extensor digitorum longus
Table S1. Quantitative RT-PCR primers
 Table S1. Quantitative RT-PCR primers Gene Forward Primer Reverse Primer Human ApoB gcaagcagaagccagaagta ccatttggagaagcagtttgg Human ApoA1 gaaagctgcggtgctgac agtggccaggtccttcact Human MTP acggccattcccattgtg
SUPPLEMENTARY INFORMATION
 doi:10.1038/nature12215 Supplementary Figure 1. The effects of full and dissociated GR agonists in supporting BFU-E self-renewal divisions. BFU-Es were cultured in self-renewal medium with indicated GR
Supplementary Figure 1: Co-localization of reconstituted L-PTC and dendritic cells
 a CD11c Na + K + ATPase Na + K + ATPase CD11c x-y CD11c Na + K + ATPase Na + K + ATPase CD11c x-z c b x-y view BoNT NAPs CD11c BoNT CD11c NAPs BoNT NAPs CD11c 90 x-z view Apical Basolateral Supplementary
Supplementary Figure 1. Confocal immunofluorescence showing mitochondrial translocation of Drp1. Cardiomyocytes treated with H 2 O 2 were prestained
 Supplementary Figure 1. Confocal immunofluorescence showing mitochondrial translocation of Drp1. Cardiomyocytes treated with H 2 O 2 were prestained with MitoTracker (red), then were immunostained with
Supplementary Figure 1. Establishment of prostacyclin-secreting hmscs. (a) PCR showed the integration of the COX-1-10aa-PGIS transgene into the
 PCR showed the integration of the COX-1-10aa-PGIS transgene into the") Supplementary Figure 1. Establishment of prostacyclin-secreting hmscs. (a) PCR showed the integration of the COX-1-10aa-PGIS transgene into the genomic DNA of hmscs (PGI2- hmscs). Native hmscs and plasmid
Supplementary Figure 1. Establishment of prostacyclin-secreting hmscs. (a) PCR showed the integration of the COX-1-10aa-PGIS transgene into the genomic DNA of hmscs (PGI2- hmscs). Native hmscs and plasmid
Supplementary Figure 1. PD-L1 is glycosylated in cancer cells. (a) Western blot analysis of PD-L1 in breast cancer cells. (b) Western blot analysis
 Western blot analysis of PD-L1 in breast cancer cells. (b) Western blot analysis") Supplementary Figure 1. PD-L1 is glycosylated in cancer cells. (a) Western blot analysis of PD-L1 in breast cancer cells. (b) Western blot analysis of PD-L1 in ovarian cancer cells. (c) Western blot analysis
Supplementary Figure 1. PD-L1 is glycosylated in cancer cells. (a) Western blot analysis of PD-L1 in breast cancer cells. (b) Western blot analysis of PD-L1 in ovarian cancer cells. (c) Western blot analysis
Supplementary Information: Figures 1-6 and Table 1 RNAi-Mediated Gene Silencing in Non-Human Primate Zimmermann, T.S. et al.
 Supplementary Information: Figures 1-6 and Table 1 RNAi-Mediated Gene Silencing in Non-Human Primate Zimmermann, T.S. et al. a. 12 14 Relative apob mrna (%) 8 6 4 2 Relative apob mrna (%) 12 8 6 4 2 5
Grade of steatosis. group Case No. Supplementary Figure 1:
 a Supplementary Figure 1: b group Case No Grade of steatosis 15m AL 2746 NN 1 15m AL 2746 BN 1 15m AL 2638 2LN 3 15m AL 2638 2RN 3 12m AL 2640 RN 0 12m AL 2640 BN 1 12m AL 2640 LN 2 12m AL 2635 NN 2 12m
Supplementary Table 1. List of primers used in this study
 Supplementary Table 1. List of primers used in this study Gene Forward primer Reverse primer Rat Met 5 -aggtcgcttcatgcaggt-3 5 -tccggagacacaggatgg-3 Rat Runx1 5 -cctccttgaaccactccact-3 5 -ctggatctgcctggcatc-3
Salt-inducible kinase 2 links transcriptional coactivator p300 phosphorylation to the prevention of ChREBP-dependent hepatic steatosis in mice
 Salt-inducible kinase 2 links transcriptional coactivator p300 phosphorylation to the prevention of ChREBP-dependent hepatic steatosis in mice Julien Bricambert,, Catherine Postic, Renaud Dentin J Clin
Supplementary Figure S1. Venn diagram analysis of mrna microarray data and mirna target analysis. (a) Western blot analysis of T lymphoblasts (CLS)
 Western blot analysis of T lymphoblasts (CLS)") Supplementary Figure S1. Venn diagram analysis of mrna microarray data and mirna target analysis. (a) Western blot analysis of T lymphoblasts (CLS) and their exosomes (EXO) in resting (REST) and activated
Supplementary Figure S1. Venn diagram analysis of mrna microarray data and mirna target analysis. (a) Western blot analysis of T lymphoblasts (CLS) and their exosomes (EXO) in resting (REST) and activated
Supplementary Information
 Supplementary Information Supplementary Figures and Figure Legends Supplementary Figure 1 A. HDL-C (mg/dl) 14 12 1 8 6 4 2 Noncarriers HDL Cholesterol **** Carriers B. apoa-i (mg/dl) 325 3 275 25 225 2
 Supplementary Figure 1 a OD c. 1. 1... Time [min] 1 p
 Supplemental Table 1. List of primers used for real time PCR.
 Supplemental Table 1. List of primers used for real time PCR. Primer Sequence Primer Sequence Mouse Pcsk9-F TTGCAGCAGCTGGGAACTT Mouse Scd1-F CATCATTCTCATGGTCCTGCT Mouse Pcsk9-R CCGACTGTGATGACCTCTGGA Mouse
RNA interference induced hepatotoxicity results from loss of the first synthesized isoform of microrna-122 in mice
 SUPPLEMENTARY INFORMATION RNA interference induced hepatotoxicity results from loss of the first synthesized isoform of microrna-122 in mice Paul N Valdmanis, Shuo Gu, Kirk Chu, Lan Jin, Feijie Zhang,
Supplementary Materials for
 www.sciencesignaling.org/cgi/content/full/6/283/ra57/dc1 Supplementary Materials for JNK3 Couples the Neuronal Stress Response to Inhibition of Secretory Trafficking Guang Yang,* Xun Zhou, Jingyan Zhu,
Supplementary Figure 1: si-craf but not si-braf sensitizes tumor cells to radiation.
 Supplementary Figure 1: si-craf but not si-braf sensitizes tumor cells to radiation. (a) Embryonic fibroblasts isolated from wildtype (WT), BRAF -/-, or CRAF -/- mice were irradiated (6 Gy) and DNA damage
Central injection of fibroblast growth factor 1 induces sustained remission of diabetic hyperglycemia in rodents
 Central injection of fibroblast growth factor 1 induces sustained remission of diabetic hyperglycemia in rodents Jarrad M Scarlett 1,,1, Jennifer M Rojas 1,1, Miles E Matsen 1, Karl J Kaiyala 3, Darko
Supplementary Figures
 Supplementary Figures Supplementary Figure 1 Characterization of stable expression of GlucB and sshbira in the CT26 cell line (a) Live cell imaging of stable CT26 cells expressing green fluorescent protein
GPR120 *** * * Liver BAT iwat ewat mwat Ileum Colon. UCP1 mrna ***
 a GPR120 GPR120 mrna/ppia mrna Arbitrary Units 150 100 50 Liver BAT iwat ewat mwat Ileum Colon b UCP1 mrna Fold induction 20 15 10 5 - camp camp SB202190 - - - H89 - - - - - GW7647 Supplementary Figure
Soluble ADAM33 initiates airway remodeling to promote susceptibility for. Elizabeth R. Davies, Joanne F.C. Kelly, Peter H. Howarth, David I Wilson,
 Revised Suppl. Data: Soluble ADAM33 1 Soluble ADAM33 initiates airway remodeling to promote susceptibility for allergic asthma in early life Elizabeth R. Davies, Joanne F.C. Kelly, Peter H. Howarth, David
AdPLA ablation increases lipolysis and prevents obesity induced by high fat feeding or leptin deficiency
 AdPLA AdPLA ablation increases lipolysis and prevents obesity induced by high fat feeding or leptin deficiency Kathy Jaworski, Maryam Ahmadian, Robin E. Duncan, Eszter Sarkadi-Nagy, Krista A. Va rady,
Supplementary Information
 Supplementary Information mediates STAT3 activation at retromer-positive structures to promote colitis and colitis-associated carcinogenesis Zhang et al. a b d e g h Rel. Luc. Act. Rel. mrna Rel. mrna
Nature Structural & Molecular Biology: doi: /nsmb Supplementary Figure 1. Differential expression of mirnas from the pri-mir-17-92a locus.
 Supplementary Figure 1 Differential expression of mirnas from the pri-mir-17-92a locus. (a) The mir-17-92a expression unit in the third intron of the host mir-17hg transcript. (b,c) Impact of knockdown
Supplementary Materials for
 www.sciencesignaling.org/cgi/content/full/8/407/ra127/dc1 Supplementary Materials for Loss of FTO in adipose tissue decreases Angptl4 translation and alters triglyceride metabolism Chao-Yung Wang,* Shian-Sen
Supplementary Figure 1. Prevalence of U539C and G540A nucleotide and E172K amino acid substitutions among H9N2 viruses. Full-length H9N2 NS
 Supplementary Figure 1. Prevalence of U539C and G540A nucleotide and E172K amino acid substitutions among H9N2 viruses. Full-length H9N2 NS nucleotide sequences (a, b) or amino acid sequences (c) from
EPIGENETIC RE-EXPRESSION OF HIF-2α SUPPRESSES SOFT TISSUE SARCOMA GROWTH
 EPIGENETIC RE-EXPRESSION OF HIF-2α SUPPRESSES SOFT TISSUE SARCOMA GROWTH Supplementary Figure 1. Supplementary Figure 1. Characterization of KP and KPH2 autochthonous UPS tumors. a) Genotyping of KPH2
Early life determinants of Non-Alcoholic Fatty Liver Disease and NASH DR JULIANA MUIVA-GITOBU KENYA PAEDIATRIC ASSOCIATION CONFERENCE APRIL 2016.
 Early life determinants of Non-Alcoholic Fatty Liver Disease and NASH DR JULIANA MUIVA-GITOBU KENYA PAEDIATRIC ASSOCIATION CONFERENCE APRIL 2016. Outline Definition NAFLD and NASH Magnitude of the problem
ILDR2: An Endoplasmic Reticulum Resident Molecule Mediating Hepatic Lipid Homeostasis
 ILDR2: An Endoplasmic Reticulum Resident Molecule Mediating Hepatic Lipid Homeostasis Kazuhisa Watanabe 1, Elizabeth Watson 1., Maria Laura Cremona 1., Elizabeth J. Millings 1, Jay H. Lefkowitch 2, Stuart
Supplementary Information
 Supplementary Information Astrocytes regulate adult hippocampal neurogenesis through ephrin-b signaling Randolph S. Ashton, Anthony Conway, Chinmay Pangarkar, Jamie Bergen, Kwang-Il Lim, Priya Shah, Mina
Figure S1. Reduction in glomerular mir-146a levels correlate with progression to higher albuminuria in diabetic patients.
 Supplementary Materials Supplementary Figures Figure S1. Reduction in glomerular mir-146a levels correlate with progression to higher albuminuria in diabetic patients. Figure S2. Expression level of podocyte
S1a S1b S1c. S1d. S1f S1g S1h SUPPLEMENTARY FIGURE 1. - si sc Il17rd Il17ra bp. rig/s IL-17RD (ng) -100 IL-17RD
 -100 IL-17RD") SUPPLEMENTARY FIGURE 1 0 20 50 80 100 IL-17RD (ng) S1a S1b S1c IL-17RD β-actin kda S1d - si sc Il17rd Il17ra rig/s15-574 - 458-361 bp S1f S1g S1h S1i S1j Supplementary Figure 1. Knockdown of IL-17RD enhances
SUPPLEMENTARY FIGURE 1 0 20 50 80 100 IL-17RD (ng) S1a S1b S1c IL-17RD β-actin kda S1d - si sc Il17rd Il17ra rig/s15-574 - 458-361 bp S1f S1g S1h S1i S1j Supplementary Figure 1. Knockdown of IL-17RD enhances
SUPPLEMENTARY INFORMATION
 SUPPLEMENTARY INFORMATION doi:10.1038/nature11429 S1a 6 7 8 9 Nlrc4 allele S1b Nlrc4 +/+ Nlrc4 +/F Nlrc4 F/F 9 Targeting construct 422 bp 273 bp FRT-neo-gb-PGK-FRT 3x.STOP S1c Nlrc4 +/+ Nlrc4 F/F casp1
Supplementary Figure 1.TRIM33 binds β-catenin in the nucleus. a & b, Co-IP of endogenous TRIM33 with β-catenin in HT-29 cells (a) and HEK 293T cells
 and HEK 293T cells") Supplementary Figure 1.TRIM33 binds β-catenin in the nucleus. a & b, Co-IP of endogenous TRIM33 with β-catenin in HT-29 cells (a) and HEK 293T cells (b). TRIM33 was immunoprecipitated, and the amount of
Supplementary Figure 1.TRIM33 binds β-catenin in the nucleus. a & b, Co-IP of endogenous TRIM33 with β-catenin in HT-29 cells (a) and HEK 293T cells (b). TRIM33 was immunoprecipitated, and the amount of
Supplemental Information. Menin Deficiency Leads to Depressive-like. Behaviors in Mice by Modulating. Astrocyte-Mediated Neuroinflammation
 Neuron, Volume 100 Supplemental Information Menin Deficiency Leads to Depressive-like Behaviors in Mice by Modulating Astrocyte-Mediated Neuroinflammation Lige Leng, Kai Zhuang, Zeyue Liu, Changquan Huang,
Supplementary Table 2. Plasma lipid profiles in wild type and mutant female mice submitted to a HFD for 12 weeks wt ERα -/- AF-1 0 AF-2 0
 Supplementary Table 1. List of specific primers used for gene expression analysis. Genes Primer forward Primer reverse Hprt GCAGTACAGCCCCAAAATGG AACAAAGTCTGGCCTGTATCCA Srebp-1c GGAAGCTGTCGGGGTAGCGTC CATGTCTTCAAATGTGCAATCCAT
Supplementary Information. Glycogen shortage during fasting triggers liver-brain-adipose. neurocircuitry to facilitate fat utilization
 Supplementary Information Glycogen shortage during fasting triggers liver-brain-adipose neurocircuitry to facilitate fat utilization Supplementary Figure S1. Liver-Brain-Adipose neurocircuitry Starvation
SUPPLEMENTARY INFORMATION
 SUPPLEMENTARY INFORMATION doi:10.1038/nature11464 Supplemental Figure S1. The expression of Vegfb is increased in obese and diabetic mice as compared to lean mice. a-b, Body weight and postprandial blood
The antiparasitic drug ivermectin is a novel FXR ligand that regulates metabolism
 Supplementary Information The antiparasitic drug ivermectin is a novel FXR ligand that regulates metabolism Address correspondence to Yong Li (yongli@xmu.edu.cn, Tel: 86-592-218151) GW464 CDCA Supplementary
Supplementary Materials
 Supplementary Materials Supplementary Figure S1 Regulation of Ubl4A stability by its assembly partner A, The translation rate of Ubl4A is not affected in the absence of Bag6. Control, Bag6 and Ubl4A CRISPR
Supplemental Information. Regulatory T Cells Promote Macrophage. Efferocytosis during Inflammation Resolution
 Immunity, Volume 9 Supplemental Information Regulatory T Cells Promote Macrophage Efferocytosis during Inflammation Resolution Jonathan D. Proto, Amanda C. Doran, Galina Gusarova, Arif Yurdagul Jr., Erdi
Supplementary Figure 1. SC35M polymerase activity in the presence of Bat or SC35M NP encoded from the phw2000 rescue plasmid.
 1 2 3 4 5 6 7 8 9 10 11 12 13 14 15 16 17 18 19 20 21 22 23 24 25 26 27 Supplementary Figure 1. SC35M polymerase activity in the presence of Bat or SC35M NP encoded from the phw2000 rescue plasmid. HEK293T
doi: /nature14508 Rappsilber et al.
 SUPPLEMENTARY INFORMATION doi:1.138/nature1458 Grosso et al. Barbosa et al. 74 72 45 33 47 7 51 Rappsilber et al. Supplementary Figure 1 a, Venn-Diagram of identified splice factors in the work of Barbossa
Supplementary Materials and Methods
 Supplementary Materials and Methods Hepatocyte toxicity assay. Freshly isolated hepatocytes were incubated for overnight with varying concentrations (-25 µm) of sodium glycochenodeoxycholate (GCDC) or
SUPPLEMENTARY INFORMATION
 SUPPLEMENTARY INFORMATION FOR Liver X Receptor α mediates hepatic triglyceride accumulation through upregulation of G0/G1 Switch Gene 2 (G0S2) expression I: SUPPLEMENTARY METHODS II: SUPPLEMENTARY FIGURES
Supplementary Figure 1 Induction of cellular senescence and isolation of exosome. a to c, Pre-senescent primary normal human diploid fibroblasts
 Supplementary Figure 1 Induction of cellular senescence and isolation of exosome. a to c, Pre-senescent primary normal human diploid fibroblasts (TIG-3 cells) were rendered senescent by either serial passage
Nature Immunology: doi: /ni Supplementary Figure 1
 Supplementary Figure 1 NLRP12 is downregulated in biopsy samples from patients with active ulcerative colitis (UC). (a-g) NLRP12 expression in 7 UC mrna profiling studies deposited in NCBI GEO database.
Kynamro. Kynamro (mipomersen) Description
 Description") Federal Employee Program 1310 G Street, N.W. Washington, D.C. 20005 202.942.1000 Fax 202.942.1125 5.40.02 Subject: Kynamro Page: 1 of 5 Last Review Date: December 2, 2016 Kynamro Description Kynamro (mipomersen)
Federal Employee Program 1310 G Street, N.W. Washington, D.C. 20005 202.942.1000 Fax 202.942.1125 5.40.02 Subject: Kynamro Page: 1 of 5 Last Review Date: December 2, 2016 Kynamro Description Kynamro (mipomersen)
Supplementary Figure 1. Expression of phospho-sik3 in normal and osteoarthritic articular cartilage in the knee. (a) Semiserial histological sections
 Semiserial histological sections") Supplementary Figure 1. Expression of phospho-sik3 in normal and osteoarthritic articular cartilage in the knee. (a) Semiserial histological sections of normal cartilage were stained with safranin O-fast
Supplementary Figure 1. Expression of phospho-sik3 in normal and osteoarthritic articular cartilage in the knee. (a) Semiserial histological sections of normal cartilage were stained with safranin O-fast
Santulli G. et al. A microrna-based strategy to suppress restenosis while preserving endothelial function
 ONLINE DATA SUPPLEMENTS Santulli G. et al. A microrna-based strategy to suppress restenosis while preserving endothelial function Supplementary Figures Figure S1 Effect of Ad-p27-126TS on the expression
High Fat Diets Induce Colonic Epithelial Cell Stress and Inflammation that is Reversed by IL-22
 Supplementary Information High Fat Diets Induce Colonic Epithelial Cell Stress and Inflammation that is Reversed by IL-22 Max Gulhane 1, Lydia Murray 1, Rohan Lourie 1, Hui Tong 1, Yong H. Sheng 1, Ran
Metabolic ER stress and inflammation in white adipose tissue (WAT) of mice with dietary obesity.
 of mice with dietary obesity.") Supplementary Figure 1 Metabolic ER stress and inflammation in white adipose tissue (WAT) of mice with dietary obesity. Male C57BL/6J mice were fed a normal chow (NC, 10% fat) or a high-fat diet (HFD,
Supplementary Figure 1 Metabolic ER stress and inflammation in white adipose tissue (WAT) of mice with dietary obesity. Male C57BL/6J mice were fed a normal chow (NC, 10% fat) or a high-fat diet (HFD,
Effects of UBL5 knockdown on cell cycle distribution and sister chromatid cohesion
 Supplementary Figure S1. Effects of UBL5 knockdown on cell cycle distribution and sister chromatid cohesion A. Representative examples of flow cytometry profiles of HeLa cells transfected with indicated
Supplementary Figure 1
 Supplementary Figure 1 how HFD how HFD Epi WT p p Hypothalamus p p Inguinal WT T Liver Lean mouse adipocytes p p p p p p Obese mouse adipocytes Kidney Muscle Spleen Heart p p p p p p p p Extracellular
m 6 A mrna methylation regulates AKT activity to promote the proliferation and tumorigenicity of endometrial cancer
 SUPPLEMENTARY INFORMATION Articles https://doi.org/10.1038/s41556-018-0174-4 In the format provided by the authors and unedited. m 6 A mrna methylation regulates AKT activity to promote the proliferation
Supplementary Figure 1. Normal T lymphocyte populations in Dapk -/- mice. (a) Normal thymic development in Dapk -/- mice. Thymocytes from WT and Dapk
 Normal thymic development in Dapk -/- mice. Thymocytes from WT and Dapk") Supplementary Figure 1. Normal T lymphocyte populations in Dapk -/- mice. (a) Normal thymic development in Dapk -/- mice. Thymocytes from WT and Dapk -/- mice were stained for expression of CD4 and CD8.
Supplementary Figure 1. Normal T lymphocyte populations in Dapk -/- mice. (a) Normal thymic development in Dapk -/- mice. Thymocytes from WT and Dapk -/- mice were stained for expression of CD4 and CD8.
Supplementary Figure S1
 Supplementary Figure S1 Supplementary Figure S1. PARP localization patterns using GFP-PARP and PARP-specific antibody libraries GFP-PARP localization in non-fixed (A) and formaldehyde fixed (B) GFP-PARPx
Nature Neuroscience: doi: /nn Supplementary Figure 1
 Supplementary Figure 1 Subcellular segregation of VGluT2-IR and TH-IR within the same VGluT2-TH axon (wild type rats). (a-e) Serial sections of a dual VGluT2-TH labeled axon. This axon (blue outline) has
Supplemental Information. Increased 4E-BP1 Expression Protects. against Diet-Induced Obesity and Insulin. Resistance in Male Mice
 Cell Reports, Volume 16 Supplemental Information Increased 4E-BP1 Expression Protects against Diet-Induced Obesity and Insulin Resistance in Male Mice Shih-Yin Tsai, Ariana A. Rodriguez, Somasish G. Dastidar,
A Hepatocyte Growth Factor Receptor (Met) Insulin Receptor hybrid governs hepatic glucose metabolism SUPPLEMENTARY FIGURES, LEGENDS AND METHODS
 Insulin Receptor hybrid governs hepatic glucose metabolism SUPPLEMENTARY FIGURES, LEGENDS AND METHODS") A Hepatocyte Growth Factor Receptor (Met) Insulin Receptor hybrid governs hepatic glucose metabolism Arlee Fafalios, Jihong Ma, Xinping Tan, John Stoops, Jianhua Luo, Marie C. DeFrances and Reza Zarnegar
A Hepatocyte Growth Factor Receptor (Met) Insulin Receptor hybrid governs hepatic glucose metabolism Arlee Fafalios, Jihong Ma, Xinping Tan, John Stoops, Jianhua Luo, Marie C. DeFrances and Reza Zarnegar
Supplementary information
 Supplementary information Human Cytomegalovirus MicroRNA mir-us4-1 Inhibits CD8 + T Cell Response by Targeting ERAP1 Sungchul Kim, Sanghyun Lee, Jinwook Shin, Youngkyun Kim, Irini Evnouchidou, Donghyun
Supplementary Figure 1 Expression of Crb3 in mouse sciatic nerve: biochemical analysis (a) Schematic of Crb3 isoforms, ERLI and CLPI, indicating the
 Schematic of Crb3 isoforms, ERLI and CLPI, indicating the") Supplementary Figure 1 Expression of Crb3 in mouse sciatic nerve: biochemical analysis (a) Schematic of Crb3 isoforms, ERLI and CLPI, indicating the location of the transmembrane (TM), FRM binding (FB)
Supplementary Figure 1 Expression of Crb3 in mouse sciatic nerve: biochemical analysis (a) Schematic of Crb3 isoforms, ERLI and CLPI, indicating the location of the transmembrane (TM), FRM binding (FB)
IL-6Rα IL-6RαT-KO KO. IL-6Rα f/f bp. f/f 628 bp deleted 368 bp. 500 bp
 STD H 2 O WT KO IL-6Rα f/f IL-6Rα IL-6RαT-KO KO 1000 bp 500 bp f/f 628 bp deleted 368 bp Supplementary Figure 1 Confirmation of T-cell IL-6Rα deficiency. (a) Representative histograms and (b) quantification
Nature Neuroscience: doi: /nn Supplementary Figure 1. PICALM expression in brain capillary endothelium in human brain and in mouse brain.
 Supplementary Figure 1 PICALM expression in brain capillary endothelium in human brain and in mouse brain. a, Double immunostaining for PICALM (red, left) and lectin positive endothelial profiles (blue,
TRAF6 ubiquitinates TGFβ type I receptor to promote its cleavage and nuclear translocation in cancer
 Supplementary Information TRAF6 ubiquitinates TGFβ type I receptor to promote its cleavage and nuclear translocation in cancer Yabing Mu, Reshma Sundar, Noopur Thakur, Maria Ekman, Shyam Kumar Gudey, Mariya
Supplementary Table 1. The primers used for quantitative RT-PCR. Gene name Forward (5 > 3 ) Reverse (5 > 3 )
 Reverse (5 > 3 )") 770 771 Supplementary Table 1. The primers used for quantitative RT-PCR. Gene name Forward (5 > 3 ) Reverse (5 > 3 ) Human CXCL1 GCGCCCAAACCGAAGTCATA ATGGGGGATGCAGGATTGAG PF4 CCCCACTGCCCAACTGATAG TTCTTGTACAGCGGGGCTTG
770 771 Supplementary Table 1. The primers used for quantitative RT-PCR. Gene name Forward (5 > 3 ) Reverse (5 > 3 ) Human CXCL1 GCGCCCAAACCGAAGTCATA ATGGGGGATGCAGGATTGAG PF4 CCCCACTGCCCAACTGATAG TTCTTGTACAGCGGGGCTTG
SUPPLEMENTAL FIGURE LEGENDS
 SUPPLEMENTAL FIGURE LEGENDS Supplemental Figure S1: Endogenous interaction between RNF2 and H2AX: Whole cell extracts from 293T were subjected to immunoprecipitation with anti-rnf2 or anti-γ-h2ax antibodies
Supplementary Figure 1
 Supplementary Figure 1 YAP negatively regulates IFN- signaling. (a) Immunoblot analysis of Yap knockdown efficiency with sh-yap (#1 to #4 independent constructs) in Raw264.7 cells. (b) IFN- -Luc and PRDs
Supplementary Figure S1 Targeted disruption and overexpression of Gpr43 in mice. (a) A targeting vector was constructed by ligation of 3 fragments:
 A targeting vector was constructed by ligation of 3 fragments:") Supplementary Figure S1 Targeted disruption and overexpression of Gpr43 in mice. (a) A targeting vector was constructed by ligation of 3 fragments: the 5' and 3' homology recombination arms and a fragment
Supplementary Figure S1 Targeted disruption and overexpression of Gpr43 in mice. (a) A targeting vector was constructed by ligation of 3 fragments: the 5' and 3' homology recombination arms and a fragment
Supplementary Figure 1. Spatial distribution of LRP5 and β-catenin in intact cardiomyocytes. (a) and (b) Immunofluorescence staining of endogenous
 and (b) Immunofluorescence staining of endogenous") Supplementary Figure 1. Spatial distribution of LRP5 and β-catenin in intact cardiomyocytes. (a) and (b) Immunofluorescence staining of endogenous LRP5 in intact adult mouse ventricular myocytes (AMVMs)
Supplementary Figure 1. Spatial distribution of LRP5 and β-catenin in intact cardiomyocytes. (a) and (b) Immunofluorescence staining of endogenous LRP5 in intact adult mouse ventricular myocytes (AMVMs)
Supplementary Figure 1: STAT3 suppresses Kras-induced lung tumorigenesis
 Supplementary Figure 1: STAT3 suppresses Kras-induced lung tumorigenesis (a) Immunohistochemical (IHC) analysis of tyrosine 705 phosphorylation status of STAT3 (P- STAT3) in tumors and stroma (all-time