Supplementary Figure 1. Spatial distribution of LRP5 and β-catenin in intact cardiomyocytes. (a) and (b) Immunofluorescence staining of endogenous
|
|
|
- Maurice Armstrong
- 5 years ago
- Views:
Transcription
 and (b) Immunofluorescence staining of endogenous LRP5 in intact adult mouse ventricular myocytes (AMVMs) (a) and intact adult mouse ventricular tissues (b). Scale bars, 25 µm.")
1 Supplementary Figure 1. Spatial distribution of LRP5 and β-catenin in intact cardiomyocytes. (a) and (b) Immunofluorescence staining of endogenous LRP5 in intact adult mouse ventricular myocytes (AMVMs) (a) and intact adult mouse ventricular tissues (b). Scale bars, 25 µm. Magnified images indicate the distribution patterns of LRP5 in the white boxes. (c) Co-immunoprecipitation of endogenous LRP5 and Cx43 in intact AMVMs. (d) and (e) Immunofluorescence labeling of endogenous LRP5 and connexin 43 (Cx43) in intact AMVMs (d) and intact adult mouse ventricular tissues (e). Scale bars, 25 µm. Magnified images indicating colocalization of LRP5 with Cx43 are shown in the white boxes. The right row indicates Pearson's correlation coefficient (R) and line plot profiles. (f) Immunofluorescence labeling of endogenous β-catenin and Cx43 in intact AMVMs. The right row in d-f indicates Pearson's correlation coefficient (R) and line plot profiles. Scale bars, 25 µm. The presented images and blots are representative of three separate experiments.

2 Supplementary Figure 2. Effects of LRP6 on Cx40, 45 and N-cadherin in cardiomyocytes. (a) Western blotting examination of Cx40, 45 and N-cadherin protein expression. Left, typical western blots; right, pooled data. n=3. Data are means ± s.e.m. **P<0.01 compared with ctrl by one-way ANOVA with Bonferroni s post hoc test. n represents the number of experiments. (b) and (c) Immunofluorescent imaging of Cx40 and Cx45 in LRP6-deficient NRVMs. Scale bars, 10 µm. The presented images are representative of three separate experiments. (d) Membrane expression of Cx40 and Cx45 in Lrp6 knockout mice hearts. Left, typical western blots; right, pooled data. Cav-3, caveolin 3, a cell membrane marker. n=3. Data are means ± s.e.m. n represents the number of experiments.
3
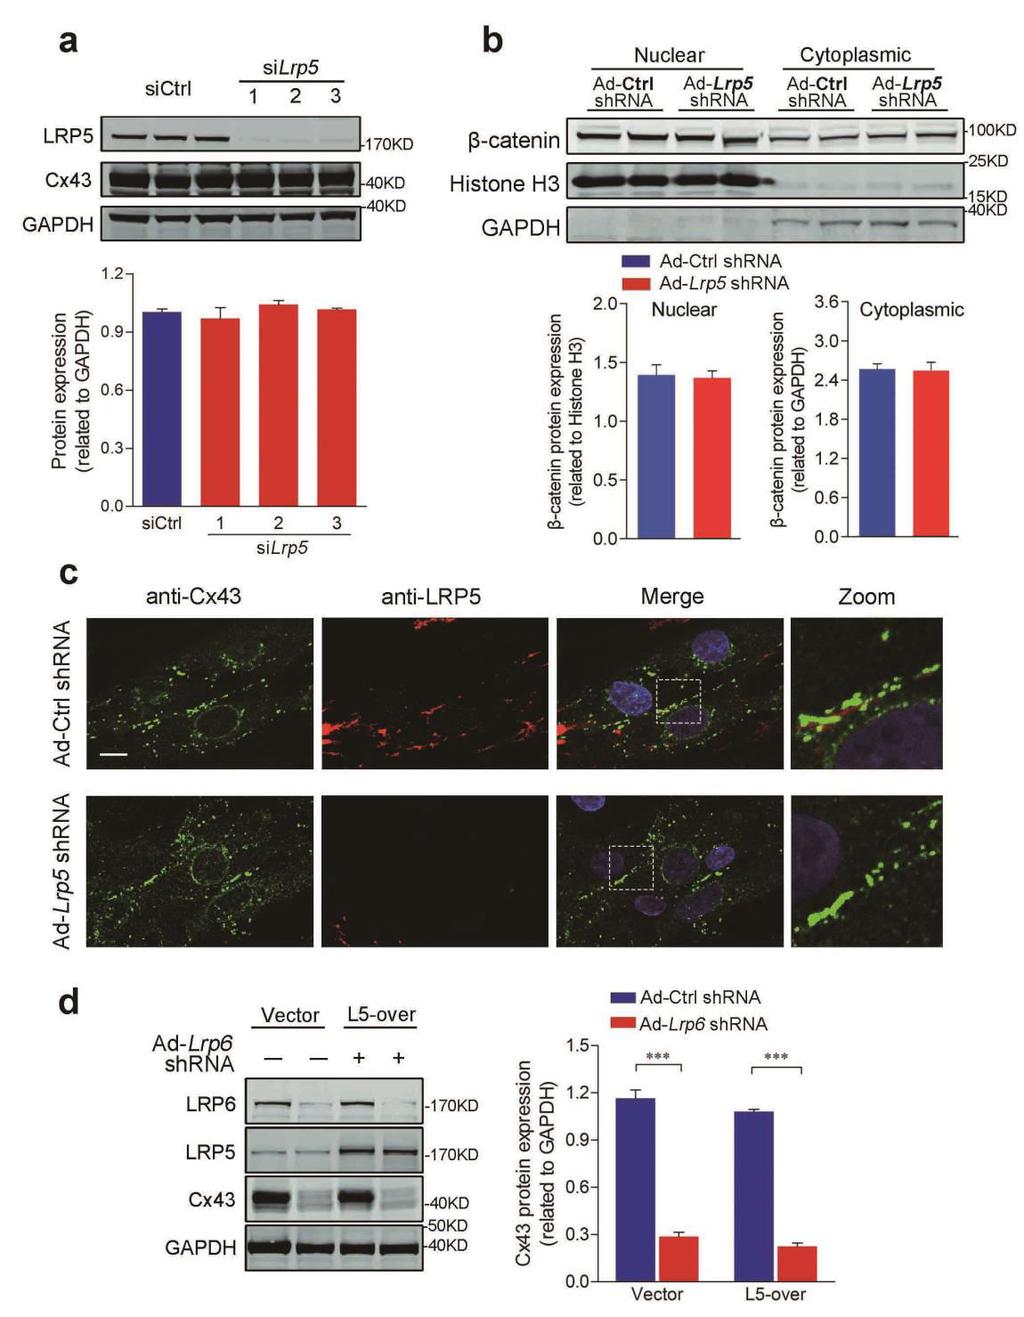
4 Supplementary Figure 3. The deficiency of LRP5 does not depress the expression of Cx43. (a) Effects of Lrp5 knockdown on Cx43 protein levels in cultured neonatal rat ventricular myocytes (NRVMs). Top, typical Western blots; bottom, pooled data. Three independent Lrp5 sirna sequences were employed. n=3. Data are means ± s.e.m. n represents the number of experiments. (b) Effects of LRP5 deficiency on Wnt signaling. The nuclear distribution of β-catenin was used for evaluating Wnt signaling activity. Lrp5 knockdown did not change the nuclear expression of β-catenin. Top, typical Western blots; bottom, pooled data. n=3. Data are means ± s.e.m. n represents the number of experiments. (c) Immunofluorescence imaging of endogenous Cx43 in LRP5-deficient myocytes. Scale bars, 10 µm. The presented images are representative of three separate experiments. (d) Western blotting examination of Cx43 protein in LRP6-deficient NRVMs with or without LRP5 overexpression (L5-over). Left, typical blots; right, pooled data. n=3. Data are means ± s.e.m. ***P<0.001 compared with ctrl by one-way ANOVA with Bonferroni s post hoc test. n represents the number of experiments.
 Effects of LRP6 domain-truncated mutants on Cx43 protein expression. Left, typical western blots; right, pooled data. n=3. Data are means ± s.e.m. *P<0.")
5 Supplementary Figure 4. Identification of the critical LRP6 module important for Cx43 expression. (a) The schematic diagram for LRP6 domain-truncated mutants. (b) Effects of LRP6 domain-truncated mutants on Cx43 protein expression. Left, typical western blots; right, pooled data. n=3. Data are means ± s.e.m. *P<0.05 compared with ΔP1E1P2E2-flag by one-way ANOVA with Bonferroni s post hoc test. n represents the number of experiments. (c) Co-immunoprecipitation examination of the interaction between LRP6 domain-truncated mutants and Cx43.
 and (c) Western blotting examination of the fractional expression of β-catenin in LRP6-deficient NRVMs.")
6 Supplementary Figure 5. Role of LRP6 in the canonical Wnt signaling of cardiomyocytes. (a) Immunofluorescent imaging of β-catenin and Cx43 in LRP6-deficient NRVMs. Scale bars, 10 µm. The presented images are representative of three separate experiments. (b) and (c) Western blotting examination of the fractional expression of β-catenin in LRP6-deficient NRVMs. Mem, membrane; Cyto, cytoplasmic. n=3. Data are means ± s.e.m. n represents the number of experiments. (d) Immunofluorescent imaging of LRP6 and Cx43 in NRVMs subject to Wnt activation and inhibition. LGK-974: Wnt inhibitor; Wnt3a: Wnt ligand. Scale bars, 10 µm. The presented images are representative of three separate experiments. n=3. Data are means ± s.e.m. n represents the number of experiments.
 at 5 hours post transfection (a), whereas their colocalization mostly occurred at the")
7 Supplementary Figure 6. Subcellular colocalization analysis of LRP6 and Cx43. The HeLa cells transfected with Cx43-GFP were used for cellular imaging. The colocalization of LRP6 and Cx43 was mostly observed in the ER (a triple colocalization of LRP6, Cx43 and PDI) at 5 hours post transfection (a), whereas their colocalization mostly occurred at the Golgi apparatus and along the microtubules at 24 hours post transfection as demonstrated by the triple colocalizations of LRP6/Cx43 with GM130 or -tubulin (b). Scale bar, 10 µm. The presented images are representative of three separate experiments.
 and (b) Western blotting analysis of the effects of lysosomal inhibition on Cx43 protein expression in LRP6-deficient NRVMs.")
8 Supplementary Figure 7. LRP6 modulates the lysosomal degradation of Cx43 protein. (a) and (b) Western blotting analysis of the effects of lysosomal inhibition on Cx43 protein expression in LRP6-deficient NRVMs. Lamp1 sirna and Ba-A1 (Bafilomycin A1) were adopted to inhibit lysosomal degradation. n=3 (a) and (b). Data are means ± s.e.m. **P<0.01 compared with ctrl by one-way ANOVA with Bonferroni s post hoc test. n represents the number of experiments. (c) Effects of a proteolytic inhibitor of the 26S proteasome complex, MG132, on Cx43 protein in LRP6-deficient cardiomyocytes. The immunoblots show that proteasomal inhibition did not counteract the reduction in the Cx43 protein level by Lrp6 knockdown. n=3. Data are means ± s.e.m. **P<0.01 compared with ctrl by one-way ANOVA with Bonferroni s post hoc test. n represents the number of experiments. (d) Assay of chymotrypsin-like activity of the proteasome. Treatment with mm MG132 for 48 hours significantly inhibited the chymotrypsin-like activity of the proteasome in NRVMs. n=3. Data are means ± s.e.m. **P<0.01 compared with ctrl by one-way ANOVA with Bonferroni s post hoc test. n represents the number of experiments.

9 Supplementary Figure 8. Effects of LRP6 reduction on the ER morphology and function. (a) Immunofluorescent imaging of ER in LRP6-deficient cardiomyocytes. PDI: a ER marker. Scale bars, 10 µm. The presented images are representative of three separate experiments. (b) Western blotting examination of the effects of LRP6 on the molecules for ER stress response, chaperons and protein exit machinery. Left, typical blots; right: pooled data. n=3. Data are means ± s.e.m. n represents the number of experiments.
 Histological analysis of collagen throughout the myocardium. Fibrosis was determined as the ratio of the area of fibrosis to the total vessel area by using ImageJ software. Scale bar, 100 µm. n=5.")
10 Supplementary Figure 9. Effects of Lrp6 CKO on cardiac structure and function. (a) and (b) Immunohistochemical analysis of the Lrp6-knockout embryonic and adult hearts. Scale bar, 1 mm. (c) Histological analysis of collagen throughout the myocardium. Fibrosis was determined as the ratio of the area of fibrosis to the total vessel area by using ImageJ software. Scale bar, 100 µm. n=5. Data are means ± s.e.m. n represents the number of experiments. (d) Echocardiographic measurements of cardiac function. Left, representative echocardiograms; right, pooled data. There are no significant alterations in LV ejection fraction (EF) or fractional shortening (FS) or LV posterior wall dimensions (LVPWd) in the cardiac-specific Lrp6-knockout mice. n=5. Data are means ± s.e.m. n represents the number of experiments.
11
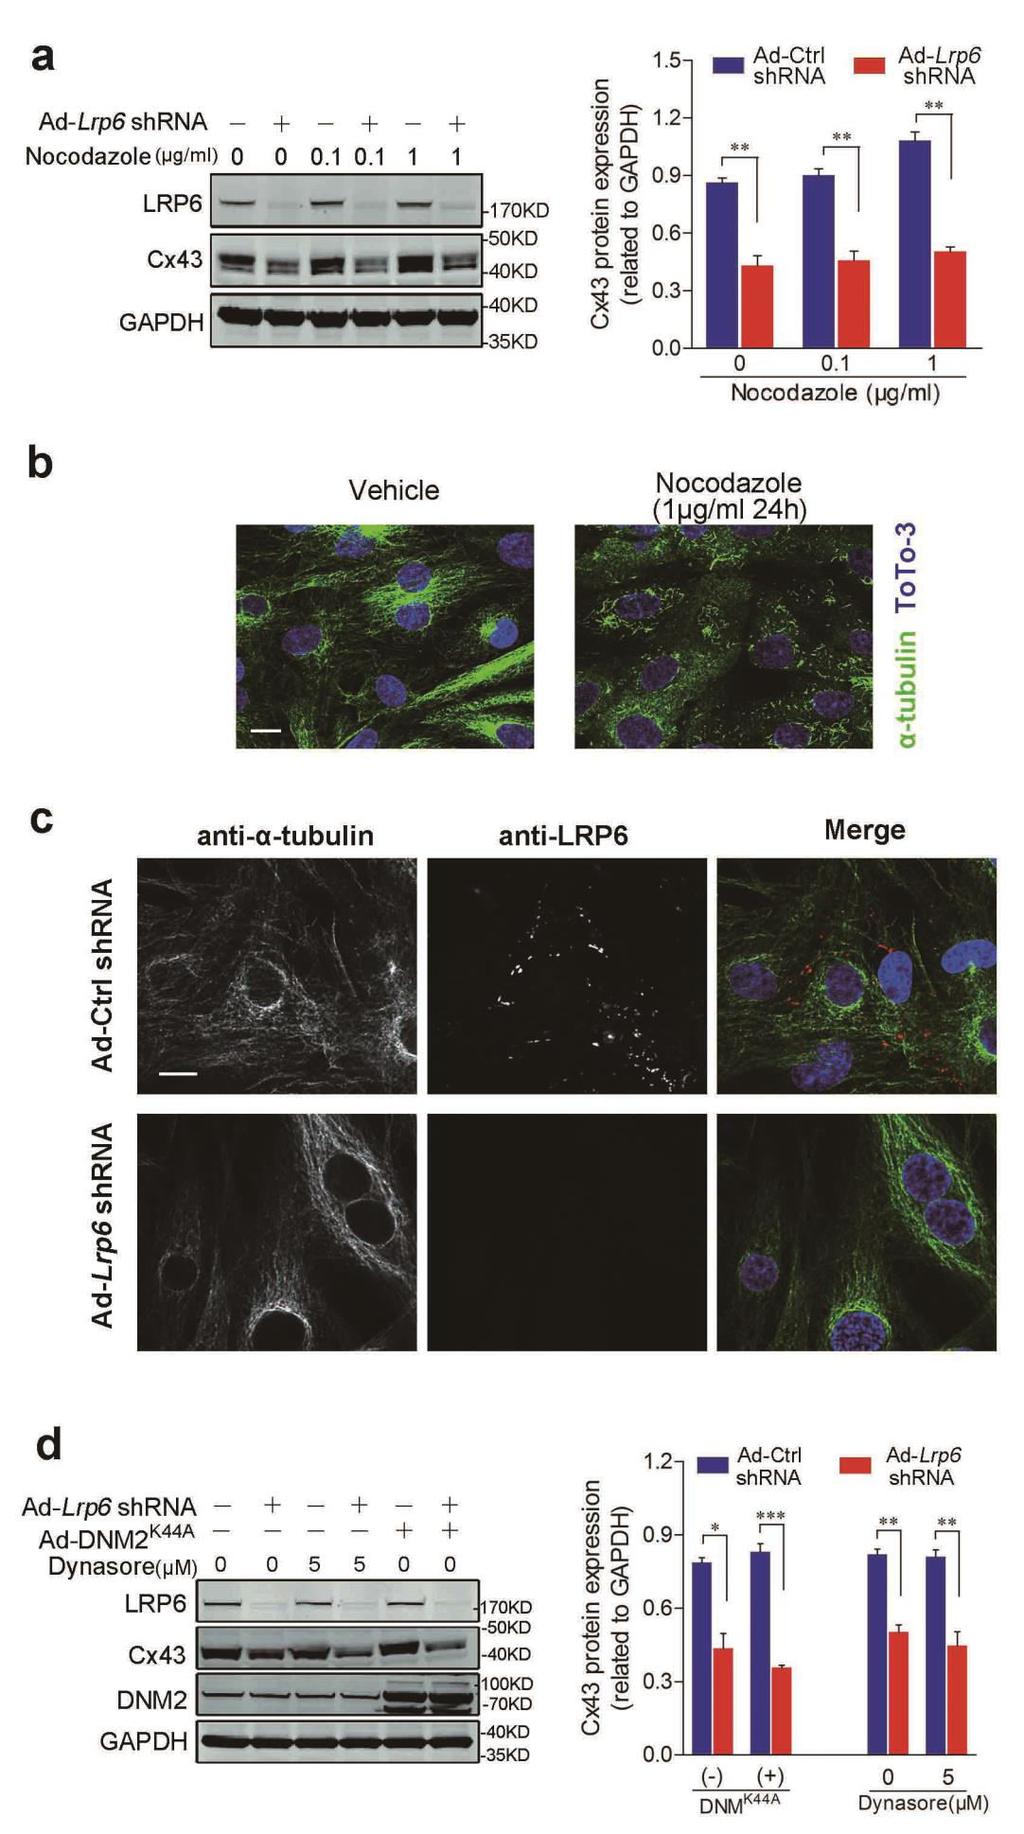
12 Supplementary Figure 10. Lrp6 knockdown does not affect the membrane trafficking of Cx43. (a) Western blotting analysis of Cx43 protein in cardiomyocytes subjected to nocodazole treatment or Lrp6 knockdown. Left, typical blots; right, pooled data. n=3. Data are means ± s.e.m. **P<0.01 compared with ctrl by one-way ANOVA with Bonferroni s post hoc test. n represents the number of experiments. (b) Immunofluorescence staining of α-tubulin in NRVMs under nocodazole treatment for 24 h. Scale bar, 10 µm. (c) Immunofluorescence of labeled α-tubulin and LRP6 in NRVMs following Lrp6 knockdown. ToTo-3 indicated the cell nucleus. Scale bar, 10 µm. The presented images are representative of three separate experiments. (d) The immunoblots demonstrates the protein expression of Cx43 in LRP6-deficient cardiomyocytes subjected to dynamin activity inhibition. Dynasore (an inhibitor of dynamin) treatment and overexpression of DNM2K44A (a dominant negative dynamin-2 mutant) were adopted to inhibit dynamin activity in the cardiomyocytes. n=3. Data are means ± s.e.m. **P<0.01 compared with ctrl by one-way ANOVA with Bonferroni s post hoc test. n represents the number of experiments.

13 Supplementary Figure 11. Reduced Cx43 by β-catenin knockdown is not rescued by Leu and Ba-A1. Top, Representative western blots for Cx43 and β-catenin. Leupeptin: Leu; Bafilomycin A1: Ba-A1. The presented blots are representative of three separate experiments. Bottom, pooled data. n=3. Data are means ± s.e.m. *P<0.05 compared with ctrl by one-way ANOVA with Bonferroni s post hoc test. n represents the number of experiments.
14
15

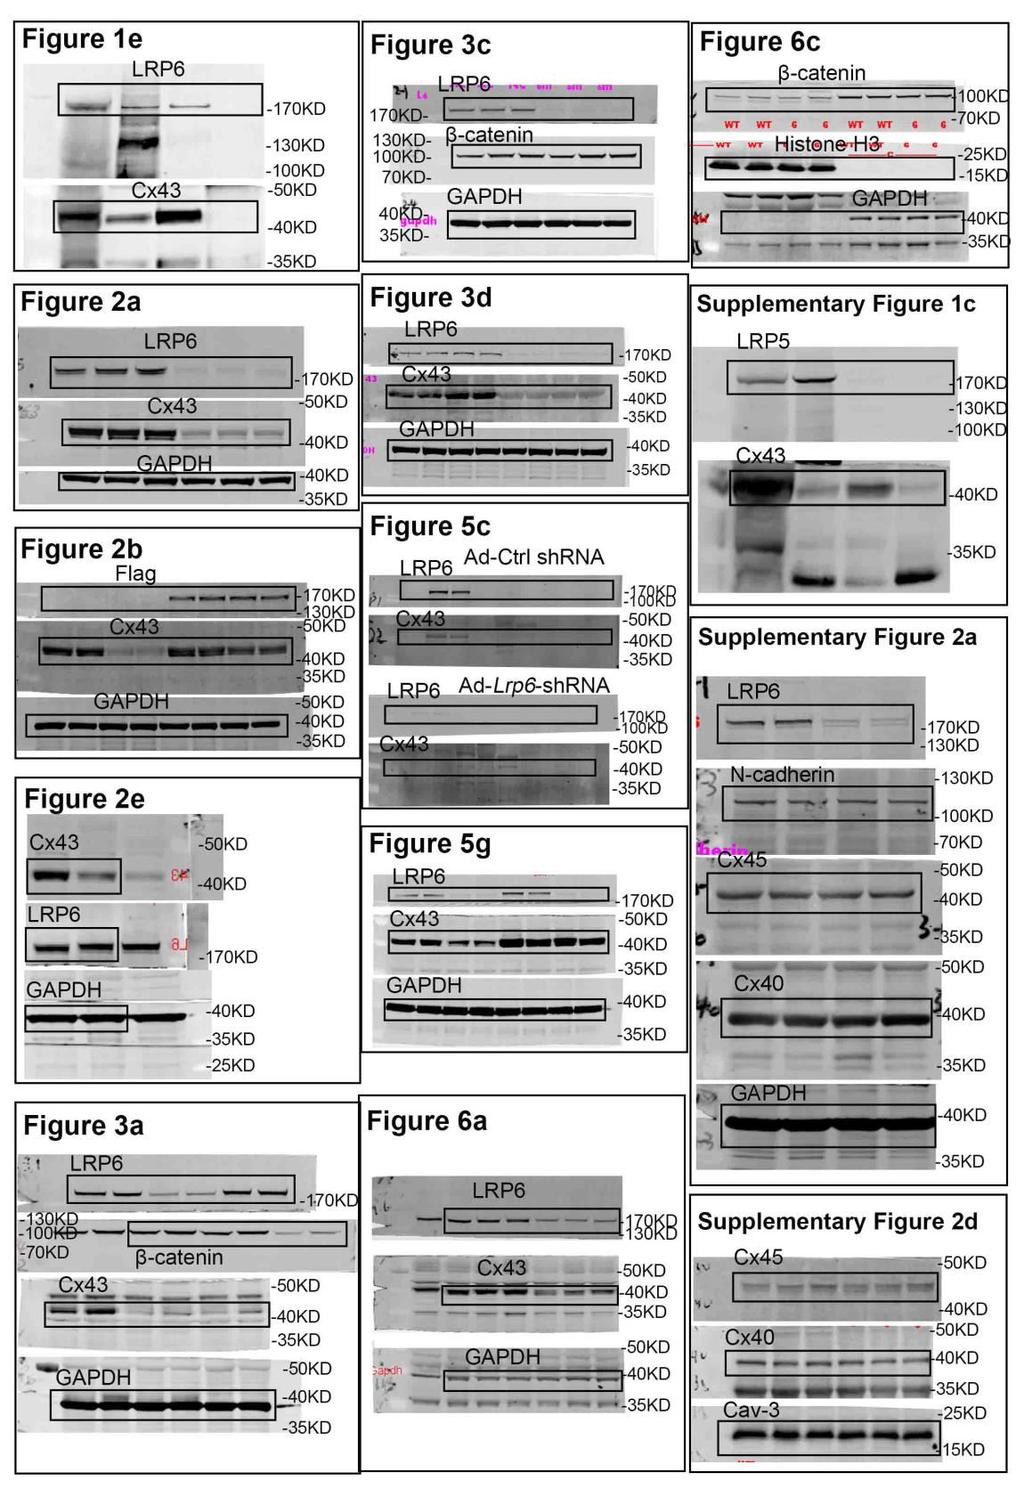
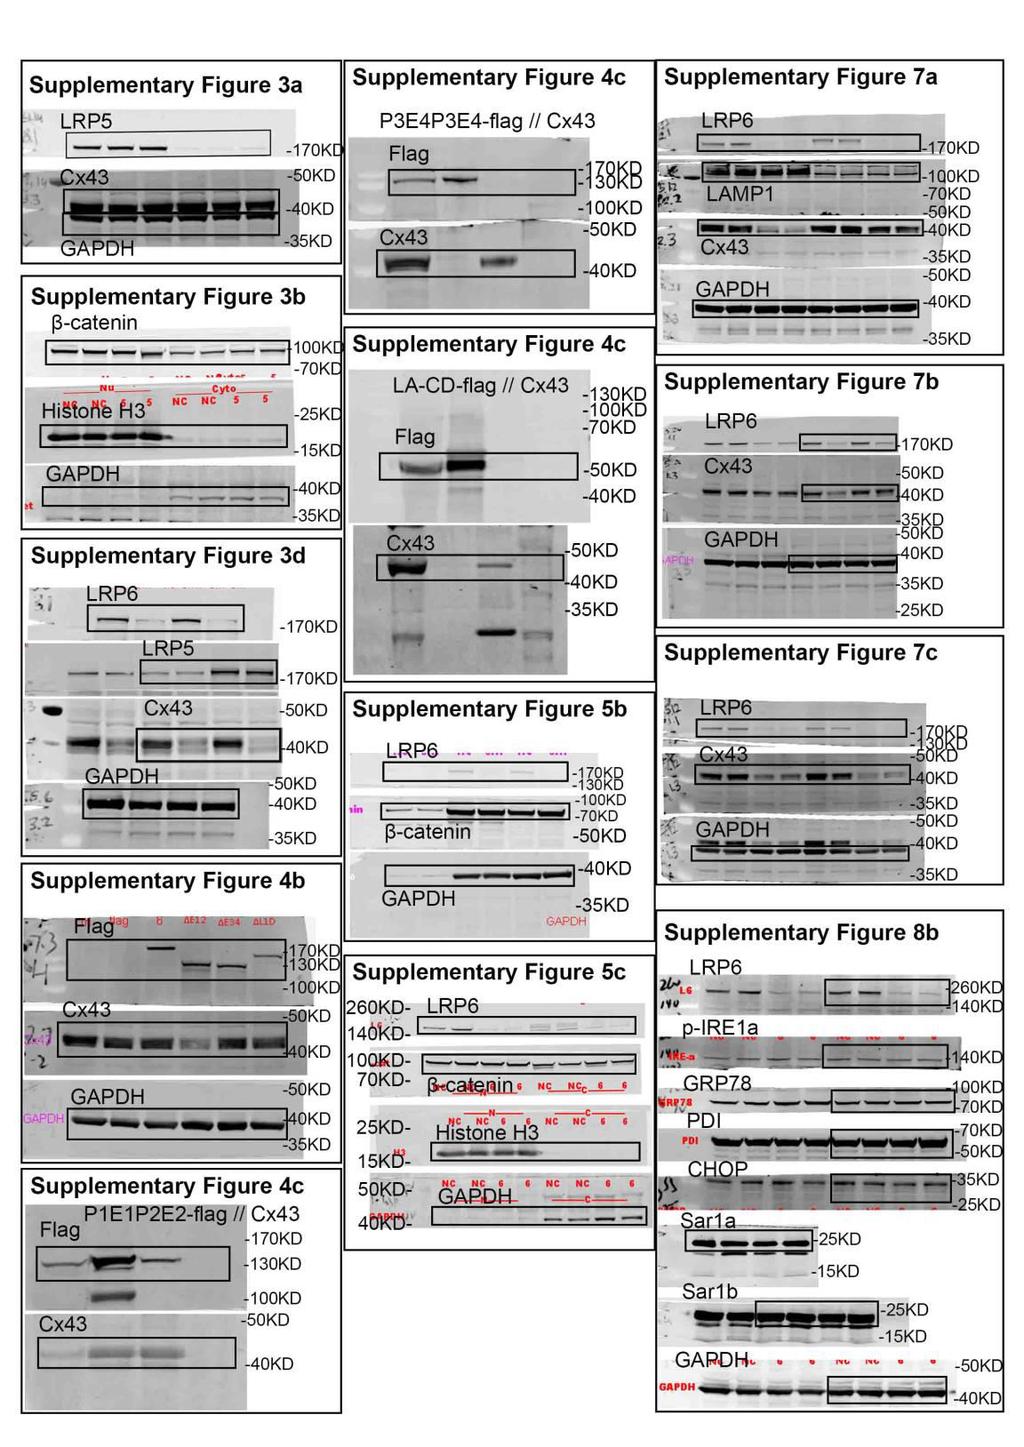
16 Supplementary Figure 12. Full scans of western blots data. Black boxes highlight the indicated lanes in figures.
17 Supplementary Table 1. Primer sequences Rat-18s-Forward Primer TGCGGAAGGATCATTAACGGA Rat-18s-Reverse Primer AGTAGGAGAGGAGCGAGCGACC Rat-LRP6-Forward Primer GCAGTGAAGGAGCTGAACCT Rat-LRP6-Reverse Primer CCTGTAGGATGGTGGTGGGT Rat-Cx43-Forward Primer AGGCGTGAGGAAAGTACCAAA Rat-Cx43-Reverse Primer CCGTGCTCTTCAATCCCGTA Rat-β-catenin-Forward Primer CAGTGCAGGAGGCCGAG Rat-β-catenin-Reverse Primer GGCCATGTCCAACTCCATCA Mouse-Lrp6-Forward Primer CTGGATTATTGTCCCCGGAT Mouse-Lrp6-Reverse Primer GTGTGTATTCCAGTCAGTCC Mouse-Cx43-Forward Primer AAAGGCGTGAGGGAAGTACC Mouse-Cx43-Reverse Primer ACAGCGAAAGGCAGACTGTT Mouse-GAPDH-Forward Primer GGTGAAGGTCGGTGTGAACG Mouse-GAPDH-Reverse Primer CTCGCTCCTGGAAGATGGTG Supplementary Table 2. shrnas sequences Lrp6 Lrp5 Cx43 β-catenin GGCAGACACAGGAACAAAU GGCUCUGGAUCCUACUAAA CAAUUCCUCGUGCCGCAA GAGACUGCCUUCAGAUCUU Supplementary Table 3. sirnas sequences Lrp6 GGCAGACACAGGAACAAAU CCAUGGAUAUACAUGCUUU GCAUUGUUCCUGAGGCUUU Lrp5 GGCUCUGGAUCCUACUAAA CCUGGAGACUAACAACAAU CGAGGGUACAUGUACUUUA Lamp1 GGGUCUACAUGAAGAAUGU
Supplementary Figure 1.TRIM33 binds β-catenin in the nucleus. a & b, Co-IP of endogenous TRIM33 with β-catenin in HT-29 cells (a) and HEK 293T cells
 and HEK 293T cells") Supplementary Figure 1.TRIM33 binds β-catenin in the nucleus. a & b, Co-IP of endogenous TRIM33 with β-catenin in HT-29 cells (a) and HEK 293T cells (b). TRIM33 was immunoprecipitated, and the amount of
Supplementary Figure 1.TRIM33 binds β-catenin in the nucleus. a & b, Co-IP of endogenous TRIM33 with β-catenin in HT-29 cells (a) and HEK 293T cells (b). TRIM33 was immunoprecipitated, and the amount of
c Ischemia (30 min) Reperfusion (8 w) Supplementary Figure bp 300 bp Ischemia (30 min) Reperfusion (4 h) Dox 20 mg/kg i.p.
 Reperfusion (8 w) Supplementary Figure bp 300 bp Ischemia (30 min) Reperfusion (4 h) Dox 20 mg/kg i.p.") a Marker Ripk3 +/ 5 bp 3 bp b Ischemia (3 min) Reperfusion (4 h) d 2 mg/kg i.p. 1 w 5 w Sacrifice for IF size A subset for echocardiography and morphological analysis c Ischemia (3 min) Reperfusion (8
a Marker Ripk3 +/ 5 bp 3 bp b Ischemia (3 min) Reperfusion (4 h) d 2 mg/kg i.p. 1 w 5 w Sacrifice for IF size A subset for echocardiography and morphological analysis c Ischemia (3 min) Reperfusion (8
Boucher et al NCOMMS B
 1 Supplementary Figure 1 (linked to Figure 1). mvegfr1 constitutively internalizes in endothelial cells. (a) Immunoblot of mflt1 from undifferentiated mouse embryonic stem (ES) cells with indicated genotypes;
Supplementary Figure 1. Confocal immunofluorescence showing mitochondrial translocation of Drp1. Cardiomyocytes treated with H 2 O 2 were prestained
 Supplementary Figure 1. Confocal immunofluorescence showing mitochondrial translocation of Drp1. Cardiomyocytes treated with H 2 O 2 were prestained with MitoTracker (red), then were immunostained with
Supplementary Figure 1. PAQR3 knockdown inhibits SREBP-2 processing in CHO-7 cells CHO-7 cells were transfected with control sirna or a sirna
 Supplementary Figure 1. PAQR3 knockdown inhibits SREBP-2 processing in CHO-7 cells CHO-7 cells were transfected with control sirna or a sirna targeted for hamster PAQR3. At 24 h after the transfection,
T H E J O U R N A L O F C E L L B I O L O G Y
 Supplemental material Chairoungdua et al., http://www.jcb.org/cgi/content/full/jcb.201002049/dc1 T H E J O U R N A L O F C E L L B I O L O G Y Figure S1. Expression of CD9 and CD82 inhibits Wnt/ -catenin
Supplementary Fig. 1. GPRC5A post-transcriptionally down-regulates EGFR expression. (a) Plot of the changes in steady state mrna levels versus
 Plot of the changes in steady state mrna levels versus") Supplementary Fig. 1. GPRC5A post-transcriptionally down-regulates EGFR expression. (a) Plot of the changes in steady state mrna levels versus changes in corresponding proteins between wild type and Gprc5a-/-
Supplementary Fig. 1. GPRC5A post-transcriptionally down-regulates EGFR expression. (a) Plot of the changes in steady state mrna levels versus changes in corresponding proteins between wild type and Gprc5a-/-
Supplemental Materials. STK16 regulates actin dynamics to control Golgi organization and cell cycle
 Supplemental Materials STK16 regulates actin dynamics to control Golgi organization and cell cycle Juanjuan Liu 1,2,3, Xingxing Yang 1,3, Binhua Li 1, Junjun Wang 1,2, Wenchao Wang 1, Jing Liu 1, Qingsong
Tcf21 MCM ; R26 mtmg Sham GFP Col 1/3 TAC 8W TAC 2W. Postn MCM ; R26 mtmg Sham GFP Col 1/3 TAC 8W TAC 2W
 A Tcf21 MCM ; R26 mtmg Sham GFP Col 1/3 Tcf21 MCM ; R26 mtmg TAC 2W Tcf21 MCM ; R26 mtmg TAC 8W B Postn MCM ; R26 mtmg Sham GFP Col 1/3 Postn MCM ; R26 mtmg TAC 2W Postn MCM ; R26 mtmg TAC 8W Supplementary
SUPPLEMENTARY FIGURES
 SUPPLEMENTARY FIGURES Supplementary Figure 1. (A) Left, western blot analysis of ISGylated proteins in Jurkat T cells treated with 1000U ml -1 IFN for 16h (IFN) or left untreated (CONT); right, western
Title of file for HTML: Supplementary Information Description: Supplementary Figures and Supplementary Table
 Title of file for HTML: Supplementary Information Description: Supplementary Figures and Supplementary Table Title of file for HTML: Peer Review File Description: Innate Scavenger Receptor-A regulates
SUPPLEMENTARY LEGENDS...
 TABLE OF CONTENTS SUPPLEMENTARY LEGENDS... 2 11 MOVIE S1... 2 FIGURE S1 LEGEND... 3 FIGURE S2 LEGEND... 4 FIGURE S3 LEGEND... 5 FIGURE S4 LEGEND... 6 FIGURE S5 LEGEND... 7 FIGURE S6 LEGEND... 8 FIGURE
SUPPLEMENTARY FIGURE LEGENDS
 SUPPLEMENTARY FIGURE LEGENDS Supplemental FIG. 1. Localization of myosin Vb in cultured neurons varies with maturation stage. A and B, localization of myosin Vb in cultured hippocampal neurons. A, in DIV
Supplementary Figure 1. The CagA-dependent wound healing or transwell migration of gastric cancer cell. AGS cells transfected with vector control or
 Supplementary Figure 1. The CagA-dependent wound healing or transwell migration of gastric cancer cell. AGS cells transfected with vector control or 3xflag-CagA expression vector were wounded using a pipette
Supplementary information. The Light Intermediate Chain 2 Subpopulation of Dynein Regulates Mitotic. Spindle Orientation
 Supplementary information The Light Intermediate Chain 2 Subpopulation of Dynein Regulates Mitotic Spindle Orientation Running title: Dynein LICs distribute mitotic functions. Sagar Mahale a, d, *, Megha
Cells and reagents. Synaptopodin knockdown (1) and dynamin knockdown (2)
 and dynamin knockdown (2)") Supplemental Methods Cells and reagents. Synaptopodin knockdown (1) and dynamin knockdown (2) podocytes were cultured as described previously. Staurosporine, angiotensin II and actinomycin D were all obtained
Supplemental Methods Cells and reagents. Synaptopodin knockdown (1) and dynamin knockdown (2) podocytes were cultured as described previously. Staurosporine, angiotensin II and actinomycin D were all obtained
293T cells were transfected with indicated expression vectors and the whole-cell extracts were subjected
 SUPPLEMENTARY INFORMATION Supplementary Figure 1. Formation of a complex between Slo1 and CRL4A CRBN E3 ligase. (a) HEK 293T cells were transfected with indicated expression vectors and the whole-cell
Supplementary Materials
 Supplementary Materials Supplementary Figure S1 Regulation of Ubl4A stability by its assembly partner A, The translation rate of Ubl4A is not affected in the absence of Bag6. Control, Bag6 and Ubl4A CRISPR
Supplementary Information
 Supplementary Information mediates STAT3 activation at retromer-positive structures to promote colitis and colitis-associated carcinogenesis Zhang et al. a b d e g h Rel. Luc. Act. Rel. mrna Rel. mrna
SUPPLEMENTARY INFORMATION
 DOI: 10.1038/ncb2607 Figure S1 Elf5 loss promotes EMT in mammary epithelium while Elf5 overexpression inhibits TGFβ induced EMT. (a, c) Different confocal slices through the Z stack image. (b, d) 3D rendering
Supplementary Figure S1
 Supplementary Figure S1 Supplementary Figure S1. PARP localization patterns using GFP-PARP and PARP-specific antibody libraries GFP-PARP localization in non-fixed (A) and formaldehyde fixed (B) GFP-PARPx
Nature Structural and Molecular Biology: doi: /nsmb Supplementary Figure 1
 Supplementary Figure 1 Mutational analysis of the SA2-Scc1 interaction in vitro and in human cells. (a) Autoradiograph (top) and Coomassie stained gel (bottom) of 35 S-labeled Myc-SA2 proteins (input)
Supplementary information. MARCH8 inhibits HIV-1 infection by reducing virion incorporation of envelope glycoproteins
 Supplementary information inhibits HIV-1 infection by reducing virion incorporation of envelope glycoproteins Takuya Tada, Yanzhao Zhang, Takayoshi Koyama, Minoru Tobiume, Yasuko Tsunetsugu-Yokota, Shoji
Supplementary Figures
 Supplementary Figures Supplementary Figure 1 DOT1L regulates the expression of epithelial and mesenchymal markers. (a) The expression levels and cellular localizations of EMT markers were confirmed by
Kidney. Heart. Lung. Sirt1. Gapdh. Mouse IgG DAPI. Rabbit IgG DAPI
 a e Na V 1.5 Ad-LacZ Ad- 110KD b Scn5a/ (relative to Ad-LacZ) f 150 100 50 0 p = 0.65 Ad-LacZ Ad- c Heart Lung Kidney Spleen 110KD d fl/fl c -/- DAPI 20 µm Na v 1.5 250KD fl/fl Rabbit IgG DAPI fl/fl Mouse
SUPPLEMENTARY INFORMATION
 Figure S1. Loss of Ena/VASP proteins inhibits filopodia and neuritogenesis. (a) Bar graph of filopodia number per stage 1 control and mmvvee (Mena/ VASP/EVL-null) neurons at 40hrs in culture. Loss of all
Nature Neuroscience: doi: /nn Supplementary Figure 1. PICALM expression in brain capillary endothelium in human brain and in mouse brain.
 Supplementary Figure 1 PICALM expression in brain capillary endothelium in human brain and in mouse brain. a, Double immunostaining for PICALM (red, left) and lectin positive endothelial profiles (blue,
Type of file: PDF Title of file for HTML: Supplementary Information Description: Supplementary Figures
 Type of file: PDF Title of file for HTML: Supplementary Information Description: Supplementary Figures Type of file: MOV Title of file for HTML: Supplementary Movie 1 Description: NLRP3 is moving along
SUPPLEMENTARY INFORMATION
 doi:10.1038/nature12652 Supplementary Figure 1. PRDM16 interacts with endogenous EHMT1 in brown adipocytes. Immunoprecipitation of PRDM16 complex by flag antibody (M2) followed by Western blot analysis
SUPPLEMENTARY INFORMATION
 DOI: 1.138/ncb222 / b. WB anti- WB anti- ulin Mitotic index (%) 14 1 6 2 T (h) 32 48-1 1 2 3 4 6-1 4 16 22 28 3 33 e. 6 4 2 Time (min) 1-6- 11-1 > 1 % cells Figure S1 depletion leads to mitotic defects
SUPPLEMENTARY INFORMATION
 DOI: 10.1038/ncb2566 Figure S1 CDKL5 protein expression pattern and localization in mouse brain. (a) Multiple-tissue western blot from a postnatal day (P) 21 mouse probed with an antibody against CDKL5.
(A) SW480, DLD1, RKO and HCT116 cells were treated with DMSO or XAV939 (5 µm)
 SW480, DLD1, RKO and HCT116 cells were treated with DMSO or XAV939 (5 µm)") Supplementary Figure Legends Figure S1. Tankyrase inhibition suppresses cell proliferation in an axin/β-catenin independent manner. (A) SW480, DLD1, RKO and HCT116 cells were treated with DMSO or XAV939
Supplementary Figure Legends Figure S1. Tankyrase inhibition suppresses cell proliferation in an axin/β-catenin independent manner. (A) SW480, DLD1, RKO and HCT116 cells were treated with DMSO or XAV939
Supplemental Figure 1. Western blot analysis indicated that MIF was detected in the fractions of
 Supplemental Figure Legends Supplemental Figure 1. Western blot analysis indicated that was detected in the fractions of plasma membrane and cytosol but not in nuclear fraction isolated from Pkd1 null
Project report October 2012 March 2013 CRF fellow: Principal Investigator: Project title:
 Project report October 2012 March 2013 CRF fellow: Gennaro Napolitano Principal Investigator: Sergio Daniel Catz Project title: Small molecule regulators of vesicular trafficking to enhance lysosomal exocytosis
supplementary information
 DOI: 10.1038/ncb1875 Figure S1 (a) The 79 surgical specimens from NSCLC patients were analysed by immunohistochemistry with an anti-p53 antibody and control serum (data not shown). The normal bronchi served
Supplementary Figure S1: Defective heterochromatin repair in HGPS progeroid cells
 Supplementary Figure S1: Defective heterochromatin repair in HGPS progeroid cells Immunofluorescence staining of H3K9me3 and 53BP1 in PH and HGADFN003 (HG003) cells at 24 h after γ-irradiation. Scale bar,
Disrupting GluA2-GAPDH Interaction Affects Axon and Dendrite Development
 Disrupting GluA2-GAPDH Interaction Affects Axon and Dendrite Development 1 Frankie Hang Fung Lee, 1 Ping Su, 1 Yu Feng Xie, 1 Kyle Ethan Wang, 2 Qi Wan and 1,3 Fang Liu 1 Campbell Research Institute, Centre
SUPPLEMENTARY INFORMATION
 DOI: 10.1038/ncb2988 Supplementary Figure 1 Kif7 L130P encodes a stable protein that does not localize to cilia tips. (a) Immunoblot with KIF7 antibody in cell lysates of wild-type, Kif7 L130P and Kif7
Supplementary Figure 1: si-craf but not si-braf sensitizes tumor cells to radiation.
 Supplementary Figure 1: si-craf but not si-braf sensitizes tumor cells to radiation. (a) Embryonic fibroblasts isolated from wildtype (WT), BRAF -/-, or CRAF -/- mice were irradiated (6 Gy) and DNA damage
Supplementary Materials for
 www.sciencesignaling.org/cgi/content/full/6/283/ra57/dc1 Supplementary Materials for JNK3 Couples the Neuronal Stress Response to Inhibition of Secretory Trafficking Guang Yang,* Xun Zhou, Jingyan Zhu,
SUPPLEMENTARY INFORMATION
 Figure S1 Treatment with both Sema6D and Plexin-A1 sirnas induces the phenotype essentially identical to that induced by treatment with Sema6D sirna alone or Plexin-A1 sirna alone. (a,b) The cardiac tube
A Normal Exencephaly Craniora- Spina bifida Microcephaly chischisis. Midbrain Forebrain/ Forebrain/ Hindbrain Spinal cord Hindbrain Hindbrain
 A Normal Exencephaly Craniora- Spina bifida Microcephaly chischisis NTD Number of embryos % among NTD Embryos Exencephaly 52 74.3% Craniorachischisis 6 8.6% Spina bifida 5 7.1% Microcephaly 7 1% B Normal
Supplementary Figure 1
 Supplementary Figure 1 a γ-h2ax MDC1 RNF8 FK2 BRCA1 U2OS Cells sgrna-1 ** 60 sgrna 40 20 0 % positive Cells (>5 foci per cell) b ** 80 sgrna sgrna γ-h2ax MDC1 γ-h2ax RNF8 FK2 MDC1 BRCA1 RNF8 FK2 BRCA1
Fig. S1. Subcellular localization of overexpressed LPP3wt-GFP in COS-7 and HeLa cells. Cos7 (top) and HeLa (bottom) cells expressing for 24 h human
 and HeLa (bottom) cells expressing for 24 h human") Fig. S1. Subcellular localization of overexpressed LPP3wt-GFP in COS-7 and HeLa cells. Cos7 (top) and HeLa (bottom) cells expressing for 24 h human LPP3wt-GFP, fixed and stained for GM130 (A) or Golgi97
Fig. S1. Subcellular localization of overexpressed LPP3wt-GFP in COS-7 and HeLa cells. Cos7 (top) and HeLa (bottom) cells expressing for 24 h human LPP3wt-GFP, fixed and stained for GM130 (A) or Golgi97
supplementary information
 DOI: 10.1038/ncb2153 Figure S1 Ectopic expression of HAUSP up-regulates REST protein. (a) Immunoblotting showed that ectopic expression of HAUSP increased REST protein levels in ENStemA NPCs. (b) Immunofluorescent
nature methods Organelle-specific, rapid induction of molecular activities and membrane tethering
 nature methods Organelle-specific, rapid induction of molecular activities and membrane tethering Toru Komatsu, Igor Kukelyansky, J Michael McCaffery, Tasuku Ueno, Lidenys C Varela & Takanari Inoue Supplementary
Supplementary Figures Supplementary Figure 1. Development of the camp biosensor targeted to the SERCA2a microdomain.
 Supplementary Figures Supplementary Figure 1. Development of the camp biosensor targeted to the SERCA2a microdomain. A B C (A) Schematic representation of the new constructs designed for local camp imaging.
Supplementary Figure 1. PD-L1 is glycosylated in cancer cells. (a) Western blot analysis of PD-L1 in breast cancer cells. (b) Western blot analysis
 Western blot analysis of PD-L1 in breast cancer cells. (b) Western blot analysis") Supplementary Figure 1. PD-L1 is glycosylated in cancer cells. (a) Western blot analysis of PD-L1 in breast cancer cells. (b) Western blot analysis of PD-L1 in ovarian cancer cells. (c) Western blot analysis
Supplementary Figure 1. PD-L1 is glycosylated in cancer cells. (a) Western blot analysis of PD-L1 in breast cancer cells. (b) Western blot analysis of PD-L1 in ovarian cancer cells. (c) Western blot analysis
(a) Significant biological processes (upper panel) and disease biomarkers (lower panel)
 Significant biological processes (upper panel) and disease biomarkers (lower panel)") Supplementary Figure 1. Functional enrichment analyses of secretomic proteins. (a) Significant biological processes (upper panel) and disease biomarkers (lower panel) 2 involved by hrab37-mediated secretory
Supplementary Figure 1. Functional enrichment analyses of secretomic proteins. (a) Significant biological processes (upper panel) and disease biomarkers (lower panel) 2 involved by hrab37-mediated secretory
SUPPLEMENTARY INFORMATION
 DOI:.38/ncb3399 a b c d FSP DAPI 5mm mm 5mm 5mm e Correspond to melanoma in-situ Figure a DCT FSP- f MITF mm mm MlanaA melanoma in-situ DCT 5mm FSP- mm mm mm mm mm g melanoma in-situ MITF MlanaA mm mm
SUPPLEMENTAL FIGURE LEGENDS
 SUPPLEMENTAL FIGURE LEGENDS Supplemental Figure S1: Endogenous interaction between RNF2 and H2AX: Whole cell extracts from 293T were subjected to immunoprecipitation with anti-rnf2 or anti-γ-h2ax antibodies
Protection against doxorubicin-induced myocardial dysfunction in mice by cardiac-specific expression of carboxyl terminus of hsp70-interacting protein
 Protection against doxorubicin-induced myocardial dysfunction in mice by cardiac-specific expression of carboxyl terminus of hsp70-interacting protein Lei Wang 1, Tian-Peng Zhang 1, Yuan Zhang 2, Hai-Lian
SUPPLEMENTARY INFORMATION
 SUPPLEMENTARY INFORMATION doi:1.138/nature9814 a A SHARPIN FL B SHARPIN ΔNZF C SHARPIN T38L, F39V b His-SHARPIN FL -1xUb -2xUb -4xUb α-his c Linear 4xUb -SHARPIN FL -SHARPIN TF_LV -SHARPINΔNZF -SHARPIN
E10.5 E18.5 P2 10w 83w NF1 HF1. Sham ISO. Bmi1. H3K9me3. Lung weight (g)
") Myociyte cross-sectional Relative mrna levels Relative levels Relative mrna levels Supplementary Figures and Legends a 8 6 4 2 Ezh2 E1.5 E18.5 P2 1w 83w b Ezh2 p16 amhc b-actin P2 43w kd 37 86 16 wt mouse
Myociyte cross-sectional Relative mrna levels Relative levels Relative mrna levels Supplementary Figures and Legends a 8 6 4 2 Ezh2 E1.5 E18.5 P2 1w 83w b Ezh2 p16 amhc b-actin P2 43w kd 37 86 16 wt mouse
IP: anti-gfp VPS29-GFP. IP: anti-vps26. IP: anti-gfp - + +
 FAM21 Strump. WASH1 IP: anti- 1 2 3 4 5 6 FAM21 Strump. FKBP IP: anti-gfp VPS29- GFP GFP-FAM21 tail H H/P P H H/P P c FAM21 FKBP Strump. VPS29-GFP IP: anti-gfp 1 2 3 FKBP VPS VPS VPS VPS29 1 = VPS29-GFP
p47 negatively regulates IKK activation by inducing the lysosomal degradation of polyubiquitinated NEMO
 Supplementary Information p47 negatively regulates IKK activation by inducing the lysosomal degradation of polyubiquitinated NEMO Yuri Shibata, Masaaki Oyama, Hiroko Kozuka-Hata, Xiao Han, Yuetsu Tanaka,
SUPPLEMENTARY INFORMATION
 a c e doi:10.1038/nature10407 b d f Supplementary Figure 1. SERCA2a complex analysis. (a) Two-dimensional SDS-PAGE gels of SERCA2a complexes. A silver-stained SDSPAGE gel is shown, which reveals a 12 kda
Supplementary Figure 1 Induction of cellular senescence and isolation of exosome. a to c, Pre-senescent primary normal human diploid fibroblasts
 Supplementary Figure 1 Induction of cellular senescence and isolation of exosome. a to c, Pre-senescent primary normal human diploid fibroblasts (TIG-3 cells) were rendered senescent by either serial passage
Tumor suppressor Spred2 interaction with LC3 promotes autophagosome maturation and induces autophagy-dependent cell death
 www.impactjournals.com/oncotarget/ Oncotarget, Supplementary Materials 2016 Tumor suppressor Spred2 interaction with LC3 promotes autophagosome maturation and induces autophagy-dependent cell death Supplementary
Supplementary Figure 1. Baf60c and baf180 are induced during cardiac regeneration in zebrafish. RNA in situ hybridization was performed on paraffin
 Supplementary Figure 1. Baf60c and baf180 are induced during cardiac regeneration in zebrafish. RNA in situ hybridization was performed on paraffin sections from sham-operated adult hearts (a and i) and
TRAF6 ubiquitinates TGFβ type I receptor to promote its cleavage and nuclear translocation in cancer
 Supplementary Information TRAF6 ubiquitinates TGFβ type I receptor to promote its cleavage and nuclear translocation in cancer Yabing Mu, Reshma Sundar, Noopur Thakur, Maria Ekman, Shyam Kumar Gudey, Mariya
Supplemental Information
 Supplemental Information Tobacco-specific Carcinogen Induces DNA Methyltransferases 1 Accumulation through AKT/GSK3β/βTrCP/hnRNP-U in Mice and Lung Cancer patients Ruo-Kai Lin, 1 Yi-Shuan Hsieh, 2 Pinpin
Supplementary Figure 1 P53 is degraded following Chlamydia infection independent of the cell lysis and protein sample preparation procedure applied.
 Supplementary Figure 1 P53 is degraded following Chlamydia infection independent of the cell lysis and protein sample preparation procedure applied. (a) Western blotting analysis showing degradation of
Supplementary Figure 1. Normal T lymphocyte populations in Dapk -/- mice. (a) Normal thymic development in Dapk -/- mice. Thymocytes from WT and Dapk
 Normal thymic development in Dapk -/- mice. Thymocytes from WT and Dapk") Supplementary Figure 1. Normal T lymphocyte populations in Dapk -/- mice. (a) Normal thymic development in Dapk -/- mice. Thymocytes from WT and Dapk -/- mice were stained for expression of CD4 and CD8.
Supplementary Figure 1. Normal T lymphocyte populations in Dapk -/- mice. (a) Normal thymic development in Dapk -/- mice. Thymocytes from WT and Dapk -/- mice were stained for expression of CD4 and CD8.
effects on organ development. a-f, Eye and wing discs with clones of ε j2b10 show no
 Supplementary Figure 1. Loss of function clones of 14-3-3 or 14-3-3 show no significant effects on organ development. a-f, Eye and wing discs with clones of 14-3-3ε j2b10 show no obvious defects in Elav
Effects of UBL5 knockdown on cell cycle distribution and sister chromatid cohesion
 Supplementary Figure S1. Effects of UBL5 knockdown on cell cycle distribution and sister chromatid cohesion A. Representative examples of flow cytometry profiles of HeLa cells transfected with indicated
Hearts were fixed in 4% paraformaldehyde (ph 7.4) overnight, embedded in paraffin, and
 overnight, embedded in paraffin, and") SUPPLEMENTAL MATERIAL Supplemental Methods: Histology of Heart Hearts were fixed in 4% paraformaldehyde (ph 7.4) overnight, embedded in paraffin, and serially sectioned into 5-µm slices. Standard hematoxylin
SUPPLEMENTAL MATERIAL Supplemental Methods: Histology of Heart Hearts were fixed in 4% paraformaldehyde (ph 7.4) overnight, embedded in paraffin, and serially sectioned into 5-µm slices. Standard hematoxylin
SUPPLEMENTARY INFORMATION
 DOI:.38/ncb2822 a MTC02 FAO cells EEA1 b +/+ MEFs /DAPI -/- MEFs /DAPI -/- MEFs //DAPI c HEK 293 cells WCE N M C P AKT TBC1D7 Lamin A/C EEA1 VDAC d HeLa cells WCE N M C P AKT Lamin A/C EEA1 VDAC Figure
The clathrin adaptor Numb regulates intestinal cholesterol. absorption through dynamic interaction with NPC1L1
 The clathrin adaptor Numb regulates intestinal cholesterol absorption through dynamic interaction with NPC1L1 Pei-Shan Li 1, Zhen-Yan Fu 1,2, Ying-Yu Zhang 1, Jin-Hui Zhang 1, Chen-Qi Xu 1, Yi-Tong Ma
Gallic acid prevents isoproterenol-induced cardiac hypertrophy and fibrosis through regulation of JNK2 signaling and Smad3 binding activity
 Gallic acid prevents isoproterenol-induced cardiac hypertrophy and fibrosis through regulation of JNK2 signaling and Smad3 binding activity Yuhee Ryu 1,+, Li Jin 1,2+, Hae Jin Kee 1,, Zhe Hao Piao 3, Jae
Supplemental Figure 1
 Supplemental Figure 1 A S100A4: SFLGKRTDEAAFQKLMSNLDSNRDNEVDFQEYCVFLSCIAMMCNEFFEGFPDK Overlap: SF G DE KLM LD N D VDFQEY VFL I M N FF G PD S100A2: SFVGEKVDEEGLKKLMGSLDENSDQQVDFQEYAVFLALITVMCNDFFQGCPDR
Live cell imaging of trafficking of the chaperone complex vaccine to the ER. BMDCs were incubated with ER-Tracker Red (1 M) in staining solution for
 in staining solution for") Live cell imaging of trafficking of the chaperone complex vaccine to the ER. BMDCs were incubated with ER-Tracker Red (1 M) in staining solution for 15 min at 37 C and replaced with fresh complete medium.
Live cell imaging of trafficking of the chaperone complex vaccine to the ER. BMDCs were incubated with ER-Tracker Red (1 M) in staining solution for 15 min at 37 C and replaced with fresh complete medium.
Supplemental Information. Menin Deficiency Leads to Depressive-like. Behaviors in Mice by Modulating. Astrocyte-Mediated Neuroinflammation
 Neuron, Volume 100 Supplemental Information Menin Deficiency Leads to Depressive-like Behaviors in Mice by Modulating Astrocyte-Mediated Neuroinflammation Lige Leng, Kai Zhuang, Zeyue Liu, Changquan Huang,
Supplementary information
 Supplementary information 1 Supplementary Figure 1. CALM regulates autophagy. (a). Quantification of LC3 levels in the experiment described in Figure 1A. Data are mean +/- SD (n > 3 experiments for each
Postn MCM Smad2 fl/fl Postn MCM Smad3 fl/fl Postn MCM Smad2/3 fl/fl. Postn MCM. Tgfbr1/2 fl/fl TAC
 A Smad2 fl/fl Smad3 fl/fl Smad2/3 fl/fl Tgfbr1/2 fl/fl 1. mm B Tcf21 MCM Tcf21 MCM Smad3 fl/fl Tcf21 MCM Smad2/3 fl/fl Tcf21 MCM Tgfbr1/2 fl/fl αmhc MCM C 1. mm 1. mm D Smad2 fl/fl Smad3 fl/fl Smad2/3
T H E J O U R N A L O F C E L L B I O L O G Y
 T H E J O U R N A L O F C E L L B I O L O G Y Supplemental material Krenn et al., http://www.jcb.org/cgi/content/full/jcb.201110013/dc1 Figure S1. Levels of expressed proteins and demonstration that C-terminal
Predictive PP1Ca binding region in BIG3 : 1,228 1,232aa (-KAVSF-) HEK293T cells *** *** *** KPL-3C cells - E E2 treatment time (h)
 HEK293T cells *** *** *** KPL-3C cells - E E2 treatment time (h)") Relative expression ERE-luciferase activity activity (pmole/min) activity (pmole/min) activity (pmole/min) activity (pmole/min) MCF-7 KPL-3C ZR--1 BT-474 T47D HCC15 KPL-1 HBC4 activity (pmole/min) a d
Relative expression ERE-luciferase activity activity (pmole/min) activity (pmole/min) activity (pmole/min) activity (pmole/min) MCF-7 KPL-3C ZR--1 BT-474 T47D HCC15 KPL-1 HBC4 activity (pmole/min) a d
hemodynamic stress. A. Echocardiographic quantification of cardiac dimensions and function in
 SUPPLEMENTAL FIGURE LEGENDS Supplemental Figure 1. Fbn1 C1039G/+ hearts display normal cardiac function in the absence of hemodynamic stress. A. Echocardiographic quantification of cardiac dimensions and
SUPPLEMENTARY INFORMATION
 doi:10.1038/nature10188 Supplementary Figure 1. Embryonic epicardial genes are down-regulated from midgestation stages and barely detectable post-natally. Real time qrt-pcr revealed a significant down-regulation
SUPPLEMENTARY INFORMATION
 DOI: 10.1038/ncb3076 Supplementary Figure 1 btrcp targets Cep68 for degradation during mitosis. a) Cep68 immunofluorescence in interphase and metaphase. U-2OS cells were transfected with control sirna
Supplementary Figure 1
 Supplementary Figure 1 Supplementary Figure 1 Schematic depiction of the tandem Fc GDF15. Supplementary Figure 2 Supplementary Figure 2 Gfral mrna levels in the brains of both wild-type and knockout Gfral
(a) Schematic diagram of the FS mutation of UVRAG in exon 8 containing the highly instable
 Schematic diagram of the FS mutation of UVRAG in exon 8 containing the highly instable") Supplementary Figure 1. Frameshift (FS) mutation in UVRAG. (a) Schematic diagram of the FS mutation of UVRAG in exon 8 containing the highly instable A 10 DNA repeat, generating a premature stop codon
Supplementary Figure 1. Frameshift (FS) mutation in UVRAG. (a) Schematic diagram of the FS mutation of UVRAG in exon 8 containing the highly instable A 10 DNA repeat, generating a premature stop codon
SUPPLEMENTARY INFORMATION
 sirna pool: Control Tetherin -HA-GFP HA-Tetherin -Tubulin Supplementary Figure S1. Knockdown of HA-tagged tetherin expression by tetherin specific sirnas. HeLa cells were cotransfected with plasmids expressing
RAW264.7 cells stably expressing control shrna (Con) or GSK3b-specific shrna (sh-
 or GSK3b-specific shrna (sh-") 1 a b Supplementary Figure 1. Effects of GSK3b knockdown on poly I:C-induced cytokine production. RAW264.7 cells stably expressing control shrna (Con) or GSK3b-specific shrna (sh- GSK3b) were stimulated
1 a b Supplementary Figure 1. Effects of GSK3b knockdown on poly I:C-induced cytokine production. RAW264.7 cells stably expressing control shrna (Con) or GSK3b-specific shrna (sh- GSK3b) were stimulated
Probe. Hind III Q,!?R'!! /0!!!!D1"?R'! vector. Homologous recombination
 Supple-Zhang Page 1 Wild-type locus Targeting construct Targeted allele Exon Exon3 Exon Probe P1 P P3 FRT FRT loxp loxp neo vector amh I Homologous recombination neo P1 P P3 FLPe recombination Q,!?R'!!
Supplementary Table 1. List of primers used in this study
 Supplementary Table 1. List of primers used in this study Gene Forward primer Reverse primer Rat Met 5 -aggtcgcttcatgcaggt-3 5 -tccggagacacaggatgg-3 Rat Runx1 5 -cctccttgaaccactccact-3 5 -ctggatctgcctggcatc-3
Control. csarnt -/- Cre, f/f
 ody weight (g) A re,f/f re x f/f f/+ re, f/+ re,f/+ f/f x f/f f/+ cs -/- re, f/f re f/f re, f/f Normal chow Tamoxifen Tamoxifen Tamoxifen W 4W re f/f re, re/ff f/f re f/f re, re/ff f/f Normal chow Tamoxifen
Supplementary Figure 1. Characterization of ALDH-positive cell population in MCF-7 cells. (a) Expression level of stem cell markers in MCF-7 cells or
 Expression level of stem cell markers in MCF-7 cells or") Supplementary Figure 1. Characterization of ALDH-positive cell population in MCF-7 cells. (a) Expression level of stem cell markers in MCF-7 cells or ALDH-positive cell population by qpcr. Data represent
Supplementary Figure 1. Characterization of ALDH-positive cell population in MCF-7 cells. (a) Expression level of stem cell markers in MCF-7 cells or ALDH-positive cell population by qpcr. Data represent
Supplementary Figure 1. Prevalence of U539C and G540A nucleotide and E172K amino acid substitutions among H9N2 viruses. Full-length H9N2 NS
 Supplementary Figure 1. Prevalence of U539C and G540A nucleotide and E172K amino acid substitutions among H9N2 viruses. Full-length H9N2 NS nucleotide sequences (a, b) or amino acid sequences (c) from
Supplementary Figure 1. Characterization of NMuMG-ErbB2 and NIC breast cancer cells expressing shrnas targeting LPP. NMuMG-ErbB2 cells (a) and NIC
 and NIC") Supplementary Figure 1. Characterization of NMuMG-ErbB2 and NIC breast cancer cells expressing shrnas targeting LPP. NMuMG-ErbB2 cells (a) and NIC cells (b) were engineered to stably express either a LucA-shRNA
Supplementary Figure 1. Characterization of NMuMG-ErbB2 and NIC breast cancer cells expressing shrnas targeting LPP. NMuMG-ErbB2 cells (a) and NIC cells (b) were engineered to stably express either a LucA-shRNA
Supplementary Figure 1. Expression of CUGBP1 in non-parenchymal liver cells treated with TGF-β
 Supplementary Figures Supplementary Figure 1. Expression of CUGBP1 in non-parenchymal liver cells treated with TGF-β and LPS. Non-parenchymal liver cells were isolated and treated with or without TGF-β
SUPPLEMENTARY FIGURES AND TABLE
 SUPPLEMENTARY FIGURES AND TABLE Supplementary Figure S1: Characterization of IRE1α mutants. A. U87-LUC cells were transduced with the lentiviral vector containing the GFP sequence (U87-LUC Tet-ON GFP).
Supplementary Figure 1: Signaling centers contain few proliferating cells, express p21, and
 Supplementary Figure 1: Signaling centers contain few proliferating cells, express p21, and exclude YAP from the nucleus. (a) Schematic diagram of an E10.5 mouse embryo. (b,c) Sections at B and C in (a)
Supplementary Figure 1. Repression of hepcidin expression in the liver of mice treated with
 Supplementary Figure 1. Repression of hepcidin expression in the liver of mice treated with DMN Immunohistochemistry for hepcidin and H&E staining (left). qrt-pcr assays for hepcidin in the liver (right).
Supplementary Figure 1. Electroporation of a stable form of β-catenin causes masses protruding into the IV ventricle. HH12 chicken embryos were
 Supplementary Figure 1. Electroporation of a stable form of β-catenin causes masses protruding into the IV ventricle. HH12 chicken embryos were electroporated with β- Catenin S33Y in PiggyBac expression
Supplementary Table 1. Metabolic parameters in GFP and OGT-treated mice
 Supplementary Table 1. Metabolic parameters in GFP and OGT-treated mice Fasted Refed GFP OGT GFP OGT Liver G6P (mmol/g) 0.03±0.01 0.04±0.02 0.60±0.04 0.42±0.10 A TGs (mg/g of liver) 20.08±5.17 16.29±0.8
Supplementary Figure S1. Venn diagram analysis of mrna microarray data and mirna target analysis. (a) Western blot analysis of T lymphoblasts (CLS)
 Western blot analysis of T lymphoblasts (CLS)") Supplementary Figure S1. Venn diagram analysis of mrna microarray data and mirna target analysis. (a) Western blot analysis of T lymphoblasts (CLS) and their exosomes (EXO) in resting (REST) and activated
Supplementary Figure S1. Venn diagram analysis of mrna microarray data and mirna target analysis. (a) Western blot analysis of T lymphoblasts (CLS) and their exosomes (EXO) in resting (REST) and activated
SUPPLEMENTARY INFORMATION
 DOI: 1.138/ncb3355 a S1A8 + cells/ total.1.8.6.4.2 b S1A8/?-Actin c % T-cell proliferation 3 25 2 15 1 5 T cells Supplementary Figure 1 Inter-tumoral heterogeneity of MDSC accumulation in mammary tumor
Loss of Calreticulin Uncovers a Critical Role for Calcium in Regulating Cellular Lipid Homeostasis
 SUPPLEMENTARY MATERIAL Loss of Calreticulin Uncovers a Critical Role for Calcium in Regulating Cellular Lipid Homeostasis Wen-An Wang 1, Wen-Xin Liu 1, Serpen Durnaoglu 2, Sun-Kyung Lee 2, Jihong Lian
Figure S1, Beyer et al.
 Figure S1, eyer et al. Pax7 Myogenin si sitrl Hoechst T = 72h 14 1.8.6.4.2 12 1 8 6 4 2 24h 48h 96h diff. sitrl siset1 212 72h diff. b1 td r t Se km MyH Vinculin Myogenin β-ctin Vinculin MW b1 ka td r