Dose-dependent effects of sirna-mediated inhibition of SCAP on PCSK9, LDLR and
|
|
|
- Adrian Powers
- 6 years ago
- Views:
Transcription
1 Dose-dependent effects of sirna-mediated inhibition of SCAP on PCSK9, LDLR and plasma lipids in mouse and rhesus monkey Kristian K. Jensen 1, 8*, Marija Tadin-Strapps 2*, Sheng-ping Wang 1, James Hubert 1, Yanqing Kan 1, Yong Ma 3, David G. McLaren 4, Stephen F. Previs 1, Kithsiri Herath 1, Ablatt Mahsut 1, Andy Liaw 5, Shubing Wang 5, Steven J. Stout 1, CarolAnn Keohan 4, Gail Forrest 4, David Coelho 3, Satya Yendluri 3, Stephanie Williams 6, Martin Koser 6, Steven Bartz 7, Karen O. Akinsanya 1, Shirly Pinto 1 1 Cardiometabolic Disease, Merck & Co. Inc., Kenilworth, NJ 2 Genetics and Pharmacogenomics, Merck & Co. Inc., Boston, MA 3 Sirna Therapeutics, a wholly owned subsidiary of Merck & Co. Inc., San Francisco, CA 4 Pharmacology, Merck & Co. Inc., Kenilworth, NJ 5 Biostatistics, Merck & Co. Inc., Rahway, NJ 6 RNA Therapeutics, Merck & Co. Inc., West Point, PA 7 Business Development & Licensing, Merck & Co., San Francisco, CA 8 Corresponding author: Kristian K. Jensen, Cardiometabolic Disease, Merck & Co. Inc., Kenilworth, NJ; Tel: ; Fax: ; kristian_jensen@merck.com *These authors contributed equally to this manuscript Running Title: Effect of SCAP sirna knockdown on Pcsk9 and plasma lipids 1
2 ABSTRACT SREBP cleavage-activating protein (SCAP) is a key protein in the regulation of lipid metabolism and a potential target for treatment of dyslipidemia. SCAP is required for activation of the transcription factors SREBP-1 and -2. SREBPs regulate the expression of genes involved in fatty acid and cholesterol biosynthesis, and LDL-C clearance through the regulation of LDLR and PCSK9 expression. To further test the potential of SCAP as a novel target for treatment of dyslipidemia, we used short interfering RNAs (sirna) to inhibit hepatic SCAP expression and assess the effect on PCSK9, LDLR and lipids in mice and rhesus monkeys. In mice, robust liver Scap mrna knockdown (KD) was achieved, accompanied by dose-dependent reduction in SREBP-regulated genes expression, de novo lipogenesis, and plasma PCSK9 and lipids. In rhesus, over 90 percent SCAP mrna KD was achieved resulting in approximately 75, 50 and 50 percent reduction of plasma PCSK9, TG and LDL-C, respectively. Inhibition of SCAP function was demonstrated by reduced expression of SREBP regulated genes and de novo lipogenesis. In conclusion, sirna-mediated inhibition of SCAP resulted in a significant reduction in circulating PCSK9 and LDL-C in rodent and primate models supporting SCAP as a novel target for the treatment of dyslipidemia. Keywords: Lipid and lipoprotein metabolism, Metabolic Disease, Lipids/Liver, Animal Models, LDL, Drug Therapy, Cholesterol, SREBP Cleavage-Activating Protein, Cardiometabolic Disease, Dyslipidemia 2
3 INTRODUCTION SREBP cleavage-activating protein (SCAP) is a well-characterized, key regulator of lipid metabolism (1, 2). Its effects on lipid metabolism are mediated through interaction with the SREBP transcription factors, which activate the expression of genes involved in fatty acid, triglyceride and cholesterol biosynthesis as well as clearance of lipoproteins through regulation of LDL receptor and PCSK9 gene expression (3, 4). In the liver, SCAP integrates cholesterol sensing as well as insulin signaling into the regulation of SREBP transcriptional activity (5, 6). Deletion of liver SCAP in mouse models leads to a reduction in the expression of SREBP regulated genes, de novo free fatty acid and cholesterol synthesis, liver TG levels and plasma lipid levels (7, 8). Over-expression of SREBP-1c in mice results in fatty liver, increased VLDL secretion and increased plasma lipid levels (9, 10). Further, in rodent models of type 2 diabetes mellitus, augmented insulin signaling causes an induction of SREBP-1c activation, fatty acid synthesis and accumulation of TG in the liver as well as increased VLDL secretion (5, 11). In hamsters fed a high sucrose-diet, SCAP knockdown (KD) by sirna reduced the expression of SREBP regulated genes, normalized liver and plasma TG levels and reduced TG secretion. LDLR and PCSK9 mrna levels were both reduced by SCAP mrna KD, however, LDLR protein levels were maintained probably due to reduced levels of PCSK9 in circulation (8). Based on these observations from preclinical models, targeting SCAP may be of therapeutic benefit for treatment of dyslipidemia and fatty liver disease. Because of the complex role of SCAP in regulation of lipid metabolism, it is important to demonstrate the translatability of the rodent findings into a higher species with lipid metabolism pathways more closely resembling that of humans. Specifically, since inhibition of SCAP negatively regulates both LDLR and PCSK9 mrna expression, and PCSK9 is a negative regulator of LDLR, it is critical to determine the effect of targeting SCAP on the balance of LDLR and PCSK9 and how this ultimately affects LDL-C levels in such a model. Rhesus monkeys have been extensively used as a model for human lipid metabolism (12-14). Here, we describe the effects of hepatic SCAP knockdown on SREBP activity and lipid metabolism in rhesus monkeys using sirna targeting. In parallel, we examined the effects of SCAP 3
4 knockdown on SREBP pathway activity and lipid metabolism in mice. Our studies investigate the dosedependent effects of hepatic SCAP inhibition on the balance of PCSK9 and LDLR expression. We demonstrate that SCAP sirna-mediated knockdown results in reduction in plasma PCSK9, TG and LDL-C in mice and rhesus monkeys. 4
5 MATERIALS AND METHODS sirna synthesis, lead selection and LNP preparation For mouse sirna identification, 42 sequences were designed against mouse Scap transcript NM_ For non-human primate (NHP) sirna identification, 84 sequences were designed to have 100 % human/rhesus homology using human SCAP transcript NM_ and rhesus SCAP transcript XM_ Oligos were synthesized and screened in mouse Hela 1-6 cells (ATCC, VA, USA) and rhesus LLC-MK2 cells (ATCC, VA, USA) as previously described (15). The sequence of mouse and NHP lead SCAP sirnas are shown in Table 1 (all in 5-3 direction). sirna oligos contained the following chemical modification added to the 2 position of the ribose sugar where indicated: deoxy (d), 2 fluoro (flu), or 2 O-methyl (ome). Modification abbreviations are given immediately preceding the base to which they were applied. Passenger strands are blocked with an inverted abasic nucleotide on the 5 and 3 ends (ib). Non-targeting control sirnas (nt controls) used in the experiments are listed in Table 2 (all in 5-3 direction). PCSK9 sirna oligo used in NHP studies and Pcsk9 and ApoB oligo used in mouse studies were described previously (15, 16). For in vivo studies, lead sirna oligos were formulated in lipid nanopartiocle (LNP) as previously reported (15, 17). Briefly, sirnas were incorporated into the LNPs with high encapsulation efficiency by mixing sirna in citrate buffer with an ethanolic solution of the lipid mixture, followed by a stepwise diafiltration process. The sirna concentration in LNPs was determined by a gradient strong anionexchange method. Encapsulation efficiency of sirna was greater than 90 % for all LNP formulations, as measured by SYBR gold fluorimetric method. All sirna LNP formulations were delivered systemically using intravenous (i.v.) route. In vivo sirna characterization in C57BL/6 mice All procedures described below were approved by the Merck Research Laboratories Institutional Animal Care and Use Committee and carried out in accordance with the Guide for the Care and Use of 5
6 Laboratory Animals. Male C57BL/6 mice were obtained from Taconic Farms (Germantown, NY). Mice were maintained in a 12-hour/12-hour light-dark cycle with free access to food and water in group housing conditions in a temperature-controlled environment (22 C). All mice were maintained on regular rodent chow (7012; Teklad, Madison, WI; 5% dietary fat; 3.75 kcal/g). C57BL/6 mice (N=4) received a single intravenous (i.v.) dose of 1 mg/kg of Scap sirna-lnp, nontargeting sirna-lnp (nt control 1) or vehicle control. Animals were dosed via tail vein injections. On day 7, 14, 21, and 28 after sirna dosing, the mice were euthanized with CO 2 and liver samples were collected. Scap mrna levels measured as previously described (18). For the sirna dose titration study, male C57BL/6 mice (N=8) were dosed intravenously (i.v.) on day 0 with vehicle control, non-targeting sirna (0.5 mg/kg) or different doses of Scap sirna ( , , 0.125, and 0.5 mg/kg). On day 10, food was removed in the morning for 4 hours following which mice were dosed with D 2 O (Sigma, MO, USA) at 20 ml/kg, intraperitoneally. 4 hour post D 2 O injection, mice were euthanized with CO 2 and EDTA plasma was collected via cardiac puncture, and was reserved for lipids, circulating PCSK9, fatty acid/cholesterol synthesis analyses. Livers were collected either in RNAlater or snap-frozen in liquid nitrogen and stored at 80 C for gene expression/protein analysis. Taqman qpcr was done on an ABI 7900 Real-Time PCR System using commercially available Taqman probes and primers (Applied Biosystems mouse GAPDH, Cat # E; mouse Scap, Assay ID Mm _m1 mouse Pcsk9, Assay ID Mm _m1; mouse Ldlr, Assay ID Mm _m1). Data analysis was performed as described previously (15). Hepatic triglyceride secretion in C57BL/6 mice On day 0, mice were dosed via tail vein injection with either a control sirna at 0.5 mg/kg, or Scap sirna at , 0.125, and 0.5 mg/kg. One group of mice was dosed with ApoB sirna at 1 mg/kg (i.v.). On day 10, food was removed in the morning for 4 hours following which all mice were administered an intravenous dose of 50 mg/kg (10mL/kg) of [ 13 C 18 ] oleic acid (Cambridge Isotope Labs) 6
7 in 8% fatty acid free BSA. Serial blood samples were obtained via tail nick at t=0 (pre-tracer) and 15, 30, 45, 60 and 90 minutes post-tracer administration. The concentrations of the M 0, M 18 and M 36 isotopologues of triglyceride 52:2 were determined by LC-MS/MS as previously described (19). In order to determine the synthesis rate of newly formed TG 52:2, data at each timepoint from t=15min to t=90min were plotted as enrichments; the decay in enrichment (reflective of the rate of new triglyceride synthesis) were fit to a monoexponential decay function to determine a value for the fractional synthetic rate (k). The rate of production was then determined as multiplied by the average steady-state concentration of TG 52:2 from minutes (20). Simvastatin and Scap sirna co-treatment study Transgenic C57BL/6 mice carrying the human CETP gene including the natural flanking region of the human CETP gene (NFR-CETP) (21) were obtained from Taconic Farms (Germantown, NY). NFR- CETP mice were dose orally daily with 100 mg/kg simvastatin (SIGMA, S6196) or vehicle (0.5% methylcellulose) starting on day 0. On day 4, mice were dosed via tail vein injection with control sirna at 0.5 mg/kg, Pcsk9 sirna at 1 mg/kg or Scap sirna at , 0.125, and 0.5 mg/kg. On day 14, food was removed in the morning for 4 hours. Mice were then euthanized with CO 2 and EDTA plasma was collected via cardiac puncture and livers were collected either in RNAlater or snap-frozen in liquid nitrogen and stored at 80 C for gene expression/protein analysis. Plasma lipids, LDLR western blot and PCSK9 measurements in mice Plasma total cholesterol (Total cholesterol E, Wako Diagnostics) and triglyceride (Infinity, Thermo) were measured by standard biochemical methods using commercially available enzymatic colorimetric kits according to the supplied product protocol. Lipoproteins were fractionated by FPLC (22). The column effluent was mixed with total cholesterol E enzymatic reagent (Wako Diagnostics), and absorbance at 600 nm was continuously recorded. The first, second, and third peak were attributed to VLDL, LDL, and 7
8 HDL, respectively. Lipoprotein cholesterol levels were calculated as % AUC of each peak x total cholesterol. For LDLR western blot, liver samples were homogenized on a MP Fast Prep-24 tissue homogenizer in 1000 ul T-PER (Fisher Cat #: 78510) with 1X Halt Protease Inhibitor (Fisher Cat: 78425) using 2ml tubes (MP biomedicals, Fast Prep-24 Lysing matrix D, ). Protein concentration was measured by BCA method. 100 ug of liver lysate protein were separated on NuPAGE 4-12% Bis-Tris Gel (Invitrogen NP0322) and transferred using iblot (Invitrogen). Membranes were blocked at RT for 1-2 hours using odyssey infrared imaging system blocking buffer (part # ) and incubated with Ldlr and betaactin antibodies (rabbit mab to LDLr (EP1553Y), Abcam and mouse mab beta-actin, Sigma A1978) at 4 C overnight then with secondary antibodies (Donkey anti-rabbit IRDye 680 Li-Cor, Cat# and donkey anti-mouse IRDye 800cw Li-Cor, Cat# ) at RT for 1 h. Band intensities were quantified on an Odyssey infrared imaging system (Li-Cor). PCSK9 was measured using an in-house developed ELISA assays (12). Briefly, the monoclonal antibodies H23 and B20 were used as coating antibody (at 5 ug/ml) and detection antibody (1 ug/ml of the biotinylated form), respectively for mouse PCSK9. Similarly, monoclonal antibody E07 was used as capturing antibody for NHP PCSK9 with B20 as detection antibody. Samples were assayed at 1:8 dilution and purified mouse PCSK9 protein was utilized for making standard curves. ELISA assay was carried out in the standard procedure for the DELFIA detection system (Perkin Elmer), with the plates read on a Perkin Elmer EnVision 2103 Multi-label reader. In vivo sirna characterization in rhesus macaque monkeys All NHP studies were conducted at New Iberia Research Center (NIRC) with the approval by NIRC's and Merck's Institutional Animal Care and Use Committees (IACUC). NIRC facility is accredited by the Association for Assessment and Accreditation of Laboratory Animal Care (AAALAC). Sexually mature male and female lean rhesus macaque monkeys weighing approximately 6-8 kg at the time of the study were randomized into groups based on pre-study body weight and serum lipid levels. Three rhesus 8
9 experiments were performed: 1) sirna sequence selection study; 2) sirna knockdown duration study; 3) sirna dose-titration study. For all three studies animals were dosed intravenously (i.v.) based on body surface area with a single rate controlled timed 2 minute infusion. Blood samples were taken as alert procedure and percutaneous liver biopsies as sedated procedure. In each study serum analysis for clinical chemistry, hematology, and coagulation parameters was performed for each blood collection time point, and level of hepatic SCAP expression at each biopsy time point. For the sequence selection study, animals received 26.7 mg/m 2 (approximately 2 mg/kg equivalent) dose of LNP-encapsulated sirnas (n=4 per group). Blood samples were taken on days -4 and 0 (prior to dosing) and on days 3, 5, 6, 7, 9, 14, 19, 21, and 28 following LNP injections. Percutaneous liver biopsies were performed on day -4 prior, 7, 14, and 28. Total cholesterol, LDL-C, and HDL-C were all measured directly from plasma using the Siemens Dimension assays for Clinical Chemistry Analyzer: CHOL, ALDL, and AHDL respectively (Siemens, Princeton, NJ). Plasma PCSK9 levels were measured as described (12). Taqman qpcr was done on an ABI 7900 Real-Time PCR System using the following primer pairs commercially obtained from ABI: Rh _g1 (GAPDH), Rh _m1 (SCAP), Rh _m1 (PCSK9), Rh _m1 (LDLR). Target knockdown in the liver was determined as previously described (17). For follow up sirna knockdown duration study, group size was increased to ten per group for SCAP (NHP SCAP-1) and non-targeting control (nt control-2) sirna-lnp. PCSK9 sirna was used as a positive control in the study (n=4). Animals received a 26.7 mg/m 2 dose of LNP-encapsulated sirnas. Blood samples were taken on days -7 and 0 (prior to dosing), 3, 7, 10, 14, 16, 17, 18, 21, 25, 28, 35, and 48 following LNP injection. In order to assess the effect of hepatic SCAP knockdown on palmitate and cholesterol synthesis, animals were administered deuterated water (4mL/kg D 2 O by oral gavage) on day 16. Blood samples for the determination of palmitate and cholesterol synthesis were collected as fasted bleeds at:-0.5hr and +4hr, +24h, +48hr, and +5days relative to D 2 O dosing. Percutaneous liver biopsies were performed on day -7, 7, 14, and 28. Serum analysis and liver Taqman RT-PCR was done as described above. 9
10 sirna dose titration study was done using three dose levels of SCAP sirna oligo: 26.7 mg/m 2 (n=4), mg/m 2 (n=8), and 6.68 mg/m 2 (n=8). The dose levels were determined based on body surface area and approximately correspond to 2 mg/kg, 1 mg/kg, and 0.5 mg/kg respectively. Non-targeting control-2 was dosed at mg/m 2 (n=8). Blood samples were taken on days -2 and 0 (prior to dosing), and days 2, 3, 7, 8, 9, 10, 12, 14, 16, 17, 18, 19, 21, 23, and 26 following LNP injection. Percutaneous liver biopsies were performed on day - -2, 3, 12, and 26 post dosing. Serum analysis and liver Taqman RT- PCR was done as described above. Determination of plasma palmitate and cholesterol synthesis. Deuterium enrichment in plasma water (precursor labeling) was determined by GC-MS (23) and enrichment in plasma palmitate and cholesterol (product labeling) was determined either by GC-MS for mouse samples (24) or by gas chromatography-pyrolysis-isotope ratio mass spectrometry for rhesus samples (GC-p-IRMS; (25)). Data analysis for the quantification of lipid synthesis was as previously described (24). Analysis of gene expression in rhesus liver samples. A 384-well format custom designed rhesus PCR array was developed in collaboration with SABiosciences-Qiagen. Genes representing the major lipid and glucose metabolism pathways as well as genes involved in apoptosis, autophagy and inflammatory pathways were selected based on publicly available canonical pathway databases (KEGG, GeneGO and Ingenuity). A total of 372 individual genes and 5 housekeeping genes were assayed. Rhesus Genomic DNA Contamination primer control, reverse transcription control (duplicate) and positive PCR control (duplicate) were included on the array as part of SABiosciences-Qiagen standard array setup. The array is available from SABiosciences-Qiagen, catalog 10
11 number CAPQ Real-time PCR was performed as previously described (24). ACTB, PPIA, GUSB, GAPDH, RPL13A were used as housekeeping control genes. Statistical analysis Mouse data was analyzed by One-way ANOVA with Dunnett s post test except Figure 1D where multiple t-test was used with statistical significance determined using the Holm-Sidak method, with alpha = Bar graphs represent the mean SEM whereas the box and whiskers graphs represent the minimum, the 25th percentile, the median, the 75th percentile, and the maximum. All mouse data was analyzed using GraphPad Prism version 7.00 for Windows (GraphPad Software, San Diego California USA). For the longitudinal NHP studies, the data come in the format of repeated measures, for which it has become standard to quantify the mean profiles of treatments and both variation between-subject and variation within-subject over time, using a linear mixed-effects model (26): Y Time * Treatment ID error. Here Time * Treatment is the mean response over time for each of the four groups separately (time and treatment interaction). It is the fixed effect for this linear mixed effects model. ID is the random effect, which characterizes inherent mean individual differences among subjects (between-subject variation). Finally, error is the residual after all fixed and random effects are removed. It is also known as the within-subject error term, or within-subject variation. To test the drug effects, we compare the mean change-from-baseline of a treated group versus that of Vehicle group using a linear contrast (combination) of Time*Treatment levels, where the mean effect and the its standard error can be estimated using an R-package "gmodels", which was developed by Warnes et al. ( To compare the treatment effects across different biomarkers, we further characterize the treatment effect using effect size (ES), where the mean effect is divided by the standard deviation of the population. Unlike P-values or T-statistics, ESs are 11
12 independent of the sample sizes. ESs are also normalized by their standard deviations, therefore, we can compare and rank the sensitivities among biomarkers based on their ESs. 12
13 RESULTS sirna lead selection For mouse studies, 42 sirna oligos were screened in Hepa 1-6 cells. sirnas were first evaluated in primary screen for maximum target mrna knockdown followed by assessment of sirnas potency in 10-point dose response experiments. As indicated in Table 3, four sequences were identified with greater than 3 ddct (>85%) mrna knockdown and sub-nanomolar IC50 values. All four oligos were scaled-up and formulated for evaluation in C57BL/6 mice. Assessment of hepatic Scap knockdown was done on days 1 and 3 post sirna-lnp dosing. m-scap-1 and mscap-3 sirnas were comparable in terms of in vitro and in vivo KD levels as shown in Table 3. m-scap-1 was selected for further in vivo qualification and was evaluated for duration of in vivo silencing (see section below). For NHP experiments, 84 sirna oligos were screened in rhesus MK2D cells. sirna activity was evaluated in primary screen for maximum silencing activity followed by two rounds of dose-response experiments and assessment of duration of silencing activity. Summary of in vitro characterization of two rhesus SCAP leads is shown in Table 4. Liver SCAP knockdown in mouse dose-dependently affects Scap mrna and SREBP pathway activity In vivo qualification of mouse Scap sirna was performed in C57BL/6 mice (N=4 per group). In order to assess the magnitude and duration of knockdown of Scap mrna in the liver, animals were dosed with a single dose of m-scap-1 sirna-lnp and liver samples collected at different time points. As shown in Supplemental Figure S1A, greater than 90% mrna knockdown was observed following a single dose of m-scap-1 sirna. This degree of silencing was maintained over a period of 3 weeks and mrna levels were reduced by 75% at day 28 post dosing. In agreement with the earlier reports for this lipid nanoparticle formulation (15), sirna-lnp treatment was well tolerated based on the assessment of 13
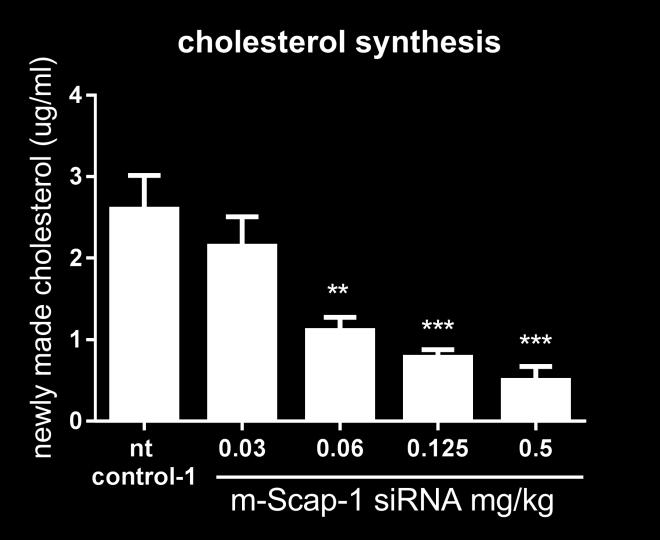
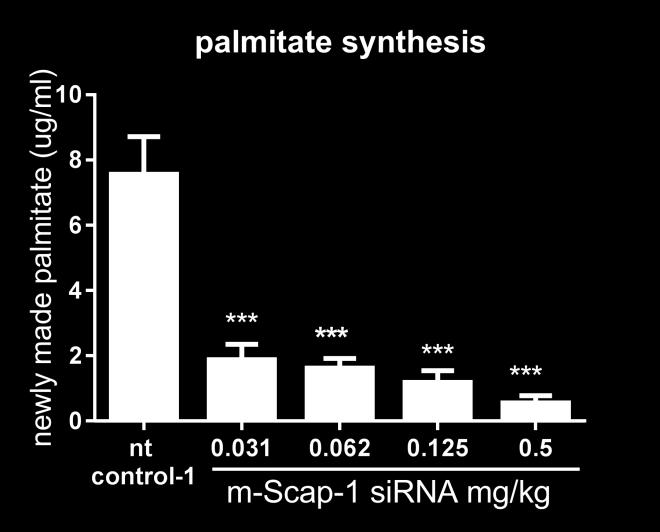
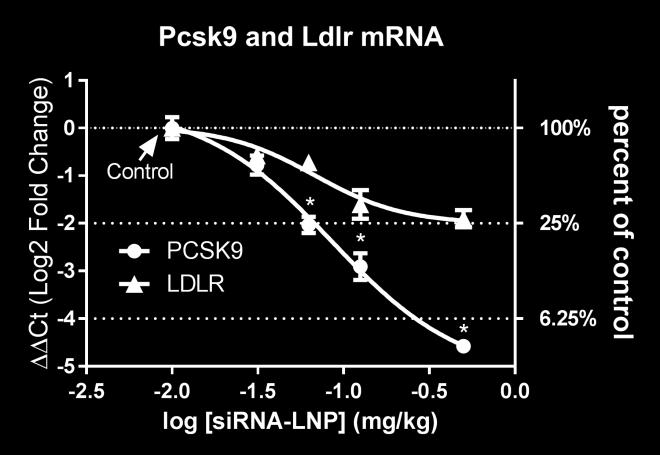
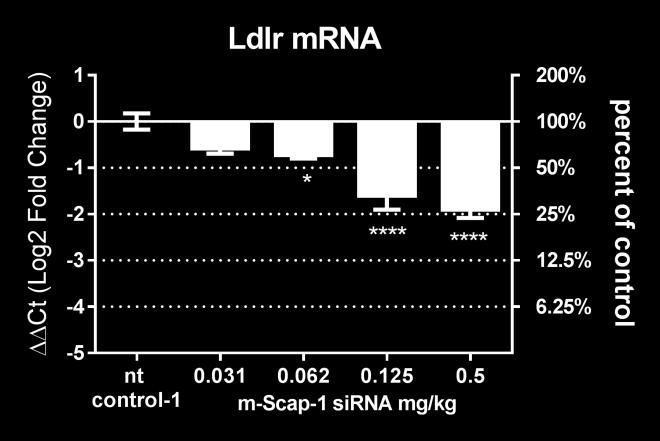
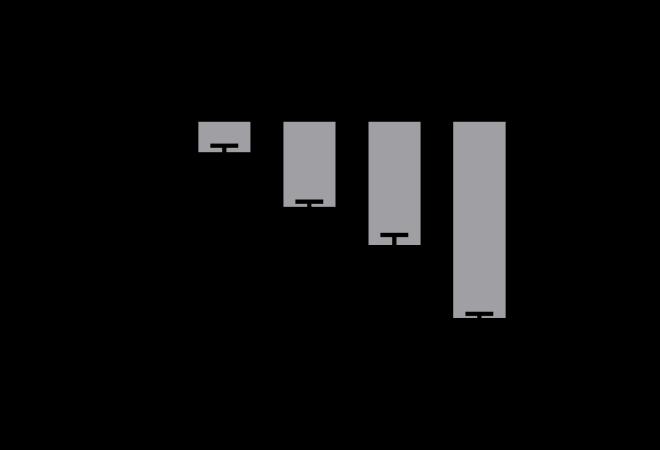
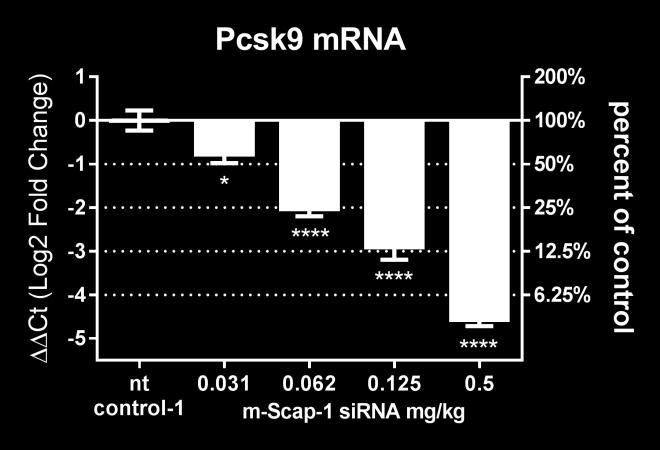
14 overall animal behavior and different Clinical Chemistry parameters including liver and kidney function indicators (data not shown). A sirna-lnp dose-titration study was performed in C57BL/6 mice (N=4 per group) to select doses covering a range of liver Scap mrna knockdown. As shown in supplemental Figure S1B, m-scap-1 sirna-lnp treatment with doses ranging from to 1 mg/kg caused a significant and dosedependent reduction in liver Scap mrna. The KD of liver Scap mrna also resulted in a dose-dependent reduction of the SREBP-2 target gene, Hmgcr, as well as SREBP-1c target gene Fasn, indicating SCAP loss of function (Supplemental Figure S1C, D). The effects on Scap, Hmgcr and Fasn mrna reached a maximum at the 0.5 mg/kg dose, and doses of , , and 0.5 mg/kg were selected for further studies. The dose-dependent effect of m-scap-1 sirna-lnp on Scap mrna and SREBP activity was further explored in a follow up study (N=8 per group). The sirna-lnp reagents did not cause any obvious toxic effects on liver as measured by AST/ALT levels at any of the doses tested and there was no effect on body weight in any of the treatment groups (data not shown). Scap mrna was reduced by a maximum of 95% for the 0.5 mg/kg dose on day 10 post dosing (Figure 1A). Pcsk9 and Ldlr mrna levels were both reduced by Scap mrna KD as shown in Figure 1B, C. Of note, there was a differential effect of Scap mrna KD on Pcsk9 and Ldlr levels with Pcsk9 mrna generally showing a more dramatic reduction relative to Ldlr mrna (Figure 1D). To further demonstrate that sirna-mediated KD of Scap resulted in loss of SREBP pathway activity, mice were dosed with D 2 O to measure palmitate and cholesterol synthesis. Consistent with the SCAP s role in modulating SREBP-1c and SREBP-2, Scap mrna KD caused a reduction in both palmitate and cholesterol synthesis. The effects were dose-dependent with a greater percent reduction of de novo fatty acid synthesis relative to cholesterol synthesis (Figure 1E, F). 14
15 Effects of Scap mrna knockdown on plasma lipids, Pcsk9 and liver LDLR protein in mice Liver Scap mrna KD caused a significant reduction in total plasma cholesterol at all sirna-lnp doses. Plasma TG was significantly reduced at the and 0.5 mg/kg sirna-lnp doses (Supplemental Figure S2). Dose dependent reductions were also observed for plasma total cholesterol, LDL-C, VLDL-C and HDL-C (Figure 2C, Supplemental Figure S2B, C, D and Supplemental Figure S5). To explore the mechanism of lipid lowering, we measured the levels of plasma PCSK9, liver LDLR protein level, and TG synthesis+secretion rate. As shown in Figure 2, plasma PCSK9 was dramatically and dosedependently reduced by sirna-mediated Scap KD. Plasma PCSK9 was reduced by a maximum of 94% at the 0.5 mg/kg sirna-lnp dose on day 10 after injection (Figure 2A). Interestingly, the liver LDLR protein Scap sirna dose-relation showed a bell-shaped curve with significant increase in LDLR protein levels at the and mg/kg doses, whereas the 0.5 mg/kg dose showed no significant change (Figure 2B, E). This bell-shaped dose response curve likely contributed to an observed U-shaped Scap sirna-lnp dose-response effect on LDL-C (Figure 2C). To determine if a reduction in VLDL secretion contributed to the reduced plasma lipid levels, the TG production rate following intravenous administration of [ 13 C 18 ] oleic acid was measured. We have previously demonstrated using this protocol in mice that the majority of newly made TG appearing in plasma is contained in VLDL and thus measurements made in total plasma should be a reasonable surrogate to determine VLDL-TG production (27). Treatment with m-scap-1 sirna resulted in a dose-responsive reduction in the appearance of newly made TG in plasma and was most dramatic at 0.5 mg /kg dose (Figure 2D; Supplemental Figure S3). SCAP inhibition and the statin treatment have additive effects on LDL-C reduction in NFR-CETP mice The statin class of drugs inhibits 3-hydroxy-3-methylglutaryl-CoA reductase (HMGCR), the rate limiting enzyme in cholesterol biosynthesis, thereby reducing cholesterol synthesis and free cholesterol in the cell. In the liver, the reduction in free cholesterol leads to a compensatory upregulation of SREBP activity 15
16 including upregulation of LDLR and PCSK9 expression levels. In humans, a net increase in LDLR activity and LDL-C lowering is the result of statin treatment (28). To test if Scap KD prevents the ability of a statin to increase SREBP activity, we pre-treated NFR-CETP mice with simvastatin followed by Scap KD using different doses of m-scap-1 sirna. NFR-CETP mice were selected for this study since this strain of mice has a higher level of LDL-C relative to wild type mice, allowing to test if statin treatment and Scap KD would have an added benefit on LDL-C levels. Scap KD was equally effective in simvastatin and vehicle treated mice (Figure 3A). As shown in Figure 3B, simvastatin treatment upregulated Hmgcr expression by approximately 2-fold relative to vehicle treatment in mice also dosed with control and Pcsk9 sirna, indicating SREBP transcriptional activation. As seen in C57BL/6 mice, Scap sirna dose-dependently reduced Hmgcr mrna levels in NFR-CETP mice. Simvastatin increased Hmgcr levels in mice treated with Scap sirna by at least 2-fold, although the levels were still lower relative to the control sirna treated mice (Figure 3B). Simvastatin also increased circulation Pcsk9 in all treatment groups (Figure 3C), demonstrating that sufficient SCAP activity remained to allow for SREBP activation. As shown in Figure 3D, sirna-mediated KD of Scap and Pcsk9 in NFR-CETP mice reduced LDL-C levels in the non-statin treated (vehicle) groups (gray boxes). Of interest, simvastatin treatment (hatched boxes) further reduced LDL-C levels in all sirna groups (except in the mg/kg Scap sirna group), suggesting that both Pcsk9 KD and Scap KD and the statin mechanism have additive effects on LDL-C reduction in this mouse model. sirna-mediated knockdown of SCAP in rhesus monkey reduces SREBP gene expression, de novo lipogenesis and circulating PCSK9 and lipid levels sirna lead qualification was done in lean rhesus monkeys with two independent SCAP sirna leads. Animals (N=4) were dosed with a single dose of SCAP, PCSK9, or non-targeting control (nt control-2) sirnas and mrna levels assessed from liver biopsies obtained 4 days prior to dosing and on days 7, 14, and 28 following sirna administration (Supplemental Figure S4). Both SCAP sirnas showed over 16
17 80% mrna KD in the liver at day 7. SCAP KD was associated with significant reduction in plasma PCSK9 levels (Figure 4B). Maximum plasma PCSK9 reduction was close to 75% for the first nine days following sirna dosing. Based on these results, NHP SCAP-1 sirna was selected as the lead for the follow up studies. To further characterize the effect of hepatic SCAP knockdown on SREBP activity, including on de novo lipogenesis, a follow up study was performed with larger group size and addition of the D 2 O tracer on day 16 post sirna-lnp dosing. Animals were dosed with a single dose of SCAP, PCSK9 and non-targeting control (nt control-2) sirna and the expression of SCAP, PCSK9 and LDLR mrna was measured in liver biopsies 7 days before and 7, 14, 28 and 35 days post sirna-lnp dosing. SCAP mrna was reduced by 94% on day 7 relative to a pre-dose liver biopsy. The expression of SCAP gradually increased over time as shown in Figure 4A. PCSK9 and the non-targeting control did not change the SCAP expression levels (Figure 4A). SCAP and PCSK9 sirna both reduced liver PCSK9 mrna levels (Figure 4B). The effect of SCAP knockdown on PCSK9 and LDLR mrna is shown in Figure 4D. The effect of SCAP sirna on PCSK9 mrna was more pronounced relative to the effect on LDLR mrna similar to what was observed in the mouse studies. Both cholesterol and palmitate de novo lipogenesis were significantly reduced by 67% and 81%, respectively, relative to control sirna (Figure 4C). Consistent with the reduced PCSK9 mrna levels, SCAP sirna treatment caused a significant and robust reduction in plasma PCSK9 levels (Figure 5A). The PCSK9 sirna treated groups also showed the expected reduction in plasma PCSK9 levels. Analysis of plasma lipid levels revealed a very significant reduction of LDL-C in the SCAP sirna treated group that was similar in magnitude to the reduction in the PCSK9 sirna group on day 21 of the study. HDL-C was also reduced in the SCAP sirna-lnp treatment group, whereas the non-targeting control and PCSK9 sirna did not affect HDL-C levels (Figure 5C). These data demonstrate that SCAP loss of function in a higher species leads to a dramatic suppression of SREBP pathway activity similar to what has been shown in rodent models. 17
18 Dose-dependent effects of SCAP sirna on SREBP pathway activity and plasma lipids in NHP. To determine the dose-dependent effects of SCAP mrna knockdown on SREBP pathway activity, rhesus monkeys were dosed with 6.68 mg/m 2, mg/m 2 and 26.7 mg/m 2 of the SCAP sirna-lnp reagent. Non-targeting sirna-lnp was dosed at 26.7 mg/m 2 as a control. Liver SCAP mrna was dosedependently reduced by the escalating doses of SCAP sirna at all time points measured (Figure 6A). Liver PCSK9 mrna and plasma PCSK9 levels were significantly reduced and showed a dose-dependent correlation with the SCAP sirna dose (Figure 6B, D). On day 3 after sirna dosing, the effect of SCAP mrna knockdown on PCSK9 mrna was more pronounced relative to LDLR mrna for all sirna doses tested and reached statistical significance for the low dose (Figure 6C). As shown in Figure 7, plasma LDL-C was significantly reduced for the mg/m 2 dose and plasma TG levels were significantly reduced at the and 26.7 mg/m 2 dose level. LDL-C showed a trend towards reduction at the 26.7 mg/m 2 level, but this did not meet statistical significance. There was a reduction in HDL-C levels, although less pronounced relative to what was observed in the single-dose sirna study. Effects of sirna-mediated knockdown of SCAP on liver gene expression in rhesus monkey The expression of a selection of genes involved in liver lipid and glucose metabolism pathways were measured in the liver samples collected from the rhesus monkeys on day 14 after a single dose of SCAP sirna. The gene expression in the samples from SCAP sirna treated animals was normalized to the non-targeting control treated animals at the same time point. A custom gene expression array was used in the analysis (24). Consistent with data from rodent studies, SREBP-regulated genes were down-regulated in response to SCAP sirna treatment in the liver of rhesus monkeys (Figure 8 and Supplemental Table S1). The most dramatic changes were found for SREBP-regulated genes encoding enzymes involved in fatty acid synthesis, consistent with the reduction of fatty acid synthesis (Figure 4). Genes encoding SREBP-2 and enzymes involved in cholesterol synthesis were also significantly down-regulated. In 18
19 addition, the gene expression analysis revealed the down regulation of several LXR and PPAR target genes (Figure 8 and Supplemental Table S1). 19
20 DISCUSSION SCAP is a key regulator of lipid metabolism and a potential therapeutic target for treatment of dyslipidemia and fatty liver disease (1, 2). Of particular interest for this study was to determine the effect of SCAP KD on LDL-C in circulation. Plasma LDL-C levels are regulated by a number of factors, including VLDL secretion rate, conversion of VLDL to LDL particles and the clearance of LDL particles by the LDL receptor (29). SCAP affects these factors by regulating de novo lipogenesis and thereby VLDL secretion and by regulating the expression of LDLR and PCSK9 at the mrna level. The effect of SCAP KD on VLDL secretion and PCSK9 should lead to a reduction in LDL-C, however these effects could potentially be counteracted by the direct effect of SCAP KD on LDLR expression. In mice, Scap KD resulted in dose-dependent reduction in the expression of SREBP-regulated genes, de novo lipogenesis, TG production rate, plasma PCSK9 and plasma lipids. PCSK9 expression was highly regulated by Scap via inhibition of SREBP-2, as Scap KD lead to a dramatic reduction in both the mrna and plasma protein levels. Ldlr mrna was less sensitive to Scap KD relative to Pcsk9 mrna at all Scap sirna doses tested (Figure 1). PCSK9 interacts with LDLR on the surface of cells to cause its internalization and degradation (30). The counter acting effects of Scap KD on Ldlr mrna reduction and the reduction in plasma PCSK9 led to non-linear dose effect of Scap KD on LDLR protein in the liver. Two doses of Scap sirna increased LDLR protein levels relative to the sirna control group whereas at the lowest and highest doses there was no significant change in LDLR. This was mirrored by the U- shaped dose-response effect on LDL-C, suggesting that the changes in LDLR protein levels reflected LDLR activity as measured by plasma LDL-C levels. Thus, in mice, Scap KD affected the major factors regulating LDL-C: VLDL secretion (measured by TG production rate), plasma PCSK9 protein levels and LDLR levels. All doses of Scap sirna reduced LDL-C, although the dose-response was non-linear and the maximum effect was achieved at a dose that did not maximize Scap KD and function. Plasma PCSK9, VLDL-C and TG all showed a more linear correlation with Scap mrna KD. Statins are an important class of cholesterol lowering drugs extensively used in the prevention of cardiovascular disease. Statins inhibit 3-hydroxy-3-methylglutaryl-CoA reductase (HMGCR), a rate 20
21 limiting enzyme in cholesterol synthesis, and reduce cellular cholesterol levels. In response, SREBP is released from the ER membrane, cleaved in the Golgi by proteases allowing translocation to the nucleus where SREBP responsive genes are induced, including the LDLR and HMGCR. LDL-C levels are reduced as a consequence of higher LDLR expression and hepatic cholesterol levels reestablished (28). To test how Scap KD would interact with the statin effect on SREBP activity in mice, we combined Scap sirna dosing and simvastatin treatment in NFR-CETP mice. We have previously identified the NFR- CETP model as a sensitive responder model to statin treatment relative to C57BL/6 and diet-induced obesity model based on SREBP pathways gene expression changes (data not shown). Simvastatin induced both Hmgcr mrna expression and circulating PCSK9 relative to the vehicle treated mice in all sirna treated mice (control, Scap and Pcsk9 sirna treatment groups). Although the levels of Hmgcr mrna and circulating PCSK9 were lower in the statin + Scap sirna treated groups relative to vehicle + control sirna treated mice, these data demonstrate that inhibition of the HMGCR enzyme and SREBP activation was achieve in the NFR-CETP mice even in the context of Scap mrna KD. Simvastatin and Pcsk9 sirna treatment individually reduced LDL-C in NFR-CETP mice (Figure 3D), and in combination, the effect on LDL-C was more pronounced. The additive effect was expected as Pcsk9 mrna KD amplifies the effect of statin on LDLR induction in mice (31). Scap KD and statin treatment also showed an additive effect on LDL-C lowering for 2 of the 3 doses tested. This additive effect could be due to the PCSK9 reduction observed in the Scap sirna treated mice or suppression of VLDL secretion. More detailed studies are needed to determine the exact mechanism. The effects of SCAP loss of function has been studied extensively in mouse and hamster. The lipid metabolism pathways of these models may not fully translate into human (14). Therefore, to examine the complex effects of SCAP KD on plasma lipids, we performed SCAP sirna KD studies in rhesus monkeys. PCSK9 sirna was used as a positive control. SCAP sirna reduced SCAP mrna in the liver by 94% on day 7 relative to a pre-dose followed by a gradual recovery towards baseline as the sirna is cleared from the liver. The KD of SCAP had a profound effect on SREBP activity: cholesterol and palmitate synthesis were significantly reduced, as was liver mrna and circulating PCSK9 levels. These 21
22 effects were SCAP sirna dose-dependent. Similar to the observation in mice, the degree of PCSK9 mrna suppression was larger than that of the LDLR mrna both in the single dose (Figure 4) and in the dose titration studies (Figure 6). In rhesus monkeys, SCAP KD led to a dramatic reduction in circulating PCSK9 levels that approached levels of reduction observed in the PCSK9 sirna treated group. Importantly, plasma LDL-C levels were robustly reduced by SCAP KD in both studies by more than 50%. The effect on LDL-C was slower to manifest in the SCAP sirna group compared to the PCSK9 sirna group. This difference could be partially due to a lag in SCAP protein turnover, delaying the effects on SREBP transcriptional activity or could reflect the potentially more complex mechanism of LDL-C reduction mediated by SCAP loss of function relative to PCSK9 KD. Plasma TG levels were significantly reduced suggesting that the reduced de novo synthesis of cholesterol and palmitate caused a reduction in lipoprotein particle secretion, although this was not measured directly in the current study. Liver gene expression analysis using a custom gene expression array, demonstrated several SREBPregulated genes to be down-regulated. Many of the genes on the array reported to be regulated predominantly by SREBP-2 in mice (including the SREBF2 gene) (2) were significantly down-regulated by SCAP KD on day 14 after sirna dosing in rhesus. Many of these genes encode enzymes involved in cholesterol synthesis and would explain the reduced cholesterol synthesis. Similarly, genes regulated predominantly by SREBP-1c in mice (including the SREBF1 gene) (2) and involved in de novo fatty acid synthesis were also down-regulated, including ACC1, FASN, FADS1 and SCD1. Over-all, the reduction in SREBP-1c regulated genes were more dramatic relative to SREBP-2 regulated genes. Interestingly, LXR regulated genes were significantly reduced as well. This could be explained by the reduced cholesterol synthesis in the liver, which in turn could reduce the levels of oxysterols, the endogenous LXR ligands. Since SREBP-1c, SCD and other fatty acid synthesis genes are direct targets of LXR, a reduced LXR transcriptional activity would also explain the more dramatic changes in SREBP-1c relative to SREBP-2 regulated genes. Among the down-regulated genes are ABCG1, a cholesterol efflux gene. Reduced expression of ABCG1 and potentially less free cholesterol available for efflux (due to reduced cholesterol synthesis) could have contributed to the lower plasma HDL-C levels observed in the SCAP 22
23 sirna treated group. The altered expression of the HDL modifying proteins PLTP and CETP could also have contributed to the effect. The reduction in HDL-C was most likely not caused by increased ApoEmediated clearance by the LDLR, which has been proposed to occur in mice as a result of PCSK9 inhibition, as there was no observed lowering of HDL-C in the PCSK9 sirna treated rhesus monkeys. Based on the dramatic suppression of de novo fatty acid synthesis, it is conceivable that PPAR regulated genes would be down-regulated. A number of genes on the array reported to be regulated by PPAR in human cells were indeed down regulated, including ACADVL, ACSL3, SLC27A2 and G6PC (32). Other well known PPAR regulated genes were not changed (e.g. ACSL1, CPT1A, FABP1), suggesting that the effect of PPAR transcriptional activity was relatively modest or counteracted by the change in the activity of other transcriptional regulators. The SCAP sirna studies reported herein were carried out in lean, normolipidemic mouse and rhesus monkey models that were fed standard, relatively low fat diets. Horton and colleagues (8) investigated the effects of liver SCAP loss of function in ob/ob mice, mice fed a high fat diet and hamsters fed a high sucrose diet and found effects on plasma lipids and lipid metabolism similar to what is reported here. Specifically, the differential effect of SCAP loss of function on Pcsk9 and Ldlr mrna expression were observed in these models as well. It would be of interest to study the effects of sirna-mediated SCAP KD on plasma lipids and lipid metabolism in dysmetabolic non-human primate models to further investigate the therapeutic potential of liver SCAP inhibition. The requirement of SCAP for the activation of lipid biosynthesis could be a potential driver of toxicity in conjunction with systemic SCAP inhibition, e.g. using a small molecule inhibitor approach. Indeed, conditional knockout of SCAP in Swann cells causes hypomyelination (33) and conditional knockout of SCAP in the intestinal mucosa causes severe enteropathy (34). Due the risk of adverse effects from systemic inhibition of SCAP, specific inhibition of SCAP in the liver is preferable for a therapeutic approach. We have previously shown that ionizable LNPs, similar to the one described here, primarily 23
24 target liver in the biodistribution studies (35) suggesting that his platform could be used as potentially a suitable approach for safe and efficacious inhibition of SCAP. In summary, we have demonstrated for the first time that SCAP sirna-mediated KD in a NHP model leads to a reduction in plasma PCSK9, TG and LDL-C suggesting a cardioprotective outcome of SCAP inhibition in human. This opens up potential targeting of SCAP in the liver for the treatment of dyslipidemia and potentially other metabolic diseases that are driven by increased SREBP activation such as fatty liver disease. 24
25 ACKNOWLEDGEMENTS The authors would like to thank Duncan Brown for sirna design, RNA Tx oligo synthesis team for generating sirnas, Ruhela Dipali, Marian Gindy and Sirna formulation team for generating LNP formulations. We are grateful to Jyoti Disa for assistance with in vivo study analysis. We would also like to thank Laura Sepp-Lorenzino, Thomas F. Vogt and Thomas P. Roddy for their support of this work. 25
26 REFERENCES: 1. Brown, M. S., and J. L. Goldstein Cholesterol feedback: from Schoenheimer's bottle to Scap's MELADL. J Lipid Res 50 Suppl: S Horton, J. D., J. L. Goldstein, and M. S. Brown SREBPs: activators of the complete program of cholesterol and fatty acid synthesis in the liver. J Clin Invest 109: Hua, X., A. Nohturfft, J. L. Goldstein, and M. S. Brown Sterol resistance in CHO cells traced to point mutation in SREBP cleavage-activating protein. Cell 87: Horton, J. D., N. A. Shah, J. A. Warrington, N. N. Anderson, S. W. Park, M. S. Brown, and J. L. Goldstein Combined analysis of oligonucleotide microarray data from transgenic and knockout mice identifies direct SREBP target genes. Proc Natl Acad Sci U S A 100: Li, S., M. S. Brown, and J. L. Goldstein Bifurcation of insulin signaling pathway in rat liver: mtorc1 required for stimulation of lipogenesis, but not inhibition of gluconeogenesis. Proc Natl Acad Sci U S A 107: Engelking, L. J., H. Kuriyama, R. E. Hammer, J. D. Horton, M. S. Brown, J. L. Goldstein, and G. Liang Overexpression of Insig-1 in the livers of transgenic mice inhibits SREBP processing and reduces insulin-stimulated lipogenesis. J Clin Invest 113: Matsuda, M., B. S. Korn, R. E. Hammer, Y. A. Moon, R. Komuro, J. D. Horton, J. L. Goldstein, M. S. Brown, and I. Shimomura SREBP cleavage-activating protein (SCAP) is required for increased lipid synthesis in liver induced by cholesterol deprivation and insulin elevation. Genes Dev 15: Moon, Y. A., G. Liang, X. Xie, M. Frank-Kamenetsky, K. Fitzgerald, V. Koteliansky, M. S. Brown, J. L. Goldstein, and J. D. Horton The Scap/SREBP pathway is essential for developing diabetic fatty liver and carbohydrate-induced hypertriglyceridemia in animals. Cell Metab 15:
27 9. Shimano, H., J. D. Horton, R. E. Hammer, I. Shimomura, M. S. Brown, and J. L. Goldstein Overproduction of cholesterol and fatty acids causes massive liver enlargement in transgenic mice expressing truncated SREBP-1a. J Clin Invest 98: Horton, J. D., I. Shimomura, M. S. Brown, R. E. Hammer, J. L. Goldstein, and H. Shimano Activation of cholesterol synthesis in preference to fatty acid synthesis in liver and adipose tissue of transgenic mice overproducing sterol regulatory element-binding protein-2. J Clin Invest 101: Shimomura, I., Y. Bashmakov, and J. D. Horton Increased levels of nuclear SREBP-1c associated with fatty livers in two mouse models of diabetes mellitus. J Biol Chem 274: Zhang, L., T. McCabe, J. H. Condra, Y. G. Ni, L. B. Peterson, W. Wang, A. M. Strack, F. Wang, S. Pandit, H. Hammond, D. Wood, D. Lewis, R. Rosa, V. Mendoza, A. M. Cumiskey, D. G. Johns, B. C. Hansen, X. Shen, N. Geoghagen, K. Jensen, L. Zhu, K. Wietecha, D. Wisniewski, L. Huang, J. Z. Zhao, R. Ernst, R. Hampton, P. Haytko, F. Ansbro, S. Chilewski, J. Chin, L. J. Mitnaul, A. Pellacani, C. P. Sparrow, Z. An, W. Strohl, B. Hubbard, A. S. Plump, D. Blom, and A. Sitlani An anti-pcsk9 antibody reduces LDL-cholesterol on top of a statin and suppresses hepatocyte SREBP-regulated genes. International Journal of Biological Sciences 8: Roddy, T. P., D. G. McLaren, Y. Chen, D. Xie, K. Dunn, A. Kulick, D. Szeto, G. Forrest, K. Albanese, M. Donnelly, C. Gai, A. Gewain, H. Lederman, K. K. Jensen, X. Ai, P. Vachal, K. O. Akinsanya, M. A. Cleary, S. F. Previs, H. M. Dansky, and D. G. Johns Effects of anacetrapib on plasma lipids, apolipoproteins and PCSK9 in healthy, lean rhesus macaques. Eur J Pharmacol 740: Yin, W., E. Carballo-Jane, D. G. McLaren, V. H. Mendoza, K. Gagen, N. S. Geoghagen, L. A. McNamara, J. N. Gorski, G. J. Eiermann, A. Petrov, M. Wolff, X. Tong, L. C. Wilsie, T. E. Akiyama, J. Chen, A. Thankappan, J. Xue, X. Ping, G. Andrews, L. A. Wickham, C. L. Gai, T. Trinh, A. A. Kulick, M. J. Donnelly, G. O. Voronin, R. Rosa, A. M. Cumiskey, K. Bekkari, L. J. Mitnaul, O. Puig, F. Chen, R. Raubertas, P. H. Wong, B. C. Hansen, K. S. Koblan, T. P. Roddy, B. K. Hubbard, and A. M. Strack. 27
28 2012. Plasma lipid profiling across species for the identification of optimal animal models of human dyslipidemia. J Lipid Res 53: Tadin-Strapps, M., L. B. Peterson, A. M. Cumiskey, R. L. Rosa, V. H. Mendoza, J. Castro-Perez, O. Puig, L. Zhang, W. R. Strapps, S. Yendluri, L. Andrews, V. Pickering, J. Rice, L. Luo, Z. Chen, S. Tep, B. Ason, E. P. Somers, A. B. Sachs, S. R. Bartz, J. Tian, J. Chin, B. K. Hubbard, K. K. Wong, and L. J. Mitnaul sirna-induced liver ApoB knockdown lowers serum LDL-cholesterol in a mouse model with human-like serum lipids. J Lipid Res 52: Frank-Kamenetsky, M., A. Grefhorst, N. N. Anderson, T. S. Racie, B. Bramlage, A. Akinc, D. Butler, K. Charisse, R. Dorkin, Y. Fan, C. Gamba-Vitalo, P. Hadwiger, M. Jayaraman, M. John, K. N. Jayaprakash, M. Maier, L. Nechev, K. G. Rajeev, T. Read, I. Rohl, J. Soutschek, P. Tan, J. Wong, G. Wang, T. Zimmermann, A. de Fougerolles, H. P. Vornlocher, R. Langer, D. G. Anderson, M. Manoharan, V. Koteliansky, J. D. Horton, and K. Fitzgerald Therapeutic RNAi targeting PCSK9 acutely lowers plasma cholesterol in rodents and LDL cholesterol in nonhuman primates. Proc Natl Acad Sci U S A 105: Tadin-Strapps, M., M. Robinson, L. Le Voci, L. Andrews, S. Yendluri, S. Williams, S. Bartz, and D. G. Johns Development of lipoprotein(a) sirnas for mechanism of action studies in non-human primate models of atherosclerosis. J Cardiovasc Transl Res 8: Chen, Z., B. Luo, T. Q. Cai, A. Thankappan, Y. Xu, W. Wu, J. DiMuzio, T. Lifsted, M. DiPietro, J. Disa, B. Ng, K. Leander, S. Clark, L. Hoos, Y. Zhou, N. Jochnowitz, C. Jachec, P. Szczerba, M. E. Gindy, W. Strapps, L. Sepp-Lorenzino, D. A. Seiffert, L. Lubbers, and M. Tadin-Strapps Proof-ofconcept Studies for sirna-mediated Gene Silencing for Coagulation Factors in Rat and Rabbit. Mol Ther Nucleic Acids 4: e McLaren, D. G., H. L. Cardasis, S. S. Stout, S.-P. Wang, V. Mendoza, J. M. Castro-Perez, P. L. Miller, B. A. Murphy, A. M. Cumiskey, M. A. Cleary, D. G. Johns, S. F. Previs, and T. P. Roddy The Use of [13C18] Oleic Acid and Mass Isotopomer Distribution Analysis to Study Synthesis of Plasma Triglycerides In Vivo: Analytical and Experimental Considerations. Analytical Chemistry 85:
29 20. Lemieux, S., B. W. Patterson, A. Carpentier, G. F. Lewis, and G. Steiner A stable isotope method using a [2H5] glycerol bolus to measure very low density lipoprotein triglyceride kinetics in humans. Journal of Lipid Research 40: Jiang, X. C., L. B. Agellon, A. Walsh, J. L. Breslow, and A. Tall Dietary cholesterol increases transcription of the human cholesteryl ester transfer protein gene in transgenic mice. Dependence on natural flanking sequences. J Clin Invest 90: Han, S., A. M. Flattery, D. McLaren, R. Raubertas, S. H. Lee, V. Mendoza, R. Rosa, N. Geoghagen, J. M. Castro-Perez, T. P. Roddy, G. Forrest, D. G. Johns, B. K. Hubbard, and J. Li Comparison of Lipoprotein Separation and Lipid Analysis Methodologies for Human and Cynomolgus Monkey Plasma Samples. Journal of Cardiovascular Translational Research 5: Shah, V., K. Herath, S. F. Previs, B. K. Hubbard, and T. P. Roddy Headspace analyses of acetone: A rapid method for measuring the 2 H-labeling of water. Analytical Biochemistry 404: Jensen, K. K., S. F. Previs, L. Zhu, K. Herath, S.-P. Wang, G. Bhat, G. Hu, P. L. Miller, D. G. McLaren, M. K. Shin, T. F. Vogt, L. Wang, K. K. Wong, T. P. Roddy, D. G. Johns, and B. K. Hubbard Demonstration of diet-induced decoupling of fatty acid and cholesterol synthesis by combining gene expression array and 2H2O quantification. American Journal of Physiology: Endocrinology and Metabolism 302: E209-E Previs, S. F., A. Mahsut, A. Kulick, K. Dunn, G. Andrews-Kelly, C. Johnson, G. Bhat, K. Herath, P. L. Miller, and S.-P. Wang Quantifying cholesterol synthesis in vivo using 2H2O: enabling backto-back studies in the same subject. Journal of Lipid Research 52: Pinheiro, J., and D. Bates Mixed-Effects Models in S and S-PLUS. In. Springer, New York McLaren, D. G., S.-P. Wang, S. J. Stout, D. Xie, P. L. Miller, V. Mendoza, R. Rosa, J. Castro- Perez, S. F. Previs, and D. G. Johns Tracking fatty acid kinetics in distinct lipoprotein fractions in vivo: a novel high-throughput approach for studying dyslipidemia in rodent models. Journal of Lipid Research 54:
30 28. Goldstein, J. L., and M. S. Brown The LDL receptor. Arterioscler Thromb Vasc Biol 29: Dietschy, J. M., S. D. Turley, and D. K. Spady Role of liver in the maintenance of cholesterol and low density lipoprotein homeostasis in different animal species, including humans. J Lipid Res 34: Zhang, D. W., T. A. Lagace, R. Garuti, Z. Zhao, M. McDonald, J. D. Horton, J. C. Cohen, and H. H. Hobbs Binding of proprotein convertase subtilisin/kexin type 9 to epidermal growth factor-like repeat A of low density lipoprotein receptor decreases receptor recycling and increases degradation. J Biol Chem 282: Ason, B., S. Tep, H. R. Davis, Jr., Y. Xu, G. Tetzloff, B. Galinski, F. Soriano, N. Dubinina, L. Zhu, A. Stefanni, K. K. Wong, M. Tadin-Strapps, S. R. Bartz, B. Hubbard, M. Ranalletta, A. B. Sachs, W. M. Flanagan, A. Strack, and N. A. Kuklin Improved efficacy for ezetimibe and rosuvastatin by attenuating the induction of PCSK9. J Lipid Res 52: Rakhshandehroo, M., B. Knoch, M. Muller, and S. Kersten Peroxisome proliferatoractivated receptor alpha target genes. PPAR Res Verheijen, M. H., N. Camargo, V. Verdier, K. Nadra, A. S. de Preux Charles, J. J. Medard, A. Luoma, M. Crowther, H. Inouye, H. Shimano, S. Chen, J. F. Brouwers, J. B. Helms, M. L. Feltri, L. Wrabetz, D. Kirschner, R. Chrast, and A. B. Smit SCAP is required for timely and proper myelin membrane synthesis. Proc Natl Acad Sci U S A 106: McFarlane, M. R., M. J. Cantoria, A. G. Linden, B. A. January, G. Liang, and L. J. Engelking Scap is required for sterol synthesis and crypt growth in intestinal mucosa. J Lipid Res 56: Shi, B., E. Keough, A. Matter, K. Leander, S. Young, E. Carlini, A. B. Sachs, W. Tao, M. Abrams, B. Howell, and L. Sepp-Lorenzino Biodistribution of small interfering RNA at the organ and cellular levels after lipid nanoparticle-mediated delivery. J Histochem Cytochem 59:
31 TABLES Table 1. List of lead SCAP sirna oligos used in mouse and NHP studies. sirna Guide Strand Passenger Strand Mouse Scap (m-scap-1) NHP SCAP-1 NHP SCAP-2 ru;rg;ru;fluc;omeg;omea;fluu;fluu;ome A;omeA;omeG;fluC;omeA;rG;omeG;fluU; omeg;omea;omeg;omeu;omeu rg;ru;ru;flug;flug;ru;flug;ru;rc;flua;flu A;rU;rU;fluA;fluA;fluG;rC;fluA;fluG;ome Us;omeU ru;ra;ru;flua;rc;rc;flua;flug;flug;flua;r U;fluG;rC;rC;fluA;fluA;rU;rC;rC;omeUs;o meu ib;fluc;fluu;fluc;da;fluc;fluc;fluu;dg; fluc;fluu;fluu;da;da;fluu;fluc;dg;da; fluc;da;dt;dt;ib ib;fluc;fluu;flug;omec;ru;ru;flua;flu A;omeU;rU;fluG;fluA;rC;fluA;omeC;om ec;flua;flua;fluc;omeus;omeu;ib ib;flug;flug;flua;fluu;ru;omeg;flug;o mec;flua;omeu;omec;omec;fluu;flug; omeg;ru;ra;fluu;flua;omeus;omeu;ib 31
32 Table 2. Non-targeting (nt) control sirnas used in mouse and NHP studies. sirna Guide Strand Passenger Strand Non-targeting nt control-1 ru;rc;rg;omea;fluc;fluc;omeg;omea;f luu;omea;fluu;omea;omea;omeg;ome G;fluC;omeG;omeA;fluC;omeU;omeU ib;dg;fluu;fluc;dg;fluc;fluc;fluu;fluu;d A;fluU;dA;fluU;fluC;dG;dG;fluU;fluC;dG; da;dt;dt;ib Non-targeting nt control-2 ru;ra;ru;fluc;omeg;omea;fluc;omeg;f luu;omeg;fluu;fluc;fluc;omea;omeg;f luc;fluu;omea;omeg;omeu;omeu ib;fluc;fluu;da;dg;fluc;fluu;dg;dg;da;fl uc;da;fluc;dg;fluu;fluc;dg;da;fluu;da;d T;dT;iB 32
33 Table 3. Summary of in vitro and in vivo activity of mouse Scap sirnas. sirna Activity in Activity in dose response Initial in vivo study Repeat in oligo primary screen experiment vivo study KD (ddct) KD (ddct) IC50 (nm) Day 1 KD (ddct) Day 3 KD (ddct) Day 1 KD (ddct) m-scap m-scap m-scap m-scap
34 Table 4. Summary of in vitro activity of NHP SCAP sirnas. sirna oligo Activity in primary screen Activity in dose response experiment 1 Activity in dose response experiment 2 Duration of silencing KD (ddct) KD (ddct) IC50 (pm) KD (ddct) IC50 (pm) Day 1 KD (ddct) Day 5 KD (ddct) NHP SCAP NHP SCAP

35 FIGURES A B C D E F 35
36 Figure 1: Knockdown of liver Scap mrna and reduced SREBP activity in mice following Scap sirna dosing. C57BL/6 mice were dosed with the indicated sirnas. On day 10 after sirna dosing, mice were injected with D2O and livers and plasma were collected after 4 hours. Scap mrna (A), Pcsk9 mrna (B) and Ldlr mrna (C) levels in liver. (D) direct comparison of Pcsk9 and Ldlr mrna levels as a function of SCAP sirna dose. De novo palmitate (E) and cholesterol synthesis (F) were measured as described in materials and methods. Each bar represents mean SEM, n=8 per group. *p< 0.05, **p< 0.01, ***p< ****p<


37 A B C D E m-scap-1 sirna mg/kg Figure 2: Effect of Scap sirna on plasma PCSK9, LDL-C, TG production and LDLR protein. C57BL/6 mice were dosed with the indicated sirnas and plasma and livers were collected 10 days after dosing. PCSK9 (A) and LDL-C (C) were measured in EDTA-plasma. (B) quantification of LDLR protein as measured by western blot. (D) TG production rate was measured in plasma by LC-MS/MS after an intravenous dose of 13 C 18 oleic acid as described in methods. (E) Representative western blot of liver LDLR protein. Each bar represents mean SEM, n=8 per group (except (B), n=6 per group). *p< 0.05, ***p<


38 A B C D Figure 3: Scap sirna knockdown adds to simvastatin LDL-C lowering in NFR-CETP mice. Mice were dose orally daily with 100 mg/kg simvastatin or vehicle starting on day 0. On day 4, mice were dosed with nt-contol-1 sirna and Pcsk9 sirna (0.5 mg/kg) and m-scap-1 sirna at the indicated doses (mg/kg). Plasma and livers were collected 10 days later. (A) liver Scap mrna, (B) liver Hmgcr mrna, (C) plasma PCSK9 and (D) plasma LDL-C. Each bar in A and B represents mean SEM. Box and whiskers in C and D represents, 25th percentile, the median, 75th percentile (boxes), and the minimum and maximum (whiskers). N=8 per group. *p< 0.05, **p< 0.01, ***p<

, liver PCSK9 mrna (B) and liver LDLR mrna. Figure 4C shows a direct comparison of liver PCSK9 and LDLR mrna.")


39 A B C D Figure 4: Effect of single dose SCAP sirna on SCAP mrna and SREBP activity in rhesus macaque monkeys. Lean rhesus monkeys were dosed i.v. with the indicated sirnas. Liver biopsies were collected on day -7, 7, 14, 28 and 35 after sirna dosing for measurement of liver SCAP mrna (A), liver PCSK9 mrna (B) and liver LDLR mrna. Figure 4C shows a direct comparison of liver PCSK9 and LDLR mrna. (D) On day 16, animals were administered D 2 O and blood samples were collected at -0.5hr, +4hr, +24hr, and +48hr for the determination of palmitate and cholesterol synthesis. Each symbol or bar represents mean SEM, n=4-10 per group. Liver SCAP mrna was significantly lower in the NHP SCAP-1 group relative to nt control-2 at all time points (p<0.05). Liver PCSK9 mrna was lower in the PCSK9 and NHP SCAP-1 groups relative to nt control-2 group at all time points (p<0.05). *p< 0.05, **p<


40 A B C Figure 5: Reduction in plasma PCSK9 and lipids in rhesus monkey after treatment with SCAP sirna. Lean rhesus macaque monkeys were dosed i.v. with the indicated sirnas on day 0 and blood was collected for EDTA plasma on several days for analysis as indicated in the graphs. (A) Plasma PCSK9, (B) plasma LDL-C and (C) plasma HDL-C. PCSK9 was significantly lower in the NHP SCAP-1 sirna group relative to nt control-2 on day 3-21 and significantly lower in the PCSK9 sirna group relative to nt control-2 on day 3-35 (p<0.05). LDL-C was significantly lower in the NHP SCAP-1 sirna group relative to nt control-2 on day 14 and day and significantly lower in the PCSK9 sirna group relative to nt control-2 on day 3-35 (p<0.05). HDL-C was significantly lower in the NHP SCAP-1 sirna group relative to nt control-2 on day (p<0.05). Each symbol represents mean SEM, n=4-10 per group. 40

 Comparison of liver PCSK9 and LDLR mrna on day 3 for the indicated NHP SCAP-1 sirna doses. (D) plasma PCSK9 levels. Each symbol represents mean SEM.")
 for all doses and time points relative to nt control-2.")
.")
41 A B C D Figure 6: Dose-dependent reduction in liver SCAP and PCSK9 mrna and plasma PCSK9 in rhesus following treatment with SCAP sirna. Lean rhesus macaque monkeys were dosed i.v. with the indicated sirnas on day 0 and blood was collected for analysis on days indicated in the graphs. Liver biopsies were collected on days -2, 3, 12 and 26 after sirna dosing for measurement of liver SCAP mrna (A), liver PCSK9 mrna (B). (C) Comparison of liver PCSK9 and LDLR mrna on day 3 for the indicated NHP SCAP-1 sirna doses. (D) plasma PCSK9 levels. Each symbol represents mean SEM. Box and whiskers in (C) represent, 25th percentile, the median, 75th percentile (boxes), and the minimum and maximum (whiskers). Liver SCAP mrna was significantly reduced (p<0.05) for all doses and time points relative to nt control-2. Liver PCSK9 mrna was significantly lower in the 26.7 mg/m 2 dose group relative to nt control-2 at all time points and significantly lower in the mg/m 2 dose group relative to nt control-2 on day 12 (p<0.05). Plasma PCSK9 was significantly reduced for all SCAP sirna doses relative to nt control-2 sirna on the day 3-28 time points (p<0.05). N=4 for the mg/m 2 dose group, n=8 for all other groups.

 plasma LDL-C, (B) plasma TG and (C) plasma HDL-C. Each symbol represents mean SEM, n=4-8 per group.")

42 A B C Figure 7: Dose-dependent reduction in plasma lipids in rhesus following treatment with SCAP sirna. Lean rhesus macaque monkeys were dosed i.v. with the indicated sirnas on day 0 and blood was collected for EDTA plasma on several days for analysis as indicated in the graphs. (A) plasma LDL-C, (B) plasma TG and (C) plasma HDL-C. Each symbol represents mean SEM, n=4-8 per group. Plasma LDL-C and TG levels were significantly lower in the 26.7 mg/m 2 dose group relative to nt control-2 on the day time points and significantly lower in the mg/m 2 dose group on the day time points (p<0.05). Plasma HDL-C was significantly lower in the mg/m 2 dose group relative to nt control-2 on the day 21 and 26 time points (p<0.05). 42

43 Figure 8: Fold changes in SREBP and LXR regulated gene expression after SCAP liver knockdown in rhesus monkey. A panel of 372 genes involved in lipid and glucose metabolism were assayed in livers of SCAP and control sirna treated rhesus monkeys using a custom gene expression array. Representative data is shown as fold change expression in SCAP sirna treatment group relative to control sirna treated group. All data p<0.05. Full data set shown in supplemental table 1. Each bar represents mean SEM, n=9-10 per group 43
PCSK9 RNAi Therapeutics. Kevin FitzGerald
 PCSK9 RNAi Therapeutics Kevin FitzGerald Presenter Disclosure Information PSCK9 RNAi Therapeutics The following relationships exist related to this presentation:» Kevin Fitzgerald and Alnylam team members:
SUPPLEMENTARY INFORMATION
 SUPPLEMENTARY INFORMATION FOR Liver X Receptor α mediates hepatic triglyceride accumulation through upregulation of G0/G1 Switch Gene 2 (G0S2) expression I: SUPPLEMENTARY METHODS II: SUPPLEMENTARY FIGURES
General Laboratory methods Plasma analysis: Gene Expression Analysis: Immunoblot analysis: Immunohistochemistry:
 General Laboratory methods Plasma analysis: Plasma insulin (Mercodia, Sweden), leptin (duoset, R&D Systems Europe, Abingdon, United Kingdom), IL-6, TNFα and adiponectin levels (Quantikine kits, R&D Systems
Supplemental Figure 1 ELISA scheme to measure plasma total, mature and furin-cleaved
 1 Supplemental Figure Legends Supplemental Figure 1 ELISA scheme to measure plasma total, mature and furin-cleaved PCSK9 concentrations. 4 Plasma mature and furin-cleaved PCSK9s were measured by a sandwich
The SCAP/SREBP Pathway: A Mediator of Hepatic Steatosis
 Review Article Endocrinol Metab 2017;32:6-10 https://doi.org/10.3803/enm.2017.32.1.6 pissn 2093-596X eissn 2093-5978 The SCAP/SREBP Pathway: A Mediator of Hepatic Steatosis Young-Ah Moon Department of
2.5. AMPK activity
 Supplement Fig. A 3 B phos-ampk 2.5 * Control AICAR AMPK AMPK activity (Absorbance at 45 nm) 2.5.5 Control AICAR Supplement Fig. Effects of AICAR on AMPK activation in macrophages. J774. macrophages were
Supplementary Information. MicroRNA-33b knock-in mice for an intron of sterol regulatory
 Supplementary Information MicroRNA-33b knock-in mice for an intron of sterol regulatory element-binding factor 1 (Srebf1) exhibit reduced HDL-C in vivo Takahiro Horie, Tomohiro Nishino, Osamu Baba, Yasuhide
Supplementary Figure 1. PAQR3 knockdown inhibits SREBP-2 processing in CHO-7 cells CHO-7 cells were transfected with control sirna or a sirna
 Supplementary Figure 1. PAQR3 knockdown inhibits SREBP-2 processing in CHO-7 cells CHO-7 cells were transfected with control sirna or a sirna targeted for hamster PAQR3. At 24 h after the transfection,
Requires Signaling though Akt2 Independent of the. Transcription Factors FoxA2, FoxO1, and SREBP1c
 Cell Metabolism, Volume 14 Supplemental Information Postprandial Hepatic Lipid Metabolism Requires Signaling though Akt2 Independent of the Transcription Factors FoxA2, FoxO1, and SREBP1c Min Wan, Karla
Supplementary Figure 1: Additional metabolic parameters of obesity mouse models and controls. (a) Body weight, (b) blood glucose and (c) insulin
 Body weight, (b) blood glucose and (c) insulin") Supplementary Figure 1: Additional metabolic parameters of obesity mouse models and controls. (a) Body weight, (b) blood glucose and (c) insulin resistance index of homeostatic model assessment (HOMA IR)
Supplementary Figure 1: Additional metabolic parameters of obesity mouse models and controls. (a) Body weight, (b) blood glucose and (c) insulin resistance index of homeostatic model assessment (HOMA IR)
Taylor Yohe. Project Advisor: Dr. Martha A. Belury. Department of Human Nutrition at the Ohio State University
 Atherosclerosis Development and the Inflammatory Response of Hepatocytes to Sesame Oil Supplementation Taylor Yohe Project Advisor: Dr. Martha A. Belury Department of Human Nutrition at the Ohio State
Fig. S1. Dose-response effects of acute administration of the β3 adrenoceptor agonists CL316243, BRL37344, ICI215,001, ZD7114, ZD2079 and CGP12177 at
 Fig. S1. Dose-response effects of acute administration of the β3 adrenoceptor agonists CL316243, BRL37344, ICI215,001, ZD7114, ZD2079 and CGP12177 at doses of 0.1, 0.5 and 1 mg/kg on cumulative food intake
Defective Hepatic Autophagy in Obesity Promotes ER Stress and Causes Insulin Resistance
 Cell Metabolism, Volume 11 Supplemental Information Defective Hepatic Autophagy in Obesity Promotes ER Stress and Causes Insulin Resistance Ling Yang, Ping Li, Suneng Fu, Ediz S. Calay, and Gökhan S. Hotamisligil
AAV-TBGp-Cre treatment resulted in hepatocyte-specific GH receptor gene recombination
 AAV-TBGp-Cre treatment resulted in hepatocyte-specific GH receptor gene recombination Supplementary Figure 1. Generation of the adult-onset, liver-specific GH receptor knock-down (alivghrkd, Kd) mouse
Development of an RNA Interference Therapeutic Targeting Angiopoietin-Like Protein 3 for Treatment of Hyperlipidemia
 Development of an RNA Interference Therapeutic Targeting Angiopoietin-Like Protein 3 for Treatment of Hyperlipidemia November 12 th, 2018 So C. Wong Arrowhead Pharmaceuticals Inc. Disclosures All authors
Plasma Lipid Profiling Across Species for the Identification of Optimal Animal Models of Human Dyslipidemia
 Plasma Lipid Profiling Across Species for the Identification of Optimal Animal Models of Human Dyslipidemia Wu Yin 1, Ester Carballo-Jane 3, David G. McLaren 3, Vivienne H Mendoza 1, Karen Gagen 1, Neil
Supplementary Materials for
 www.sciencesignaling.org/cgi/content/full/8/407/ra127/dc1 Supplementary Materials for Loss of FTO in adipose tissue decreases Angptl4 translation and alters triglyceride metabolism Chao-Yung Wang,* Shian-Sen
Supplementary Information: Figures 1-6 and Table 1 RNAi-Mediated Gene Silencing in Non-Human Primate Zimmermann, T.S. et al.
 Supplementary Information: Figures 1-6 and Table 1 RNAi-Mediated Gene Silencing in Non-Human Primate Zimmermann, T.S. et al. a. 12 14 Relative apob mrna (%) 8 6 4 2 Relative apob mrna (%) 12 8 6 4 2 5
Supplementary Information Titles Journal: Nature Medicine
 Supplementary Information Titles Journal: Nature Medicine Article Title: Corresponding Author: Supplementary Item & Number Supplementary Fig.1 Fig.2 Fig.3 Fig.4 Fig.5 Fig.6 Fig.7 Fig.8 Fig.9 Fig. Fig.11
A Hepatocyte Growth Factor Receptor (Met) Insulin Receptor hybrid governs hepatic glucose metabolism SUPPLEMENTARY FIGURES, LEGENDS AND METHODS
 Insulin Receptor hybrid governs hepatic glucose metabolism SUPPLEMENTARY FIGURES, LEGENDS AND METHODS") A Hepatocyte Growth Factor Receptor (Met) Insulin Receptor hybrid governs hepatic glucose metabolism Arlee Fafalios, Jihong Ma, Xinping Tan, John Stoops, Jianhua Luo, Marie C. DeFrances and Reza Zarnegar
A Hepatocyte Growth Factor Receptor (Met) Insulin Receptor hybrid governs hepatic glucose metabolism Arlee Fafalios, Jihong Ma, Xinping Tan, John Stoops, Jianhua Luo, Marie C. DeFrances and Reza Zarnegar
Hmgcoar AGCTTGCCCGAATTGTATGTG TCTGTTGTAACCATGTGACTTC. Cyp7α GGGATTGCTGTGGTAGTGAGC GGTATGGAATCAACCCGTTGTC
 Supplement Table I: primers for Real Time RT-PCR Gene Foward Reverse Hmgcoar AGCTTGCCCGAATTGTATGTG TCTGTTGTAACCATGTGACTTC Cyp7α GGGATTGCTGTGGTAGTGAGC GGTATGGAATCAACCCGTTGTC Cyp27a1 GTGGTCTTATTGGGTACTTGC
Human LDL Receptor / LDLR ELISA Pair Set
 Human LDL Receptor / LDLR ELISA Pair Set Catalog Number : SEK10231 To achieve the best assay results, this manual must be read carefully before using this product and the assay is run as summarized in
Supplemental Table 1. List of primers used for real time PCR.
 Supplemental Table 1. List of primers used for real time PCR. Primer Sequence Primer Sequence Mouse Pcsk9-F TTGCAGCAGCTGGGAACTT Mouse Scd1-F CATCATTCTCATGGTCCTGCT Mouse Pcsk9-R CCGACTGTGATGACCTCTGGA Mouse
BMP6 treatment compensates for the molecular defect and ameliorates hemochromatosis in Hfe knockout mice
 SUPPLEMENTARY MATERIALS BMP6 treatment compensates for the molecular defect and ameliorates hemochromatosis in Hfe knockout mice Elena Corradini, Paul J. Schmidt, Delphine Meynard, Cinzia Garuti, Giuliana
ab SREBP-2 Translocation Assay Kit (Cell-Based)
") ab133114 SREBP-2 Translocation Assay Kit (Cell-Based) Instructions for Use For analysis of translocation of SREBP-2 into nuclei. This product is for research use only and is not intended for diagnostic
ab133114 SREBP-2 Translocation Assay Kit (Cell-Based) Instructions for Use For analysis of translocation of SREBP-2 into nuclei. This product is for research use only and is not intended for diagnostic
Islet viability assay and Glucose Stimulated Insulin Secretion assay RT-PCR and Western Blot
 Islet viability assay and Glucose Stimulated Insulin Secretion assay Islet cell viability was determined by colorimetric (3-(4,5-dimethylthiazol-2-yl)-2,5- diphenyltetrazolium bromide assay using CellTiter
Lipoprotein Lipase Activity Assay Kit (Fluorometric)
") Lipoprotein Lipase Activity Assay Kit (Fluorometric) Catalog Number KA4538 100 assays Version: 02 Intended for research use only www.abnova.com Table of Contents Introduction... 3 Background... 3 General
Lipoprotein Lipase Activity Assay Kit (Fluorometric) Catalog Number KA4538 100 assays Version: 02 Intended for research use only www.abnova.com Table of Contents Introduction... 3 Background... 3 General
Reviewers' comments: Reviewer #1 (Remarks to the Author):
:") Reviewers' comments: Reviewer #1 (Remarks to the Author): Bempedoic acid (ETC-1002) is an ATP-citrate lyase (ACL) inhibitor that in clinical studies has been shown to decrease plasma LDL cholesterol apparently
Reviewers' comments: Reviewer #1 (Remarks to the Author): Bempedoic acid (ETC-1002) is an ATP-citrate lyase (ACL) inhibitor that in clinical studies has been shown to decrease plasma LDL cholesterol apparently
Commentary. New mechanisms by which statins lower plasma cholesterol. Henri Brunengraber
 Commentary New mechanisms by which statins lower plasma cholesterol Henri Brunengraber Department of Nutrition Case Western Reserve University Cleveland, OH 44109 Phone: 216 368 6429 Fax: 216 368 6560
Males- Western Diet WT KO Age (wks) Females- Western Diet WT KO Age (wks)
 Females- Western Diet WT KO Age (wks)") Relative Arv1 mrna Adrenal 33.48 +/- 6.2 Skeletal Muscle 22.4 +/- 4.93 Liver 6.41 +/- 1.48 Heart 5.1 +/- 2.3 Brain 4.98 +/- 2.11 Ovary 4.68 +/- 2.21 Kidney 3.98 +/-.39 Lung 2.15 +/-.6 Inguinal Subcutaneous
Relative Arv1 mrna Adrenal 33.48 +/- 6.2 Skeletal Muscle 22.4 +/- 4.93 Liver 6.41 +/- 1.48 Heart 5.1 +/- 2.3 Brain 4.98 +/- 2.11 Ovary 4.68 +/- 2.21 Kidney 3.98 +/-.39 Lung 2.15 +/-.6 Inguinal Subcutaneous
MCB130 Midterm. GSI s Name:
 1. Peroxisomes are small, membrane-enclosed organelles that function in the degradation of fatty acids and in the degradation of H 2 O 2. Peroxisomes are not part of the secretory pathway and peroxisomal
Free Fatty Acid Assay Kit (Fluorometric)
") Product Manual Free Fatty Acid Assay Kit (Fluorometric) Catalog Number STA-619 100 assays FOR RESEARCH USE ONLY Not for use in diagnostic procedures Introduction Triglycerides (TAG) are a type of lipid
Product Manual Free Fatty Acid Assay Kit (Fluorometric) Catalog Number STA-619 100 assays FOR RESEARCH USE ONLY Not for use in diagnostic procedures Introduction Triglycerides (TAG) are a type of lipid
Cholesterol metabolism. Function Biosynthesis Transport in the organism Hypercholesterolemia
 Cholesterol metabolism Function Biosynthesis Transport in the organism Hypercholesterolemia - component of all cell membranes - precursor of bile acids steroid hormones vitamin D Cholesterol Sources: dietary
ALN-PCSsc, an RNAi Investigational Agent That Inhibits PCSK9 Synthesis With the Potential for Effective Bi-Annual Dosing: Interim Results
 ALN-PCSsc, an RNAi Investigational Agent That Inhibits PCSK9 Synthesis With the Potential for Effective Bi-Annual Dosing: Interim Results Kevin Fitzgerald, PhD Co-authors: Amy Simon 1, Suellen White 1,
Free Glycerol Assay Kit (Colorimetric)
") Product Manual Free Glycerol Assay Kit (Colorimetric) Catalog Number STA-398 100 assays FOR RESEARCH USE ONLY Not for use in diagnostic procedures Introduction Glycerol is the backbone of Triglycerides
Product Manual Free Glycerol Assay Kit (Colorimetric) Catalog Number STA-398 100 assays FOR RESEARCH USE ONLY Not for use in diagnostic procedures Introduction Glycerol is the backbone of Triglycerides
Supplementary Figure 1. DNA methylation of the adiponectin promoter R1, Pparg2, and Tnfa promoter in adipocytes is not affected by obesity.
 Supplementary Figure 1. DNA methylation of the adiponectin promoter R1, Pparg2, and Tnfa promoter in adipocytes is not affected by obesity. (a) Relative amounts of adiponectin, Ppar 2, C/ebp, and Tnf mrna
Analysis of small RNAs from Drosophila Schneider cells using the Small RNA assay on the Agilent 2100 bioanalyzer. Application Note
 Analysis of small RNAs from Drosophila Schneider cells using the Small RNA assay on the Agilent 2100 bioanalyzer Application Note Odile Sismeiro, Jean-Yves Coppée, Christophe Antoniewski, and Hélène Thomassin
Human LDL ELISA Kit. Innovative Research, Inc.
 Human LDL ELISA Kit Catalog No: IRKTAH2582 Lot No: SAMPLE INTRODUCTION Human low-density lipoprotein (LDL) transports cholesterol from the liver to tissues where it is incorporated into cell membranes.
For pair feeding, mice were fed 2.7g of HFD containing tofogliflozin
 Materials and Methods Pair Feeding Experiment For pair feeding, mice were fed 2.7g of HFD containing tofogliflozin (0.005%), which is average daily food intake of mice fed control HFD ad libitum at week
Introduction. Results. Int. J. Biol. Sci. 2012, 8. PCSK9 affinity characterization
 310 Ivyspring International Publisher Research Paper International Journal of Biological Sciences 2012; 8(3):310-327. doi: 10.7150/ijbs.3524 An Anti-PCSK9 Antibody Reduces LDL-Cholesterol On Top Of A Statin
AsiaTIDES 2012: Formulation and Delivery of Peptides and Oligonucleotides Strategies for Delivery of RNAi Therapeutics. March 1, 2012 Akin Akinc, PhD
 AsiaTIDES 2012: Formulation and Delivery of Peptides and Oligonucleotides Strategies for Delivery of RNAi Therapeutics March 1, 2012 Akin Akinc, PhD Lead Selection Alnylam RNAi Product Platform Turning
Lecithin Cholesterol Acyltransferase (LCAT) ELISA Kit
 ELISA Kit") Product Manual Lecithin Cholesterol Acyltransferase (LCAT) ELISA Kit Catalog Number STA-616 96 assays FOR RESEARCH USE ONLY Not for use in diagnostic procedures Introduction Cholesterol is a lipid sterol
Product Manual Lecithin Cholesterol Acyltransferase (LCAT) ELISA Kit Catalog Number STA-616 96 assays FOR RESEARCH USE ONLY Not for use in diagnostic procedures Introduction Cholesterol is a lipid sterol
Phosphate buffered saline (PBS) for washing the cells TE buffer (nuclease-free) ph 7.5 for use with the PrimePCR Reverse Transcription Control Assay
 for washing the cells TE buffer (nuclease-free) ph 7.5 for use with the PrimePCR Reverse Transcription Control Assay") Catalog # Description 172-5080 SingleShot Cell Lysis Kit, 100 x 50 µl reactions 172-5081 SingleShot Cell Lysis Kit, 500 x 50 µl reactions For research purposes only. Introduction The SingleShot Cell Lysis
Catalog # Description 172-5080 SingleShot Cell Lysis Kit, 100 x 50 µl reactions 172-5081 SingleShot Cell Lysis Kit, 500 x 50 µl reactions For research purposes only. Introduction The SingleShot Cell Lysis
Supporting Information Table of content
 Supporting Information Table of content Supporting Information Fig. S1 Supporting Information Fig. S2 Supporting Information Fig. S3 Supporting Information Fig. S4 Supporting Information Fig. S5 Supporting
Fig. S1. REGN1500 reduces plasma levels of cholesterol, TG and NEFA in WT and Ldlr -/- mice. (A) WT
 WT") Figure Legends for Supplementary Figures. Fig. S1. REGN15 reduces plasma levels of cholesterol, TG and NEF in WT and Ldlr -/- mice. () WT and Ldlr -/- mice were injected with control IgG or REGN15 (1 mg/kg)
Figure Legends for Supplementary Figures. Fig. S1. REGN15 reduces plasma levels of cholesterol, TG and NEF in WT and Ldlr -/- mice. () WT and Ldlr -/- mice were injected with control IgG or REGN15 (1 mg/kg)
RayBio Human PPAR-alpha Transcription Factor Activity Assay Kit
 RayBio Human PPAR-alpha Transcription Factor Activity Assay Kit Catalog #: TFEH-PPARa User Manual Jan 5, 2018 3607 Parkway Lane, Suite 200 Norcross, GA 30092 Tel: 1-888-494-8555 (Toll Free) or 770-729-2992,
HEK293FT cells were transiently transfected with reporters, N3-ICD construct and
 Supplementary Information Luciferase reporter assay HEK293FT cells were transiently transfected with reporters, N3-ICD construct and increased amounts of wild type or kinase inactive EGFR. Transfections
Supplemental Material. Results
 Supplemental Material Results Fractionation of mouse plasma by high-resolution SEC. APOA1 eluted as a single major peak in fractions 16 of plasma (the apparent size of mature, lipidated HDL) when it was
Oncolytic Adenovirus Complexes Coated with Lipids and Calcium Phosphate for Cancer Gene Therapy
 Oncolytic Adenovirus Complexes Coated with Lipids and Calcium Phosphate for Cancer Gene Therapy Jianhua Chen, Pei Gao, Sujing Yuan, Rongxin Li, Aimin Ni, Liang Chu, Li Ding, Ying Sun, Xin-Yuan Liu, Yourong
Product Manual. Human LDLR ELISA Kit. Catalog Number. FOR RESEARCH USE ONLY Not for use in diagnostic procedures
 Product Manual Human LDLR ELISA Kit Catalog Number STA-386 96 assays FOR RESEARCH USE ONLY Not for use in diagnostic procedures Introduction Cholesterol is an essential component of cellular membranes,
SUPPLEMENTARY INFORMATION
 SUPPLEMENTARY INFORMATION doi:10.1038/nature11464 Supplemental Figure S1. The expression of Vegfb is increased in obese and diabetic mice as compared to lean mice. a-b, Body weight and postprandial blood
Supplementary Figure S1. Venn diagram analysis of mrna microarray data and mirna target analysis. (a) Western blot analysis of T lymphoblasts (CLS)
 Western blot analysis of T lymphoblasts (CLS)") Supplementary Figure S1. Venn diagram analysis of mrna microarray data and mirna target analysis. (a) Western blot analysis of T lymphoblasts (CLS) and their exosomes (EXO) in resting (REST) and activated
Supplementary Figure S1. Venn diagram analysis of mrna microarray data and mirna target analysis. (a) Western blot analysis of T lymphoblasts (CLS) and their exosomes (EXO) in resting (REST) and activated
Chapter (5) Etiology of Low HDL- Cholesterol
 Etiology of Low HDL- Cholesterol") Chapter (5) Etiology of Low HDL- Cholesterol The aim of this chapter is to summarize the different etiological factors mainly the role of life-style and different disease conditions contributing to the
Chapter (5) Etiology of Low HDL- Cholesterol The aim of this chapter is to summarize the different etiological factors mainly the role of life-style and different disease conditions contributing to the
DGAT2 Inhibition Alters Aspects of Triglyceride Metabolism in Rodents but Not in Non-human Primates
 Article DGAT2 Inhibition Alters Aspects of Triglyceride Metabolism in Rodents but Not in Non-human Primates Graphical Abstract Authors David G. McLaren, Seongah Han, Beth Ann Murphy,..., Stephen F. Previs,
Human Obestatin ELISA
 K-ASSAY Human Obestatin ELISA For the quantitative determination of obestatin in human serum and plasma Cat. No. KT-495 For Research Use Only. 1 Rev. 081309 K-ASSAY PRODUCT INFORMATION Human Obestatin
Supporting Information. Supporting Tables. S-Table 1 Primer pairs for RT-PCR. Product size. Gene Primer pairs
 Supporting Information Supporting Tables S-Table 1 Primer pairs for RT-PCR. Gene Primer pairs Product size (bp) FAS F: 5 TCTTGGAAGCGATGGGTA 3 429 R: 5 GGGATGTATCATTCTTGGAC 3 SREBP-1c F: 5 CGCTACCGTTCCTCTATCA
Supplementary webappendix
 Supplementary webappendix This webappendix formed part of the original submission and has been peer reviewed. We post it as supplied by the authors. Supplement to: Kratz JR, He J, Van Den Eeden SK, et
Mouse C-peptide EIA. Cat. No. YII-YK013-EX FOR LABORATORY USE ONLY
 Mouse C-peptide EIA Cat. No. YII-YK013-EX FOR LABORATORY USE ONLY TOYO 2CHOME, KOTO-KU, TOKYO, 135-0016, JAPAN http://www.cosmobio.co.jp e-mail : export@cosmobio.co.jp Phone : +81-3-5632-9617 FAX : +81-3-5632-9618
1Why lipids cannot be transported in blood alone? 2How we transport Fatty acids and steroid hormones?
 1Why lipids cannot be transported in blood alone? 2How we transport Fatty acids and steroid hormones? 3How are dietary lipids transported? 4How lipids synthesized in the liver are transported? 5 Lipoprotien
Critical review. SREBPs: activators of the complete program of cholesterol and fatty acid synthesis in the liver
 SPOTLIGHT Critical review SREBPs: activators of the complete program of cholesterol and fatty acid synthesis in the liver Jay D. Horton, 1,2 Joseph L. Goldstein, 1 and Michael S. Brown 1 1 Department of
Is it really that simple? Alyssa Hasty, PhD Associate Professor Molecular Physiology and Biophysics
 Alyssa Hasty, PhD Associate Professor Molecular Physiology and Biophysics Why we care about hepatic lipogenesis Control of lipid synthesis What can go wrong in humans Animal models dlto study lipoprotein
 DOI: 10.1038/ncb2210 b. ICAM1 ng ml -1 P = 0.0001 Small RNA (15-30nts) ng ml -1 Cell Lysate Exosome HDL Plasma HDL Normal Human HDL mirnas R = 0.45 P < 0.0001 Normal Human Exosome mirnas Figure S1. Characterization
Summary and concluding remarks
 Summary and concluding remarks This thesis is focused on the role and interaction of different cholesterol and phospholipid transporters. Cholesterol homeostasis is accomplished via a tightly regulated
Rat Leptin ELISA FOR LABORATORY USE ONLY YANAIHARA INSTITUTE INC AWAKURA, FUJINOMIYA - SHI SHIZUOKA, JAPAN
 YK050 Rat Leptin ELISA FOR LABORATORY USE ONLY YANAIHARA INSTITUTE INC. 2480-1 AWAKURA, FUJINOMIYA - SHI SHIZUOKA, JAPAN 418-0011 Contents Introduction 2 Characteristics 3 Composition 4 Method 5-6 Notes
Gene Polymorphisms and Carbohydrate Diets. James M. Ntambi Ph.D
 Gene Polymorphisms and Carbohydrate Diets James M. Ntambi Ph.D Fatty Acids that Flux into Tissue Lipids are from Dietary Sources or are Made De novo from Glucose or Fructose Glucose Fructose Acetyl-CoA
SUPPLEMENTAL INFORMATION
 SUPPLEMENTAL INFORMATION EXPERIMENTAL PROCEDURES Tryptic digestion protection experiments - PCSK9 with Ab-3D5 (1:1 molar ratio) in 50 mm Tris, ph 8.0, 150 mm NaCl was incubated overnight at 4 o C. The
Unit IV Problem 3 Biochemistry: Cholesterol Metabolism and Lipoproteins
 Unit IV Problem 3 Biochemistry: Cholesterol Metabolism and Lipoproteins - Cholesterol: It is a sterol which is found in all eukaryotic cells and contains an oxygen (as a hydroxyl group OH) on Carbon number
INTERNAL MEDICINE - PEDIATRICS
 Rev. Med. Chir. Soc. Med. Nat., Iaşi 2016 vol. 120, no. 2 INTERNAL MEDICINE - PEDIATRICS UPDATES NEW CLASS OF DRUGS: THERAPEUTIC RNAi INHIBITION OF PCSK9 AS A SPECIFIC LDL-C LOWERING THERAPY A.L. Strat
YK052 Mouse Leptin ELISA
 YK052 Mouse Leptin ELISA FOR LABORATORY USE ONLY YANAIHARA INSTITUTE INC. 2480-1 AWAKURA, FUJINOMIYA-SHI SHIZUOKA, JAPAN 418-0011 Contents Ⅰ. Introduction 2 Ⅱ. Characteristics 3 Ⅲ. Composition 4 Ⅳ. Method
SUPPLEMENTARY INFORMATION
 Glucose is a ligand for the oxysterol receptor LXR Supplementary Figure 1 Schematic representation of pathways influencing glucose fate in the liver. Glucose induces insulin secretion, suppressing hepatic
Stacey Melquist #AHA16
 Targeting apolipoprotein(a) with a novel RNAi delivery platform as a prophylactic treatment to reduce risk of cardiovascular events in individuals with elevated lipoprotein(a) Monday, November 14, 2016
Supplementary Figure 1. DJ-1 modulates ROS concentration in mouse skeletal muscle.
 Supplementary Figure 1. DJ-1 modulates ROS concentration in mouse skeletal muscle. (a) mrna levels of Dj1 measured by quantitative RT-PCR in soleus, gastrocnemius (Gastroc.) and extensor digitorum longus
Metabolism and Atherogenic Properties of LDL
 Metabolism and Atherogenic Properties of LDL Manfredi Rizzo, MD, PhD Associate Professor of Internal Medicine Faculty of Medicine, University of Palermo, Italy & Affiliate Associate Professor of Internal
Cellular control of cholesterol. Peter Takizawa Department of Cell Biology
 Cellular control of cholesterol Peter Takizawa Department of Cell Biology Brief overview of cholesterol s biological role Regulation of cholesterol synthesis Dietary and cellular uptake of cholesterol
Investigations on the mechanism of hypercholesterolemia observed in copper deficiency in rats
 J. Biosci., Vol. 12, Number 2, June 1987, pp. 137 142. Printed in India. Investigations on the mechanism of hypercholesterolemia observed in copper deficiency in rats P. VALSALA and P. A. KURUP Department
Cholesterol and its transport. Alice Skoumalová
 Cholesterol and its transport Alice Skoumalová 27 carbons Cholesterol - structure Cholesterol importance A stabilizing component of cell membranes A precursor of bile salts A precursor of steroid hormones
Rat Leptin-HS ELISA FOR LABORATORY USE ONLY YANAIHARA INSTITUTE INC AWAKURA, FUJINOMIYA - SHI SHIZUOKA, JAPAN
 YK051 Rat Leptin-HS ELISA FOR LABORATORY USE ONLY YANAIHARA INSTITUTE INC. 2480-1 AWAKURA, FUJINOMIYA - SHI SHIZUOKA, JAPAN 418 0011 Contents Introduction 2 Characteristics 3 Composition 4 Method 5-6 Notes
Serum Triglyceride Quantification Kit (Colorimetric)
") Product Manual Serum Triglyceride Quantification Kit (Colorimetric) Catalog Number STA-396 100 assays FOR RESEARCH USE ONLY Not for use in diagnostic procedures Introduction Triglycerides (TAG) are a type
Product Manual Serum Triglyceride Quantification Kit (Colorimetric) Catalog Number STA-396 100 assays FOR RESEARCH USE ONLY Not for use in diagnostic procedures Introduction Triglycerides (TAG) are a type
Mouse Adiponectin Immunoassay Kit
 Antibody and Immunoassay Services Li Ka Shing Faculty of Medicine, The University of Hong Kong Mouse Adiponectin Immunoassay Kit Catalogue Number: 32010 For the quantitative determination of mouse adiponectin
Supplemental Information. Increased 4E-BP1 Expression Protects. against Diet-Induced Obesity and Insulin. Resistance in Male Mice
 Cell Reports, Volume 16 Supplemental Information Increased 4E-BP1 Expression Protects against Diet-Induced Obesity and Insulin Resistance in Male Mice Shih-Yin Tsai, Ariana A. Rodriguez, Somasish G. Dastidar,
APOB (Human) ELISA Kit
 ELISA Kit") APOB (Human) ELISA Kit Catalog Number KA4330 96 assays Version: 01 Intended for research use only www.abnova.com Table of Contents Introduction... 3 Intended Use... 3 Background... 3 Principle of the Assay...
APOB (Human) ELISA Kit Catalog Number KA4330 96 assays Version: 01 Intended for research use only www.abnova.com Table of Contents Introduction... 3 Intended Use... 3 Background... 3 Principle of the Assay...
Supplementary Information
 Supplementary Information Akt regulates hepatic metabolism by suppressing a Foxo1 dependent global inhibition of adaptation to nutrient intake Mingjian Lu 1, Min Wan 1, Karla F. Leavens 1, Qingwei Chu
m 6 A mrna methylation regulates AKT activity to promote the proliferation and tumorigenicity of endometrial cancer
 SUPPLEMENTARY INFORMATION Articles https://doi.org/10.1038/s41556-018-0174-4 In the format provided by the authors and unedited. m 6 A mrna methylation regulates AKT activity to promote the proliferation
human Total Cathepsin B Catalog Number: DY2176
 human Total Cathepsin B Catalog Number: DY2176 This DuoSet ELISA Development kit contains the basic components required for the development of sandwich ELISAs to measure natural and recombinant human Total
Supplementary Figure 1. mrna targets were found in exosomes and absent in free-floating supernatant. Serum exosomes and exosome-free supernatant were
 Supplementary Figure 1. mrna targets were found in exosomes and absent in free-floating supernatant. Serum exosomes and exosome-free supernatant were separated via ultracentrifugation and lysed to analyze
Skeletal muscle metabolism was studied by measuring arterio-venous concentration differences
 Supplemental Data Dual stable-isotope experiment Skeletal muscle metabolism was studied by measuring arterio-venous concentration differences across the forearm, adjusted for forearm blood flow (FBF) (1).
Regulation of the IGF axis by TGF-b during periosteal chondrogenesis: implications for articular cartilage repair
 Regulation of the IGF axis by TGF-b during periosteal chondrogenesis: implications for articular cartilage repair Chapter 04 Boek 1_Gie.indb 55 21-05-2007 12:27:33 Chapter 04 Abstract Goal: TGF-b and IGF-I
Assaying micrornas in biofluids for detection of drug induced cardiac injury. HESI Annual Meeting State of the Science Session June 8, 2011
 Assaying micrornas in biofluids for detection of drug induced cardiac injury HESI Annual Meeting State of the Science Session June 8, 2011 Karol Thompson, PhD Center for Drug Evaluation & Research US Food
Protection against doxorubicin-induced myocardial dysfunction in mice by cardiac-specific expression of carboxyl terminus of hsp70-interacting protein
 Protection against doxorubicin-induced myocardial dysfunction in mice by cardiac-specific expression of carboxyl terminus of hsp70-interacting protein Lei Wang 1, Tian-Peng Zhang 1, Yuan Zhang 2, Hai-Lian
ncounter TM Analysis System
 ncounter TM Analysis System Molecules That Count TM www.nanostring.com Agenda NanoString Technologies History Introduction to the ncounter Analysis System CodeSet Design and Assay Principals System Performance
(a) Significant biological processes (upper panel) and disease biomarkers (lower panel)
 Significant biological processes (upper panel) and disease biomarkers (lower panel)") Supplementary Figure 1. Functional enrichment analyses of secretomic proteins. (a) Significant biological processes (upper panel) and disease biomarkers (lower panel) 2 involved by hrab37-mediated secretory
Supplementary Figure 1. Functional enrichment analyses of secretomic proteins. (a) Significant biological processes (upper panel) and disease biomarkers (lower panel) 2 involved by hrab37-mediated secretory
Niacin Metabolism: Effects on Cholesterol
 Niacin Metabolism: Effects on Cholesterol By Julianne R. Edwards For Dr. William R. Proulx, PhD, RD Associate Professor of Nutrition and Dietetics In partial fulfillments for the requirements of NUTR342
Cells and reagents. Synaptopodin knockdown (1) and dynamin knockdown (2)
 and dynamin knockdown (2)") Supplemental Methods Cells and reagents. Synaptopodin knockdown (1) and dynamin knockdown (2) podocytes were cultured as described previously. Staurosporine, angiotensin II and actinomycin D were all obtained
Supplemental Methods Cells and reagents. Synaptopodin knockdown (1) and dynamin knockdown (2) podocytes were cultured as described previously. Staurosporine, angiotensin II and actinomycin D were all obtained
Human Leptin ELISA Kit
 Product Manual Human Leptin ELISA Kit Catalog Numbers MET-5057 MET-5057-5 96 assays 5 x 96 assays FOR RESEARCH USE ONLY Not for use in diagnostic procedures Introduction Leptin is a polypeptide hormone
EXO-DNAc Circulating and EV-associated DNA extraction kit
 Datasheet EXO-DNAc Circulating and EV-associated DNA extraction kit This product is for research use only. It is highly recommended to read this users guide in its entirety prior to using this product.
Metabolic defects underlying dyslipidemia in abdominal obesity
 Metabolic defects underlying dyslipidemia in abdominal obesity Professor Marja-Riitta Taskinen Department of Medicine, Division of Cardiology Helsinki University Hospital, Finland Disclosures: Honorariums/
Human Apolipoprotein A1 EIA Kit
 A helping hand for your research Product Manual Human Apolipoprotein A1 EIA Kit Catalog Number: 83901 96 assays 1 Table of Content Product Description 3 Assay Principle 3 Kit Components 3 Storage 4 Reagent
GPR120 *** * * Liver BAT iwat ewat mwat Ileum Colon. UCP1 mrna ***
 a GPR120 GPR120 mrna/ppia mrna Arbitrary Units 150 100 50 Liver BAT iwat ewat mwat Ileum Colon b UCP1 mrna Fold induction 20 15 10 5 - camp camp SB202190 - - - H89 - - - - - GW7647 Supplementary Figure
Roux-en-Y gastric bypass surgery but not vertical sleeve gastrectomy decreases bone mass in male rats
 SUPPLEMENTAL DATA Roux-en-Y gastric bypass surgery but not vertical sleeve gastrectomy decreases bone mass in male rats 1 Kerstin Stemmer, 2 Maximilian Bielohuby, 3 Bernadette E. Grayson, 3 Denovan P.
N-3 Fatty Acids Non-HDL-Cand LDL-C Thomas Dayspring MD, FACP
 Omega or N-3 Fatty Acids (FA) significantly reduce TG synthesis and significantly deplete the TG content of VLDL particles indicated by significantly reduced V. FA are the substrate for TG synthesis. N3-FA