Quantitative Phosphoproteomics through β- Elimination and Michael Addition with Natural Abundance and Stable Isotope Labeled Thiocholine
|
|
|
- Bernice Pope
- 6 years ago
- Views:
Transcription
1 Washington University in St. Louis Washington University Open Scholarship All Theses and Dissertations (ETDs) January 2010 Quantitative Phosphoproteomics through β- Elimination and Michael Addition with Natural Abundance and Stable Isotope Labeled Thiocholine Meng Chen Washington University in St. Louis Follow this and additional works at: Recommended Citation Chen, Meng, "Quantitative Phosphoproteomics through β-elimination and Michael Addition with Natural Abundance and Stable Isotope Labeled Thiocholine" (2010). All Theses and Dissertations (ETDs) This Dissertation is brought to you for free and open access by Washington University Open Scholarship. It has been accepted for inclusion in All Theses and Dissertations (ETDs) by an authorized administrator of Washington University Open Scholarship. For more information, please contact
2 WASHINGTON UNVERSITY IN ST. LOUIS Department of Chemistry Dissertation Examination Committee Richard W. Gross, Chair Michael L. Gross Christopher M. Jenkins Sandor J. Kovacs Kevin D. Moeller Jacob Schaefer Quantitative Phosphoproteomics through β-elimination and Michael Addition with Natural Abundance and Stable Isotope Labeled Thiocholine By Meng Chen A dissertation presented to the Graduate School of Arts and Sciences of Washington University in partial fulfillment of the requirements for the degree of Doctor of Philosophy December 2010 Saint Louis, Missouri
3 Reproduced in part with permission from Facile Identification and Quantitation of Protein Phosphorylation via β- Elimination and Michael Addition with Natural Abundance and Stable Isotope Labeled Thiocholine, Anal. Chem., 2010, 82 (1), pp Copyright 2010 American Chemical Society
4 ABSTRACT OF THE DISSERTATION Quantitative Phosphoproteomics through β-elimination and Michael Addition with Natural Abundance and Stable Isotope Labeled Thiocholine by Meng Chen Doctor of Philosophy in Chemistry Washington University in St. Louis, 2010 Professor Richard W. Gross, Chairperson The reversible covalent phosphorylation of cellular proteins is widely believed to be the most important mechanism for the regulation of multiple signal transduction pathways in cell growth, division, and death by acting as a molecular switch at multiple nodes in metabolic networks. In this dissertation, first, a novel mass spectrometric strategy is reported that exploited the unique chemical properties of thiocholine that was introduced into protein phosphosites through alkaline β-elimination and Michael addition (BEMA), allowing the specific detection, identification and quantitation of phosphorylated serine/threonine containing peptides. Through replacement of the phosphate with thiocholine as the Michael donor, this strategy resulted in a marked increase in ionization sensitivity during ESI accompanied by enhanced peptide sequence coverage during CID. Moreover, the definitive localization of phosphorylated residues is greatly facilitated through the generation of diagnostic triads of fragment ions resulting from peptide bond cleavage and further neutral loss of either trimethylamine (-59 Da) or thiocholine thiolate (-119 Da) during CID in tandem mass spectrometric analyses such as MS 2 and MS 3. Synthesis of stable isotope labeled thiocholine enabled the quantitation of ii
5 protein phosphorylation with high precision by ratiometric comparisons. The utility of this approach was demonstrated in an intact cell system through identification of the endogenous phosphorylation sites in ipla 2 β during heterologous expression in Sf-9 cells. A total of 12 unique phosphopeptides and 19 phosphorylation sites were identified with the developed strategy whereas the conventional approach identified only five peptides and six phosphorylation sites. Lastly, the BEMA strategy was applied to in vivo tissue system for the quantitative analysis of the murine myocardial mitochondrial phosphoproteome following cardiac ischemia. A total of 36 phosphopeptides from 35 mitochondrial proteins with 50 phosphosites (37 of which were previously unknown), were identified. Collectively, we have demonstrated β-elimination of phosphate and subsequent Michael addition (BEMA) with natural abundance and stable isotope labeled thiocholine is an effective strategy for in vivo quantitative phosphoproteomics of both cell-based and tissue-based systems. iii
6 ACKNOWLEDGEMENTS First, I would like to express my sincere gratefulness to my advisor, Dr. Richard W. Gross for his support, guidance and encouragement throughout the course of my Ph.D. research. Without his inspiring wisdom and endless enthusiasm the completion of this dissertation wouldn t have been possible. It has been such a unique experience which I will cherish for the rest of my life. I would like to convey my special thanks to Dr. Michael L. Gross and Dr. Kevin D. Moeller for providing invaluable help and advices for this work. I also want to thank other members of my dissertation committee: Dr. Jacob Schaefer, Dr. Sandor J. Kovacs and Dr. Christopher M. Jenkins for their comments and suggestions. I would like to thank the following individuals either current or part members of the Gross lab for their tremendous help and friendship which gave this lab a feeling of warmth like family: Xiong Su, Jingyue Yang, Jackie Snider, Christopher Jenkins, Sung Ho Moon, Ari Cedars, Omar El Ghazzawy, Harold Sims, Kui Yang, David Mancuso, Shaoping Guan, Wei Yan, Wei Shen, Michael Kiebish, Hui Jiang, Andee Pacheco, Debbie Warsmer, John Kelly, Beverly Gibson, Xianlin Han, Hua Cheng, Zhongdan Zhao, Youchun Zeng, Gang Sun. I would like to thank the Department of Chemistry for providing the opportunity and financial support for me to pursue my Ph.D. here in St. Louis. I want to thank all the staff members, especially Dr. Edwin Hiss for his help through the years. And I would like to take this opportunity to thank my parents, Chufan Chen and Guiling Qin, my sister, Qi Chen, and my brother, Lei Chen for their love, support and the iv
7 faith they always have in me, especially when I was going through some of the toughest times in my life. I also want to thank my parents-in-law, Siguang Yu and Yanhong Wu for their care and support. Last but certainly not least, I would like to dedicate my thesis to my best friend, love, soul mate, beautiful wife, Han Yu who is always there for me, believing in me wholeheartedly and gives me love, hope, courage and strength. Without her, I simply couldn t have accomplished this thesis. v
8 TABLE OF CONTENTS Page ABSTRACT OF THE DISSERTATION... ii ACKNOWLEDGEMENTS...iv LIST OF SCHEMES...ix LIST OF TABLES...x LIST OF FIGURES...xi ABBREVIATIONS...xiv CHAPTER 1 Introduction...1 Reference Schemes...30 CHAPTER 2 Facile Identification and Quantitation of Protein Phosphorylation via β- Elimination and Michael Addition with Natural Abundance and Stable Isotope Labeled Thiocholine 2.1 Abstract Introduction Materials and Methods...39 vi
9 2.4 Results and Discussion Conclusion and Perspective References Tables Legends Figure Legends...66 CHAPTER 3 Identification of Endogenous Phosphorylation Sites of ipla 2 β from Sf-9 Cells with and Without Thiocholine Modification 3.1 Abstract Introduction Materials and Methods Results and Discussion Conclusion and Perspective References Tables Legends Figure Legends CHAPTER 4 Quantitative Analysis of Alterations in the Myocardial Mitochondrial Phosphoproteome Induced by Cardiac Ischemia Assessed Using β-elimination and Michael Addition with Light and Heavy Thiocholine vii
10 4.1 Abstract Introduction Materials and Methods Results and Discussion Conclusion References Tables Legends Figure Legends CHAPTER 5 Conclusions and Future Directions References Appendix A. 1 H NMR (D 2 O) spectrum of natural abundance thiocholine B. 1 H NMR (D 2 O) spectrum of thiocholine- 13 C,d C. The scheme of the electron-donating effect of the β-methyl group of threonine affecting the reaction rates of β-elimination and Michael addition D. Nomenclature of peptide fragment ions viii
11 LIST OF SCHEMES Scheme 1.1 Chemical modification of phosphoserine and phosphothreonine containing peptides via β-elimination in the presence of Ba(OH) 2 and Michael Addition with thiocholine as the Michael donor...30 Scheme 1.2 Collision induced dissociation resulting in the neutral loss of either (A) trimethylamine (m = 59 Da) or (B) the thiocholine thiolate (m = 119 Da) from the thiocholine peptide adduct...31 Scheme 1.3 Synthesis of (A) thiocholine and (B) thiocholine- 13 C,d...32 ix
12 LIST OF TABLES Table 2.1 Identification of phosphorylation sites in ipla 2 β phosphorylated by PKA...65 Table 3.1 Identification of endogenous phosphorylation sites in ipla 2 β heterologously expressed in Sf-9 cells without thiocholine modification Table 3.2 Identification of endogenous phosphorylation sites in ipla 2 β heterologously expressed in Sf-9 cells with thiocholine modification Table 3.3 Calculated distances between the catalytic site serine 465 of ipla 2 β and the identified phosphorylation sites of ipla 2 β heterologously expressed in Sf-9 cells utilizing the BEMA strategy or traditional direct analysis in the 3-D model of ipla 2 β molecule generated by I-TASSER Table 4.1 Improvement of peptide identification in MASCOT search results using Percolator Table 4.2 Identification of phosphorylation sites in proteins from mitochondria isolated from control and ischemic mouse hearts using BEMA with light and heavy thiocholine Table 4.3 Identification of phosphorylation sites from mitochondrial proteins isolated from control and ischemic mouse hearts using BEMA with light and heavy thiocholine x
13 LIST OF FIGURES Figure 2.1 Optimization of β-elimination and Michael addition reaction conditions for phosphorylated serine containing peptides using the model peptide FQpSEEQQQTEDELQDK...75 Figure 2.2 Comparison of the ionization efficiency of the phosphopeptide FQpSEEQQQTEDELQDK ( ) and its thiocholine-modified derivative FQS*EEQQQTEDELQDK ( )...76 Figure 2.3 Detection limit for the thiocholine-modified peptide FQS*EEQQQTEDELQDK...77 Figure 2.4 Optimization of β-elimination and Michael addition reaction conditions for the phosphorylated threonine containing peptide: DHTGFLpTEYVATR (i)...78 Figure 2.5 Optimization of β-elimination and Michael addition reaction conditions for the phosphorylated threonine containing peptide: DHTGFLpTEYVATR (ii)...79 Figure 2.6 Optimization of β-elimination and Michael addition reaction conditions for the phosphorylated threonine containing peptide: DHTGFLpTEYVATR (iii)...80 Figure 2.7 Fragmentation of the thiocholine-modified peptide FQS*EEQQQTEDELQDK...83 Figure 2.8 The product-ion spectrum of the doubly charged molecular ion for the thiocholine-modified model peptide FQS*EEQQQTEDELQDK at m/z , acquired with an LTQ-Orbitrap...85 Figure 2.9 The product-ion spectrum of the thiocholine-modified peptide C a N d VMGPS*GFPIHTAMK at m/z , acquired with an LTQ-Orbitrap...86 xi
14 Figure 2.10 Sequence coverage comparison between the thiocholine-modified peptide SS*GAAPTYFRPN d GR and the phosphopeptide p(ss)gaaptyfrpn d GR identified in PKA phosphorylated ipla 2 β...87 Figure 2.11 Fragmentation of the thiocholine-modified peptide EIS*VADYTSHER identified in PKA phosphorylated ipla 2 β at both the MS 2 and MS 3 levels...89 Figure 2.12 Comparative quantification of phosphoproteins evaluated using β-casein as a model protein...91 Figure 2.13 Comparison of the retention time of the thiocholine and thiocholine-13c,d3 modified peptides FQS*EEQQQTEDELQDK and FQS**EEQQQTEDELQDK from the model protein β-casein...91 Figure 3.1 Fragmentation of the thiocholine-modified peptide VKEIS*VADYTSHER identified in ipla 2 β at both the MS 2 and MS 3 levels Figure 3.2 Fragmentation of the phosphopeptide VKEIpSVADYTSHERVR identified in ipla 2 β without thiocholine modification Figure D model of ipla 2 β generated by the I-TASSER server Figure 4.1 Workflow of comparative quantitative phosphoproteomics of mitochondria from control mouse hearts and hearts rendered ischemic Figure 4.2 The total ion chromatography (TIC) (0-185 min) obtained from a representative sample using LTQ-Orbitrap as described in Materials and Methods (A). The extracted ion chromatography (XIC) (0-185 min) of the full-mass scans from the TIC (B) xii
15 Figure 4.3 Fragmentation of the heavy thiocholine-modified peptide YHGHS*MSDPGVSYR identified in the subunit α of pyruvate dehydrogenase E1 at both the MS 2 and MS 3 levels Figure 4.4 Workflow of MASCOT Percolator reproduced with permission from Journal of Proteome Research, 2009, 8, by M, Brosch, L. Yu, T. Hubbard, and J. Choudhary Figure 4.5 Comparative quantitation of light and heavy thiocholine-modified peptides Figure 4.6 Tandem mass spectra of manually verified mitochondrial peptides with a score greater than 7 and less than Figure A. 1 H NMR (D 2 O) spectrum of natural abundance thiocholine Figure B. 1 H NMR (D 2 O) spectrum of thiocholine- 13 C,d Figure C. The scheme of the electron-donating effect of the β-methyl group of threonine affecting the reaction rates of β-elimination and Michael addition Figure D. Nomenclature of peptide fragment ions xiii
16 ABBREVIATIONS ATP BEMA α-chca CE CI CID adenosine-5'-triphosphate β-elimination and subsequent Michael addition α-cyano-4-hydroxycinnamic acid capillary electrophoresis chemical ionization collision induced dissocation cpla 2 s cytosolic phospholipases A 2 2,5-DHB DMSO DNA DTNB DTT ECD EI ESI ETC ETD FA FAB FDR FT-ICR GC 2,5-dihydroxybenzoic acid dimethyl sulfoxide deoxyribonucleic acid 5,5 -dithiobis(2-nitrobenzoic acid) dithiothreitol electron capture dissociation electron ionization electrospray ionization electron transport chain electron transfer dissociation formic acid fast atom/ion bombardment false discovery rate Fourier transform-ion cyclotron resonance gas chromatography xiv
17 HPLC high-performance liquid chromatography HPLC-ESI-MS 2 /MS 3 high-performance liquid chromatography-electrospray ionization tandem with mass spectrometry IMAC ipla 2 β itraq LTQ-Orbitrap MALDI MALDI-TOF/TOF immobilized metal affinity chromatography calcium-independent phospholipase A 2 β isobaric tags for relative and absolute quantitation linear ion trap in tandem with Orbitrap matrix-assisted laser desorption ionization matrix-assisted laser desorption ionization tandem with time of flight mrna MS MS 2 MS 3 MWCO NMR PEP PITC PKA ps/pt PTC PTH PTM messenger ribonucleic acid mass spectrometry tandem mass spectrometry MS/MS tandem mass spectrometry MS/MS/MS molecular-weight cutoff nuclear magnetic resonance posterior error probability phenyl isothiocyanate protein kinase A phosphorylated serine/threonine phenyl thiocarbamyl phenyl thiohydantoins posttranslational modification xv
18 SA SCX SDS-PAGE SF-9 cells SILAC SIMS SNL sinapic acid strong cation exchange chromatography sodium dodecyl sulfate polyacrylamide gel electrophoresis spodoptera frugiperda cells stable isotope labeling with amino acids in cell culture secondary ion mass spectrometry signature neutral loss spla 2 s secretory phospholipases A 2 SVM TCH TFA TOF XIC support vector machine Thiocholine trifluoroacetic acid time-of-flight extracted ion chromatography xvi
19 CHAPTER 1 INTRODUCTION Posttranslational modifications (PTMs) of proteins are covalent transformations of terminal residues or side chains of the polypeptide backbone that occur after protein synthesis from mrna, encoding each protein s primary sequence [1]. The chemical repertoire of protein functional diversity is greatly expanded through the addition of specific functional groups (e.g., phosphorylation, acetylation, glycosylation) that confer novel chemical properties to the primary amino acid sequence encoded by the mrna transcribed from DNA. These PTMs serve multiple functions to facilitate enzyme-substrate recognition, catalytic efficiency, and the subcellular localization of the protein and the cadre of associated proteins that allow adaptive responses to cellular perturbations [2-5]. Currently, more than 200 different PTMs have been discovered located at tens of thousands of individual sites; they greatly expand the chemical diversity encoded by each organism s genomic structure [6]. Protein phosphorylation is the addition of a phosphate group to the side chain of an amino acid residue through esterification. This process is catalyzed by a class of enzyme, 1
20 called protein kinases. Phosphorylation is typically a reversible post translational modification because cells contain numerous phosphatases that can reversibly remove the phosphate moiety [7]. Collectively, the reversible cycle of phosphorylation and dephosphorylation is a central determinant of cellular metabolic flux through exploiting the differential catalytic or regulatory properties of the modified entity. Phosphorylation has historically been considered to be the most ubiquitous and important post translational modification of proteins; phosphorylation facilitates multiple changes in cellular regulation and signaling thereby promoting key chemical alterations that lead to effective adaptive regulation. In the human genome, about 2% of the encoded proteins are dedicated to maintaining the appropriate phosphorylation state of targeted proteins through the actions of a wide array of protein kinases and phosphatases [8-9]. Moreover, approximately 30% of all known proteins in cells are rapidly and reversibly phosphorylated to various extents during pathophysiologic perturbations to facilitate cellular adaptation [10-12]. Although phosphorylation has been demonstrated to occur on the hydroxyl group of serine, threonine, tyrosine, the carboxylic moiety of aspartic acid and glutamic acid [13]; the thiol group of cystine [14] or on basic amino acid residues such as arginine, lysine and histidine [15-16]; reversible phosphorylations on serine, threonine and tyrosine residues are of the greatest importance and collectively account for almost 99% of the protein phosphorylation in eukaryotic cells [17]. Variations in the phosphorylation state of proteins, often accompanied by changes in their tertiary structures, lead to alterations in their 2
21 enzymatic activities and provide essential clues to the molecular mechanisms mediating cellular activation after receptor stimulation or cellular adaptations reflecting fluctuations in the nutritional state, cellular environment and metabolic history of the cell [18]. The reversible covalent phosphorylation of cellular proteins is widely believed to be the most important mechanism for the regulation of multiple signal transduction pathways in cell growth, division, and death by acting as a molecular on/off switch at multiple nodes in metabolic networks [19-21]. Therefore, comprehensive protein-phosphorylation studies that identify the phosphosites and the level of phosphorylation have been conducted, leading to the growth of a new field termed Phosphoproteomics. More specifically, the total chemical characterization of phosphoproteins includes the detection, identification and quantitation of component phosphopeptides as well as the localization of the exact residues that are phosphorylated and the patterns of phosphorylation that are manifest in each protein. Historically, labeling of proteins with radioactive phosphate ( 32 P) has typically been recognized as one of the gold standards for the detection of phosphorylated proteins and the identification of changes in protein phosphorylation. In this approach, 32 P is introduced into phosphoproteins to enable detection usually by scintillation counting or autoradiography. This technique was first introduced by Rall and Sutherland in 1956 [22]. There are generally two categories of 32 P radiolabeling: in vivo (within the living) and in vitro (within the glass) involving different approaches. In living systems, the 32 P labeled orthophosphate is transported across cells and converted into [γ- 32 P]-ATP that serves as the 3
22 phosphate donor. The radioactive 32 P orthophosphate can be delivered either in cell culture experiments (by inclusion into the media), through perfusion in isolated organ systems or by introduction into live animals, and by other more specialized methods. Next, radiolabeled phosphates are transferred to amino acid targets (typically hydroxyl) by various endogenous protein kinases [23-24]. In contrast, in vitro systems require [γ- 32 P]-ATP and the addition of exogenous protein kinases that are suitable for substrate protein or peptides contained in the target systems [25]. In both cases, 32 P labeled proteins are typically separated by sodium dodecyl sulfate polyacrylamide gel electrophoresis (SDS-PAGE) according to their electrophoretic mobilities, which are a function of their respective molecular weights. Traditionally these radiolabeled phosphoproteins are fixed in the gel prior to detection by autoradiography. Comparative quantitation of protein phosphorylation is achievable through the ratiometric comparisons of protein mass and 32 P radioactivity as revealed by Cerenkov radioactivity counting of excised bands [26]. Radiolabeling is a very sensitive method in terms of the detection of phosphoproteins. There are, however, several disadvantages associated with it. First, large amounts of 32 P are required to detect the phosphorylation of low abundance proteins owing to isotopic dilution from endogenous unlabelled ATPs; second, the success of labeling depends on the relative rate of phosphorylation and dephosphorylation as well as the incubation time; third, phosphosite localization requires mutagenesis, currently making it extremely difficult for phosphosite determination in individual proteins and rendering the large scale high throughput analysis of the phosphoproteome through this approach an intractable problem 4
23 [17, 27]. Fluorescence labeling is a sensitive nonradioactive alternative to 32 P radiolabeling with a detection limit at the nanogram level [28]. The fluorophore, which is a functional group that can absorb energy of a specific wavelength (absorption spectrum) and re-emit the energy at a different but specific wavelength (emission spectrum) to identify a molecule of interest that is either covalently [29] or non-covalently [30] introduced into phosphoproteins. Fluorescence labeling has been traditionally coupled with SDS-PAGE where proteins are separated, stained, detected and quantitated with fluorescence spectroscopy [31]. Phosphoproteins can also be detected by using immunoblotting methods [32], which employ high-quality antibodies derived specifically for phosphorylated serine, threonine and tyrosine residues. This technique will be discussed later in the enrichment of phosphopeptides. The strategies discussed above only provide an indication of the presence of phosphoproteins and not information on the specific location or the extent of phosphorylation of specific residues at each phosphosite. In early studies, Edman degradation was the classic technique to locate the site of the phosphorylated amino acid residues and could yield semi-quantitative results when coupled with HPLC. This technique of stepwise degradation was first introduced by Pehr Edman in 1950 [33] who demonstrated that phenyl thiohydantoins (PTH) derived from amino acid could be used to cleave sequentially amino acids from the N-terminus of a protein or peptide. The strategy 5
24 was later named Edman Degradation, in his honor, and was used for decades to sequence proteins and peptides. Under the mild alkaline conditions of this method, the N-terminus of a peptide chain reacts with phenyl isothiocyanate (PITC) to form a phenylthiocarbamyl (PTC) derivative. Next, the first peptide bond from the N-terminus is cleaved under acidic conditions to give rise to a thiazolinone amino acid derivative. This thiazolinone derivative is isolated and transformed into the more stable isomer 3-phenyl-2-thiohydantoin (PTH)-amino acid derivative, which can be identified and quantitated by HPLC through comparing its elution profile with that of the standard PTH-amino acid derivative. The shortened peptide subsequently undergoes additional cycles of this series of reactions. Thus, by the identification of each individual PTH-amino acid derivative, the sequence of the peptide is established from the N-terminus. Further, phosphorylated serines, threonines and tyrosines can be located within the peptides. Even under favorable conditions, Edman degradation can sequence a polypeptide chain that contains only 30 to 50 amino acids owing to the deteriorating overall yield after each cycle of reactions. Thus, useful information typically can only be obtained for only residues [34]. It also requires pure peptides or proteins for unambiguous localization of each amino acid. Other limitations include modest sensitivity at the picomole level and time-consuming reaction and analysis processes [17]. Although automation is achievable through the development of automatic sequenators [35], many N-termini of proteins are blocked, precluding Edman degradation of these residues. Unlike the techniques mentioned above, mass spectrometry (MS) is a 6
25 multi-dimensional technique that is extremely sensitive, amenable to high-throughput analyses, and can integrate protein phosphorylation detection, localization and quantitation in a single experiment. Accordingly, mass spectrometry has become the state-of-the-art technology for global phosphoproteomics in large part owing to the rapid advances in the development of instrumentation, bioinformatics platforms, and application paradigms that have revolutionized the field of MS during the past decade. For MS studies, typically three major steps are employed in the analysis of a sample: 1) The generation of the ions in the ion source; 2) The selection and separation of the ions in the mass analyzer; 3) The detection and visualization of the ions by the ion detector that is coupled with data acquisition and analysis programs. In the ion source, energy is transferred to the sample molecules, facilitating the molecules to escape from its original phase, either liquid or solid, into the gas phase. Neutral sample molecules are turned into charged ions through different mechanisms, such as protonation/deprotonation, electron rejection/capture or adduct formation, usually involving gas-phase reactions during the ionization process. Ion sources fall into two main categories, liquid-phase sources and solid-phase sources, based on the different phases of the samples and their surrounding matrices. Traditional ion sources include Electron Ionization (EI) [36-37], Chemical Ionization (CI) [38], Fast Atom/Ion Bombardment (FAB) [39], Secondary Ion Mass Spectrometry (SIMS) [40-41] and other derivatives of these processes. However, these ion sources are not suitable for large biomolecules, such as proteins and peptides; because 7
26 either insufficient energy is provided for sample vaporization or sublimation, or excessive amounts of energy are applied that often result in extensive fragmentation and the loss of information from the intact analytes of interest. The development of Electrospray Ionization (ESI) [42] and Matrix-assisted Laser Desorption Ionization (MALDI) [43] has revolutionized the analysis of a wide variety of molecules, which has been recognized through the award of Nobel Prizes in Chemistry in 2002 to John Fenn and Koichi Tanaka. During electrospray, a strong electric field is applied to the solvent-containing analytes of interest; these are passed through a heated capillary and dispersed into gas phase to form a charged fine aerosol. The organic solvents, such as methanol, isopropanol and acetonitrile are quickly vaporized under inert gas, such as nitrogen, shrinking the sizes of droplets which in turn increases the droplet surface charge density and causes the droplets to divide owing to a stronger coulombic force than the cohesion force. Subsequently, the droplets go through shrinking cycles, and gas-phase ions are eventually formed either through desorption from the charged droplet surface [44] or until the droplet contains a single charged analyte molecule [45]. During the ionization process in MALDI, pulses of intense laser are shot onto a thin solid mixture of matrix molecules and analytes. These matrix molecules, such as alpha-cyano-4-hydroxycinnamic acid (α-chca), sinapic acid (SA) and 2,5-dihydroxy benzoic acid (2,5-DHB), strongly absorb laser wavelengths and transfer the energy absorbed from the laser shot to the analytes, causing the sublimation of matrix molecules and the formation of a matrix plume where analyte molecules are ionized through gas-phase proton transfer [46]. 8
27 After the ions are formed, they are transferred to the mass analyzer and separated according to their mass-to-charge ratio (m/z) through different schemes. A magnetic sector analyzer separates ions according to their respective momentums [47]; a quadruple analyzer determines m/z according to ion stability path [48]; kinetic energy is measured and differences are compensated by using an electrostatic sector analyzer [49]; a time-of-flight (TOF) analyzer measures ion flight time (i.e., velocity) [50]; whereas a quadruple ion trap [51], a Fourier transform-ion cyclotron resonance (FT-ICR) [52] and an Orbitrap analyzer all rely on ion orbital frequencies and restoring potentials to determine m/z [53]. Different mass analyzers can be coupled together to form hybrid instruments that access the advantages of each individual analyzer, such as accurate mass analyses that are routinely performed today using time-of-flight (TOF), Fourier transform ion cyclotron (FT-ICR) and Orbitrap mass analyzers. Another important function of coupled or hybrid instrumentation is to perform tandem mass spectrometry (MS/MS, or MS 2 ) on the ions of interest. The first step is to obtain the information regarding the ions of interest through scanning with one mass analyzer. Then an ion of interest (precursor ion) is selected by the first mass analyzer, fragmented through gas-phase collisions with air or other inert gases in the collision cell, which may also be a mass analyzer [54]. The fragment ions, or product ions, resulting from the collision are subsequently analyzed by a second mass analyzer to reveal the structural information of the analyte [55]. Ion trap analyzers are capable of performing tandem mass spectrometric analyses independently, in time rather than in space, but their mass accuracy 9
28 is limited especially by current technology [51]. To achieve better sensitivity when analyzing complex samples, MS is often coupled with a separation technique, such as gas chromatography (GC) [56-57], high-performance liquid chromatography (HPLC) [58] or capillary electrophoresis (CE) [59-60]. The analytes are separated according to their different physical or chemical properties, and they are either directly introduced into the mass spectrometer for analysis (on-line) or collected and analyzed off-line. Despite possessing advantages such as high sensitivity, high-throughput, high tolerance of sample impurity and the ability to carry out the detection, identification, localization and quantitation of phosphorylation sites simultaneously, mass spectrometric procedures for the analysis of protein phosphorylation still have considerable limitations owing to the intrinsic chemical properties of phosphorylated proteins. Peptides containing phosphorylated serine/threonine (ps/pt) residues rapidly undergo neutral loss of phosphoric acid (H 3 PO 4 ) through cyclo-elimination occurring in low-energy collision-induced dissociation (CID); this reaction leads to loss of sequence coverage [61]. In addition, typical signaling proteins undergo reversible phosphorylation and are often present in extremely low abundance. Furthermore, protein phosphorylation patterns, which are of great biological significance, are heterogeneous and extremely difficult to determine. Phosphorylated peptides generally have poor ionization efficiencies in the positive ion mode due to the acidity of the phosphate group and ion suppression [17]. Therefore, various methods are available to improve the analysis of the phosphoproteome from 10
29 different perspectives. Precursor-ion scanning utilizes the signature fragment ion of phosphate (PO - 3, m/z = 79) from phosphopeptides during CID in the negative-ion mode [62-63]. This scanning mode is highly effective for the identification of phosphopeptides. Nonetheless, the exact location of the phosphorylated residue cannot be determined in these studies using the negative-ion mode. Phosphosite localization usually requires a separate sample run under acidic conditions in the more sensitive positive-ion mode. Another scanning mode that takes advantage of the neutral loss of phosphoric acid is neutral-loss triggered in an MS 3 experiment with an ion trap mass analyzer [64-65]. As mentioned above, the neutral loss of H 3 PO 4 will prevent the cleavage of the peptide bond in CID. However, data-dependent MS 3 was employed to analyze further fragment ions that are 98 Da less than the precursor ions to reveal sequence information. Multistage activation utilizes a similar approach to induce the fragmentation of precursor ions and the target fragment ions resulting from the neutral loss of phosphoric acid in one single experiment [66-67]. This effectively combines product-ion spectra from MS 2 and MS 3 into a single spectrum. The actual utility of both neutral-loss triggered MS 3 and multistage activation in large-scale phosphoproteome analysis is debatable compared to utilizing a high-mass accuracy instrument employing conventional strategies [68]. The above-mentioned neutral loss of H 3 PO 4 is associated with commonly employed collision induced dissociation (CID). In CID, peptide fragmentation depends on the protonation of the peptide-bond nitrogen and an increase in vibrational energy that a 11
30 peptide gains through the collision with inert gas (e.g., helium, argon) that allows it to traverse the energy barrier required for the cleavage of a peptide bond. Thus, the fragmentation behavior of a peptide in CID depends on its specific sequence and the posttranslational modifications (PTMs) [61]. Other fragmentation methods can circumvent the unwanted neutral loss of phosphate; these include electron-capture dissociation (ECD) [69] and electron-transfer dissociation (ETD) [61]. In ECD, proteins and peptides that are bearing multiple positive charges from the protonation process during electrospray react with electrons in a Fourier transform ion cyclotron resonance (FT-ICR) mass spectrometer causing fragmentation of the peptide backbone in a series of radical-induced reactions that are independent of the nature of the amino acid residues, leaving the PTMs intact [70-71]. However, the utility of ECD is somewhat limited because that it can only be coupled with FT-ICR, which is more expensive to build and maintain than any other mass spectrometer since the storage of the electron requires static electric and magnetic fields [72]. On the other hand, in the recently developed method of ETD, an electron is transferred to a peptide through the gas-phase reaction between the peptide molecule and an anionic compound that serves as an electron carrier. The electron carrier usually has a very low electron-affinity; it is often an anion that can easily lose the extra electron; an example neutral is anthracene. Similar to ECD, ETD leads to the generation of c and z fragment ions instead of the b and y ions that form in CID, and the phosphate group on the amino acid residue remains intact [73-74]. ETD can be coupled with routine mass spectrometers such as quadruple ion trap and linear ion trap, expanding its utility in phosphoproteomics. 12
31 However, doubly charged peptides generally have poorer sequence coverage than do high-charge peptides in ETD because they undergo non-dissociative electron transfer [75] and, thus, must usually be coupled with traditional CID for improved results [76-77]. Because the abundance of phosphoproteins is low, efforts have been focused on the development of enrichment strategies. Immunoblotting is a very sensitive method for the detection of phosphoproteins as discussed earlier. Similarly, antibodies have been utilized to enrich phosphorylated proteins and peptides found in a complex mixture. Although antibodies are available specifically for phosphorylated serines, threonines and tyrosines [78-80], those for phosphorylated serines and threonines are less effective than those for phosphorylated tyrosines. Numerous studies on phosphorylated tyrosine residues involved in signal transduction pathways show, through enrichment by immunoprecipitation and subsequent analysis, improved signal to noise ratio. [81-82]. Immobilized metal affinity chromatography (IMAC) is used to enrich phosphopeptides based on the affinity interaction between the phosphate group and metal ions (e.g., Fe 3+, Ga 3+ ) that are immobilized on a stationary phase [83-84]. For improved selectivity of IMAC, methyl esterification was adapted to reduce the undesirable binding of acidic/electron rich residues [85]. However, the identification of phosphopeptides is complicated by incomplete and or nonspecific methyl esterification [86]. Other enrichment strategies, such as utilizing titanium dioxide (TiO 2 ) [87] and zirconium dioxide (ZrO 2 ) [88] have shown better specificity towards phosphopeptides. Titanium dioxide is the most commonly employed enrichment resin. This strategy is based on the affinity between the 13
32 phosphate group and titanium dioxide through formation of a bridging bidentate surface complex [89]. It can be used offline in the form of a micro-column [86], or coupled with traditional HPLC columns in an online multidimensional liquid chromatography setting [90]. Strong cation exchange chromatography (SCX) is another widely used enrichment method that does not have specificity for phosphopeptides compared to other enrichment strategies but can considerably reduce sample complexity. The reduction in sample complexity results from the early elution of phosphorylated peptides owing to their low charge state in acidic conditions. The majority of the tryptic peptides are doubly (+2) or triply (+3) charged under these conditions and, thus, elute later than their phosphopeptide counterparts. Strong cation exchange chromatography is usually utilized in tandem with other enrichment or separation techniques, such as TiO 2 or reverse-phase (RP) chromatography either offline [91] or online [92]. Because phosphorylated tyrosines comprise only approximately 0.1% of the total phosphorylation present in proteins and can be effectively enriched through immunoprecipitation with commercially available antibodies as mentioned above, focus has been centered on improved strategies for analysis of phosphorylated serines (~90%) and threonines (~10%). Chemically replacing the phosphate on serine or threonine with other functional groups via alkaline induced β-elimination and subsequent Michael Addition (BEMA) is one such approach that was first introduced by Myers et al in 1986 [93]. Phosphorylated tyrosines are stable under alkaline conditions becuase the β-proton is on the benzene moiety and is not readily eliminated [27]. The major limitation of this 14
33 strategy is the non-specific β-elimination reaction that occurs on other residues besides phosphorylated serine and threonine. Residues such as alkylated cysteines, O-glycosylated serines and threonines as well as non-phosphorylated serines and threonines undergo β-elimination and generate the same product residues of dehydroalanine or β-methyldehydroalanine as phosphoserine and phosphothreonine, respectively, and, therefore, non-specific loss cannot be differentiated from a genuine phosphosite [94]. This was solved by the introduction of catalytic specificity through the use of a bivalent metal hydroxide. More specifically, through employing barium hydroxide (Ba(OH) 2 ) as the catalyst for the β-elimination of the phosphate group, β-elimination of alkylated cysteines or O-glycosylated serines and threonines occur two orders of magnitude more slowly than β-elimination from ps/pt and non-phosphorylated serine and threonine residues are unaffected [95]. The BEMA strategy not only eliminates the unfavorable neutral loss of H 3 PO 4 but also increases the ionization ability of the phosphorylated peptides by removing the acidic phosphoric acid side chain. Furthermore, various functional groups can be incorporated into the phosphopeptides to act as molecular handles to achieve different goals. Affinity pairs can be applied in the BEMA reaction, in which one is attached to the side chain (e.g. biotin) while the other serves as stationary phase for the enrichment, such as avidin [96]. Alternatively, a perfluorinated tag and fluorous solid phase extraction columns can be employed [97]. The functional group could also serve as a resource for characteristic fragment ions in tandem mass spectrometry analysis, such as using 15
34 2-dimethylamino-ethanethiol as the Michael donor followed by hydrogen peroxide oxidation to generate a thioester ethanesulfoxide derivative that generates a characteristic fragment ion in the low-energy CID mode [98]. The utilization of cysteamine as the nucleophile in BEMA can even convert the formally phosphorylated peptides into a substrate of trypsin so that phosphorylation information is obtained at the time of enzymatic proteolysis [99]. The utility of the BEMA strategy is further extended through stable isotope labeled Michael donors, which together with their natural abundance counterparts, enable comparative quantitative phosphoproteome analysis [ ]. Stable isotope labeling with amino acids in cell culture (SILAC) is a common strategy for comparative quantitative phosphoproteomics [ ]. SILAC utilizes cells grown in separate media conditions to label cellular proteins with light (natural abundance) and heavy (isotope labeled) amino acids. Then the proteins from two different cell culture conditions are mixed together at a normalized total protein content, trypsinized, separated using HPLC and analyzed by mass spectrometry. The same phosphopeptides labeled with light and heavy amino acids will elute from the HPLC column at the same time, and their peak intensity ratio indicates the different extents of phosphorylation of this peptide in two different cell states. Thus, the quantitation information is obtained at the molecular ion level. However, the obvious limitation of SILAC is that it cannot be used to conduct quantitative phosphoproteome analysis in tissue samples; these analyses are more likely to reveal the biological significance of changes in protein phosphorylation in living animals. Isobaric tags for relative and absolute quantitation (itraq) is also a useful labeling 16
35 technique for multiplexed quantitative phosphoproteomics [ ]. Peptides digested from the proteins of up to four different biological states are modified with different isobaric tags at their N-termini. The same phosphopeptides from different states are indistinguishable from one another in a molecular ion scan because they possess the same m/z. However, during the tandem mass spectrometric analysis, the isobaric tags can produce different reporter fragment ions in the low-mass region (m/z = ). Therefore, by comparing the relative abundances of the reporter ions, the phosphorylation change of this peptide is revealed. itraq can be used in the analysis of tissue samples because the modifications are at peptide level. However, given that the quantitation is achieved at the MS 2 level, the sensitivity of this strategy is limited and could lead to large run-to-run deviations and, thus, poor reproducibility. With the insight to develop a BEMA based technology with a molecular handle that possesses strong nucleophilicity, the ability to increase peptide ionization efficiency and a unique structure that would produce characteristic fragment in tandem mass spectrometric analysis, we demonstrate in the first part of this thesis, the development of a novel strategy employing the unique chemical properties of the quaternary amine present in thiocholine (2-mercapto-N,N,N-trimethyl-ethanaminium) in conjunction with alkaline β-elimination and Michael addition (BEMA) reactions for the specific detection, identification and quantitation of phosphorylated serine/threonine-containing peptides. Through replacement of the phosphate with thiocholine, the negative charge on the phosphopeptide is switched to a quaternary amine containing a permanent positive charge (Scheme 1.1). This strategy 17
36 results in a markedly increased ionization sensitivity during ESI (with a sub-500 amol/µl detection limit) accompanied by the enhanced production of informative peptidic fragment ions during CID that affords increased sequence coverage. Moreover, the definitive localization of phosphorylated residues is greatly facilitated through the generation of diagnostic triads of fragmentation ions resulting from peptide bond cleavage and further neutral loss of either trimethylamine (-59 Da) or thiocholine thiolate (-119Da) during CID in MS 2 and MS 3 experiments (Scheme 1.2). Synthesis of stable isotope labeled thiocholine enabled the quantitation of protein phosphorylation with high precision using ratiometric comparisons of heavy and light thiocholine (Scheme 1.3). The second part of this thesis describes the application of the developed BEMA strategy for the identification of endogenous phosphorylation sites of the hexahistidine tagged calcium-independent phospholipase A 2 β (ipla 2 β) heterologously expressed in Sf9 cells. In parallel, traditional direct analysis of phosphopeptides with data-dependent acquisition MS 2 and neutral loss of phosphoric acid triggered MS 3 was also used to analyze ipla 2 β phosphorylation. The two methods were compared and evaluated to show that the BEMA strategy was substantially more effective in the identification of phosphopeptides and localization of phosphosites with better ion scores as well as higher sequence coverage than the traditional direct analysis. 3-D structure modeling of the ipla 2 β protein was also generated with I-TASSER [ ] to reveal the spacial relations between the phosphorylated residues and the catalytic site of the enzyme. The third part of this thesis identifies the quantitative alterations in the myocardial 18
37 mitochondrial phosphoproteome induced by cardiac ischemia was studied by using mass spectrometry with the developed strategy, β-elimination of phosphate and subsequent Michael addition (BEMA), with natural abundance thiocholine and stable isotope labeled thiocholine. In addition to increased ionization efficiency, sensitivity and improved identification through characteristic diagnostic triads in MS 2 and MS 3 levels enabled by BEMA strategy, a highly selective phosphopeptide enrichment technique using titanium dioxide resin (TiO 2 ) was incorporated prior to the BEMA reactions to reduce sample complexity and improve reaction yields for phosphopeptides [87]. The MASCOT search engine was used to conduct all database searches [111]. The results generated by MASCOT were re-scored by Percolator [ ], a program that utilizes a semi-supervised machine learning algorithm called support vector machine (SVM) to compare true and false positives, for improved phosphopeptides identification. In this study, the phosphoproteome of mitochondria obtained from isolated Langendorff-perfused mouse hearts that underwent global ischemia was investigated. The comparative quantitation of phosphorylation changes as a result of ischemia was achieved by comparing the phosphopeptides modified by heavy thiocholine from mitochondria of ischemic hearts to those modified by light thiocholine from control hearts that were perfused normally. We identified 141 phosphopeptides from 133 unique proteins with 227 phosphorylated sites from 6 independent biological replicates generated from 24 perfused mouse hearts (12 control-perfused, 12 global ischemic), including 36 phosphopeptides from 35 mitochondrial proteins with 50 phosphosites and 37 new mitochondrial 19
38 phosphosites that have not been reported previously. This study has demonstrated that β-elimination of phosphate and subsequent Michael addition (BEMA) using light and heavy thiocholine together with a TiO 2 phosphopeptide enrichment method and a Percolator re-scoring algorithm represents a very effective mass-spectrometry based strategy for comparative quantitative phosphoproteome analysis of in vivo tissue-based systems. 20
39 References (1) Uy, R.; Wold, F. Science 1977, 198, (2) Yang, X. J.; Seto, E. Mol Cell 2008, 31, (3) Vosseller, K.; Wells, L.; Hart, G. W. Biochimie 2001, 83, (4) Schmid, D. G.; von der Mulbe, F. D.; Fleckenstein, B.; Weinschenk, T.; Jung, G. Anal Chem 2001, 73, (5) Thornton, J. M. J Mol Biol 1981, 151, (6) Krishna, R.; Wold, F. Protein Structure: A Practical Approach, 2 ed.; Oxford University Press, USA, (7) Cohen, P. Nat. Cell Biol. 2002, 4, E (8) Manning, G.; Whyte, D. B.; Martinez, R.; Hunter, T.; Sudarsanam, S. Science 2002, 298, (9) Venter, J. C.; Adams, M. D.; Myers, E. W. Science 2001, 291, (10) Krebs, E. G. Philos. Trans. R. Soc. Lond. B. Biol. Sci. 1983, 302, (11) Pyerin, W.; Taniguchi, H. Embo J 1989, 8, (12) Zolnierowicz, S.; Bollen, M. EMBO J. 2000, 19, (13) Kennelly, P. J.; Potts, M. J Bacteriol 1996, 178, (14) Meins, M.; Jeno, P.; Muller, D.; Richter, W. J.; Rosenbusch, J. P.; Erni, B. J Biol Chem 1993, 268, (15) Shibagaki, Y.; Gotoh, H.; Kato, M.; Mizumoto, K. J Biochem 1995, 118, 21
40 (16) Kuba, M.; Ohmori, H.; Kumon, A. Eur J Biochem 1992, 208, (17) Mann, M.; Ong, S. E.; Gronborg, M.; Steen, H.; Jensen, O. N.; Pandey, A. Trends Biotechnol. 2002, 20, (18) Martinez, A.; Haavik, J.; Flatmark, T.; Arrondo, J. L.; Muga, A. J Biol Chem 1996, 271, (19) Hunter, T. Cell 2000, 100, (20) Ashcroft, M.; Kubbutat, M. H.; Vousden, K. H. Mol Cell Biol 1999, 19, (21) Olsen, J. V.; Blagoev, B.; Gnad, F.; Macek, B.; Kumar, C.; Mortensen, P.; Mann, M. Cell 2006, 127, (22) Rall, T. W.; Sutherland, E. W.; Wosilait, W. D. J Biol Chem 1956, 218, (23) Wegener, A. D.; Simmerman, H. K.; Lindemann, J. P.; Jones, L. R. J Biol Chem 1989, 264, (24) Kiss, E.; Edes, I.; Sato, Y.; Luo, W.; Liggett, S. B.; Kranias, E. G. Am J Physiol 1997, 272, H (25) Hopper, R. K.; Carroll, S.; Aponte, A. M.; Johnson, D. T.; French, S.; Shen, R. F.; Witzmann, F. A.; Harris, R. A.; Balaban, R. S. Biochemistry 2006, 45, (26) Cooper, J. A.; Sefton, B. M.; Hunter, T. Methods Enzymol 1983, 99, (27) Yan, J. X.; Packer, N. H.; Gooley, A. A.; Williams, K. L. J Chromatogr A 1998, 808, (28) Steinberg, T. H.; Agnew, B. J.; Gee, K. R.; Leung, W. Y.; Goodman, T.; 22
41 Schulenberg, B.; Hendrickson, J.; Beechem, J. M.; Haugland, R. P.; Patton, W. F. Proteomics 2003, 3, (29) Wang, P. G.; Giese, R. W. Analytical Chemistry 1993, 65, (30) Schulenberg, B.; Arnold, B.; Patton, W. F. Proteomics 2003, 3, (31) Martin, K.; Steinberg, T. H.; Cooley, L. A.; Gee, K. R.; Beechem, J. M.; Patton, W. F. Proteomics 2003, 3, (32) Kaufmann, H.; Bailey, J. E.; Fussenegger, M. Proteomics 2001, 1, (33) Edman, P. Acta Chem. Scand 1950, 4, 277. (34) Laursen, R. A. Eur J Biochem 1971, 20, (35) Niall, H. D. Methods Enzymol 1973, 27, (36) Bleakney, W. Phys. Rev. 1929, 34, (37) Nier, A. O. Rev Sci Instrum 1947, 18, (38) Harrison, A. G. Chemical Ionization Mass Spectrometry; CRC Press, Boca Raton, FL, (39) Barber, M.; Bordoli, R. S.; Garner, G. V.; Gordon, D. B.; Sedgwick, R. D.; Tetler, L. W.; Tyler, A. N. Biochem J 1981, 197, (40) Van Vaeck, L.; Adriaens, A.; Gijbels, R. Mass Spectrometry Reviews 1999, 18, (41) Adriaens, A.; Van Vaeck, L.; Adams, F. Mass Spectrometry Reviews 1999, 18, (42) Fenn, J. B.; Mann, M.; Meng, C. K.; Wong, S. F.; Whitehouse, C. M. Science 1989, 23
42 246, (43) Karas, M.; Hillenkamp, F. Anal Chem 1988, 60, (44) Kebarle, P.; Tang, L. Analytical Chemistry 1993, 65, A972-A986. (45) Dole, M.; Mack, L. L.; Hines, R. L.; Mobley, R. C.; Ferguson, L. D.; Alice, M. B. Journal of Chemical Physics 1968, 49, (46) Zenobi, R.; Knochenmuss, R. Mass Spectrom. Rev. 1998, 17, (47) Mattauch, J.; Herzog, R. Z. Physik 1934, 786. (48) Ferguson, R. E.; McKulloh, K. E. J. Chem. Phys. 1965, 42, 100. (49) Johnson, E. G.; Nier, A. O. Phys. Rev. 1953, 91, 10. (50) Guilhaus, M. Journal of Mass Spectrometry 1995, 30, (51) March, R. E. Journal of Mass Spectrometry 1997, 32, (52) Marshall, A. G.; Hendrickson, C. L.; Jackson, G. S. Mass Spectrometry Reviews 1998, 17, (53) Hu, Q.; Noll, R. J.; Li, H.; Makarov, A.; Hardman, M.; Graham Cooks, R. J Mass Spectrom 2005, 40, (54) Medzihradszky, K. F.; Campbell, J. M.; Baldwin, M. A.; Falick, A. M.; Juhasz, P.; Vestal, M. L.; Burlingame, A. L. Anal Chem 2000, 72, (55) McLafferty, F. W. Tandem Mass Spectrometry; Wiler, New York, (56) Kitson, F. G.; Larson, B. S.; McEwen, C. N. Gas Chromatography and Mass Spectrometry: a Practical Guide; Academic Press, New York 1996, (57) McMaster, M. C.; McMaster, C. GC/MS: a Practical User's Guide; Wiley, New 24
43 York 1998, (58) Ardrey, R. E. LC-MS: an Introduction; VCH, New York 1999, (59) Niessen, W. M. A.; Tjaden, U. R.; Vandergreef, J. Journal of Chromatography 1993, 636, (60) Issaq, H. J.; Janini, G. M.; Chan, K. C.; el Rassi, Z. Adv Chromatogr 1995, 35, (61) Syka, J. E.; Coon, J. J.; Schroeder, M. J.; Shabanowitz, J.; Hunt, D. F. Proc. Natl. Acad. Sci. U. S. A. 2004, 101, (62) Carr, S. A.; Huddleston, M. J.; Annan, R. S. Anal Biochem 1996, 239, (63) Annan, R. S.; Huddleston, M. J.; Verma, R.; Deshaies, R. J.; Carr, S. A. Anal Chem 2001, 73, (64) Beausoleil, S. A.; Jedrychowski, M.; Schwartz, D.; Elias, J. E.; Villen, J.; Li, J.; Cohn, M. A.; Cantley, L. C.; Gygi, S. P. Proc Natl Acad Sci U S A 2004, 101, (65) Ulintz, P. J.; Bodenmiller, B.; Andrews, P. C.; Aebersold, R.; Nesvizhskii, A. I. Mol Cell Proteomics 2008, 7, (66) Schroeder, M. J.; Shabanowitz, J.; Schwartz, J. C.; Hunt, D. F.; Coon, J. J. Anal Chem 2004, 76, (67) Chi, A.; Huttenhower, C.; Geer, L. Y.; Coon, J. J.; Syka, J. E.; Bai, D. L.; Shabanowitz, J.; Burke, D. J.; Troyanskaya, O. G.; Hunt, D. F. Proc Natl Acad Sci U S A 2007, 104,
44 (68) Villen, J.; Beausoleil, S. A.; Gygi, S. P. Proteomics 2008, 8, (69) Zubarev, R. A.; Kelleher, N. L.; McLafferty, F. W. Journal of the American Chemical Society 1998, 120, (70) Shi, S. D.; Hemling, M. E.; Carr, S. A.; Horn, D. M.; Lindh, I.; McLafferty, F. W. Anal Chem 2001, 73, (71) Zubarev, R. A.; Horn, D. M.; Fridriksson, E. K.; Kelleher, N. L.; Kruger, N. A.; Lewis, M. A.; Carpenter, B. K.; McLafferty, F. W. Anal Chem 2000, 72, (72) Mann, M.; Jensen, O. N. Nat Biotechnol 2003, 21, (73) Aebersold, R.; Goodlett, D. R. Chem Rev 2001, 101, (74) Leinenbach, A.; Hartmer, R.; Lubeck, M.; Kneissl, B.; Elnakady, Y. A.; Baessmann, C.; Muller, R.; Huber, C. G. J Proteome Res 2009, 8, (75) Horn, D. M.; Ge, Y.; McLafferty, F. W. Anal Chem 2000, 72, (76) Swaney, D. L.; McAlister, G. C.; Wirtala, M.; Schwartz, J. C.; Syka, J. E.; Coon, J. J. Anal Chem 2007, 79, (77) Good, D. M.; Wirtala, M.; McAlister, G. C.; Coon, J. J. Mol Cell Proteomics 2007, 6, (78) Otvos, L., Jr.; Feiner, L.; Lang, E.; Szendrei, G. I.; Goedert, M.; Lee, V. M. J Neurosci Res 1994, 39, (79) Zhao, J. Y.; Kuang, J.; Adlakha, R. C.; Rao, P. N. FEBS Lett 1989, 249, (80) Flick, M. B.; Sapi, E.; Perrotta, P. L.; Maher, M. G.; Halaban, R.; Carter, D.; Kacinski, B. M. Oncogene 1997, 14,
45 (81) Snyder, G. L.; Girault, J. A.; Chen, J. Y.; Czernik, A. J.; Kebabian, J. W.; Nathanson, J. A.; Greengard, P. J Neurosci 1992, 12, (82) Steen, H.; Kuster, B.; Fernandez, M.; Pandey, A.; Mann, M. J Biol Chem 2002, 277, (83) Andersson, L.; Porath, J. Anal. Biochem. 1986, 154, (84) Posewitz, M. C.; Tempst, P. Anal. Chem. 1999, 71, (85) Ficarro, S. B.; McCleland, M. L.; Stukenberg, P. T.; Burke, D. J.; Ross, M. M.; Shabanowitz, J.; Hunt, D. F.; White, F. M. Nat. Biotechnol. 2002, 20, (86) Mazanek, M.; Mituloviae, G.; Herzog, F.; Stingl, C.; Hutchins, J. R.; Peters, J. M.; Mechtler, K. Nat. Protoc. 2007, 2, (87) Larsen, M. R.; Thingholm, T. E.; Jensen, O. N.; Roepstorff, P.; Jorgensen, T. J. Mol. Cell. Proteomics 2005, 4, (88) Kweon, H. K.; Hakansson, K. J. Proteome Res. 2008, 7, (89) Connor, P. A.; McQuillan, A. J. Langmuir 1999, 15, (90) Pinkse, M. W.; Mohammed, S.; Gouw, J. W.; van Breukelen, B.; Vos, H. R.; Heck, A. J. J Proteome Res 2008, 7, (91) Zanivan, S.; Gnad, F.; Wickstrom, S. A.; Geiger, T.; Macek, B.; Cox, J.; Fassler, R.; Mann, M. J. Proteome Res. 2008, 7, (92) Peng, J.; Elias, J. E.; Thoreen, C. C.; Licklider, L. J.; Gygi, S. P. J Proteome Res 2003, 2, (93) Meyer, H. E.; Hoffmann-Posorske, E.; Korte, H.; Heilmeyer, L. M., Jr. FEBS Lett. 27
46 1986, 204, (94) Wells, L.; Vosseller, K.; Cole, R. N.; Cronshaw, J. M.; Matunis, M. J.; Hart, G. W. Mol. Cell. Proteomics 2002, 1, (95) Byford, M. F. Biochem. J. 1991, 280 ( Pt 1), (96) Oda, Y.; Nagasu, T.; Chait, B. T. Nat. Biotechnol. 2001, 19, (97) Brittain, S. M.; Ficarro, S. B.; Brock, A.; Peters, E. C. Nat. Biotechnol. 2005, 23, (98) Steen, H.; Mann, M. J. Am. Soc. Mass Spectrom. 2002, 13, (99) Knight, Z. A.; Schilling, B.; Row, R. H.; Kenski, D. M.; Gibson, B. W.; Shokat, K. M. Nat. Biotechnol. 2003, 21, (100) Weckwerth, W.; Willmitzer, L.; Fiehn, O. Rapid Commun Mass Spectrom 2000, 14, (101) Amoresano, A.; Marino, G.; Cirulli, C.; Quemeneur, E. Eur J Mass Spectrom (Chichester, Eng) 2004, 10, (102) Vosseller, K.; Hansen, K. C.; Chalkley, R. J.; Trinidad, J. C.; Wells, L.; Hart, G. W.; Burlingame, A. L. Proteomics 2005, 5, (103) Ong, S. E.; Blagoev, B.; Kratchmarova, I.; Kristensen, D. B.; Steen, H.; Pandey, A.; Mann, M. Mol Cell Proteomics 2002, 1, (104) Larive, R. M.; Urbach, S.; Poncet, J.; Jouin, P.; Mascre, G.; Sahuquet, A.; Mangeat, P. H.; Coopman, P. J.; Bettache, N. Oncogene 2009, 28, (105) Rinschen, M. M.; Yu, M. J.; Wang, G.; Boja, E. S.; Hoffert, J. D.; Pisitkun, T.; 28
47 Knepper, M. A. Proc Natl Acad Sci U S A 2010, 107, (106) Ross, P. L.; Huang, Y. N.; Marchese, J. N.; Williamson, B.; Parker, K.; Hattan, S.; Khainovski, N.; Pillai, S.; Dey, S.; Daniels, S.; Purkayastha, S.; Juhasz, P.; Martin, S.; Bartlet-Jones, M.; He, F.; Jacobson, A.; Pappin, D. J. Mol Cell Proteomics 2004, 3, (107) Reinl, T.; Nimtz, M.; Hundertmark, C.; Johl, T.; Keri, G.; Wehland, J.; Daub, H.; Jansch, L. Mol Cell Proteomics 2009, 8, (108) Zhang, Y. BMC Bioinf. 2008, 9, 40. (109) Zhang, Y. Proteins 2009, 77 Suppl 9, (110) Roy, A.; Kucukural, A.; Zhang, Y. Nat. Protoc. 2010, 5, (111) Perkins, D. N.; Pappin, D. J. C.; Creasy, D. M.; Cottrell, J. S. Electrophoresis 1999, 20, (112) Kall, L.; Canterbury, J. D.; Weston, J.; Noble, W. S.; MacCoss, M. J. Nat Methods 2007, 4, (113) Brosch, M.; Yu, L.; Hubbard, T.; Choudhary, J. J Proteome Res 2009, 8,
48 Schemes Scheme 1.1 Chemical modification of phosphoserine and phosphothreonine containing peptides via β-elimination in the presence of Ba(OH) 2 and Michael Addition with thiocholine as the Michael donor. 30
49 Scheme 1.2 Collision induced dissociation (CID) resulting in the neutral loss of either (A) trimethylamine (m = 59 Da) or (B) the thiocholine thiolate (m = 119 Da) from the thiocholine peptide adduct. 31
50 Scheme 1.3 A. Synthesis of thiocholine through acidic hydrolysis of S-acetylthiocholine (72% yield). B. Synthesis of thiocholine- 13 C,d 3. The thiol group of 2-(dimethylamino)ethanethiol was protected by thioesterification with acetic anhydride prior to the addition of methyl- 13 C,d 3. The final product was obtained through acidic hydrolysis (50% yield). 32
51 CHAPTER 2 Facile Identification and Quantitation of Protein Phosphorylation via β-elimination and Michael Addition with Natural Abundance and Stable Isotope Labeled Thiocholine 2.1 Abstract Herein, we employ the unique chemical properties of the quaternary amine present in thiocholine (2-mercapto-N,N,N-trimethyl-ethanaminium) in conjunction with alkaline β-elimination and Michael addition (BEMA) reactions for the specific detection, identification and quantitation of phosphorylated serine/threonine-containing peptides. Through replacement of the phosphate with thiocholine, the negative charge on the phosphopeptide is switched to a quaternary amine containing a permanent positive charge. This strategy resulted in a marked increase in ionization sensitivity during ESI (sub-500 amol/μl detection limit) accompanied by a markedly enhanced production of informative peptidic fragment ions during CID that dramatically increase sequence coverage. Moreover, the definitive localization of phosphorylated residues is greatly facilitated through the generation of diagnostic triads of fragmentation ions resulting from peptide bond cleavage and further neutral loss of either trimethylamine (-59 Da) or thiocholine thiolate (-119 Da) during CID in MS 2 and MS 3 experiments. Synthesis of stable isotope 33
52 labeled thiocholine enabled the quantitation of protein phosphorylation with high precision by ratiometric comparisons using heavy and light thiocholine. Collectively, this study demonstrates a sensitive and efficient strategy for mapping of phosphopeptides by BEMA using thiocholine through the production of a diagnostic repertoire of unique fragment ions during LC-MS 2 /MS 3 analyses, facilitating phosphosite identification and quantitative phosphoproteomics. 34
53 2.2 Introduction In the human genome, about 2% of the encoded proteins are dedicated to maintaining the appropriate phosphorylation state of targeted proteins through the actions of a wide variety of protein kinases and phosphatases [1-2]. Moreover, approximately 30% of all known proteins in cells are rapidly and reversibly phosphorylated to various extents during physiologic or pathophysiologic processes, making phosphorylation one of the most common post-translational modifications (PTMs) of proteins [3]. Although phosphorylation can occur on many amino acid residues (e.g., aspartic acid, glutamic acid, arginine and etc), reversible phosphorylations of serine, threonine and tyrosine collectively account for almost 99% of the protein phosphorylation in cells. The reversible covalent phosphorylation of cellular proteins is widely believed to be the most important mechanism for the regulation of multiple signal transduction pathways [4-6]. The intrinsic chemical properties of phosphorylated peptides render the detection, identification of the phosphorylation sites, and quantitation of alterations in phosphorylation state a challenging problem in proteomics [7-8]. Peptides containing phosphorylated serine/threonine (ps/pt) rapidly undergo neutral loss of phosphoric acid through cyclo-elimination during low-energy CID, and this leads to the loss of peptide sequence coverage. Typical signaling proteins are present in extremely low abundance. While the phosphorylation patterns of these signaling proteins are of great biological significance; they are highly diversified and oftentimes extremely difficult to determine owing to the presence of multiple S or T residues. Moreover, phosphorylated peptides 35
54 generally have poor ionization efficiencies in the positive-ion mode owing to the acidity of the phosphate group and ion suppression [9-12]. Complementary approaches have been developed to overcome these difficulties. Enrichment using immobilized metal affinity chromatography (IMAC) after esterification of carboxylates has been useful in many cases [13-15]. However, identification of phosphopeptides is complicated by polydispersity generated by potentially incomplete and nonspecific methyl esterification [16]. Other enrichment strategies, such as use of titanium dioxide [17-18] and zirconium dioxide [19] have shown great efficiency, but these approaches are still hindered by the intrinsic chemical properties of the phosphate moiety that facilitates its neutral loss. The utility of electron transfer dissociation (ETD) in phosphopeptide analysis is becoming increasingly appreciated [12]. ETD generates c- and z-type ions in which the neutral loss of H 3 PO 4 does not occur [20-21]. Finally, phosphorylated tyrosine comprises only about 0.1% of the total phosphorylation in proteins, and its enrichment and analysis can be effectively achieved through immunoprecipitation with high quality commercially available antibodies [22-23]. Accordingly, analytic efforts have focused on identification and quantitation of phosphorylated serine (~90%) and threonine (~10%) residues that account for the overwhelming majority of phosphorylation in cells. Chemical replacement of the phosphate on serine or threonine with other functional groups by β-elimination and subsequent Michael addition (BEMA) was first introduced by Meyers et al. in 1986 [24]. Since then, this strategy has been widely studied and applied effectively with different Michael donors in the enrichment, identification, quantitation of peptides containing 36
55 phosphoserine and phosphothreonine [25-27]. In prior work, Steen et al. demonstrated the efficacy of 2-dimethylamino-ethanethiol followed by hydrogen peroxide oxidation to generate thioester ethanesulfoxide derivatives that produced informative fragment ions during low-energy CID [28]. However, controlled oxidation with the generation of a single predominant reaction product is not straightforward. With cysteamine as the Michael donor, Knight et al. developed a strategy to cleave enzymatically proteins at their phosphorylation sites [29]. Although information on the phosphorylated proteins can be obtained through enzymatic proteolysis, lysine residues have to be quantitatively blocked through additional chemical reactions to ensure the exclusive cleavage at modification sites. During the development of our strategy, Li et al. used BEMA with several nucleophiles including thiocholine for the detection of phosphopeptides by Raman spectroscopy and mass spectrometry. However, prior mass spectrometric analyses were limited to detection of molecular ions in full MS scans without exploring the unique advantages of this strategy for covalent identification of specific phosphorylation sites through the enhanced generation of informative fragment ions in either the MS 2 or MS 3 modes [30]. In this study, we report a novel strategy for specific detection, identification and quantitation of ps/pt-containing peptides. Thiocholine is introduced into the peptide at the phosphorylation site via high-yield Ba 2+ catalyzed β-elimination of phosphate and subsequent Michael addition (Scheme 1.1). Sample complexity is reduced through reductive alkylation of cysteines and development of optimized BEMA conditions for ps or pt individually. This charge-switch strategy with the thiocholine quaternary amine 37
56 results in a marked increase in ionization efficiency during ESI with detection levels in the sub 500 amol/μl range. The increased endogenous positive charge also engenders higher charge states of thiocholine-labeled tryptic peptides facilitating the production of peptidic fragment ions resulting in increased sequence coverage. Furthermore, phosphopeptide identification has been substantially improved by exploiting the facile neutral loss of trimethylamine (59 Da) and the thiocholine thiolate (119 Da) from the thiocholine adduct (Scheme 1.2). Thus, CID contains not only the b and y series of peptidic fragment ions but, in addition, a diagnostic array of fragment ions during MS 2 and MS 3 analyses. Finally, through the synthesis and use of stable isotope labeled thiocholine, quantitative analysis of alterations in the phosphorylation state of proteins during cellular perturbations can be performed through ratiometric comparisons of phosphopeptides containing stable isotope labeled thiocholine to those containing natural abundance thiocholine.. 38
57 2.3 Materials and Methods Materials Phosphoprotein β-casein and phosphopeptide FQpSEEQQQTEDELQDK were obtained from Sigma-Aldrich (St. Louis, MO), phosphopeptide DHTGFLpTEYVATR was obtained from BIOMOL (Plymouth Meeting, PA); POROS 20 R2 resin was purchased from ABI (Foster City, CA); Slide-A-Lyzer MINI Dialysis Unit, 7K MWCO was purchased from Pierce (Rockford, IL); Rapigest was purchased from Waters (Milford, MA); Protein Kinase A and trypsin were purchased from Promega (Madison, MI); α-cyano-4-hydroxycinnamic acid (α-chca) solution was obtained from Agilent (Santa Clara, CA). All solvents for mass spectrometric analyses were obtained from Honeywell Burdick&Jackson (Muskegon, MI). All other chemicals were obtained from Sigma-Aldrich (St. Louis, MO) Synthesis of Thiocholine Chloride and Thiocholine- 13 C,d 3 Chloride Thiocholine chloride was prepared as previously described by Moss et al. with minor modifications [31]. Briefly, S-acetylthiocholine chloride, 1 g (5 mmol), was dissolved in 10 ml of nitrogen-purged Millipore-purified water, followed by addition of 3.5 ml concentrated HCl to give a solution of 3 N HCl. The solution was heated to 80 C under nitrogen for 30 min and HCl was evaporated from the solution while drying under vacuum. The dried product was then triturated with anhydrous diethyl ether (3~5 ml) and absolute ethanol (3~5 ml). Additional anhydrous ether was added to precipitate the 39
58 product (10 ml) which was filtered and re-crystallized using hot anhydrous ethanol and anhydrous diethyl ether (0.56g, 3.6 mmol).{ 1 H NMR (D 2 O) δ (m, 2H, CH 2 S), 3.0 (s, 9H, N(CH 3 ) 3 ), (m, 2H, CH 2 N)}(Appendix A). Thiocholine- 13 C,d 3 chloride was prepared similarly to thiocholine chloride, except that the precursor S-acetylthiocholine-(N, 13 C,d 3 ) was synthesized according to Ouyang et al. [32]. Briefly, 2.82 g (20 mmol) 2-(dimethylamino)ethanethiol hydrochloride and 2.82 ml (30 mmol) acetic anhydride were mixed and refluxed for 10 min. The mixture was allowed to stand overnight and transferred to a mortar where the solid was triturated with ethyl ether (3-5 ml), the precipitate (2.9 g, 20 mmol)) was resuspended in 5 ml acetone and the ph was neutralized using NaHCO 3. Next, 5 g (25 mmol) of iodomethane- 13 C,d 3 was added and incubated at room temperature under nitrogen for 48 h. Subsequently, thiocholine- 13 C,d 3 chloride was obtained using the same hydrolysis method as that for the naturally occurring isotope described above (1.6 g, 10 mmol). { 1 H NMR (D 2 O) δ (m, 2H, CH 2 S), 2.97, 2.98 (d, 6H, N(CH 3 ) 2 ), (m, 2H, CH 2 N)} )}(Appendix B). The free thiol concentrations of both light and heavy thiocholine were determined using Ellman s assay [51]. Briefly, 40 mg 5,5 -dithiobis(2-nitrobenzoic acid) (DTNB) was added in 0.1 M phosphate buffer (ph 8.0) 10 ml. 0.1 ml of this prepared solution (Ellman s reagent) was mixed with 2 ml of 0.1 M phosphate buffer (ph 8.0) containing 0.1 mg of EDTA in a cuvette. The absorbance of the resultant solution was measured at 412 nm. Next 6 μl of light or heavy thiocholine chloride solution at the concentration of 0.03mmol/5mL (by weight) was added directly to the same cuvette and was incubated at 40
59 room temperature for 15 min. The absorbance of the resultant solution was measured at 412 nm. The concentration of free thiol in the cuvette was calculated using the equation ΔA (net change of absorbance) = ε 412nm x C SH, where ε 412nm = 13.6 cm -1 mm -1. The results indicated a 98% free thiol content in the prepared thiocholine samples. The overall reaction yield for light thiocholine was 72% and 50% for heavy thiocholine chloride. BEMA of Model Phosphopeptide FQpSEEQQQTEDELQDK with Thiocholine The phosphopeptide FQpSEEQQQTEDELQDK was modified via BEMA with thiocholine according to the method of Shokat et al. with minor modifications [29]. Lyophilized FQpSEEQQQTEDELQDK was suspended in water to make a 40 pmol/μl stock solution μl of this stock solution was mixed with 9.5 μl DMSO and 3 μl absolute ethanol followed by the addition of 12.5 μl of freshly prepared saturated Ba(OH) 2. The reaction was incubated at room temperature under nitrogen for 1 h with gentle vortexing every 20 min. The final ph was 12~13. Next, 25 μl of 1 M thiocholine solution freshly prepared in water was directly added to the reaction. The reaction mixture was incubated at room temperature under nitrogen for 3 h at ph 8~9 and then terminated by the addition of 5 μl of 10% TFA. BEMA of Model Phosphopeptide DHTGFLpTEYVATR with Thiocholine Lyophilized DHTGFLpTEYVATR was suspended in water to make a 40 pmol/μl stock solution μl of this peptide stock solution was mixed with 9.5 μl DMSO and 3 μl absolute ethanol followed by the addition of 12.5 μl freshly prepared saturated Ba(OH) 2. 41
60 The reaction was incubated at room temperature under nitrogen for 3 h with gentle vortexing every 20 min. The final ph was 12~13. Next, the β-elimination reaction was terminated by addition of 5 μl of 10% TFA and the resulting solution was desalted with a POROS 20 R2 micro column. The purified peptide solution was dried and reconstituted in 50 μl of 0.5 M thiocholine solution freshly prepared in 0.1 M NaOH. The mixture was incubated at 50 C under nitrogen for 5 h at ph 8~9. The reaction was terminated by the addition of 5 μl 10% TFA. Phosphorylation of Calcium-independent Phospholipase A 2 β by Protein Kinase A Purified ipla 2 β(his) 6 was obtained as previously described by Jenkins et al. [33]. The catalytic subunit of protein kinase A (400U) was incubated with 100 μg of purified ipla 2 β(his) 6 in 40 mm Tris-HCl buffer, ph 7.4 containing 20 mm magnesium acetate and 0.3 mm ATP for 1 h at 30 C. The resultant phosphorylated enzyme was dialyzed against 1L deionized water for 8 h using a Slide-A-Lyzer MINI Dialysis Unit. The dialyzed ipla 2 β sample was dried in a SpeedVac apparatus (Savant, Holbrook, NY) and reconstituted in 50 μl of 0.2% Rapigest in 50 mm NH 4 HCO 3. Next, 2.5 μl of 100 mm DTT was added to a final concentration of 5 mm. The sample was then incubated at 60 C for 30 min before 6 μl 150 mm iodoacetamide was added to quench the reduction and initiate alkylation. The sample was incubated for an additional 30 min in the dark. Trypsin was added to the solution at an enzyme to protein ratio of 1:30 (w:w). The total volume of the sample solution was adjusted to 100 μl with 50 mm NH 4 HCO fmol/μL protein sample was incubated at 37 C for 2 h then acidified with 10 μl 10% 42
61 TFA to lower the ph to < 2. The sample was again incubated at 37 C for 30 min and centrifuged at 13,000 rpm to pellet the hydrolyzed Rapigest. The resultant supernatant was used for thiocholine modification. BEMA of Trypsinized Calcium-independent Phospholipase A 2 β with Thiocholine Trypsinized ipla 2 β samples were dried in a SpeedVac apparatus and reconstituted in 50 μl deionized water follow by the addition of 38 μl DMSO and 12 μl of absolute ethanol. The trypsinized protein solution was then divided into 2 equal aliquots of 50 μl that were separately modified with one of two protocols. Protocol I: 25 μl of saturated Ba(OH) 2 was added to the sample and the reaction was incubated at room temperature under a nitrogen atmosphere for 1 h and gently vortexed every 20 min. The final ph of the reaction mixture was ph 12~13. 1M thiocholine was freshly prepared in water and 50 μl was directly added to each reaction. This reaction was incubated at room temperature for 3 h at ph 8-9 and then terminated by the addition of 10 μl 10% TFA. Protocol II: 25 μl of saturated Ba(OH) 2 was added to the sample and the reaction was incubated at room temperature under a nitrogen atmosphere for 3 h and gently vortexed every 20 min. The final ph was Next, the β-elimination was terminated by addition of 10 μl of 10% TFA and the resulting solution was desalted with a POROS 20 R2 micro column. The purified peptide solution was dried and reconstituted in 50 μl of 0.5 M thiocholine solution freshly prepared in 0.1 M NaOH. This reaction was incubated at 50C under nitrogen for 5 h at ph 8-9. The reaction was terminated by the addition of 43
62 5 μl 10% TFA. Comparative Quantitation of Phosphoproteins using Natural Abundance Thiocholine and Thiocholine- 13 C,d 3 with the Model Protein β-casein 50 μl 1 mg/ml β-casein solution prepared in water was mixed with 50 μl 0.2% Rapigest in 100 mm NH 4 CO 3. The protein sample was subjected to in-solution tryptic digestion as described above. The resulting trypsinized β-casein was concentrated with a SpeedVac to ~50 μl and divided to 2 equal aliquots. Aliquot 1 was subject to BEMA with natural abundance thiocholine as the Michael donor while aliquot 2 was modified with stable isotope labeled thiocholine- 13 C,d 3 both using Protocol I for ipla 2 β covalent modification as described above. Modified trypsinized β-casein in aliquots 1 and 2 were then mixed in selected ratios (v:v; aliquot 1: aliquot 2, or light: heavy): five independent replicates at 1:1 and three independent replicates at 1:2, 1:3, 1:4, 4:1, 3:1 and 2:1 ratios respectively were performed. Experimental ratios from mass spectrometric analyses were compared to expected ratios to evaluate the reproducibility and linearity of the method. Sample Purification All samples subject to mass spectrometric analysis were desalted with POROS 20 R2 micro columns according to the procedure by Thingholm et al. [34]. Briefly, a POROS 20 R2 micro column was assembled by stamping out a small plug of C8 material from a 3 M Empore C8 extraction disk using a HPLC syringe needle and placing this plug in the constricted end of a GELoader tip. Next, POROS R2 beads that were suspended 50% 44
63 acetonitrile at 5mg/200 µl were packed in the GELoader tip by pressing air through the micro column using an Eppendorf syringe. The length of the packed POROS R2 resin was about 3-6 mm. Then the column was washed with 30 µl 50% acetonitrile and equilibrated with 30 µl 0.1% trifluoroacetic acid. Sample solution was then loaded onto the POROS R2 micro column. The sample was slowly passed through the micro column by pressing air through the using a Eppendorf syringe. The column was washed twice with 30 µl 0.1% trifluoroacetic acid and the bounded peptides were eluted first using 30 µl 70% acetonitrile with 0.05 % trifluoroacetic acid, then 5 µl 30% acetonitrile with 0.05% trifluoroacetic acid. MALDI-TOF/TOF Mass Spectrometric Analyses MALDI-TOF/TOF mass spectrometric analyses were performed using a 4800 MALDI-TOF/TOF Analyzer (Applied Biosystems, Foster City, CA). 1 μl of each peptide sample eluted from a POROS R2 micro column was mixed with 1μL α-chca solution and 0.5 μl of the mixture was spotted on an Opti-TOF 384 well plate. Mass spectra of all peptide samples were acquired in the positive ion mode by averaging 500 consecutive laser shots (50 shots per subspectrum with ten total subspectra) with default calibration. MS 2 analyses of the peptide samples were accomplished by collision-induced dissociation (CID) using air at medium pressure. HPLC-ESI-MS 2 /MS 3 Mass Spectrometric Analyses Trypsinized protein and peptide samples desalted with POROS 20 R2 micro columns 45
64 were dried and reconstituted in 0.1% formic acid before injection and separation using a Surveyor HPLC system (Autosampler and Pump, ThermoFisher, San Jose, CA) equipped with a reverse-phase C18 PepMap100 Nano-LC column (75 μm I.D. x 15 cm, 3 μm, 100 angstrom; Dionex, Sunnyvale, CA). Flow rate was maintained at nl/min. Samples eluting from the column were directed to the nanospray apparatus (i.e. NanoMate HD with LC coupler, Advion Bioscience Ltd., Ithaca, NY) and sprayed directly into an LTQ-Orbitrap mass spectrometer (ThermoFisher, San Jose, CA) at a spray voltage of 1.7 kv in the positive ion mode. Model peptides and trypsinized β-casein samples were eluted with a gradient from 100% A to 50% A, 50% B in 20 min (Buffer A: 90% water, 10% acetonitrile, 0.1% formic acid; Buffer B: 10% water, 90% acetonitrile, 0.1% formic acid, v:v) and were subject to data-dependent MS 2 analyses: full mass scans were acquired using an Orbitrap ( m/z, mass resolution = 30,000) followed by product-ion scans in the LTQ of the five most abundant ions. ipla 2 β samples, modified by the two optimized protocols, were analyzed first in survey runs, which consisted of a 90-min gradient from 100% A to 50% A, 50% B and data-dependent MS 2 analyses: full mass scans in the Orbitrap ( m/z, mass resolution = 30,000) were followed by product-ion scans in the LTQ of the five most abundant ions. The ions of interest from the survey runs were then included in the parent mass list of the target runs. The target runs consisted of a 180-min gradient from 100% A to 75% A, 25% B (120 min), then to 50% A, 50% B (60 min) and data-dependent MS 2 /MS 3 analyses: full mass scan in the Orbitrap ( m/z, mass resolution = 30,000) were followed by product-ion scans in the LTQ of the three most abundant ions from the parent mass list and the MS 3 scans in the LTQ 46
65 of the ten most abundant fragment ions following each of the three product-ion scans. The normalized collision energy for CID was set at 25 for all data-dependent scans. Data Processing The local MASCOT server was used to conduct all database searches. A single-protein (ipla 2 β) database was created by in silico trypsinolysis. Thiocholine and thiocholine- 13 C,d 3 with neutral loss trimethylamine and thiolate were integrated into MASCOT for customized processing of the designed covalent modifications for serine and threonine residues at the MS 2 level. Carbamidomethylation (C) was set as the fixed modification for trypsinized ipla 2 β samples. 47
66 2.4 Results and Discussion The chemical replacement of the phosphate on serine and threonine residues via β-elimination and Michael addition has been widely used for analyses of phosphopeptides. However, an efficient method that concomitantly yields high sensitivity, minimal side reactions and informative diagnostic ions suitable for quantitative analyses of both ps and pt-containing peptides in the phosphoproteome has remained elusive. Thiocholine was chosen as the Michael donor in this study because of the extraordinary sensitivity of the quaternary amine for ionization during ESI and its utility in creating diagnostic fragment ions resulting from the neutral loss of trimethylamine and the thiocholine thiolate. The syntheses of both thiocholine and stable isotope labeled thiocholine- 13 C,d 3 are straightforward (Scheme 1.3). Model peptides containing either phosphoserine (FQpSEEQQQTEDELQDK) or phosphothreonine (DHTGFLpTEYVATR) were chosen to assure that reaction conditions were developed that facilitate assessment of either serine or threonine phosphorylation sites. For proteins, either the traditionally employed model protein β-casein was used or phosphorylation of the signaling protein ipla 2 β by protein kinase A (PKA) was studied. Optimization of BEMA Conditions and Ionization Efficiency The overall reaction yield is an important factor for the success of the BEMA strategy. Given that the reaction rates of phosphorylated serine and threonine residues are quite different for either β-elimination or Michael addition owing to the electron-donating 48
67 effect of the β-methyl group of threonine residue (Appendix C), the reaction conditions were optimized for phosphorylated serines and threonines individually by using the model phosphopeptides FQpSEEQQQTEDELQDK and DHTGFLpTEYVATR. Through the use of Ba(OH) 2, a controlled high-yield conversion of FQpSEEQQQTEDELQDK to its corresponding dehydro-alanine derivative was accomplished within 40 min (Figure 2.1). The addition of thiocholine then resulted in the rapid (< 60 min) synthesis of the desired thiocholine adduct. Based upon integrated UV absorbance, these sequential transformations were accomplished in near quantitative yield (Figure 2.1). To ensure the completeness of the reaction for more complicated samples, the reaction times were set at 1 h and 3 h for β-elimination and Michael addition, respectively. The mass spectrometric utility of this covalent conversion was demonstrated by a marked increase in ionization efficiency with ESI illustrated by the total ion current tracing obtained during reversed-phase chromatography after injection of identical amounts of the thiocholine-modified peptide and its non-modified phosphopeptide precursor. This remarkable increase in ionization efficiency is engendered by the replacement of acidic phosphate with quaternary amine bearing thiocholine that possesses an endogenous positive charge and is extraordinarily sensitive to ionization during the electrospray process (Figure 2.2-A). The detection limit of this method using ESI is at the attomole level (Figure 2.3). Using MALDI, a 3-fold increase in MS signal was present after derivatization as demonstrated by analysis of a sample containing equal amounts of phosphopeptide and thiocholine-modified phosphopeptide onto a MALDI plate using α-chca as matrix (Figure 2.2-B). 49
68 Phosphorylated threonines, possessing secondary hydroxyls, generally have slower reaction rates during both β-elimination and Michael addition in comparison to their primary hydroxyl counterparts [35]. Simply increasing the incubation temperature and/or incubation time results in increased formation of side products and is not productive [11, 36-37]. However, by purification of the dehydro-alanine intermediate from β-elimination and through the use of nitrogen protection, the overall reaction yield for Michael addition using the model peptide, DHTGFLpTEYVATR, has been greatly improved (Figure ). These modification strategies individualized for ps or pt residues greatly maximize the effectiveness of BEMA for phosphoproteomics. Phosphorylated tyrosines are stable and are not altered under the alkaline conditions employed in this study [35]. Fragmentation of Thiocholine-modified Peptides In addition to dramatically increasing ionization efficiency in ESI-MS, thiocholine derivatization exhibits the unique ability to generate diagnostic triads of informative fragment ions resulting from both the routine peptide bond cleavage and the facile neutral loss of either trimethylamine (59 Da) or thiocholine thiolate (119 Da) during CID in MS 2 and MS 3 scanning. This results in a greatly improved identification algorithm for target peptides. A representative ESI-product-ion spectrum of the triply charged molecular ion of the thiocholine-modified peptide FQS*EEQQQTEDELQDK is shown in Figure 2.7-A. Analysis of the fragmentation pattern demonstrated multiple informative b and y ions necessary for sequence identification. As shown in the expanded 50
69 spectrum, a representative peptidic fragment ion b + 5 (m/z = 722.3) is accompanied by its neutral loss counterparts b (m/z = 663.2) and b (m/z = 603.2) after loss of trimethylamine or thiocholine thiolate, respectively (nomenclature of peptide fragment ions is presented in Appendix D). The concurrence of these diagnostic triads of fragment ions obtained through conventional CID represent key informative features that can further facilitate the identification of peptides and increase the confidence of assignment of the phosphorylated residue(s) on peptides containing multiple potential phosphorylation sites.. Furthermore, use of MS 3 +2 for the thiocholine-containing ion y 14 (m/z = 904.4) demonstrated that neutral loss of trimethylamine is the dominant fragmentation pathway leading to a signature neutral loss product at m/z (M - 59) (Figure 2.7-B). Thus, introduction of the thiocholine side chain and subsequent fragmentation resulted in the generation of suites of diagnostic triads of fragment ions in both MS 2 and MS 3 experiments that helped not only to enhance sequence coverage, but also to increase the confidence of the phosphopeptide identification and the specific location of the modified residue. Tandem mass spectrometric analyses of FQS*EEQQQTEDELQDK were also conducted on the singly charged molecular ion with MALDI and the doubly charged molecular ion with ESI. In MALDI experiments, the product-ion spectrum of the molecular ion at m/z (+) contains a dominant signature ion at m/z (+) (Figure 2.7-C). This ion resulted from the neutral loss of trimethylamine (59 Da) from the thiocholine side chain of the molecular ion with minimal sequence-informative b and y ions. The product-ion spectrum obtained with ESI of the doubly charged molecular ion showed a strong neutral loss peak from the 51
70 molecular ion at m/z (+2) (Figure 2.8). In MALDI, peptides are almost always singly charged [38]. With the low kinetic energy, singly charged thiocholine-containing peptides require higher collision energy to induce peptidic chain fragmentation relative to the neutral loss of trimethylamine. Therefore, the neutral loss is more prone to occur than the formation of b and y ions in low-energy CID, leading to a dominant neutral loss pattern. Similarly, in ESI, neutral loss represents a pathway that requires lower energy to induce fragmentation of the doubly charged parent ion. However, when the peptide is triply charged, with the higher vibrational energy derived from collisions at the increased kinetic energy gained during acceleration, peptide chain fragmentation becomes more favorable than the neutral loss of trimethylamine leading to the production of a sequence of informative b and y ions [39]. Although neutral loss of trimethylamine is no longer dominant in this case, it can still occur on thiocholine containing fragment ions, which together with the ions from neutral loss of thiocholine thiolate provides additional confirmatory sequence information and facilitates the assignment of phosphorylation sites. Moreover, as described above (Figure 2.7-B), neutral loss of trimethylamine becomes favorable again in MS 3, producing a signature neutral loss (SNL) peak during CID, which adds an additional dimension to the identification of peptide phosphosites. Although the majority of the tryptic peptides are doubly charged using ESI owing to basic amino acid residues on both N- and C- termini using conventional trypsinolysis, the modified phosphopeptides typically possess a charge state of 3 or higher due to the additional positive charge introduced by thiocholine. Through combining tryptic proteolysis with thiocholine modification, the majority of the thiocholine-modified 52
71 peptides will be triply charged or higher, thereby leading to a rich repertoire of diagnostic triads of peptidic fragment ions and ions from neutral loss of trimethylamine and the thiocholine thiolate for significant improvement in the identification of phosphorylation sites during ESI-MS 2 analyses. In addition, ions containing intact thiocholine side chains losing trimethylamine produce a signature neutral loss pattern in MS 3, greatly improving the confidence of the identification of phosphopeptides and the localization of the phosphorylated residue(s) in peptides containing more than one potential phosphosite or in the elucidation of phosphorylation patterns in cases where multiple sites are phosphorylated. Identification of Protein Kinase A Phosphorylation Sites in Calcium-independent Phospholipase A 2 β (ipla 2 β) ipla 2 β is an important phospholipase in cellular signaling that contributes to diverse cellular processes including arachidonic acid release, insulin secretion, calcium signaling, and apoptosis [33, 40-42]. We used the developed method to identify in vitro PKA phosphorylation sites of ipla 2 β to demonstrate the application of this method in a biologically relevant system. Prior to BEMA modification, the potential interference from free thiols must be eliminated [43]. Previously, perfomic acid oxidation was widely used to oxidize cysteine residues directly or convert cysteine disulfide bonds to cysteic acid residues [44-45]. However, although harsh oxidation may convert all cysteines to cysteic acid, it also leads to additional oxidation and an undesirable increase the chemical diversity and complexity of the sample [46-47]. Other potentially susceptible moieties 53
72 include alkylated cysteines, either endogenous or introduced by reductive alkylation, as well as O-glycosylated serines and threonines. These residues could cause ambiguities similar to an intact cysteine because they could also be converted to the same modified residues as ps/pt under alkaline conditions in the presence of strong nucleophiles [48-49]. However, using Ba 2+ as the catalyst coupled with well-controlled reaction conditions, β-elimination of alkylated cysteines or O-glycosylated serines and threonines occurs at rates two orders of magnitude more slowly than β-elimination from ps/pt whereas unphosphorylated serine and threonine residues are unaffected [35]. Under the conditions employed in this study, reductive alkylation does not interfere with BEMA targeting of phosphopeptides, and, thus, many side products and potential ambiguities are avoided. The identification of peptide C a N d VMGPS*GFPIHTAMK in ipla 2 β contains both alkylated cysteine and thiocholine-modified serine residues showing the compatibility of the routine reductive alkylation with Ba 2+ catalyzed BEMA (Figure 2.9). The fragmentation patterns and sequence coverage of the trypsin-generated phosphopeptides that were identified in the PKA phosphorylated ipla 2 β with and without thiocholine modification are demonstrated for the peptide SSGAAPTYFRPNGR ( ). The product-ion spectrum of the phosphopeptide p(ss)gaaptyfrpn d GR (Figure 2.10-B) exhibits a strong peak corresponding to the neutral loss of H 3 PO 4 from the doubly charged molecular ion with key peptidic chain cleavage products y 13 and b 1 at the Ser-Ser peptide bond missing from the spectrum precluding discrimination of phosphorylation at residues Ser582 or Ser583. In sharp contrast, the product-ion spectrum of SS*GAAPTYFRPN d +3 GR (Figure 2.10-A) shows an abundant diagnostic y 13 54
73 ion at m/z as well as its satellite neutral loss ions (shown in the expanded spectrum), which led to the unambiguous assignment of phosphorylation at residue Ser583. In low-energy CID, phosphopeptides are prone to lose a neutral phosphoric acid to form a five-member oxazole ring, which is a preferred fragmentation pathway for phosphopeptides [12]. The five-member ring prevents peptide bond cleavage at the site of phosphorylation and informative b and y ions resulting from that particular bond cleavage are missing, thus preventing conclusive identification of the phosphorylation site(s) in many cases. Therefore, although a phosphopeptide is easily identified through its neutral loss of 98 Da, the site of phosphorylation is often difficult to determine precisely by conventional means. In summary, replacing the phosphate with thiocholine prevents the cyclo-elimination of phosphoric acid in CID owing to the increased charge state of modified peptides thus improving sequence coverage and facilitating the unambiguous identification of the specific phosphorylated residue. As shown in Table 1, 32 different phosphorylation sites were identified in ipla 2 β phosphorylated samples examined using the customized protocols optimized for either ps or pt. These phosphorylation sites originated from a total of 16 unique sequences. Figure 2.11-A shows the product-ion spectrum of triply charged peptide EIS*VADYTSHER (26-37). The spectrum consists of b and y ions with diagnostic triads of all thiocholine containing peptidic fragment ions. Shown in the expanded spectrum are representative diagnostic triads from y and b 6 + fragmentation ions resulting from peptide bond cleavage (m/z = and 716.3) and further neutral loss of trimethylamine (-59 Da, m/z = and 657.2) and the thiocholine thiolate (-119 Da, m/z = and 597.2). The 55
74 characteristic neutral losses in MS 2 level are incorporated into MASCOT to contribute to the identification of the peptide and location of the phosphorylation site(s). A promising future prospect of this approach is the use of this chemical property in a weighted scoring system for ion identification that uses these unique and predictable diagnostic triads of fragmentation ions from thiocholine-modified peptides to facilitate identification of phosphorylated peptides and phosphosites in singly and multiply phosphorylated peptides. Among the ions generated in MS 2 fragmentation, the ten most abundant ions were chosen to be further fragmented at the MS 3 level. Examination of the y ion at m/z (amongst the top ten ions selected) demonstrated that it also possesses the intact thiocholine side chain, which led to its signature neutral loss pattern in its MS 3 spectrum (Figure 2.11-B). The ion peak at m/z corresponds to the neutral loss of trimethylamine from the precursor y at m/z From the example of the peptide EIS*VADYTSHER, it is clear that the thiocholine side chain enabled a unique tandem fragmentation pattern ideal for proteomic analyses, since sequencing of the peptide at the MS 2 level is not disrupted by the neutral losses of either trimethylamine or thiocholine thiolate but rather strengthened by the presence of diagnostic triads of fragment ions in conjunction with the signature neutral loss at MS 3 level. Collectively, these features serve to provide important structural information facilitating both the identification of the peptide as well as the location of the precursor ion to facilitate unambiguous identification of the phosphorylated residues. In the current study, nine out of 16 unique sequences demonstrated at least one ion with a signature neutral loss during MS 3 scanning underscoring the utility of the developed method. Although neutral-loss 56
75 information has been incorporated in MASCOT as part of the variable modification of thiocholine, MS 3 spectra with signature neutral loss patterns must be manually selected at the present time. Comparative Quantitation of Phosphoproteins using Natural Abundance Thiocholine and Thiocholine- 13 C,d 3 with Model Protein β-casein Comparative quantitation via BEMA with thiocholine and thiocholine- 13 C,d 3 was evaluated with the model phosphoprotein β-casein to determine the reproducibility and linearity of the developed method. As described in experimental procedures, two equal aliquots of trypsinized β-casein were modified with either thiocholine or thiocholine- 13 C,d 3. The light and heavy thiocholine containing peptides of β-casein were then mixed at different ratios (v:v) as follows;: five independent replicates at 1:1, three independent replicates at 1:2, 1:3, 1:4, 4:1, 3:1 and 2:1 respectively. The tryptic phosphopeptide FQpSEEQQQTEDELQDK was chosen to characterize the quantitation of the phosphorylation of β-casein. Thiocholine and thiocholine- 13 C,d 3 -modified peptides FQS*EEQQQTEDELQDK and FQS**EEQQQTEDELQDK were compared by their ion intensities at their prevailing charge state (+3) at the time of elution. The average adjusted experimental ratio of ion intensities for five replicates at 1:1 is 0.96 with a standard deviation of Thus, this method shows comparable reliability to similar experiments employing isotope-coded affinity tags [50]. The full-mass spectrum from the XIC of two modified peptides at the time of the elution is shown in Figure 2.12 with the well recognized (M + 4) isotopologue pattern. The experimental ratios of peak intensities were 57
76 obtained for samples mixed in selected ratios and plotted against theoretical values to yield a correlation coefficient of R 2 = Furthermore, there was no chromatographic shift between the light and heavy thiocholine-modified peptides (Figure 2.13). Overall, stable isotope ratiometric comparisons demonstrated the anticipated quantitative accuracy in both reproducibility and linearity using heavy and light thiocholine modification. 58
77 2.5 Conclusion and Perspective We have demonstrated a strategy for the facile, sensitive and precise detection, identification and quantitation of serine/threonine phosphorylation in proteins. By introducing thiocholine into the target peptides, a powerful mass spectrometric methodology is added that greatly increases the sensitivity of phosphosite identification, enriches the repertoire of observable fragmentation ions from the production of a higher charge state, and provides diagnostic triads of fragment ions through signature neutral loss patterns. The development of an affinity purification method for quaternary amines such as those previously demonstrated using calixirenes [52] may greatly facilitate the large scale integrated use of this strategy in cellular systems. 59
78 2.6 References (1) Manning, G.; Whyte, D. B.; Martinez, R.; Hunter, T.; Sudarsanam, S. Science 2002, 298, (2) Venter, J. C.; Adams, M. D.; Myers, E. W. Science 2001, 291, (3) Zolnierowicz, S.; Bollen, M. EMBO J. 2000, 19, (4) Krebs, E. G. Philos. Trans. R. Soc. Lond. B. Biol. Sci. 1983, 302, (5) Yan, J. X.; Packer, N. H.; Gooley, A. A.; Williams, K. L. J. Chromatogr., A 1998, 808, (6) Hunter, T. Cell 2000, 100, (7) Mann, M.; Ong, S. E.; Gronborg, M.; Steen, H.; Jensen, O. N.; Pandey, A. Trends Biotechnol. 2002, 20, (8) Steen, H.; Jebanathirajah, J. A.; Rush, J.; Morrice, N.; Kirschner, M. W. Mol. Cell. Proteomics 2006, 5, (9) Zhou, W.; Merrick, B. A.; Khaledi, M. G.; Tomer, K. B. J. Am. Soc. Mass Spectrom. 2000, 11, (10) Adamczyk, M.; Gebler, J. C.; Wu, J. Rapid Commun. Mass Spectrom. 2001, 15, (11) Li, W.; Boykins, R. A.; Backlund, P. S.; Wang, G.; Chen, H. C. Anal. Chem. 2002, 74, (12) Syka, J. E.; Coon, J. J.; Schroeder, M. J.; Shabanowitz, J.; Hunt, D. F. Proc. Natl. Acad. Sci. U. S. A. 2004, 101,
79 (13) Andersson, L.; Porath, J. Anal. Biochem. 1986, 154, (14) Posewitz, M. C.; Tempst, P. Anal. Chem. 1999, 71, (15) Ficarro, S. B.; McCleland, M. L.; Stukenberg, P. T.; Burke, D. J.; Ross, M. M.; Shabanowitz, J.; Hunt, D. F.; White, F. M. Nat. Biotechnol. 2002, 20, (16) Mazanek, M.; Mituloviae, G.; Herzog, F.; Stingl, C.; Hutchins, J. R.; Peters, J. M.; Mechtler, K. Nat. Protoc. 2007, 2, (17) Larsen, M. R.; Thingholm, T. E.; Jensen, O. N.; Roepstorff, P.; Jorgensen, T. J. Mol. Cell. Proteomics 2005, 4, (18) Zanivan, S.; Gnad, F.; Wickstrom, S. A.; Geiger, T.; Macek, B.; Cox, J.; Fassler, R.; Mann, M. J. Proteome Res. 2008, 7, (19) Kweon, H. K.; Hakansson, K. J. Proteome Res. 2008, 7, (20) Chi, A.; Huttenhower, C.; Geer, L. Y.; Coon, J. J.; Syka, J. E.; Bai, D. L.; Shabanowitz, J.; Burke, D. J.; Troyanskaya, O. G.; Hunt, D. F. Proc. Natl. Acad. Sci. U. S. A. 2007, 104, (21) Gunawardena, H. P.; Emory, J. F.; McLuckey, S. A. Anal. Chem. 2006, 78, (22) Rosenblum, K.; Dudai, Y.; Richter-Levin, G. Proc. Natl. Acad. Sci. U. S. A. 1996, 93, (23) Pandey, A.; Podtelejnikov, A. V.; Blagoev, B.; Bustelo, X. R.; Mann, M.; Lodish, H. F. Proc. Natl. Acad. Sci. U. S. A. 2000, 97, (24) Meyer, H. E.; Hoffmann-Posorske, E.; Korte, H.; Heilmeyer, L. M., Jr. FEBS Lett. 1986, 204,
80 (25) Oda, Y.; Nagasu, T.; Chait, B. T. Nat. Biotechnol. 2001, 19, (26) Zhou, H.; Watts, J. D.; Aebersold, R. Nat. Biotechnol. 2001, 19, (27) Brittain, S. M.; Ficarro, S. B.; Brock, A.; Peters, E. C. Nat. Biotechnol. 2005, 23, (28) Steen, H.; Mann, M. J. Am. Soc. Mass Spectrom. 2002, 13, (29) Knight, Z. A.; Schilling, B.; Row, R. H.; Kenski, D. M.; Gibson, B. W.; Shokat, K. M. Nat. Biotechnol. 2003, 21, (30) Li, H.; Sundararajan, N. J. Proteome Res. 2007, 6, (31) Moss, R. A.; Bizzigotti, G. O.; Huang, C. J. Am. Chem. Soc. 1980, 102, (32) Ouyang, T.; Walt, D. R. J. Org. Chem. 1991, 56, (33) Jenkins, C. M.; Yan, W.; Mancuso, D. J.; Gross, R. W. J. Biol. Chem. 2006, 281, (34) Thingholm, T. E.; Jorgensen, T. J.; Jensen, O. N.; Larsen, M. R. Nat. Protoc. 2006, 1, (35) Byford, M. F. Biochem. J. 1991, 280 ( Pt 1), (36) Li, W.; Backlund, P. S.; Boykins, R. A.; Wang, G.; Chen, H. C. Anal. Biochem. 2003, 323, (37) Soderling, T. R.; Walsh, K. J. Chromatogr. 1982, 253, (38) Zenobi, R.; Knochenmuss, R. Mass Spectrom. Rev. 1998, 17, (39) Hoffmann, E. d.; Stroobant, V. Mass Spectrometry: Principles and Applications, 2ed.; Wiley: Chichester, (40) Gross, R. W. J. Lipid Mediators Cell Signalling 1995, 12,
81 (41) Mancuso, D. J.; Abendschein, D. R.; Jenkins, C. M.; Han, X.; Saffitz, J. E.; Schuessler, R. B.; Gross, R. W. J. Biol. Chem. 2003, 278, (42) Atsumi, G.; Murakami, M.; Kojima, K.; Hadano, A.; Tajima, M.; Kudo, I. J. Biol. Chem. 2000, 275, (43) Bohak, Z. J. Biol. Chem. 1964, 239, (44) Sanger, F. Biochem. J. 1949, 44, (45) Toennies, G.; Homiller, R. P. Anal. Chem. 1942, 64, (46) Chowdhury, S. K.; Eshraghi, J.; Wolfe, H.; Forde, D.; Hlavac, A. G.; Johnston, D. Anal. Chem. 1995, 67, (47) Finley, E. L.; Dillon, J.; Crouch, R. K.; Schey, K. L. Protein Sci. 1998, 7, (48) Wells, L.; Vosseller, K.; Cole, R. N.; Cronshaw, J. M.; Matunis, M. J.; Hart, G. W. Mol. Cell. Proteomics 2002, 1, (49) Vosseller, K.; Hansen, K. C.; Chalkley, R. J.; Trinidad, J. C.; Wells, L.; Hart, G. W.; Burlingame, A. L. Proteomics 2005, 5, (50) Gygi, S. P.; Rist, B.; Gerber, S. A.; Turecek, F.; Gelb, M. H.; Aebersold, R. Nat. Biotechnol. 1999, 17, (51) Whitesides, G. M.; Lilburn, J. E.; Szajewski, R. P. J. Org. Chem. 1977, 42, (52) Biros, S. M.; Ullrich, E. C.; Hof, F.; Trembleau, L.; Rebek, J., Jr. J Am Chem Soc 2004, 126,
82 2.7 Table Legends Table 2.1 Identification of phosphorylation sites in ipla 2 β phosphorylated by protein kinase A (PKA). Tryptic ipla 2 β peptides were modified by two different protocols optimized for either phosphoserine or phosphothreonine as described in the Materials and Methods section. The thiocholine-modified peptides were desalted, separated using reverse-phase nanobore HPLC and analyzed with an LTQ-Orbitrap system. Candidate peptides were identified using MASCOT with the designated thiocholine modification as well as common amino acid modifications as described in the Materials and Methods section. 16 unique sequences and 32 different phosphorylation sites were identified. * denotes phosphorylation sites; ( * ) denotes that more than one phosphorylation site was identified in the same peptide. Those that were not concurrent are indicated by / whereas + indicates peptides that possessed multiple concurrent phosphorylation sites. Superscripts ace, ac, d and o denote the following modifications: acetylation (N-terminus), acetylation (K), deamidation (NQ) and oxidation (M), respectively. All cysteine residues were carbamidomethylated. Identified peptides with missed cleavages are listed together with the completely trypsinized peptides as indicated by bold bordered boxes. Peptides which yielded a signature neutral loss pattern in MS 3 are highlighted in bold. 64
83 Table 2.1 Sequence# Sequence Phosphorylation Site(s) Δm (ppm) Ion Score 1-23 MQFFGRLVN d TLSSVTN d LFS*N d PFR S13/S VKEIS*VADYTS ( * ) HER S28/S VKEIS*VADYTS*HER S28+S EIS*VADYTS ( * ) HER S28/S EIS*VADYTS*HER S28+S VREEGQLILFQNAS*NR S NAS*AGLNQVN d KQGLTPLHLACQMGK S CN d VMGPS*GFPIHT ( * ) AMK S252/T ace GCAEM o IISMDS*S*QIHS*K ac S276+S277+S ace RGCDVDST*S*AAGN d T*ALHVAVM o R T313+S314+T GCDVDSTSAAGNT*ALHVAVM o R T ace ISK ac Q d LQ d DLMPIS*R S QLQ d DLMPIS*R S ARKPAFILS*S ( * ) MR S414/S ARKPAFILS*S ( * ) MRDEK S414/S KPAFILS*S ( * ) MR S414/S KPAFILS*S ( * ) MRDEK S414/S S*MAYMRGVYFR S DEVFRGS*RPYESGPLEEFLK ac S GS*RPYES*GPLEEFLK S498+S GS*RPYES ( * ) GPLEEFLK S498/S EFGEHT*KM o T ( * ) DVK T518/T ace MT ( * ) DVK ac KPK T VMLT*GTLS ( * ) DR T531/S VM o LT*GTLS*DR T531+T SS*GAAPT ( * ) YFRPN d GR S583/T ace K ac LS*IVVS ( * ) LGT ( * ) GR S634/S638/T SPQVPVTCVDVFRPS*NPWELAK S ace ARAWS*EM o VGIQ d YFR S AWS*EMVGIQYFR S
84 2.8 Figure Legends Figure 2.1 Optimization of β-elimination and Michael addition (BEMA) reaction conditions for phosphorylated serine containing peptides using the model peptide FQpSEEQQQTEDELQDK. The model peptide FQpSEEQQQTEDELQDK was modified using BEMA with thiocholine as described in the Materials and Methods section. The β-elimination and Michael addition reactions were terminated at the indicated time intervals. The resultant reaction mixtures were separated on an HPLC reverse-phase column (C 18, 150 x 4.6mm) and the peptides were detected with a UV monitor at λ = 206 nm. The β-elimination reaction was complete within 40 mins and Michael addition was complete in approximately 60 min. Figure 2.2 Comparison of the ionization efficiency of the phosphopeptide FQpSEEQQQTEDELQDK ) ( and its thiocholine-modified derivative FQS*EEQQQTEDELQDK ( ). The model peptide FQpSEEQQQTEDELQDK was modified via BEMA with thiocholine as described in the Materials and Methods section and an equivalent amount of the original unmodified phosphopeptide FQpSEEQQQTEDELQDK was added. The quantitative yields of the BEMA reactions were similar to those shown in Figure 1. ps indicates the phosphorylation site and S* indicates the thiocholine-modified site. A. Separation of the peptide mixture using a reverse-phase C 18 column and analysis 66
85 employing an ESI-LTQ-Orbitrap as described in the Materials and Methods section. The full-mass scan extracted ion chromatography (XIC) of ions at m/z (+3) and (+2) with normalized ion intensities is presented. The ion at m/z corresponds to the triply charged molecular ion (dominant charge state) of FQS*EEQQQTEDELQDK ( ) and the ion at m/z corresponds to the doubly charged molecular ion (dominant charge state) of FQpSEEQQQTEDELQDK ( ). The XIC shows a marked increase in ionization efficiency of the peptide after thiocholine modification. B. The full mass spectrum of the 1:1 peptide mixture obtained with a 4800 MALDI-TOF/TOF Analyzer with normalized ion intensity. The ion peak at m/z corresponds to the singly charged molecular ion of FQpSEEQQQTEDELQDK ( ) and the ion peak at m/z corresponds to the singly charged molecular ion of FQS*EEQQQTEDELQDK ( ). A 3-fold increase in ionization efficiency of the peptide after thiocholine modification was observed with MALDI-MS. Figure 2.3 Detection limit for the thiocholine-modified peptide FQS*EEQQQTEDELQDK. Extracted ion chromatogram (XIC) and product-ion spectra were acquired with an LTQ-Orbitrap as described in the Materials and Methods section. A. Extracted ion chromatogram of the thiocholine-modified model peptide FQS*EEQQQTEDELQDK at m/z (+3) at the concentration of 500 amol/ul (Ion counts = 2.01E3). 67
86 B. The full mass spectrum of the thiocholine-modified model peptide FQS*EEQQQTEDELQDK at m/z (+3) at the concentration of 500 amol/ul (Ion counts = 2.01E3, Signal-to-Noise = 4). Figure 2.4 Optimization of β-elimination and Michael addition reaction conditions for the phosphorylated threonine containing peptide: DHTGFLpTEYVATR (i). The β-elimination of DHTGFLpTEYVATR was terminated at the indicated time intervals. The resultant reaction mixtures were separated on an HPLC reverse-phase column (C18, 150x4.6mm) and the peptides were detected with a UV monitor at λ = 206 nm. Figure 2.5 Optimization of β-elimination and Michael addition reaction conditions for the phosphorylated threonine containing peptide: DHTGFLpTEYVATR (ii). The phosphothreonine containing peptide, DHTGFLpTEYVATR, was subject to 3h Ba(OH) 2 catalyzed β-elimination followed by overnight room-temperature incubation with thiocholine to effect Michael addition. The full mass spectrum of the resulting thiocholine addition product was acquired on a 4800 MALDI-TOF/TOF analyzer. The spectrum was remarkable for the predominance of the undesired oxidation of the histidine residue (denoted H o ) and N-terminal acetylation (denoted ace D) (m/z ). Only minimal amounts of the desired Michael adduct (m/z ) was observed under these conditions. 68
87 Figure 2.6 Optimization of β-elimination and Michael addition reaction conditions for the phosphorylated threonine containing peptide: DHTGFLpTEYVATR (iii). The β-elimination and Michael addition of thiocholine to DHTGFLpTEYVATR were carried out under nitrogen and the intermediate products of β-elimination were purified with a POROS R2 micro-column as described in the Materials and Methods section before undergoing Michael addition at ph = 8-9. Extracted ion chromatogram (XIC) and product-ion spectra were acquired with an LTQ-Orbitrap as described in the Materials and Methods section. A. Extracted ion chromatogram of the thiocholine-modified peptide DHTGFLT*EYVATR and its β-elimination product DHTGFLT de EYVATR after 5h of incubation with thiocholine at room temperature demonstrated minimal thiocholine addition. B. Extracted ion chromatogram of the thiocholine-modified peptide DHTGFLT*EYVATR and its β-elimination product DHTGFLT de EYVATR after 5h of incubation with thiocholine at 50 C showing a significantly improved yield. C./ D. The product-ion spectra of DHTGFLT*EYVATR of the two XIC peaks from Figure S3-B at RT = min and min. No substantial differences between the spectra were observed. The difference in retention times implies the formation of diastereomers during the Michael addition reaction. E. The product-ion spectrum of the β-elimination product DHTGFLT de EYVATR. 69
88 Figure 2.7 Fragmentation of the thiocholine-modified peptide FQS*EEQQQTEDELQDK. A. The product-ion spectrum of the triply charged molecular ion of FQS*EEQQQTEDELQDK at m/z was obtained with an ESI-LTQ-Orbitrap as described in the Materials and Methods section. The fragment ion resulting from the neutral loss of trimethylamine from the parent ion was not detected. Shown in the expanded spectrum is an example of the diagnostic triad consisting of the b 5 + ion resulting from peptide bond cleavage (m/z = 722.3) and further neutral losses of trimethylamine (-59 Da, m/z = 663.2) or the thiocholine thiolate (-119 Da, m/z = 603.2). S* indicates the thiocholine-modified site. B. The MS 3 spectrum of the y ion at m/z resulting from the fragmentation of the triply charged molecular ion of FQS*EEQQQTEDELQDK at m/z The ion peak at m/z corresponds to the doubly charged fragment ion generated from the neutral loss of trimethylamine from the parent ion y C. The product-ion spectrum of the singly charged molecular ion of FQS*EEQQQTEDELQDK at m/z , obtained with a 4800 MALDI-TOF/TOF Analyzer as described in the Materials and Methods section. The ion peak at m/z corresponds to the fragment ion resulting from the neutral loss of trimethylamine from the parent ion. Shown in the expanded spectrum are the low-abundance y ions. 70
89 Figure 2.8 The product-ion spectrum of the doubly charged molecular ion for the thiocholine-modified model peptide FQS*EEQQQTEDELQDK at m/z , acquired with an LTQ-Orbitrap as described in the Materials and Methods section. The ion peak at m/z corresponds to the fragment ion generated from the neutral loss of trimethylamine from the parent ion. Figure 2.9 The product-ion spectrum of the thiocholine-modified peptide C a N d VMGPS*GFPIHTAMK at m/z , acquired with an LTQ-Orbitrap as described in the Materials and Methods section. The identification of the PKA mediated phosphorylation of ipla 2 β at Ser252 following reductive alkylation and thiocholine modification demonstrates that the peptide contains both an alkylated cysteine and a thiocholine-modified serine, showing the compatibility of routine reductive alkylation with Ba 2+ catalyzed BEMA. Figure 2.10 Sequence coverage comparison between the thiocholine-modified peptide SS*GAAPTYFRPN d GR and the phosphopeptide p(ss)gaaptyfrpn d GR identified in protein kinase A (PKA) phosphorylated calcium-independent phospholipase A 2 β (ipla 2 β). A. Identification of PKA mediated phosphorylation of ipla 2 β at Ser583 via thiocholine modification. SS*GAAPTYFRPN d GR was identified after in vitro PKA catalyzed phosphorylation of ipla 2 β with subsequent thiocholine modification as described in the Materials and Methods section. Spectra were acquired using an LTQ-Orbitrap equipped 71
90 with an electrospray ion source. The product-ion spectrum of the triply charged molecular ion (dominant charge state) at m/z shows a dominant y peak leading to unambiguous assignment of the phosphosites. Also shown in the expanded spectrum (relative intensity zoom = 25%) are the diagnostic triad consisting of y (m/z = 499.4), the ion from the neutral loss of trimethylamine, y (m/z = 479.1), and the ion from neutral loss of the thiocholine thiolate, y (m/z = 459.3), as well as the peak corresponding to the loss of the thiocholine thiolate from the molecular ion M (m/z = 488.9). B. Identification of PKA mediated phosphorylation of ipla 2 β at Ser582/Ser583 without thiocholine modification. p(ss)gaaptyfrpn d GR was identified in PKA phosphorylated ipla 2 β without thiocholine modification by ESI-LTQ-Orbitrap. The product-ion spectrum of the doubly charged molecular ion (dominant charge state) at m/z shows a strong ion peak at m/z which corresponds to the neutral loss of H 3 PO 4 from the parent ion. The fragment ions from Ser-Ser peptide bond cleavage are missing due to the cyclo-elimination of H 3 PO 4. The specific site of phosphorylation could not be assigned from this approach. p(ss) indicates either serine residue may be phosphorylated, S* indicates the thiocholine-modified site and N d indicates the deamidation of the asparagine residue. Figure 2.11 Fragmentation of the thiocholine-modified peptide EIS*VADYTSHER identified in PKA phosphorylated ipla 2 β at both the MS 2 and MS 3 levels. A. The product-ion spectrum of the triply charged molecular ion at m/z
91 (EIS*VADYTSHER) was obtained with an ESI-LTQ-Orbitrap as described in the Materials and Methods section. The fragment ion resulting from the neutral loss of trimethylamine from the parent ion was not detected. Shown in the expanded spectrum are examples of the diagnostic triad consisting of the y and b 6 fragmentation ions resulting from peptide bond cleavage (m/z = and 716.3) and further neutral loss of trimethylamine (-59 Da, m/z = and 657.2) or the thiocholine thiolate (-119 Da, m/z = and 597.2). S* indicates the thiocholine-modified site. B. MS 3 spectrum of the y ion at m/z resulting from the fragmentation of the triply charged molecular ion at m/z (EIS*VADYTSHER) obtained with an ESI-LTQ-Orbitrap as described in the Materials and Methods section. The ion peak at m/z corresponds to the doubly charged fragment ion generated from the neutral loss of trimethylamine from the parent ion y Figure 2.12 Comparative quantification of phosphoproteins evaluated using β-casein as a model protein. Equal amounts of trypsinized β-casein were modified with either light ( 12 C, 1 H) or heavy ( 13 C,d 3 ) thiocholine and mixed at a 1:1 ratio (v/v). The mixture was separated on a reverse-phase C 18 column and analyzed by an ESI-LTQ-Orbitrap as described in the Materials and Methods section. The full mass spectrum of the modified peptides is shown at the time of their co-elution. A doublet pattern of the peptides modified by light and heavy thiocholine is evident. The ion intensity ratio of light vs. heavy thiocholine-modified peptides obtained from full-mass spectra was 0.96±0.02 (average 73
92 adjusted ratio of five replicates with an expected ion intensity ratio of 1). S* indicates the 12 C, 1 H-thiocholine-modified site; S** indicates the 13 C,d 3 thiocholine-modified site. Figure 2.13 Comparison of the retention time of the thiocholine(*) and thiocholine-13c,d3(**)-modified peptides FQS*EEQQQTEDELQDK and FQS**EEQQQTEDELQDK from the model protein β-casein. Two equal aliquots (1 and 2) of trypsinized β-casein were modified with thiocholine and thiocholine-13c,d3 respectively as described in the Materials and Methods section. Modified peptides of β-casein in aliquots 1 and 2 were then mixed at 1:1 (v:v; aliquot 1: aliquot 2, or light: heavy). The mixture was analyzed with a reverse phase HPLC-ESI-Orbitrap system as described in the Materials and Methods section. Shown are the extracted ion chromatograms of the thiocholine and thiocholine-13c,d3-modified peptides: FQS*EEQQQTEDELQDK (m/z ; dashed line --- ) and FQS**EEQQQTEDELQDK (m/z ; solid line ). No chromatographic shift was observed between light and heavy thiocholine-modified peptides. The light versus heavy ratios (from data points A, B and C) are consistent at 0.96±0.02 with an expected ratio of 1 during the elution of the peak. 74
93 Figure
94 Figure
95 Figure
96 Figure
97 Figure
98 Figure
99 81
100 82
101 Figure
102 84
103 Figure
104 Figure
105 Figure
106 88
107 Figure
108 90
109 Figure 2.12 Figure
110 CHAPTER 3 Identification of Endogenous Phosphorylation Sites of ipla 2 β from Sf-9 Cells with and Without Thiocholine Modification 3.1 Abstract In the previous chapter, the chemical replacement of the phosphate on phosphoserine and phosphothreonine residues via β-elimination and Michael addition with thiocholine was identified as an effective strategy for the characterization of phosphosites on model phosphoproteins. The increased ionization efficiency, improved sensitivity and the generation of characteristic diagnostic triads of fragmentation ions from signature neutral losses in tandem mass spectrometric analysis of thiocholine derivatives markedly improved peptide identification. To demonstrate further the utility of these procedures in living cells, BEMA with thiocholine was applied to identify the endogenous phosphorylation sites of calcium-independent phospholipase A 2 β (ipla 2 β) heterologously expressed in Spodoptera frugiperda (Sf-9) cells. In parallel, traditional direct analysis of phosphopeptides with data-dependent acquisition MS 2 and neutral loss 92
111 of phosphoric acid triggered MS 3 was also performed to analyze ipla 2 β phosphorylation. The two methods were compared and evaluated to show that a total of 12 unique phosphopeptides and 19 phosphorylation sites were identified using the thiocholine BEMA strategy, whereas only five peptides and six phosphorylation sites on ipla 2 β were found with the traditional direct analysis. The larger number of phosphopeptides identified with the BEMA method with thiocholine resulted in improved sequence coverage compared to the traditional method. Finally, molecular modeling of ipla 2 β was performed with the I-TASSER server to reveal the close spatial proximity of the phosphorylated residues to the catalytic site of the enzyme, suggesting the presence of phosphorylation mediated regulation of ipla 2 β. 93
112 3.2 Introduction Reversible phosphorylation on serine and threonine residues is regarded as one of the most important molecular switches for the regulation of cellular signal transduction pathways [1-3]. However, the intrinsic chemical properties of phosphorylated serine and threonine-containing peptides hinder the detection and identification of phosphopeptides as well as the exact localization of phosphorylated residues in mass spectrometric analyses owing to poor ionization efficiency and subsequent low detection threshold. Furthermore, the facile neutral loss of phosphoric acid through cyclo-elimination during low-energy, collision-induced dissociation (CID) also contributes to the loss of phosphoprotein sequence coverage [4-6]. As reported in Chapter 2, a novel strategy was developed to overcome these hurdles for the sensitive detection and improved identification of ps/pt containing peptides [7]. Briefly, thiocholine is introduced into the peptide at the phosphorylation site via high-yield Ba 2+ catalyzed β-elimination of phosphate and subsequent Michael addition (Scheme 1.1). Sample complexity is reduced through reductive alkylation of cysteines and development of optimized BEMA conditions for either ps or pt individually. This charge-switch strategy results in much improved ionization efficiencies during ESI with detection limits in the sub 500 amol/μl range. The sequence coverage of the modified peptides is also increased owing to the higher charge states of thiocholine-labeled tryptic peptides enabled by the endogenous positive charge on the 94
113 quaternary amine. Phosphopeptide identification has been substantially improved by exploiting the facile neutral loss of trimethylamine (m = 59 Da) and the thiocholine thiolate (m = 119 Da) from the thiocholine adduct (Scheme 1.2) during MS 2 and MS 3 analyses. To demonstrate further the utility of these procedures in the detection of proteins phosphorylated in vivo, BEMA with thiocholine was applied to identify the endogenous phosphorylation sites of the calcium-independent phospholipase A 2 β (ipla 2 β) heterologously expressed in Sf-9 cells. In parallel, traditional direct analysis of phosphopeptides with data-dependent product-ion scan and neutral loss of phosphoric acid triggered MS 3 was also used for comparison with the current method. A total of 12 unique phosphopeptides and 19 phosphorylation sites were identified with the BEMA strategy compared to five peptides and six phosphorylation sites with the traditional method. The phosphopeptides identified with BEMA also showed better sequence coverage and higher ion scores than the traditional method. A 3-dimensional (3-D) model of ipla 2 β was also derived with the I-TASSER server [8-10]. All the phosphorylation sites identified either with BEMA with thiocholine or the traditional direct analysis were placed in the 3-D model to reveal the potential influence of these phosphorylated residues on the catalytic activity of the enzyme. 95
114 3.3 Materials and Methods Materials POROS 20 R2 resin was purchased from ABI (Foster City, CA); Slide-A-Lyzer MINI Dialysis Units, 7K MWCO were purchased from Pierce (Rockford, IL); Rapigest was purchased from Waters (Milford, MA); trypsin was purchased from Promega (Madison, WI); Solvents for mass spectrometric analyses were obtained from Honeywell Burdick&Jackson (Muskegon, MI). Other chemicals were obtained from Sigma-Aldrich (St. Louis, MO). Synthesis of Thiocholine Chloride Thiocholine chloride was prepared and the free thiol concentration of thiocholine chloride was determined as previously described in Chapter 2. Purification of Calcium-independent Phospholipase A 2 β from Sf-9 Cells Hexahistidine tagged calcium-independent phospholipase A 2 β (ipla 2 β) was expressed in Sf9 cells and purified as previously described by Jenkins et al. [11]. Sf9 cells grown to a density of 1 x 10 6 cells/ml were infected with a baculovirus encoding recombinant ipla 2 β with a C-terminal 6x His tag at an MOI of ~2 viral particles/cell. The cells were incubated with constant agitation at 27 o C for 48 h. Next, cells suspended in the presence of Trypan blue were inspected for evidence of infection (cell swelling, limited cell death). 96
115 Infected cells were then centrifuged at 900 RPM for 10 min. The media was discarded and the cells were resuspended in an equal volume Graces s Insect Media without serum. Cells were centrifuged again 900 RPM for 10 min and resuspended in 10% of the original media volume of 25 mm potassium phosphate (ph 7.8) with 2 mm 2-mercaptoethanol, and 20% glycerol with 5 µg/ml each of aprotinin and leupeptin. Cells were sonicated at 30% max power for 30 x 1 s bursts and centrifuged at 100,000 g for 1 h. The supernatant was then applied to Co 2+ metal affinity resin at 1mL resin per 200 ml original culture volume pre-equilibrated with 25 mm potassium phosphate (ph 7.8) with 2 mm 2-mercaptoethanol, and 20% glycerol. The column was washed with 25 mm potassium phosphate (ph 7.8) containing 2 mm 2-mercaptoethanol, 20% glycerol, and 5000 mm NaCl. A continuous gradient of mm imidazole over 20 column volumes was employed to elute the bound ipla 2 β(his) 6. The fractions collected were tested for phospholipase activity. Active fractions were pooled and applied to a 1 ml ATP agarose pre-equilibrated with 20 mm imidazole (ph 7.6), 2mM 2-mercaptoethanol and 20% glycerol. The column was next washed with 20 mm imidazole (ph 7.6) 2 mm 2-mercaptoethanol, and 20% glycerol with 150mM NaCl and 1 mm AMP. Bound ipla 2 β(his) 6 was eluted with 20 mm imidazole (ph 7.6), 2 mm 2-mercaptoethanol and 20% glycerol with 150 mm NaCl, 5 mm ATP, in 1 ml fractions. All fractions were tested for the phospholipase activity and the most active fractions were pooled together. The protein concentration was determined using a Bradford assay [13]. 97
116 Tryptic Proteolysis of Calcium-independent Phospholipase A 2 β Prepared from Sf-9 Cells The calcium-independent phospholipase A 2 β (ipla 2 β) prepared from Sf-9 cells was dialyzed against deionized water for 8 h using a Slide-A-Lyzer MINI Dialysis Unit, dried in a SpeedVac apparatus (Savant, Holbrook, NY), and dissolved in 50 μl of 0.2% Rapigest in 50 mm NH 4 HCO 3. Next, 2.5 μl of 100 mm dithiothreitol (DTT) was added to a final concentration of 5 mm. The sample was incubated at 60 C for 30 min before 6 μl of 150 mm iodoacetamide was added to quench the reduction reaction and initiate alkylation. The sample was incubated for an additional 30 min in the dark at room temperature. Trypsin was added to the solution at a protease to protein ratio of 1:30 (w/w). The total volume of the sample solution was adjusted to 100 μl with 50 mm NH 4 HCO 3. A total of 500 fmol/μl protein sample was incubated at 37 C for 2 h and then acidified with 10 μl of 10% TFA to lower the ph to < 2. The sample was again incubated at 37 C for 30 min and centrifuged at rpm to pellet the hydrolyzed Rapigest. Half of the resultant supernatant was used for thiocholine modification while the rest of the sample was subjected to MS analyses without modification. BEMA of Trypsinized Calcium-independent Phospholipase A 2 β with Thiocholine Half of the trypsinized ipla 2 β sample was dried in a SpeedVac apparatus and reconstituted in 50 μl deionized water followed by the addition of 38 μl DMSO and 12 μl of absolute ethanol. The trypsinized protein solution was then divided into 2 equal 98
117 aliquots of 50 μl. The first aliquot was modified with a protocol optimized for ps containing peptides and the second aliquot was modified with a protocol optimized for pt containing peptides as follows: Aliquot 1 was mixed with 25 μl of freshly prepared saturated Ba(OH) 2. The reaction was incubated at room temperature under nitrogen for 1 h with gentle vortexing every 20 min. The final ph was 12~13. Next, 50 μl of 1 M thiocholine solution freshly prepared in water was directly added to the reaction. The reaction mixture was incubated at room temperature under nitrogen for 3 h at ph 8~9 and then terminated by the addition of 5 μl of 10% TFA and the resultant solution was desalted with a POROS 20 R2 microcolumn and dried. Aliquot 2 was mixed with 25 μl of freshly prepared saturated Ba(OH) 2. The reaction was incubated at room temperature under nitrogen for 3 h with gentle vortexing every 20 min. The final ph was 12~13. Next, the β-elimination reaction was terminated by addition of 10 μl of 10% TFA and the resultant solution was desalted with a POROS 20 R2 micro column [12]. Briefly, a POROS 20 R2 micro column was assembled by stamping out a small plug of C8 material from a 3 M Empore C8 extraction disk using a HPLC syringe needle and placing this plug in the constricted end of a GELoader tip. Next, POROS R2 beads that were suspended 50% acetonitrile at 5mg/200 µl were packed in the GELoader tip by pressing air through the micro column using an Eppendorf syringe. The length of the packed POROS R2 resin was about 3~6 mm. Then the column was washed with 30 µl 50% acetonitrile and equilibrated with 30 µl 0.1% trifluoroacetic acid. The sample solution was then loaded onto the POROS R2 micro column. The sample was slowly passed 99
118 through the micro column by pressing air through using a Eppendorf syringe. The column was washed twice with 30 µl 0.1% trifluoroacetic acid and the bounded peptides were eluted first using 30 µl 70% acetonitrile with 0.05 % trifluoroacetic acid, then 5 µl 30% acetonitrile with 0.05% trifluoroacetic acid. The purified peptide solution was dried and reconstituted in 50 μl of 0.5 M thiocholine solution freshly prepared in 0.1 M NaOH. The mixture was incubated at 50 C under nitrogen for 5 h at ph 8~9. The reaction was terminated by the addition of 5 μl 10% TFA and the resultant solution was again desalted with a POROS 20 R2 microcolumn and dried. HPLC-ESI-MS 2 /MS 3 Mass Spectrometric Analyses The desalted and dried peptide samples were reconstituted in 0.1% formic acid before injection and separation using a Surveyor HPLC system (Autosampler and pump, ThermoFisher, San Jose, CA) equipped with a reverse-phase C18 PepMap100 Nano-LC column (75 μm I.D. 15 cm, 3 μm, 100 Å; Dionex, Sunnyvale, CA). The flow rate was maintained at nl/min. Samples elut ing from the column were directed to the nanospray apparatus (i.e., NanoMate HD with LC coupler, Advion Bioscience Ltd., Ithaca, NY) and sprayed directly into a linear ion trap in tandem with an Orbitrap (LTQ-Orbitrap) mass spectrometer (ThermoFisher, San Jose, CA) at a spray voltage of 1.7 kv in the positive ion mode. ipla 2 β samples, modified by the two optimized protocols, were analyzed first in survey runs, which consisted of a 90 min gradient from 100% A to 50% A, 50% B (Buffer A: 90% water, 10% acetonitrile, 0.1% formic acid; 100
119 Buffer B: 10% water, 90% acetonitrile, 0.1% formic acid, v:v)) and data-dependent MS 2 analyses: full mass scans in the Orbitrap ( m/z, mass resolution = 30000) were followed by product-ion scans in the LTQ for the five most abundant ions. The ions of interest from the survey runs were then included in the parent mass list of the target runs. The target runs consisted of a 180 min gradient from 100% A to 75% A, 25% B (120 min), then to 50% A, 50% B (60 min) and data-dependent MS 2 /MS 3 analyses: full mass scans in the Orbitrap ( m/z, mass resolution = 30000) were followed by product-ion scans in the LTQ of the three most abundant ions from the parent mass list and the MS 3 scans in the LTQ of the 10 most intense fragment ions following each of the three product-ion scans. A control unmodified trypsinized ipla 2 β sample was analyzed using the same survey run method as the thiocholine-modified samples. The target run for the unmodified sample consisted of an inclusion list generated from the survey run, a 180 min gradient (100% A to 75% A, 25% B (120 min), then to 50% A, 50% B (60 min)), and data-dependent MS 2 /MS 3 analyses which consisted of an initial full mass scans in the Orbitrap ( m/z, mass resolution = 30000) followed by product-ion scans of the five most abundant ions from the parent mass list with neutral loss of H 3 PO 4 triggered MS 3 scans in the LTQ. The normalized collision energy for CID was set at 25 for all data-dependent scans. Data Processing The local MASCOT server was used to conduct all database searches. A single-protein 101
120 (ipla 2 β) database was created by in silico trypsinolysis. Thiocholine with neutral losses of trimethylamine and thiolate were integrated into MASCOT for customized processing of the designed covalent modifications for serine and threonine residues. Carbamidomethylation of cysteine(c) residues was set as a fixed modification for the trypsinized ipla 2 β samples. Common variable modifications included N-terminal and lysine acetylation (N-terminus, K), asparagine and glutamine deamidation (N,Q) and methionine oxidation (M). A maximum of two missed cleavages were allowed. Full mass and product-ion mass accuracy were set at 5 ppm and 1 Da, respectively. All identifications by MASCOT were manually verified. All MS 3 scans were analyzed manually. The 3-D model of ipla 2 β was generated by a web based program on the I-TASSER server developed by Y. Zhang at the University of Michigan [8-10]. The results are presented in the format of a PDB file visualized using ViewerLite freeware and the distances between the amino acid residues were measured using the Monitor--Distance feature included in the software. 102
121 3.4 Results and Discussion Calcium-independent phospholipase A 2 β (ipla 2 β) belongs to the superfamily of phospholipases A 2 [14]. Phospholipases A 2 catalyze the hydrolysis of phospholipids at the sn-2 position to release fatty acids [15-16], such as arachidonic acids and lysophospholipids, which are the precursors of multiple bioactive messengers [17-18]. According to their different properties, such as sequence homology, substrate selectivity, subcellular location and dependence on calcium ion, phospholipases A 2 can be grouped into three categories: secretory phospholipases A 2 (spla 2 s), cytosolic phospholipases A 2 (cpla 2 s) and calcium-independent phospholipases A 2 (ipla 2 s) [19-20]. Cytosolic phospholipases A 2 are important intracellular phospholipases whose members contain (with the exception of cpla 2 γ) a calcium-binding domain (C2), which upon binding Ca 2+ results in their translocation from cytosol to intercellular membrane compartments to hydrolyze their phospholipid substrates at the sn-2 position and release fatty acids [21]. The phosphorylation and Ca 2+ mediated regulation of cpla 2 α was extensively studied [22-24]. The endogenous phosphorylation sites of cpla 2 α heterologously expressed in Sf-9 cells were previously identified as ser-437, ser-454, ser-505 and ser-727 by mass spectrometry and automated Edman sequencing [25]. Treatment of cpla 2 α with the phosphatase inhibitor okadaic acid resulted in a 4.5 fold increase in the phosphorylation at serine 727 and an increased release of arachidonic acid. These results, in conjunction with previous studies demonstrated that 103
122 phosphorylation/dephosphorylation of cpla 2 α is an important molecular mechanism underlying the regulation of arachidonic acid release [25]. Similarly, ipla 2 β is likely regulated by phosphorylation/dephosphorylation mechanism, although current methods have failed to identify specific residues whose phosphorylation correlate with alterations in catalytic activity. Thus, it is of particular importance to gain insight into the phosphorylation state of ipla 2 β in vivo to provide a molecular foundation for further investigation of the role of phosphorylation/dephosphorylation of ipla 2 β in diverse processes of substantial biologic significance such as cardiac function, arachidonic acid release, cell proliferation and apoptosis [26-29]. A primary purpose of this study is to compare the utility of the developed BEMA strategy with a traditional direct analysis method in a system where the protein phosphorylation level is not artificially elevated. Hexahistidine-tagged calcium-independent phospholipase A 2 β (ipla 2 β) was expressed in Sf9 cells and purified as previously described by Jenkins et al. [11]. Purified ipla 2 β was modified with thiocholine by using two separate protocols optimized for either ps or pt-containing phosphopeptides. Modified and unmodified peptides were analyzed with HPLC-ESI-MS 2 /MS 3 as described in the Materials and Methods section. As shown in Table 3.1, six different endogenous phosphorylated sites, originating from five unique phosphopeptides, were identified in ipla 2 β without thiocholine modification using the traditional MS analysis strategy as described in the Materials and Methods. No neutral loss of phosphoric acid triggered MS 3 were obtained for any of the identified peptides. 104
123 Conversely, as shown in Table 3.2, with the β-elimination and Michael addition strategy, a total of 19 different phosphorylated residues were identified. These phosphorylation sites originated from 14 phosphopeptides. Identified peptides with missed tryptic cleavages are listed together with the completely trypsinized peptides indicated by bold-bordered boxes. The peptides contained within the bold-bordered boxes are considered as one unique sequence. Thus, there are 12 unique phosphopeptides found by the BEMA method. The phosphorylation sites listed in the table separated with a / indicate that the monophosphopeptide has more than one non-concurrent phosphorylation site. The product-ion spectra of all the peptides identified were verified manually, all of which contained signature peaks generated by the neutral loss of trimethylamine and/or thiocholine thiolate. As indicated in bold font in Table 3.1, 11 phosphopeptides from nine unique sequences showed at least one dominant peak resulting from the neutral loss of trimethylamine (-59 Da) at the level of MS 3 analyses out of 14 phosphopeptides and 12 unique sequences. The sequence coverage of the identified peptides was calculated using all b and y ions present in the product-ion spectra over the number of all possible b and y ions. The phosphopeptides identified with the BEMA strategy showed better sequence coverage than those identified with the traditional method. Eleven out of 14 phosphopeptides modified with thiocholine had sequence coverage greater than 50%; whereas three out of five phosphopeptides without any modification identified with traditional mass spectrometric methods showed sequence coverage above 50%. 105
124 Figure 3.1-A shows the product-ion spectrum of the triply charged thiocholine-modified peptide VKEIS*VADYTSHER (24 37). This spectrum consists of b and y ions with diagnostic triads of all thiocholine containing peptidic fragment ions. +2 Shown in the expanded spectrum are the representative diagnostic triads from y 12 fragment ions resulting from peptide bond cleavage (m/z = 754.7) and further neutral loss of trimethylamine (-59 Da, m/z = 725.1) and the thiocholine thiolate (-119 Da, m/z = 695.2). Of the ions generated at MS 2 level, the ten most abundant ions were chosen to be further fragmented at the MS 3 level. Examination of the y ion at m/z (among the top ten ions selected) demonstrated that it also possessed an intact thiocholine side chain, which led to a signature neutral loss pattern in its MS 3 spectrum (Figure 3.1-B). The ion at m/z is formed by the neutral loss of trimethylamine from the precursor y at m/z The product-ion spectrum shown in Figure 3.2 is the triply charged peptide VKEIpSVADYTSHERVR (24-39) identified with the traditional method, corresponding to the phosphopeptide VKEIS*VADYTSHER (Figure 3.1-A) with one additional missed cleavage. The spectrum provides minimal sequence informative ions in comparison to that of the thiocholine-modified peptide with lower sequence coverage and a lower ion score. Examination of the fragmentation pattern of VKEIS*VADYTSHER demonstrated that the thiocholine side chain enabled a unique tandem fragmentation pattern ideal for proteomic analyses, since sequencing of the peptide at the MS 2 level is not compromised 106
125 by subsequent neutral losses but rather strengthened by the presence of diagnostic triads of fragment ions in conjunction with the signature neutral loss at the MS 3 level. As previously discussed, one of the promising prospects of this approach is the use of these unique and predictable diagnostic triads of fragmentation ions from thiocholine-modified peptides in a weighted scoring system, where the intrinsic chemical properties of the modified peptide could enhance identification of phosphorylated peptides and phosphosites. Even though such a scoring system is not currently available, combining the current MASCOT score with high mass accuracy ( < 5ppm) and the diagnostic triad of fragment ions in both MS 2 and MS 3 levels will ensure the identification of the modified peptides are made with high confidence. To gain insight into the potential mechanistic significance of the identified ipla 2 β phosphosites, a three-dimensional model of ipla 2 β was generated using the I-TASSER server, an internet service that predicts protein structures and generates protein 3-D models [8-10]. The I-TASSER program was developed by Yang et al. at the University of Michigan. 3D models are predicted based on multiple-threading alignments generated by Local Meta-Threading-Server (LOMETS) that generates protein 3-D models by collecting target-to-template alignments with high scores as well as iterative TASSER simulations. The I-TASSER server was ranked as the No. 1 server with the best global distance test total score (GDT-TS), which is a measure of the similarity between two different protein structures with the same primary structure, but different tertiary structures, in the server section of both the 7 th and 8 th CASPs (Critical Assessment of 107
126 Techniques for Protein Structure Prediction). As shown in Figure 3.3-A, the catalytic serine located within the lipase consensus sequence GXSXG resides within the central catalytic core adjacent to the nucleotide binding motif (GXGXXG) (S465) [30]. All the phosphorylation sites identified either with BEMA with thiocholine or through the traditional direct analysis were located in the 3-D model. The distance (in Å) between these phosphorylated serine/threonine residues and the active site of serine 465 measured by using atom-to-atom distances between the hydroxyl oxygen of phosphorylated serines/threonines residues and the hydroxyl oxygen of serine 465 are listed in Table 3.3. The closest of the identified phosphorylated residues, threonine 521 is predicted to be at a distance of 8.67 Å from the catalytic site in this model, which is also labeled in Figure 3.3-A. At this distance, the phosphorylation/dephosphorylation of threonine 521 could significantly influence the catalytic activity of the enzyme. Other phosphorylated serines/threonines within the catalytic core, labeled in Figure 3.3-B, undergo phosphorylation/dephosphorylation that could also affect the activity of ipla 2 β. As shown in Figure 3.3-C, many of the observed phosphosites in ipla 2 β are located within the ankyrin repeat domain; these residues likely facilitate specific binding to protein partners in a phosphorylation-dependent fashion. The phosphorylation/dephosphorylation cycling of these residues could impact the regulation of protein-protein interactions during the binding of ipla 2 β to cellular membranes that contain ankyrin-binding proteins. 108
127 3.5 Conclusion and Perspective We demonstrated the utility of the β-elimination and Michael addition strategy in the identification of endogenous phosphorylation sites of ipla 2 β heterologously expressed in Sf-9 cells. In comparison to the traditional direct mass spectrometric analyses of phosphopeptides, the BEMA strategy identified more phosphopeptides with more phosphorylation sites, and demonstrated improved sequence coverage and ion scores. A diagnostic triad of fragment ions also facilitated improved phosphosite determination at higher confidence levels of the peptides identified by MASCOT. The 3-D model of ipla 2 β showed that threonine 521 was spatially the closest identified phosphosite to serine 465 in the catalytic domain. The phosphorylation/dephosphorylation of these sites likely affects the catalytic activity, membrane binding and trafficking of ipla 2 β. 109
128 3.6 References (1) Hunter, T. Cell 2000, 100, (2) Cohen, P. Nat. Cell Biol. 2002, 4, E (3) Bender, E.; Kadenbach, B. FEBS Lett. 2000, 466, (4) Yates, J. R.; Ruse, C. I.; Nakorchevsky, A. Annu. Rev. Biomed. Eng. 2009, 11, (5) Syka, J. E.; Coon, J. J.; Schroeder, M. J.; Shabanowitz, J.; Hunt, D. F. Proc. Natl. Acad. Sci. U. S. A. 2004, 101, (6) Mann, M.; Ong, S. E.; Gronborg, M.; Steen, H.; Jensen, O. N.; Pandey, A. Trends Biotechnol. 2002, 20, (7) Chen, M.; Su, X.; Yang, J.; Jenkins, C. M.; Cedars, A. M.; Gross, R. W. Anal. Chem. 2010, 82, (8) Zhang, Y. BMC Bioinf. 2008, 9, 40. (9) Zhang, Y. Proteins 2009, 77 Suppl 9, (10) Roy, A.; Kucukural, A.; Zhang, Y. Nat. Protoc. 2010, 5, (11) Jenkins, C. M.; Yan, W.; Mancuso, D. J.; Gross, R. W. J. Biol. Chem. 2006, 281, (12) Thingholm, T. E.; Jorgensen, T. J.; Jensen, O. N.; Larsen, M. R. Nat. Protoc. 2006, 1, (13) Bradford, M. M. Anal Biochem 1976, 72,
129 (14) Ackermann, E. J.; Dennis, E. A. Biochim. Biophys. Acta 1995, 1259, (15) Gross, R. W. J. Lipid Mediators Cell Signalling 1995, 12, (16) Ma, Z.; Turk, J..Prog. Nucleic Acid Res. Mol. Biol. 2001, 67, (17) Yedgar, S.; Lichtenberg, D.; Schnitzer, E. Biochim. Biophys. Acta 2000, 1488, (18) Snyder, F. Biochem. J 1995, 305 ( Pt 3), (19) Six, D. A.; Dennis, E. A. Biochim Biophys Acta 2000, 1488, (20) Murakami, M.; Kudo, I. J Biochem 2002, 131, (21) Loeb, L. A.; Gross, R. W. J Biol Chem 1986, 261, (22) Borsch-Haubold, A. G.; Bartoli, F.; Asselin, J.; Dudler, T.; Kramer, R. M.; Apitz-Castro, R.; Watson, S. P.; Gelb, M. H. J Biol Chem 1998, 273, (23) Borsch-Haubold, A. G.; Ghomashchi, F.; Pasquet, S.; Goedert, M.; Cohen, P.; Gelb, M. H.; Watson, S. P. Eur J Biochem 1999, 265, (24) Hefner, Y.; Borsch-Haubold, A. G.; Murakami, M.; Wilde, J. I.; Pasquet, S.; Schieltz, D.; Ghomashchi, F.; Yates, J. R., 3rd; Armstrong, C. G.; Paterson, A.; Cohen, P.; Fukunaga, R.; Hunter, T.; Kudo, I.; Watson, S. P.; Gelb, M. H. J Biol Chem 2000, 275, (25) de Carvalho, M. G.; McCormack, A. L.; Olson, E.; Ghomashchi, F.; Gelb, M. H.; Yates, J. R., 3rd; Leslie, C. C. J Biol Chem 1996, 271, (26) Larsson Forsell, P. K.; Kennedy, B. P.; Claesson, H. E. Eur. J. Biochem. 1999, 262,
130 (27) Mancuso, D. J.; Abendschein, D. R.; Jenkins, C. M.; Han, X.; Saffitz, J. E.; Schuessler, R. B.; Gross, R. W. J. Biol. Chem. 2003, 278, (28) Atsumi, G.; Murakami, M.; Kojima, K.; Hadano, A.; Tajima, M.; Kudo, I. J. Biol. Chem. 2000, 275, (29) Ramanadham, S.; Hsu, F. F.; Bohrer, A.; Ma, Z.; Turk, J. J. Biol. Chem. 1999, 274, (30) Derewenda, Z. S.; Sharp, A. M. Trends Biochem. Sci 1993, 18, (31) Whitesides, G. M.; Lilburn, J. E.; Szajewski, R. P. J. Org. Chem. 1977, 42,
131 3.7 Table Legends Table 3.1 Identification of endogenous phosphorylation sites in ipla 2 β heterologously expressed in Sf-9 cells without thiocholine modification. Tryptic ipla 2 β peptides were desalted, separated using reverse-phase nanobore HPLC, and analyzed with an LTQ-Orbitrap system. Candidate peptides were identified using MASCOT with the designated thiocholine modification as well as common amino acid modifications as described in the Materials and Methods. A total of five unique phosphopeptides and six different phosphorylated residues were identified. p denotes identified phosphorylation sites; (p) denotes that more than one phosphorylation site was identified in the same peptide. Those that were not concurrent are indicated by /. The superscripts ace, d, and o denote the following modifications: acetylation (N-terminus), deamidation (NQ), and oxidation (M), respectively. All cysteine residues were carbamidomethylated. Table 3.2 Identification of endogenous phosphorylation sites in ipla 2 β heterologously expressed in Sf-9 cells with thiocholine modification. Tryptic ipla 2 β peptides were modified with thiocholine using two different protocols optimized for either phosphoserine or phosphothreonine as described in the Materials and 113
132 Methods. The thiocholine-modified peptides were desalted, separated using reverse-phase nanobore HPLC, and analyzed with an LTQ-Orbitrap system. Candidate peptides were identified using MASCOT with the designated thiocholine modification as well as common amino acid modifications as described in Materials and Methods. A total of 12 unique phosphopeptides and 19 different phosphorylated residues were identified. * denotes identified phosphorylation sites; (*) denotes that more than one phosphorylation site was identified in the same peptide. Those that were not concurrent are indicated by /. The superscripts d, and o denote the following modifications: deamidation (NQ) and oxidation (M), respectively. All cysteine residues were carbamidomethylated. Identified peptides with missed cleavages are listed together with the completely trypsinized peptides outlined by bold-bordered boxes. Peptides which yielded a signature neutral loss pattern in MS 3 are highlighted in bold. Table 3.3 Calculated distances between the catalytic site serine 465 of ipla 2 β and the identified phosphorylation sites of ipla 2 β heterologously expressed in Sf-9 cells utilizing the BEMA strategy or traditional direct analysis in the 3-D model of ipla 2 β molecule generated by I-TASSER. A 3-D model of ipla 2 β was generated using the I-TASSER server. All the phosphorylation sites identified either with β-elimination and Michael with thiocholine addition (denoted as BEMA in the table) or the traditional direct mass spectrometric 114
133 method (denoted as Direct in the table) were located in the 3-D model. The distance between the identified phosphorylated residues and the catalytic site serine 465 are given in Å. The distance measured is the atom-to-atom distance between the hydroxyl oxygen of serine 465 and the hydroxyl oxygens of the phosphorylated serines/threonines. Threonine 521 is the most proximal residue (8.67 Å) to the catalytic site in this model. 115
134 Table 3.1 Sequence# Sequence Phosphorylation Site Ion Score Δm (ppm) Coverage% VKEIpSVADYTSHERVR S % ace NApSAGLNQVNK S % ace GCAEMIISM o DSpSQIHSK S % Q d LQ d DLMPIpSRAR S % LSIVV(p)SLGpTGR S638/T % Table 3.2 Sequence# Sequence Phosphorylation Site Ion Score Δm (ppm) Coverage% VKEIS*VADYTS ( * ) HER S28/S % EIS*VADYTS ( * ) HER S28/S % VREEGQLILFQNAS*NR S % CN d VMGPSGFPIHT*AMK S252/S % GCDVDSTS*AAGNTALHVAVM o R S % Q d LQDLMPIS*R S % KPAFILS*S ( * ) MR S414/S % KPAFILS*S ( * ) MRDEK S414/S % S*MAYMRGVYFR S % GS*RPYES ( * ) GPLEEFLK S498/S % EFGEHTKM o T*DVK T % VMLT*GT ( * ) LS ( * ) DR T531/T533/S % SS*GAAPT ( * ) YFRPN d GR S583/T % AWS*EMVGIQYFR S % 116
135 Table 3.3 Residue number Identification Method Distance to Serine 465 (Å) Serine 28 BEMA/Direct Serine 34 BEMA Serine 51 BEMA Serine 210 Direct Serine 252 BEMA Serine 258 BEMA Serine 277 Direct Serine 314 BEMA Serine 404 BEMA/Direct Serine 414 BEMA Serine 415 BEMA Serine 479 BEMA Serine 498 BEMA Serine 503 BEMA Threonine 521 BEMA 8.67 Threonine 531 BEMA Threonine 533 BEMA Serine 535 BEMA Serine 583 BEMA Threonine 588 BEMA Serine 638 Direct Threonine 641 Direct Serine 696 BEMA
136 3.8 Figure Legends Figure 3.1 Fragmentation of the thiocholine-modified peptide VKEIS*VADYTSHER identified in ipla 2 β at both the MS 2 and MS 3 levels. A. The product-ion spectrum of the triply charged molecular ion at m/z (VKEIS*VADYTSHER) was obtained with an ESI-LTQ-Orbitrap as described in the Materials and Methods. The fragment ion resulting from the neutral loss of trimethylamine from the parent ion was present at m/z Shown in the expanded spectrum (relative intensity zoom = 24%) are examples of the diagnostic triad consisting of the y fragmentation ions resulting from peptide bond cleavage (m/z = 754.7) and further neutral loss of trimethylamine (-59 Da, m/z = 725.1) or the thiocholine thiolate (-119 Da, m/z = 695.2). Also shown is the y (m/z = 690.1) and its corresponding ion peak of the neutral loss of trimethylamine (-59 Da) at m/z = S* indicates the thiocholine-modified site. B. The MS 3 spectrum of the y ion at m/z resulting from the fragmentation of the triply charged molecular ion at m/z (VKEIS*VADYTSHER) obtained with an ESI-LTQ-Orbitrap as described in the Materials and Methods section. The ion peak at m/z corresponds to the doubly charged fragment ion generated from the neutral loss of trimethylamine from the parent ion y
137 Figure 3.2 Fragmentation of the phosphopeptide VKEIpSVADYTSHERVR identified in ipla 2 β without thiocholine modification. The product-ion spectrum of the triply charged molecular ion at m/z (VKEIpSVADYTSHERVR) was obtained with an ESI-LTQ-Orbitrap as described in the Materials and Methods section. The fragment ion resulting from the neutral loss of H 3 PO 4 from the parent ion was not observed. ps indicates the phosphorylated site. Figure D model of ipla 2 β generated by the I-TASSER server. The primary amino acid sequence file of ipla 2 β was submitted to I-TASSER server located at The 3-D model in PDB format was generated and displayed with ViewerLite freeware. A. The catalytic site serine 465 and phosphorylated residue threonine 521 are labeled. The atom-to-atom distance between the hydroxyl oxygen of serine 465 and the hydroxyl oxygen of the threonine 521 is calculated to be 8.67 Å in this model. B. Phosphorylated residues within the catalytic core are labeled as follows: serine 28, serine 34, serine 51, serine 210, serine 252, serine 258, serine 277, serine 314, serine 304, serine 414, and serine 415. C. Phosphorylated residues within the ankyrin domain of ipla 2 β are labeled as follows: serine 479, serine 498, serine 503, threonine 521, threonine 531, threonine 533, serine 535, serine 583, threonine 588, serine 638, threonine 641, and serine
138 Figure
139 121
140 Figure

141 Figure 3.3 A. 123
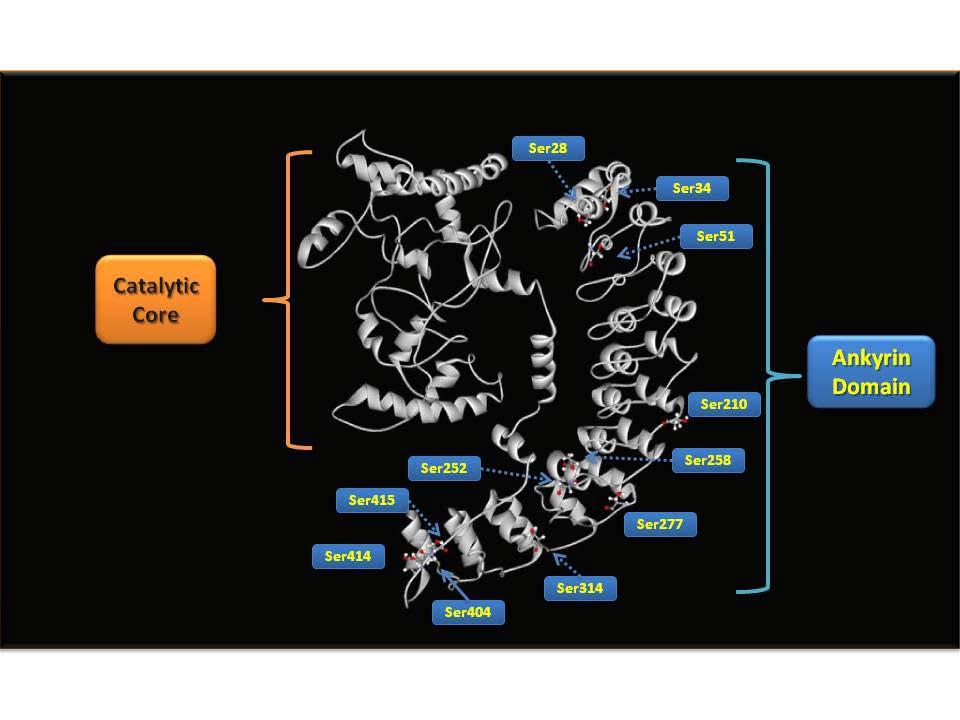
142 B. 124
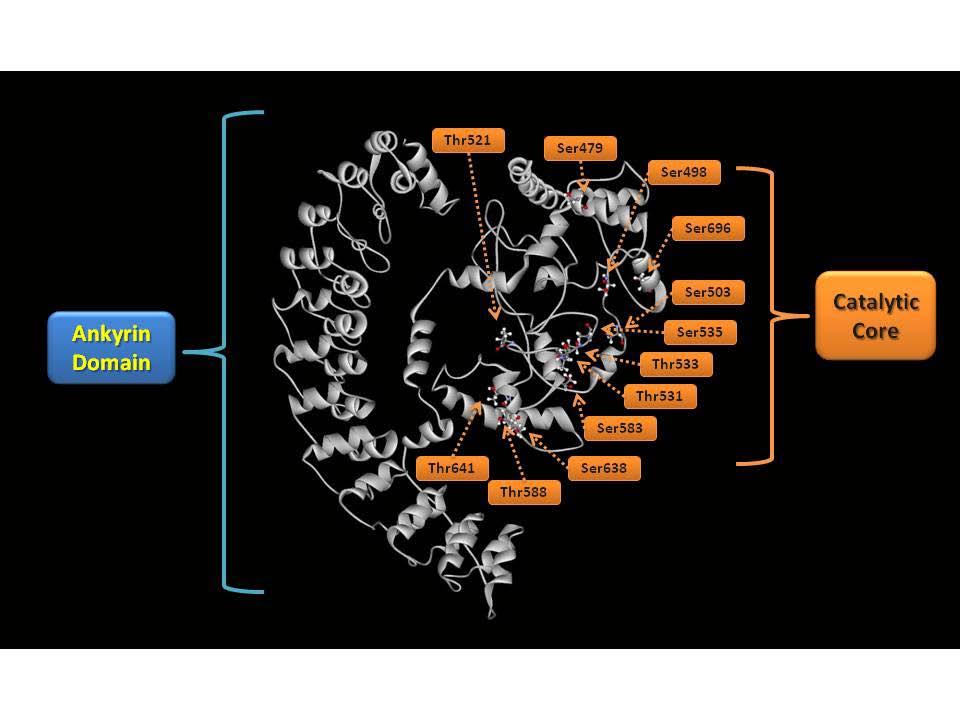
143 C. 125
144 CHAPTER 4 Quantitative Analysis of Alterations in the Myocardial Mitochondrial Phosphoproteome Induced by Cardiac Ischemia Assessed using β-elimination and Michael Addition with Light and Heavy Thiocholine 4.1 Abstract Quantitative analysis of alterations in the murine myocardial mitochondrial phosphoproteome induced by global cardiac ischemia was performed using the developed mass spectrometric strategy of β-elimination of phosphate and subsequent Michael addition (BEMA) with natural abundance (light) thiocholine and stable-isotope labeled (heavy) thiocholine. The developed strategy exploited the increased ionization efficiency, sensitivity and diagnostic triads of fragmentation ions to identify 141 phosphopeptides from 133 distinct proteins that include the identification of 36 phosphopeptides from 35 mitochondrial proteins containing 37 previously unreported mitochondrial phosphosites. The identities of these novel phosphosites were first determined using the MASCOT search engine and were substantiated through rescoring using the Percolator algorithm. Quantitation of alterations in mitochondrial protein phosphorylation resulting from 126
145 cardiac ischemia were achieved by comparing phosphopeptides modified by heavy thiocholine obtained from mitochondria in ischemic hearts (i.e., global ischemia) to those modified by light thiocholine in control hearts ( i.e., normal flow perfusion). Collectively, these results demonstrate that β-elimination of phosphate and subsequent Michael addition (BEMA) using light and heavy thiocholine represent an effective massspectrometry-based strategy for comparative quantitative phosphoproteomics in whole organ systems during pathophysiologic perturbations. 127
146 4.2 Introduction The reversible protein phosphorylation and dephosphorylation of serine and threonine residues are the most ubiquitous posttranslational modifications that regulate critical signaling pathways in eukaryotic cells [1-3]. As in most biologic systems, protein phosphorylation plays multiple roles in regulating a diverse array of mitochondrial functions. Prior work demonstrated that numerous proteins are phosphorylated in the mitochondria of yeast [4], mouse liver [5], mouse brain [6], bovine heart [7], and in virtually every cell type and organ system studied [8-9]. In mitochondria, it is well established that the activities of enzymes, such as pyruvate dehydrogenase [10-14] and cytochrome oxidase [15-16] are regulated by reversible protein phosphorylation that contributes to cellular bioenergetics, substrate utilization and the deleterious sequelae of oxidative stress. However, a quantitative mass spectrometric approach for phosphoproteome analysis on a global scale identifying the number and magnitude of alterations in the phosphorylation at specific phosphosites of mitochondrial proteins after pathophysiologic perturbations has not been well defined. Radiolabeling of biologic tissues with [γ- 32 P]-ATP is a traditional quantitative approach that has been used to provide early insights into the mitochondrial phosphoproteome [8, 17]. Radiolabeling is a very sensitive technique for the detection of phosphoproteins and the characterization of overall changes in the level of protein phosphorylation. However, its utility is limited by its inability to localize readily the phosphosite without additional approaches such as site-directed mutagenesis, enrichment 128
147 processes, or Edman degradation. Although fluorescence labeling represents a sensitive nonradioactive alternative to 32 P radiolabeling [7] it suffers multiple limitations because fluorescence labeling alone cannot provide primary sequence information of the phosphorylated peptide or its phosphosite. Meanwhile, mass spectrometric approaches for phosphoproteome analysis are complicated by facile cyclo-elimination of phosphoric acid, resulting in ambiguities in phosphosite assignment and poor ionization efficiencies of phosphopeptides rendering their detection difficult. Thus, these techniques are not amenable to high-throughput quantitative analysis required for comprehensive phosphoproteome determination. [18]. Isobaric tags for relative and absolute quantitation (itraq) is an effective massspectrometry-based labeling technique for multiplexed quantitative phosphoproteomics [19-21]. For this approach, tryptic peptides from proteins of different biological states are modified with different isobaric tags. The same phosphopeptides from different states are identical in the full-mass scan but can produce unique reporter ions during the tandem mass spectrometric analysis, thus providing information of comparative quantitation based on the relative abundances of the reporter ions. However, given that quantitation is achieved at the MS 2 level, the sensitivity of this strategy is limited and could lead to large run-to-run deviations and, thus, poor reproducibility. Previously, we developed a sensitive method taking advantage of the unique chemistry of the quaternary amine to enhance ionization efficiency in conjunction with the strong nucleophilicity of the thiol present in thiocholine to effect the BEMA strategy with thiocholine as the Michael donor (as described in Chapter 2). This strategy results in 129
148 marked increase in ionization sensitivity during ESI accompanied by increased sequence coverage in model compounds as described in Chapters 2 and 3. More specifically, the definitive localization of phosphorylated residues is greatly facilitated by the thiocholine side chain through the generation of diagnostic triads of fragment ions resulting from peptide bond cleavage and further neutral loss of either trimethylamine (-59 Da/-63 Da) or thiocholine thiolate (-119 Da/-123 Da) during CID in MS 2 and MS 3 experiments. Through utilization of titanium dioxide resin (TiO 2 ) for phosphopeptide enrichment, sample complexity is greatly reduced [23] leading to improved chromatographic coverage of the phosphopeptides of interest. To minimize false discovery rates, all database searches generated by MASCOT [24] were re-scored by Percolator [25-26], a semi-supervised machine learning algorithm further substantiating the identification of the observed phosphosites. In this study, we successfully identified 141 phosphopeptides from 133 unique proteins with 228 phosphorylation sites from six independent biological replicates generated from 24 perfused mouse hearts (12 control-perfused, 12 global ischemic). Importantly, these data included 36 phosphopeptides from 35 mitochondrial proteins with 50 phosphosites, 37 of which are new mitochondrial phosphosites that have not been reported previously. Relative alterations in the magnitude of phosphorylation were evaluated for all phosphopeptides identified in three independent replicate samples using relative molecular ion peak intensity ratios. This study has demonstrated that β- elimination of phosphate and subsequent Michael addition (BEMA) using light and heavy thiocholine represents an effective mass-spectrometry based strategy for 130
149 comparative quantitative phosphoproteome analyses of intact organs subjected to pathologic perturbations. 131
150 4.3 Materials and Methods Materials Rapigest was purchased from Waters (Milford, MA); Protein concentrations or amounts were determined using a BCA protein assay kit was purchased from Pierce (Rockford, IL); trypsin was purchased from Promega (Madison, MI); Titansphere Titanium dioxide resin was purchased from GL Sciences (Torrance, CA); POROS 20 R2 resin was purchased from ABI (Foster City, CA). All solvents for mass spectrometric analyses were obtained from Honeywell Burdick&Jackson (Muskegon, MI); all other chemicals were obtained from Sigma-Aldrich (St. Louis, MO) Synthesis of Thiocholine Chloride (Light) and Thiocholine- 13 C,d 3 Chloride (Heavy) Thiocholine chloride was prepared and the free thiol concentration of thiocholine chloride was determined as previously described in Chapter 2. Perfusion of Isolated Langendorff Mouse Hearts Animal protocols used were in strict accordance with the National Institutes of Health guidelines for humane treatment of animals and were reviewed and approved by the Animal Care Committee of Washington University. Mouse hearts were either perfused normally as controls or subjected to global ischemia, as previously described [28]. Briefly, mice were anesthetized with sodium pentobarbital and their hearts were excised and immersed in oxygenated Krebs-Henseleit buffer containing : 137 mm NaCl, 4.7 mm KCl, 132
151 1.2 mm MgSO 4, 1.2 mm KH 2 PO 4, 15 mm NaHCO 3, 3mM CaCl 2, 0.5 mm NaEDTA and 11mM glucose equilibrated with O 2 /CO 2 (95:5), plus insulin (70 mu/l) and BSA (2.8%), at 37 C. Mouse hearts were then perfused by retrograde aortic flow with oxygenated buffer at 37 C. Perfusion pressures were maintained constant at 45 to 50 mm Hg. All hearts were initially perfused with oxygenated buffer for a 15-minute equilibration period. 12 mouse hearts were perfused with oxygenated buffer for an additional 30 mins and served as controls. Another 12 mouse hearts were subjected to global ischemia for an additional 30 min. Preparation of Mouse Mitochondria Mitochondria were prepared as previously described with minor modifications [29-30]. Each perfused heart prepared as described above was immediately placed at 10% (w/v) in ice-cold ph 7.4 HEPES buffer containing 1 mm EDTA, 250 mm sucrose, phosphatase inhibitor cocktail (1 (Sigma) at a 100-fold dilution) and a customized phosphatase inhibitor cocktail (10 mm sodium fluoride, 4 mm sodium tartrate, 2 mm β- glycerophosphate, 2 mm sodium pyrophosphate). Hearts tissues were homogenized with a glass dounce homogenizer, centrifuged at 700 g for 10 min and the supernatant was collected. Next, the supernatant was centrifuged at 10,000 g for 15 min to pellet mitochondria. Mitochondria from two control hearts were pooled together to give six individual control samples while the same was done for the ischemic samples. All control and ischemic samples were processed using the same protocol except that light thiocholine was used for control hearts and heavy thiocholine was utilized for ischemic 133
152 hearts for the Michael addition reaction. Tryptic Proteolysis of Mitochondrial Proteins Mitochondria were re-suspended in 750 µl of 80% aqueous methanol solution in a 1.5- ml micro centrifuge tube and mitochondrial proteins were precipitated as previously described [31]. Briefly, 150 µl of CHCl 3 was added to the above mitochondrial suspension and vortexed, followed by the addition of 450 µl of H 2 O. The mixture was vortexed again before centrifugation at 14,000 g for 15 min, separated into two layers, and the protein located at the interface appeared as a white layer. The upper layer (methanol and H 2 O) was removed and another 450 µl of methanol was added. The sample was vortexed and centrifuged at 14,000 g for 10 min. The protein pelleted at the bottom of the tube was air-dried and re-suspended in 1000 µl of 0.2% Rapigest in 50 mm NH 4 HCO 3 and incubated at 100 C for 5 min. Protein content was determined using the micro-bca protein assay kit (Pierce). 1 mg of total protein from each sample was used for subsequent preparations. The volume of each sample was adjusted to 1 ml using 50 mm NH 4 HCO 3. Next, 52 µl of 100 mm dithiothreitol (DTT) was added to a final concentration of 5 mm. The sample was incubated at 60 C for 30 min before 120 µl of 150 mm iodoacetamide was added to quench the reduction reaction and initiate alkylation. The sample was incubated for an additional 30 min in the dark. Trypsin was added to the solution at a protease to protein ratio of 1:30 (w/w). The solution was incubated at 37 C overnight. The ph of the solution was lowered to < 2 to terminate the digestion and the incubated at 37 C for 30 min. Hydrolyzed Rapigest was pelleted by 134
153 centrifugation at 13,000 rpm. Highly Selective Enrichment of Phosphorylated Peptides by Titanium Dioxide (TiO 2 ) Micro Column Chromatography Trypsinized protein samples were dried in a SpeedVac apparatus (Savant, Holbrook, NY), and reconstituted in 280 mg/ml 2,5-Dihydroxybenzoic acid (2,5-DHB) in 60% acetonitrile (ACN), 1.5% Trifluoroacetic acid (TFA). Phosphorylated peptides in the trypsinized samples were enriched using TiO 2 micro columns as previously described with minor modifications [32]. Bound phosphorylated peptides were eluted twice with 40 µl 25% ammonium hydroxide (ph > 10.5) and once with 30 µl 30% ACN. The fractions containing the eluted phosphopeptides were acidified by the addition of 15 µl 90% formic acid. 30 µl of water was added to reduce the organic solvent concentration to < 5%. BEMA of Phosphorylated Peptides Enriched by TiO 2 Micro Column Chromatography with Light and Heavy Thiocholine Phosphorylated peptides eluted from the TiO 2 micro columns were desalted using POROS 20 R2 micro columns as previously described [33]. Briefly, a POROS 20 R2 micro column was assembled by stamping out a small plug of C8 material from a 3M Empore C8 extraction disk using a HPLC syringe needle and placing this plug in the constricted end of a GELoader tip. Next, POROS R2 beads that were suspended in 50% acetonitrile at 5 mg/200 µl were packed into the GELoader tip by pressing air through 135
154 the micro column using an Eppendorf syringe. The length of the packed POROS R2 resin was about 3-6 mm. The column was then washed with 30 µl 50% acetonitrile and equilibrated with 30 µl 0.1% trifluoroacetic acid. Samples containing the phosphopeptides were then loaded onto the POROS R2 micro column. The sample was slowly passed through the micro column with compressed air from the Eppendorf syringe. The column was washed twice with 30 µl of 0.1% trifluoroacetic acid and the bound peptides were eluted first using 30 µl of 70% acetonitrile containing 0.05 % trifluoroacetic acid, then 5 µl of 30% acetonitrile containing 0.05% trifluoroacetic acid. The desalted phosphorylated peptides were dried in a SpeedVac apparatus and reconstituted in 50 µl deionized water followed by the addition of 38 µl DMSO and 12 µl of absolute ethanol. 25 µl of freshly prepared saturated Ba(OH) 2 was then added to the peptide solution to start the β-elimination reaction. After incubation at room temperature under nitrogen for 3 h with gentle vortexing every 20 min. The final ph was 12~ µl of 1 M thiocholine chloride was added to each of the six the control samples and 50 µl of 1 M thiocholine- 13 C,d 3 chloride was added to each of the six the ischemic samples. The reaction mixture was incubated at room temperature under nitrogen for 5 h at ph 8~9 and then terminated by the addition of 5 µl of 10% TFA. HPLC-ESI-MS 2 /MS 3 Mass Spectrometric Analyses Six control and six ischemic samples modified by light and heavy thiocholine respectively were randomly pooled in pairs to give six mixed samples for six individual replicates. The mixed samples were then desalted with POROS 20 R2 micro columns, 136
155 dried and reconstituted in 0.1% formic acid before injection and separation using a Surveyor HPLC system (Autosampler and pump, ThermoFisher, San Jose, CA) equipped with a reverse-phase C18 PepMap100 Nano-LC column (75 µm I.D. 15 cm, 3 µm, 100 Å; Dionex, Sunnyvale, CA). The flow rate was maintained at nl/min. Samples eluting from the column were directed to the nanospray apparatus (i.e., NanoMate HD with LC coupler, Advion Bioscience Ltd., Ithaca, NY) and sprayed directly into a linear ion trap in tandem with an Orbitrap (LTQ-Orbitrap) mass spectrometer (ThermoFisher, San Jose, CA) at a spray voltage of 1.7 kv in the positive ion mode. Each of the six replicates was analyzed first in a survey run, which consisted of a 180 min gradient from 100% A to 75% A, 25% B (Buffer A: 90% water, 10% acetonitrile, 0.1% formic acid; Buffer B: 10% water, 90% acetonitrile, 0.1% formic acid, v:v) for 120 min, then to 50% A, 50% B (60 min). For data-dependent MS 2 analyses, full mass scans in the Orbitrap ( m/z, mass resolution = 30000) were followed by product-ion scans in the LTQ of the five most abundant ions. These ions of interest generated from the survey run were then included in the parent mass list of a target run. The target run was conducted essentially the same as the survey run except that during the MS 2 data-dependent analyses, the five most abundant ions from the parent mass list were fragmented. A third run was conducted for MS 3 analyses. It consisted of a 180 min gradient from 100% A to 75% A, 25% B (120 min), then to 50% A, 50% B (60 min) for data-dependent MS 2 /MS 3 analyses in which full mass scans in the Orbitrap ( m/z, mass resolution = ) were followed by product-ion scans in the LTQ of the three most abundant ions from the parent mass list and the MS 3 scans in the LTQ of the ten most abundant 137
156 fragment ions following each of the three product-ion scans. MASCOT Database Search The local MASCOT server (version 2.1.1) with an up-to-date IPI mouse database was used to conduct all database searches [24]. The auto decoy option was chosen. Light and heavy thiocholine with neutral losses of trimethylamine and thiolate were integrated into MASCOT for customized processing of the designed covalent modifications for serine and threonine residues. Carbamidomethylation (C) was set as the fixed modification. Common variable modifications included acetylation (N-terminus, K), deamidation (NQ) and oxidation (M). A maximum of two missed cleavages were allowed. Full mass and product-ion mass accuracy were set at 5 ppm and 1 Da respectively. Database searches were conducted using an automatic decoy database provided by the local MASCOT server. Post-MASCOT Processing using Percolator All MASCOT search results were re-scored and re-ranked by a stand-alone version of the MASCOT Percolator [25-26]. All the programs utilized were downloaded using links from Since the MASCOT searches were conducted using the option of auto decoy, the target and decoy MASCOT result files (.DAT) required by the Percolator program were the same. The rankdelta N value was set at default = 1, indicating all peptide hit ranks that have a delta score of < 1 relative to the top hit match were processed. The false discovery rate 138
157 (FDR) was set at 1%. Peptide hits with a posterior error probability (PEP) value < 0.05 (score > 13) were considered automatic positive identifications. Peptides originating from mitochondrial proteins with a PEP > 0.05 but < 0.2 (7 < score < 13) were verified manually for false identifications. All MS 3 scans were analyzed manually for the signature neural loss of trimethylamine (-59 Da/-63 Da). Comparative Quantitation of Light and Heavy Thiocholine-Modified Peptides Relative changes in phosphorylation state were evaluated for all phosphopeptides identified in three or more independent replicate samples using relative peak intensity ratios of the molecular ions of light and heavy thiocholine-modified peptides at the time of their co-elution. The relative ratio was calculated by dividing the light peak intensity by the heavy peak intensity. Dixon's Q [34] test was used to eliminate outlier(s) with 95% confidence prior to calculations of sample average and standard deviation. The subcellular locations of the phosphoproteins identified were determined using the protein database UniProt [35-36] and LOCATE database [37-38]. 139
158 4.4 Results and Discussion In this study, the phosphoproteome of mitochondria isolated from Langendorffperfused mouse hearts subjected to global ischemia was investigated. During prolonged ischemia, flux through the mitochondrial electron transport chain (ETC) is attenuated owing to the accumulation of reducing equivalents in the mitochondrial matrix in the absence of oxygen. This results in the dramatic reduction of ATP production because during ischemia, the redox reactions involving oxygen become the rate limiting steps for the production of ATP. This ultimately leads to profound decreases in cellular ATP, resulting in hemodynamic dysfunction [39-42]. The chain of signaling events in response to the depletion of oxygen is regulated, at least in part, by changes in protein phosphorylation [43-46]. However, the role of alterations in mitochondrial protein phosphorylation in this process is at its early stages of understanding. Specifically, the identity of the mitochondrial phosphoproteins and their specific phosphosites during ischemia are largely unknown. Accordingly, we sought to determine specifically changes in protein phosphorylation following myocardial ischemia using quantitative phosphoproteomics to gain insight into the signaling pathways and molecular mechanisms that are activated during myocardial ischemia and result in alterations in mitochondrial bioenergetics and signaling. 140
159 Comparative Quantitative Phosphoproteomics using β-elimination and Michael Addition with Light and Heavy Thiocholine As reported in Chapters 2 and 3, β-elimination of phosphate and subsequent Michael addition (BEMA) with light and heavy thiocholine as the Michael donors is a sensitive and effective strategy for the detection, identification, and quantitation of phosphoserine and phosphothreonine residues. The overall workflow based on BEMA with light and heavy thiocholine for the comparative quantitative phosphoproteomics of mitochondria from mouse hearts upon induction of cardiac ischemia is detailed in Figure 4.1. Mitochondria were isolated from both normally perfused and globally ischemic mouse hearts by differential centrifugation. Mitochondrial proteins were then isolated by methanol/chloroform precipitation, reconstituted in 0.2% Rapigest, and total protein content was determined using a BCA protein assay. Next, 1 mg of protein from each sample was subjected to trypsinolysis. The resultant tryptic peptides were affinity purified using a TiO 2 micro column for the selective enrichment of phosphopeptides. The affinity purified phosphopeptides were desalted and modified with either light thiocholine (control samples) or heavy thiocholine (ischemic samples). After the reactions were terminated, control and ischemic samples were mixed together, desalted and analyzed by using LC-MS/MS. The mass spectrometric data was searched by using MASCOT and rescored by Percolator to identify phosphopeptides. Quantitative information was obtained from the relative peak intensity of the molecular ions of the phosphopeptides modified by light and heavy thiocholine, respectively. The subcellular localization of the identified proteins was determined using UniProt [35-36] and LOCATE [37-38] databases. Our 141
160 strategy emphasized the rapid purification of mitochondrial to prevent intrapreparative artifacts, recognizing that all mitochondrial preparations contain mitochondria-associated proteins. Mass spectrometric analysis of BEMA thiocholine-modified samples of mitochondria from control and ischemic murine myocardium showed multiple ions which were identified by sequential MASCOT and Percolator. The total ion chromatography (TIC) obtained from a representative sample is shown in Figure 4.2-A. The extracted ion chromatography (XIC) of the full-mass scans is presented in Figure 4.2-B. A representative example of the diagnostic triad present in thiocholine-modified peptides is shown in Figure 4.3-A. The product-ion spectrum of the quadruply charged molecular ion at m/z of the heavy thiocholine-modified peptide YHGHS*MSDPGVSYR was identified as originating from the pyruvate dehydrogenase E1 component subunit α. The spectrum shows the peptide bond cleavage fragment ions B +2 8 at m/z 510.9, B at m/z 588.2, B at m/z 637.5, B at m/z and A 11 at m/z (all fragment ions resulting from heavy thiocholine-modified peptides are presented in capital letters, such as B, A). Also shown in the spectrum are representative diagnostic triads consisting of the B fragmentation ions resulting from peptide bond cleavage (to give an ion at m/z = 510.9) and further neutral loss of 13 C,d 3 -trimethylamine (-63 Da, m/z = 556.8) or the 13 C,d 3 -thiocholine thiolate (-123 Da, m/z = 526.7). Figure 4.3-B displays the expanded product-ion spectrum of the quadruply charged molecular ion modified by heavy thiocholine at m/z (YHGHS*MSDPGVSYR) ranging from m/z 380 to m/z 640. The spectrum shows that the heavy thiocholine-containing B 142
161 ions are accompanied by the corresponding light thiocholine-containing b ions (all fragment ions resulting from light thiocholine-modified peptides are presented in lowercase letters) resulting from the fragmentation of the light thiocholine-modified molecular ion at m/z (YHGHS*MSDPGVSYR): B +2 8 at m/z with b +2 8 at m/z 509.0, B at m/z with b at m/z 586.2, B at m/z with b at m/z 635.7, B 12 at m/z with b at m/z and B at m/z with b at m/z This indicates that during the data-dependent analysis both the light and heavy thiocholinemodified peptides were included for collision induced dissociation (CID). Given that the structures of the peptides are identical, they produced the same corresponding B/b ions in the Product-ion spectrum as indicated by the presence of multiple doublets. This is due to the low-resolution capability of the linear ion trap when selecting the ion of interest for fragmentation. With molecular mass 4 Da apart, both light and heavy thiocholinemodified peptides were included in the mass selection window at +4. The doublets of peptide bond cleavage fragment ions resulting from light and heavy thiocholine-modified peptides further confirm the identification of the peptide, the localization of the modified residue(s), and the phosphorylation site(s). The relative peak intensities of the doublets also serve as a redundant confirmation for the comparative quantitation conducted at the molecular level. Figure 4.3-C, D, E and F illustrate the signature neutral loss fragmentation pattern (loss of 13 C,d 3- trimethylamine, -63 Da) at the MS 3 level of the heavy thiocholine containing fragment ions resulting from the peptide bond cleavages of the quadruply charged molecular ion modified by heavy thiocholine at m/z (YHGHS*MSDPGVSYR). In Figure 4.3-C, B at m/z is the dominant 143
162 neutral loss ion; in Figure 4.3-D, B at m/z is the dominant neutral loss ion; in Figure 4.3-E, B at m/z is the dominant neutral loss ion; in Figure 4.3-F, B at m/z is the dominant neutral loss ion. Collectively, the BEMA with light and heavy thiocholine strategy provides a rich repertoire of information at the MS 2 and MS 3 levels that not only reveals the identification of the modified phosphopeptide, and the localization of thiocholine modification (phosphorylation), but also provides redundant comparative quantitative information at MS 2 level. Improved MASCOT Results using the Post-Processing algorithm Percolator MASCOT is one of the most widely used database search engines for the identification of proteins and peptides based on tandem mass spectrometric data [24]. MASCOT employs an algorithm that ranks the correlation between the experimental product-ion spectra and calculated peptide spectra based on the peptide sequences included in the protein database. The correlation between an experimental and a calculated spectrum is expressed by a score called peptide spectrum match (PSM). However, the ranking based on PSMs does not constitute formal proof of the peptide of interest in all cases. To substantiate results from MASCOT, the strategy of using decoy protein databases that randomize and reverse the protein sequences in the original databases [47-48] enabled the evaluation of peptide identifications using PSMs resulting from both original and decoy databases, thereby allowing the subsequent detection of false positives to determine the false discovery rate (FDR) [49]. MASCOT identifies 144
163 peptides based on the comparison between the PSM of each mass spectrum and a probability-based peptide identity score. If a PSM exceeds the threshold, the peptide identification is a true identification with a certain confidence interval (e.g., a value of 95% confidence is typically used). In addition, a second measurement of experimental vs. calculated spectra is the peptide homology threshold. If the PSM is lower than the homology threshold, it is considered an outlier [50]. As shown in Table 4.1, use of the decoy database in combination with identity and homology thresholds, the performance of MASCOT is not ideal, generating a FDR of over 11% FDR in each of the six individual samples, and an overall FDR of 12.49%. Therefore, the Percolator algorithm was employed to decrease the FDR obtained from MASCOT analysis alone. Percolator utilizes a semi-supervised machine-learning based algorithm called support vector machine (SVM) to compare the identifications resulting from the target and decoy databases using MASCOT [25-26]. The detailed workflow of the algorithm of Percolator is illustrated in Figure 4.4 (reproduced with permission from Figure 1 of the original publication (Journal of Proteome Research, 2009, 8, by M, Brosch, L. Yu, T. Hubbard, and J. Choudhary)). All MASCOT search results were re-scored and re-ranked by a stand-alone version of the Percolator downloaded from the website The rank delta N value was set at default = 1, which means all peptide hit ranks that have a delta score of < 1 to the top hit match were processed. The false discovery rate (FDR) was set at 1%. Table 4.1 shows that Percolator not only increased the total peptide hits by 15%, but also significantly decreased the FDR to 0.64% from the original 12.49%. 145
164 Collectively, Percolator provided a standard post-mascot approach for the significant improvement in increasing authentic phosphopeptide identification, and reducing false positives resulting in a decreased FDR. Statistical Analysis of the Quantitation and Identification of Light and Heavy Thiocholine-Modified Phosphopeptides. In our previous study, we employed BEMA with light and heavy thiocholine using the tryptic phosphopeptide FQpSEEQQQTEDELQDK from β-casein to show that five independent replicates at a theoretical ratio of 1:1 (light:heavy) produced an experimental average of 0.96 ± 0.02; three independent replicates at theoretical ratios of 1:2, 1:3, 1:4, 4:1, 3:1, 2:1 together with five independent replicates at a theoretical ratio of 1:1 (light:heavy) yielded an experimental correlation coefficient of R 2 = 0.99 (as described in Chapter 2). These results show that the BEMA strategy with light and heavy thiocholine is a reliable, reproducible and precise approach towards quantitative phosphoproteomics. However, when dealing with complex tissue based systems, such as subject of the current study, large deviations in the comparative quantitation analysis can be introduced through multi-step sample preparation, run-to-run fluctuations in instrumentation parameters, or simply by the intrinsic differences between individual biological replicates. Although useful information could still be obtained by a limited number of replicates [21], relative changes in phosphorylation were exclusively evaluated for all phosphopeptides identified in three or more independent replicate samples (six samples overall) using relative peak intensity ratios of the molecular ions of light and heavy thiocholine-modified peptides at 146
165 the time of their co-elution. The relative ratio was calculated by dividing the light peak intensity by the heavy peak intensity. Dixon's Q [34] test was used to eliminate the outlier(s) with 95% confidence prior to the calculations of sample average and standard deviation. A representative M + 4 doublet pattern of the quadruply charged molecular ions of light and heavy thiocholine-modified YHGHS*MSDPGVSYR at m/z and , respectively is evident in Figure 4.5. The greater peak intensity of the heavy thiocholine-modified YHGHS*MSDPGVSYR indicates that the phosphorylation level was increased for this peptide following the induction of cardiac ischemia. Peptide hits with a Percolator-processed posterior error probability (PEP) value < 0.05 (score > 13) indicating a confidence level of 95%, were considered automatic positive identifications. Non-mitochondrial peptides with a score < 13 were considered false positives. Peptides originating from mitochondrial proteins with a PEP > 0.05 but < 0.2 (7 < score < 13), indicating a confidence level between 80% and 95%) were verified manually. Four mitochondrial peptides with a score between 7 and 13 were verified as positive identifications. The mass spectra of these peptides are shown in Figure 4.6. Phosphopeptides identified were categorized into six groups according to the number of hits from the six individual biological replicates. Table 4.2-A contains thiocholinemodified peptides identified in all six individual biological replicates. There are 21 unique peptides identified containing 36 phosphorylation sites, 16 of which were not reported in the literature. Ten out of the 21 peptides yielded a signature neutral loss in MS 3 which are highlighted in bold. The ratios in italic font indicate that the ratios are calculated using heavy peak intensity over light peak intensity. Table 4.2-B contains 147
166 thiocholine-modified peptides identified in five out of six individual biological replicates. There are eight unique peptides identified containing 13 phosphorylation sites, five of which were not reported before. Four out of the eight peptides yielded a signature neutral loss in MS 3. Table 4.2-C contains thiocholine-modified peptides identified in four out of six individual biological replicates. There are nine unique peptides identified containing 17 phosphorylation sites, 15 of which were not reported before. Five out of the nine peptides yielded a signature neutral loss in MS 3. Table 4.2-D contains thiocholinemodified peptides identified in three out six of individual biological replicates. There are eight unique peptides identified containing 16 phosphorylation sites, 14 of which were not reported before. One out of the eight peptides yielded a signature neutral loss in MS 3. Table 4.2-E shows the thiocholine-modified peptides identified in two out of six individual biological replicates. There are 11 unique peptides identified containing 20 phosphorylation sites, all of which were not reported before. Four out of the 11 peptides yielded a signature neutral loss in MS 3. Table 4.2-F shows thiocholine-modified peptides identified in one out of six individual biological replicates. There are 84 unique peptides identified containing 126 phosphorylation sites, 119 of which are novel. Three out of the 84 peptides yielded a signature neutral loss in MS 3. No evaluation of quantitation was assessed for peptides in the 1-hit and 2-hit groups out of six. Overall, 141 phosphopeptides were identified from 133 unique proteins with 228 phosphorylated sites from six independent biological replicates, with 189 novel sites. Twenty-seven out 141 thiocholine-modified peptides yielded a signature neutral loss in MS 3, with 24 out 57 if 1- hit peptides are not included. Mitochondrial proteins were determined using the protein 148
167 database UniProt [35-36] and the LOCATE database [37-38]. Proteins identified with either the UniProt or LOCATE databases as mitochondrial proteins were considered to be mitochondrial in origin. There are 36 phosphopeptides identified from 35 mitochondrial proteins with 50 phosphorylated sites, of which 37 were not reported before. As shown in Table 4.3, relative changes in phosphorylation were evaluated for mitochondrial phosphopeptides identified in three or more independent replicate samples To validate the above strategy, the well-characterized phosphorylation of cardiac phospholamban at serine 16 induced during global cardiac ischemia in mouse hearts was used as a test case for the methodology developed in this study. As previously reported, phosphorylation at serine 16 of cardiac phospholamban was increased by fold upon 20-min of ischemia in Langendorff-perfused rat hearts [17]. In our study, we identified the light and heavy thiocholine-modified peptide RAS*TIEMPQQAR with a light over heavy ratio of 0.05 ± 0.00 calculated from six replicates indicating an approximately 20- fold increase in phosphorylation of the peptide, which is consistent the previous results obtained using a traditional 32 P-radiolabeling method from a similar system thereby validating the quantitative approach employed in the current study. Among all the mitochondrial peptides indentified, the peptide IVS*AQSLAEDDVE showed the most significant and consistent change throughout all six samples. The heavy thiocholine-modified peptide IVS*AQSLAEDDVE was identified, with extremely high confidence and high mass accuracy (Table 4.3), in each and every sample. The absence of the ion peak corresponding to the light thiocholine-modified IVS*AQSLAEDDVE indicates that the net phosphorylation level was increased dramatically during the 149
168 induced cardiac ischemia. The peptide IVS*AQSLAEDDVE ( ) is a tryptic peptide from the protein called mitochondrial import receptor subunit TOM20 located in the outer membranes of mitochondria, which is an important receptor protein for precursors of mitochondrial proteins that are synthesized in cytoplasm [51]. The phosphorylation site of serine residue 135 is located within a domain that was characterized in previous study [52] as a critical region responsible for the recognition of protein possessing internal signaling sequence, rendering the phosphorylation of serine 135 a potential mechanism for the adaptive reactions of mitochondria during oxygen deficiency. 150
169 4.5 Conclusion We demonstrated that β-elimination of phosphate and subsequent Michael addition (BEMA) with light and heavy thiocholine together with TiO 2 phosphopeptide enrichment and the Percolator machine learning algorithm based MASCOT re-scoring program provides a highly effective strategy for in vivo quantitative phosphoproteomics of tissuebased systems. The application of this strategy for the quantitative analysis of alterations in the murine myocardial mitochondrial phosphoproteome subjected to global cardiac ischemia resulted in the identification of 141 phosphopeptides from 133 unique proteins with 228 phosphorylated sites, 189 of which were not reported before. Among all the peptides identified, 36 were phosphopeptides from 35 mitochondrial proteins containing 50 phosphosites, 37 of which were not reported before. The strategy was validated by the well-characterized phosphorylation of phospholamban at serine 16 during induced global cardiac ischemia in mouse myocardium. 151
170 4.6 References (1) Krebs, E. G. Philos. Trans. R. Soc. Lond. B. Biol. Sci. 1983, 302, (2) Zolnierowicz, S.; Bollen, M. EMBO J. 2000, 19, (3) Mann, M.; Ong, S. E.; Gronborg, M.; Steen, H.; Jensen, O. N.; Pandey, A. Trends Biotechnol. 2002, 20, (4) Reinders, J.; Wagner, K.; Zahedi, R. P.; Stojanovski, D.; Eyrich, B.; van der Laan, M.; Rehling, P.; Sickmann, A.; Pfanner, N.; Meisinger, C. Mol Cell Proteomics 2007, 6, (5) Villen, J.; Beausoleil, S. A.; Gerber, S. A.; Gygi, S. P. Proc Natl Acad Sci U S A 2007, 104, (6) Ballif, B. A.; Villen, J.; Beausoleil, S. A.; Schwartz, D.; Gygi, S. P. Mol Cell Proteomics 2004, 3, (7) Schulenberg, B.; Aggeler, R.; Beechem, J. M.; Capaldi, R. A.; Patton, W. F. J Biol Chem 2003, 278, (8) Aponte, A. M.; Phillips, D.; Hopper, R. K.; Johnson, D. T.; Harris, R. A.; Blinova, K.; Boja, E. S.; French, S.; Balaban, R. S. J Proteome Res 2009, 8, (9) Lee, J.; Xu, Y.; Chen, Y.; Sprung, R.; Kim, S. C.; Xie, S.; Zhao, Y. Mol Cell Proteomics 2007, 6, (10) Linn, T. C.; Pettit, F. H.; Reed, L. J. Proc Natl Acad Sci U S A 1969, 62, (11) Roche, T. E.; Reed, L. J. Biochem Biophys Res Commun 1974, 59, (12) Sugden, P. H.; Hutson, N. J.; Kerbey, A. L.; Randle, P. J. Biochem J 1978, 169, 152
171 (13) Sugden, P. H.; Randle, P. J. Biochem J 1978, 173, (14) Harris, R. A.; Popov, K. M.; Zhao, Y.; Kedishvili, N. Y.; Shimomura, Y.; Crabb, D. W. Adv Enzyme Regul 1995, 35, (15) Bender, E.; Kadenbach, B. FEBS Lett 2000, 466, (16) Ludwig, B.; Bender, E.; Arnold, S.; Huttemann, M.; Lee, I.; Kadenbach, B. Chembiochem 2001, 2, (17) Vittone, L.; Mundina-Weilenmann, C.; Said, M.; Ferrero, P.; Mattiazzi, A. J Mol Cell Cardiol 2002, 34, (18) Yan, J. X.; Packer, N. H.; Gooley, A. A.; Williams, K. L. J Chromatogr A 1998, 808, (19) Ross, P. L.; Huang, Y. N.; Marchese, J. N.; Williamson, B.; Parker, K.; Hattan, S.; Khainovski, N.; Pillai, S.; Dey, S.; Daniels, S.; Purkayastha, S.; Juhasz, P.; Martin, S.; Bartlet-Jones, M.; He, F.; Jacobson, A.; Pappin, D. J. Mol Cell Proteomics 2004, 3, (20) Reinl, T.; Nimtz, M.; Hundertmark, C.; Johl, T.; Keri, G.; Wehland, J.; Daub, H.; Jansch, L. Mol Cell Proteomics 2009, 8, (21) Boja, E. S.; Phillips, D.; French, S. A.; Harris, R. A.; Balaban, R. S. J Proteome Res 2009, 8, (22) Chen, M.; Su, X.; Yang, J.; Jenkins, C. M.; Cedars, A. M.; Gross, R. W. Anal Chem 2010, 82, (23) Larsen, M. R.; Thingholm, T. E.; Jensen, O. N.; Roepstorff, P.; Jorgensen, T. J. 153
172 Mol. Cell. Proteomics 2005, 4, (24) Perkins, D. N.; Pappin, D. J. C.; Creasy, D. M.; Cottrell, J. S. Electrophoresis 1999, 20, (25) Kall, L.; Canterbury, J. D.; Weston, J.; Noble, W. S.; MacCoss, M. J. Nat Methods 2007, 4, (26) Brosch, M.; Yu, L.; Hubbard, T.; Choudhary, J. J Proteome Res 2009, 8, (27) Whitesides, G. M.; Lilburn, J. E.; Szajewski, R. P. J. Org. Chem. 1977, 42, (28) Lerner, D. L.; Yamada, K. A.; Schuessler, R. B.; Saffitz, J. E. Circulation 2000, 101, (29) Ricci, J. E.; Gottlieb, R. A.; Green, D. R. J Cell Biol 2003, 160, (30) Mancuso, D. J.; Sims, H. F.; Han, X.; Jenkins, C. M.; Guan, S. P.; Yang, K.; Moon, S. H.; Pietka, T.; Abumrad, N. A.; Schlesinger, P. H.; Gross, R. W. J Biol Chem 2007, 282, (31) Wessel, D.; Flugge, U. I. Anal Biochem 1984, 138, (32) Mazanek, M.; Mituloviae, G.; Herzog, F.; Stingl, C.; Hutchins, J. R.; Peters, J. M.; Mechtler, K. Nat. Protoc. 2007, 2, (33) Thingholm, T. E.; Jorgensen, T. J.; Jensen, O. N.; Larsen, M. R. Nat. Protoc. 2006, 1, (34) Rorabacher, D. B. Analytical Chemistry 1991, 63, (35) Boeckmann, B.; Bairoch, A.; Apweiler, R.; Blatter, M. C.; Estreicher, A.; 154
173 Gasteiger, E.; Martin, M. J.; Michoud, K.; O'Donovan, C.; Phan, I.; Pilbout, S.; Schneider, M. Nucleic Acids Res 2003, 31, (36) Bairoch, A.; Bougueleret, L.; Altairac, S. Nucleic Acids Research 2007, 35, D193-D197. (37) Fink, J. L.; Aturaliya, R. N.; Davis, M. J.; Zhang, F.; Hanson, K.; Teasdale, M. S.; Kai, C.; Kawai, J.; Carninci, P.; Hayashizaki, Y.; Teasdale, R. D. Nucleic Acids Res 2006, 34, D (38) Sprenger, J.; Lynn Fink, J.; Karunaratne, S.; Hanson, K.; Hamilton, N. A.; Teasdale, R. D. Nucleic Acids Res 2008, 36, D (39) Murfitt, R. R.; Stiles, J. W.; Powell, W. J., Jr.; Sanadi, D. R. J Mol Cell Cardiol 1978, 10, (40) Rouslin, W. Am J Physiol 1983, 244, H (41) Arduini, A.; Mezzetti, A.; Porreca, E.; Lapenna, D.; DeJulia, J.; Marzio, L.; Polidoro, G.; Cuccurullo, F. Biochim Biophys Acta 1988, 970, (42) Baker, J. E.; Kalyanaraman, B. FEBS Lett 1989, 244, (43) Zivin, J. A.; Kochhar, A.; Saitoh, T. Stroke 1990, 21, III (44) Albert, C. J.; Ford, D. A. Am J Physiol 1999, 276, H (45) Mundina-Weilenmann, C.; Said, M.; Vittone, L.; Ferrero, P.; Mattiazzi, A. Mol Cell Biochem 2003, 252, (46) Williams, S. D.; Ford, D. A. Am J Physiol Heart Circ Physiol 2001, 281, H (47) Moore, R. E.; Young, M. K.; Lee, T. D. J Am Soc Mass Spectrom 2002, 13,
174 386. (48) Colinge, J.; Masselot, A.; Giron, M.; Dessingy, T.; Magnin, J. Proteomics 2003, 3, (49) Benjamini, Y.; Hochberg, Y. Journal of the Royal Statistical Society Series B- Methodological 1995, 57, (50) Brosch, M.; Swamy, S.; Hubbard, T.; Choudhary, J. Mol Cell Proteomics 2008, 7, (51) Schleiff, E.; Shore, G. C.; Goping, I. S. FEBS Lett 1997, 404, (52) Schleiff, E.; Turnbull, J. L. Biochemistry 1998, 37,
175 4.7 Table Legends Table 4.1 Improvement of peptide identification in MASCOT search results using Percolator. A local MASCOT server with an up-to-date IPI mouse database was used to conduct all searches as described in Materials and Methods. Database searches were conducted using an automatic decoy database provided by the local MASCOT server. All MASCOT search results were re-scored and re-ranked by a stand-alone version of the MASCOT Percolator as described in Materials and Methods. The false discovery rate (FDR) was set at 1%. All peptide hits with ion score greater than the identification score or the homology score in the direct output results generated by MASCOT were counted. For the Percolator processed results, all peptide hits with a posterior error probability (PEP) value < 0.05 (score > 13) were counted. The decoy hits were those product-ion spectra that matched peptide sequences in the decoy database. The False Identification Rate (FDR%) was calculated by dividing the overall hits using the decoy hits. The Percolator program not only increased the total hit number in each of the six samples, but also significantly lowered the FDR%. Percolator increased the total number of peptide hits by roughly 15% and lowered the overall FDR% from 12.29% to 0.64%. Table 4.2 Identification of phosphorylation sites in proteins from mitochondria isolated from control and ischemic mouse hearts using BEMA with light and heavy thiocholine. 157
176 Tryptic peptides from proteins associated with mitochondria isolated from control and ischemic mouse hearts were TiO 2 -enriched, and modified by light and heavy thiocholine, respectively. The resultant light and heavy thiocholine samples were mixed, desalted, separated using reverse-phase nanobore HPLC, and analyzed with an LTQ-Orbitrap system as described in Materials and Methods. Mass spectrometry data were searched utilizing MASCOT with the designated thiocholine modification as well as common amino acid modifications as described in the Materials and Methods. Peptides were identified using Percolator-processed MASCOT results as described in the Materials and Methods. Relative change in phosphorylation due to ischemia was evaluated for all phosphopeptides identified in three or more independent replicates as described in the Materials and Methods. The ratios in italic font indicate that they were calculated using heavy peak intensity over light peak intensity. * denotes phosphorylation sites; (*) denotes that more than one phosphorylation site was identified in the same peptide and that they were not concurrent. The superscripts ace, ac, d, and o denote the following modifications: acetylation (N-terminus), acetylation (K), deamidation (NQ) and oxidation (M), respectively. All cysteine residues were carbamidomethylated. Peptides which yielded a signature neutral loss pattern in MS 3 are highlighted in bold. A. Thiocholine-modified peptides identified in all six individual biological replicates. There are 21 unique peptides identified containing 36 phosphorylation sites, 16 of which were not reported before. Ten out of the 21 peptides yielded a signature neutral loss in MS
177 B. Thiocholine-modified peptides identified in five out of six individual biological replicates. There are eight unique peptides identified containing 13 phosphorylation sites, five of which were not reported before. Four out of the eight peptides yielded a signature neutral loss in MS 3. C. Thiocholine-modified peptides identified in four out of six individual biological replicates. There are nine unique peptides identified containing 17 phosphorylation sites, 15 of which were not reported before. Five out of the nine peptides yielded a signature neutral loss in MS 3. D. Thiocholine-modified peptides identified in three out six of individual biological replicates. There are eight unique peptides identified containing 16 phosphorylation sites, 14 of which were not reported before. One out of the eight peptides yielded a signature neutral loss in MS 3. E. Thiocholine-modified peptides identified in two out of six individual biological replicates. There are 11 unique peptides identified containing 20 phosphorylation sites, all of which were not reported before. Four out of the 11 peptides yielded a signature neutral loss in MS 3. F. Thiocholine-modified peptides identified in one out of six individual biological replicates. There are 84 unique peptides identified with 126 phosphorylation sites, 119 of which were not reported before. Three out of the 84 peptides yielded a signature neutral loss in MS
178 Table 4.3 Identification of phosphorylation sites from mitochondrial proteins isolated from control and ischemic mouse hearts using BEMA with light and heavy thiocholine. Tryptic peptides from proteins associated with mitochondria isolated from control and ischemic mouse hearts were TiO 2 -enriched, and modified by light and heavy thiocholine, respectively. The modified peptides were mixed, desalted, and separated using reversephase nanobore HPLC, before analysis with an LTQ-Orbitrap system as described in Materials and Methods. Mass spectrometry data were searched utilizing MASCOT with the designated thiocholine modification as well as common amino acid modifications as described in the Materials and Methods. Peptides were identified using Percolatorprocessed MASCOT results as described in the Materials and Methods. Mitochondrial proteins were identified using both UniProt and LOCATE. No attempts have been made to reassign the subcellular locations predicted by UniProt and LOCATE. Relative changes in phosphorylation were evaluated only for mitochondrial phosphopeptides identified in three or more independent replicates as described in the Materials and Methods. The ratios in italic font indicate that they were calculated using heavy peak intensity over light peak intensity. * denotes phosphorylation sites; (*) denotes that more than one phosphorylation site was identified in the same peptide that were not concurrent with other phosphorylation sites within the same peptide. The superscripts ace, ac, d, and o denote the following modifications: acetylation (N-terminus), acetylation (K), deamidation (NQ) and oxidation (M), respectively. All cysteine residues were carbamidomethylated. Peptides which yielded a signature neutral loss pattern in MS 3 are 160
179 highlighted in bold. Collectively, there were 36 unique peptides identified with 50 phosphorylation sites, 37 (indicated with underscore) of which were not reported before. Eight out of the 36 peptides yielded a signature neutral loss in MS 3. a : Proteins that are known to be other subcellular locations but are associated with mitochondria and are listed as mitochondrial proteins in UniProt and LOCATE. 161
180 Table 4.1 Sample MASCOT MASCOT Decoy Percolator Decoy FDR% Percolator Hits Hits Hits Hits FDR% Total
181 Table 4.2 A. Protein Peptide Sequence Δm (ppm) Percolator Score Ratio Isoform 1 of Tropomyosin alpha-1 chain Alpha-crystallin B chain AISEELDHALNDMT(*)S*I ±0.36 APS*WIDTGLSEMR ±0.00 Vinculin DPNAS*PGDAGEQAIR ±0.25 Prostaglandin E synthase 3 DWEDDS*DEDMSNFDR ±0.40 Uncharacterized protein C6orf203 EADEEDS*DEETS(*)YPER ±0.23 homolog Isoform SERCA2A of Sarcoplasmic/endopla EFDELSPS*AQR ±0.21 smic reticulum calcium ATPase 2 Isoform 2 of Spectrin beta chain, brain 1 GDQVS*Q d NGLPAEQGSPR ±0.11 Isoform Somatic of Angiotensinconverting GPQFGS*EVELR ±0.79 enzyme Mitochondrial import receptor subunit IVS*AQSLAEDDVE ±0.00 TOM20 homolog AHNAK nucleoprotein isoform LPSGS*GPAS(*)PTTGSAVDIR ± Gap junction protein QAS*EQNWANYSAEQNR ±0.32 Isoform A of Heat shock protein beta-1 QLS*SGVSEIR ±0.08 Cardiac phospholamban RAS*T(*)IEMPQQAR ±0.05 Tensin 1 S(*)QS*FPDVEPQLPQAPTR ±0.33 Ras GTPaseactivating proteinbinding S(*)T(*)S*PAPADVAPAQEDLR ±0.28 protein 1 Isoform 1 of Protein NDRG2 TAS(*)LT*S(*)AASIDGSR ±0.28 Oxsr1 Serine/threonineprotein kinase OSR1 TEDGGWEWS*DDEFDEESEEGR ±
182 Protein Peptide Sequence Δm (ppm) Percolator Score Ratio Putative uncharacterized protein Isoform 1 of Protein NDRG2 Pyruvate dehydrogenase E1 component subunit alpha Ubiquinone biosynthesis protein COQ9, mitochondrial T(*)LS(*)PT*PS(*)AEGYQDVR ±0.18 T(*)LS*QSS(*)ESGTLPSGPPGHTMEV SC ±0.29 YHGHS(*)MS*DPGVSYR ±0.43 YTDQS*GEEEEDYESEEQLQHR ±0.37 B. Protein Peptide Sequence Percolator Δm Score (ppm) Ratio EH domaincontaining GPDEAIEDGEEGS*EDDAEWVVTK ±0.27 protein 2 Ubiquitinassociated GVS*VS(*)SGTGLPDM o T*GSVYNK ac ±0.00 protein 2 ATP synthase subunit alpha, mitochondrial ILGADT*S(*)VDLEETGR ±0.52 Gap junction MGQAGS*T(*)IS(*)NSHAQPFDFPDDSQNA protein K ±0.08 Isoform 1 of Cyclin-Y S*ASADNLILPR ±0.21 Histone H1.4 ace S*ET(*)APAAPAAPAPAEK ±0.25 Catenin alpha-1 TPEELDDS*DFETEDFDVR ±0.13 Thioredoxinrelated transmembrane protein 1 VEEEQEADEEDVS*EEEAEDR ±
183 C. Protein Isoform 3 of LIM domainbinding protein 3 Signal transducer and activator of transcription 5B Isoform 1 of Zinc finger protein 106 Creatine kinase S-type, mitochondrial Gap junction protein Electron transfer flavoproteinubiquinone oxidoreductase, mitochondrial Ryanodine receptor 2, cardiac Isoform 1 of MAP7 domaincontaining protein 1 LIM homeobox transcription factor 1-beta Peptide Sequence Δm (ppm) Percolator Score Ratio DPALDTN d GSLATPS*PS(*)PEAR ±0.17 ace EAN d N d GSSPAGSLADAMS*QK ±0.61 ace EQ d SRQDEPPSNSQ d EVN d S*DDR ±0.00 LGYILTCPS(*)NLGT*GLR ±0.32 MGQAGS(*)T*IS*NS(*)HAQPFDFPDDSQNA K ±0.00 NLS*IYDGPEQR ±0.51 RIS(*)QT*SQVSIDAAHGYSPR ±0.70 RS*SQPSPT(*)T(*)VPASDSPPAK ±0.28 S*EDEDGDM o K a PAK a GQGSQSK a GS(*)GDDGK ac ±
184 D. Protein Troponin I, cardiac muscle Isoform 1 of Protein FAM54B Putative uncharacterize d protein Discs, large homolog 3 Isoform 1 of Trinucleotide repeatcontaining gene 6B protein Isoform 1 of Mitochondrial fission factor Similar to E1B 19K/Bcl-2- binding protein homolog ATP synthase subunit alpha, mitochondrial Peptide Sequence Δm (ppm) Percolator Score Ratio ace ADESS*DAAGEPQPAPAPVR ±0.70 AS(*)S*FADMMGILK ±0.00 ace DQPGHES(*)NT(*)SGNGSNM o WPNFPS*Q d D K ace ENM o AQEN d SIQ d EQGVTSNT*SDSES(*)SS(*) K ± ±0.00 GPSGTDT*VS(*)GQSNSGN d NGNNGKDR ±0.00 NDS*IVTPSPPQAR ±0.30 NST(*)LS*EEDYIER ±0.12 TGTAEMS(*)S*ILEER ±
185 E. Protein Peptide Sequence Δm (ppm) Percolator Score Metabotropic glutamate receptor 8 5'-AMP-activated protein kinase subunit beta-2 Similar to mkiaa1614 protein isoform 1 EN d LQNGNLNDPS*SIESS(*)NGQ d WPK ac Transcription factor Sp4 EN d NVS*Q d PASS(*)SSSSSSSN d N d GSSSPTKTK Myosin regulatory light chain 2, ventricular/cardiac muscle isoform Ryanodine receptor 2, cardiac Isoform 1 of Coiled-coil domain-containing transmembrane protein C7orf53 homolog CXXC-type zinc finger protein 5 Solute carrier family 2 (facilitated glucose transporter), member 4 Putative uncharacterized protein Vasodilator-stimulated phosphoprotein ace AVN d FNGS*AGTPVTFNEN d GDAPGR DLS*SS(*)PPGPYGQEMYVFR IEGGS(*)SNVFS*MFEQTQIQEFK IS(*)QTS*QVSIDAAHGYSPR LYVVDS*INDLNK ace M o S*SLGGGSQDAGGSSSSSN d TN d SSSGS*GQ d K ac T(*)PS*LLEQEVKPSTELEYLGPDEND VAEPEES*EAEEPAAEGR WLPAGTGPQAFSR
186 F. Protein Poliovirus receptor Coiled-coil domaincontaining protein 93 Putative uncharacterized protein Rap1 GTPaseactivating protein Isoform 2 of Protein MRVI1 Peptide Sequence Δm (ppm) Percolator Score AGGDIRVLVPYNSTGVLGGSTTLHCSLT*S*N d EN d VT* ITQ d ITWMKK ac YS*DRKK DRSDSDDQMLVAN d GSPS*SNLSSSVR SENS*STQ d SSPEM o PTTKNR FNALN d LPGQ d APS*S*SPM o PSLPALSESSNGK ac SSISVS *PALPALLENGK Dnajc5 protein SLS*TSGESLYHVLGLDK Synaptotagmin-12 NVST*GVVELK Isoform 2 of YEATS domaincontaining T*IVVGN d VSK protein 2 Metallothionein ace MDPN d CS*CAAGDSCTCAGSCK ac Isoform 1 of PDZ domain-containing RING finger protein ace VAEGSS*EGATANIEAYRPSPK Proteasome activator complex subunit 1 EPALNEAN d LS*NLK Isoform 1 of CAP- Gly domaincontaining linker TVAENDAAQ d PGSMSSSSSS*SSLDHK protein 4 Isoform 1 of LIM domain-binding K ac MSGGSTM o S*S*GGGNTNN d SNSK ac K protein 1 Tyrosine 3- monooxygenase ace AVSEQ d DT*KQAEAVT*SPR Aspartyl-tRNA synthetase, cytoplasmic QSNS*YDMFM o RGEEILSGAQ d R Olfactory receptor S*IS*FLGCALQMVIS*LGLGS*TECVLLAVMAYDRYA Olfr270 AICNPLR Isoform 2 of SWI/SNF-related matrix-associated actin-dependent regulator of GEESNESAEASS*N d WEK chromatin subfamily A containing DEAD/H box 1 FUN14 domain- NPPPQDYES*DDESYEVLDLTEYAR
187 Protein containing protein 1 Peptide Sequence 169 Δm (ppm) Percolator Score Tensin 1 HLGGSGSVVPGS*PSLDR Diphosphoinositol polyphosphate phosphohydrolase 3- ace LGGSPTN d GNS*AAPS*PPES*EP alpha Membrane-spanning 4-domains, subfamily A, MQGQEQ d T*T*M o AVVPGGAPPSENSVM o K member 4C 60S acidic ribosomal protein P1 EES*EES*EDDMGFGLFD Ep300 protein TDGKEEEEQPSTS*ATQSSPAPGQSK Isoform 1 of GAS2- like protein 1 YSGDSDSSASSAQS*GPM o GARSDDSATGSR Junctophilin-2 RSDSAPPSPVS*ATVPEEEPPAPR Putative uncharacterized protein Ring finger protein 112 Isoform 2 of CCR4- NOT transcription complex subunit 10 EVQN d DLMLQ d S*N d GS*QYSPNEIRENSPSVS*PT*ANI AAPFGLKPR ace SFM o GNSSN d SWS*HAS*FPK ac ace QEN d GSKSSSQLGGNTESSES*SETCSK ac IgE-binding protein TDNGPAYT*SQ d K [Protein ADPribosylarginine] hydrolase-like ENS*VLGSIQEELQK protein 1 Secreted seminalvesicle Ly-6 protein LNS*SGICETAETSCEAT*N d N d R Isoform 1 of Xin actin-binding repeat- ace QEGIQNSSDASQSKLACET*SQ d SHK a containing protein 2 Similar to LOC protein Cell surface glycoprotein CD200 receptor 2 M o AASAAAATAAGIAM o ATSVQSSTTVEQLS*S*S*VA EVIDQ d HSVLSAQLK ace NIT*WAS*TPDHIPDLQIS*AVALQHEGNYLCEITT*P EGNFHK ADAM DEC1 N d N d VALVALMS*HELGHALGM o K Isoform 1 of Pleckstrin homology domain-containing S*QSGVK family H member 2 Glycerol-3- phosphate acyltransferase 1, mitochondrial SDEEDEDS*DFGEEQR
188 Protein COMM domaincontaining protein 4 Ankyrin repeat and SOCS box protein 7 22 kda protein Vomeronasal 2, receptor 95 Ras GTPaseactivating proteinbinding protein 1 Transformation/trans cription domainassociated protein Voltage-gated potassium channel subunit beta-1 Protocadherin-21 Hypothetical protein isoform 2 Hydrocephalus inducing protein Isoform 1 of Voltage-dependent L-type calcium channel subunit beta-4 Isoform 1 of Transmembrane protein 154 ADP/ATP translocase 1 60 kda SS-A/Ro ribonucleoprotein B-cell CLL/lymphoma 9 protein THO complex subunit 1 Isoform 1 of Fibroblast growth factor receptor 3 Biorientation of chromosomes in cell division 1-like Expressed sequence AA Isoform 1 of Perilipin-4 Peptide Sequence Δm (ppm) Percolator Score VDYT*LS*SSLLHSVEEPM o VHLQLQ d VVPAPGTQAQP VSM o SLS*ADK ac ace MLYNYGADT*NTR ace AEKLS*EQ d PQS*AAS*GSSAAGPSQSK ac QGSLLN d LL AEPSKPVGHASIFK ace CTPCAVNEIS*NETDVDQ d CVK YQDEVFGGFVTEPQEES*EEEVEEPEER VLQ d HILNPAFLYSFEKGEGEQLLGPPNPEGDN d PESIT* S*VFITK ac N d EGVSSVLLGS*S*T*PEQdLIENLGAIQ d VLPK ac M o TSH VVN d EIDN d ILR ace MASSM o VAQQ d TVPTVSGSLTPQ d PSPQ d LPTPKTLGG PVQS*SLVSELKQK GDTTS*S*AET*Q d PASSSSAEGPAAK FS*VNdAVYS*K ace HS*NHSTEN d SPIER ace QEPSSQGSQS*ALQ d THELGGETLK DFLAGGIAAAVS*K ALGSVLN d AS*TVAAAMCMVVTR ace GMAADVGMGGFS*Q d GPGN d PGN d MMF ace S*GLSDLAESLTNDTET*NS* DDAT*DK ac DLSDLVS*EM o EMMK ace N d EECDGLMAS*TASCDVSN d KDSLAGSK HTEESAQMVET*PR ace DTVCAGVTS*AMNMAK
189 Protein Peptide Sequence Δm (ppm) Percolator Score Prickle-like 2 isoform a ace M o EQNQ d S*Q d SPLQ d LLSQ d CNIR Signal recognition LIDGIVLTKFDTIDDK ac VGAAISM o T*YITSK ac PIVFVGT particle receptor GQTYCDLR subunit alpha Putative uncharacterized TTS*LQ d NGT*FHLK protein Putative uncharacterized CRAS*AWASISMAS*TVHGCMR protein Nucleolar protein 12 ace QEEGSTS*QEGGGTPR Coiled-coil domaincontaining protein Q d SCTFTGSSSQ d ALVAPGN d T*PTTH Protocadherin 15 isoform CD1-4 ace ETTSTT*QPPASN d PQ d WGAEPHR Isoform 1 of DENN domain-containing ace K ac S*DSGVMLPTLR protein 5B Isoform 1 of Calcium/calmodulin -dependent protein ace MSLQ d EPSQGGPASSSNS*LDMNGR kinase kinase 2 Protein AF-10 TYTSTSNN d SISGSLNRLEDT*AAR Zinc finger, FYVE domain containing 9 ace TDLGISNSFSHSS*GELLIK Isoform 2 of Nipped-B-like protein ace Q d N d ENRPCDT*KPN d DNK Isoform 1 of Integrin beta-2-like protein Isoform 1 of LIM domain-binding protein 2 Glutamate [NMDA] receptor subunit epsilon-1 Similar to hcg Mucin 5, subtype B, tracheobronchial Clusterin-associated protein 1 Fibrillin-1 Sphingosine-1- phosphate receptor 1 Mitochondrial import receptor CLKDNS*AIK K ac N d STSST*S*NSSAGNTTN d SAGSK ace N d ISNM o S*NMN d SSR ace LLGVLATSS*SSLGFESDPETSCR ace S*GFS*K a NGVTVSLSGATTM o SVNISTIGTIIT*FDGNI FQIWLPYR SGS*NDDSDIDIQEDDES*DSELEDR ace CDEGYES*GFM o M o M o K ac N d CMDIDECQ d R DDGDN d PET*IMSSGN d VNSSS ace AAAVAAAGAGEPLS*PEELLPK
190 Protein subunit TOM22 homolog Isoform 2 of Tumor protein 63 Similar to E04Rik protein isoform 5 Trifunctional enzyme subunit alpha, mitochondrial Isoform 3 of A kinase anchor protein 1, mitochondrial Cytochrome b-c1 complex subunit 2, mitochondrial Branched chain keto acid dehydrogenase E1, alpha polypeptide Peptide Sequence Δm (ppm) Percolator Score Q d T*SMQ d SQ d SSYGN d SSPPLNK ac MN d SM o N d K ac TMLDM o N d EMTQSIIGS*MQYSK AGLEQGSDAGYLAES*QK RLS*EEACPGVLSVAPTVTQPPGR AVAQGNLSS*ADVQAAK IGHHSTSDDS*SAYR
191 Table 4.3 Protein Peptide Sequence Hits Ratio Source Percolator Score Δm (ppm) Alpha-crystallin B chain APS*WIDTGLSEMR ±0.00 Both Uncharacterized protein C6orf203 EADEEDS*DEETS(*)YPER ±0.23 Both homolog Mitochondrial import receptor subunit TOM20 IVS*AQSLAEDDVE ±0.00 Both homolog Isoform A of Heat shock protein beta-1 QLS*SGVSEIR ±0.08 LOCATE Cardiac phospholamban a RAS*T(*)IEMPQQAR ±0.05 Both Pyruvate dehydrogenase E1 component subunit alpha, somatic form, mitochondrial Ubiquinone biosynthesis protein COQ9, mitochondrial EH domaincontaining protein 2 ATP synthase subunit alpha, mitochondrial Creatine kinase S- type, mitochondrial Electron transfer flavoproteinubiquinone oxidoreductase, mitochondrial Isoform 1 of Mitochondrial fission factor ATP synthase subunit alpha, mitochondrial Isoform 1 of CAP- Gly domaincontaining linker protein 4 YHGHS(*)MS*DPGVSYR ±0.43 Both YTDQS*GEEEEDYESEEQLQHR ±0.37 Both GPDEAIEDGEEGS*EDDAEWV VTK ±0.27 LOCATE ILGADT*S(*)VDLEETGR ±0.52 Both LGYILTCPS(*)NLGT*GLR ±0.32 Both NLS*IYDGPEQR ±0.51 Both NDS*IVTPSPPQAR ±0.30 UniProt TGTAEMS(*)S*ILEER ±0.78 Both TVAENDAAQ d PGSMSSSSSS*SS LDHK 1 -- LOCATE FUN14 domaincontaining protein 1 YAR NPPPQDYES*DDESYEVLDLTE 1 -- LOCATE S acidic EES*EES*EDDMGFGLFD 1 -- LOCATE
192 Protein Peptide Sequence Hits Ratio Source ribosomal protein P1 Ring finger protein 112 Percolator Score Δm (ppm) ace SFM o GNSSN d SWS*HAS*FPK ac 1 -- LOCATE IgE-binding protein TDNGPAYT*SQ d K 1 -- LOCATE [Protein ADPribosylarginine] hydrolase-like protein 1 Glycerol-3- phosphate acyltransferase 1, mitochondrial COMM domaincontaining protein 4 Voltage-gated potassium channel subunit beta-1 Protocadherin-21 ENS*VLGSIQEELQK 1 -- LOCATE SDEEDEDS*DFGEEQR 1 -- Both VDYT*LS*SSLLHSVEEPM o VHL QLQ d VVPAPGTQAQPVSM o SLS* ADK ac 1 -- LOCATE N d EGVSSVLLGS*S*T*PEQ d LIEN LGAIQ d VLPK ac M o TSHVVN d EIDN 1 -- LOCATE d ILR ace MASSM o VAQQ d TVPTVSGSLT PQ d PSPQ d LPTPKTLGGPVQS*SL 1 -- LOCATE VSELKQK Hydrocephalus FS*VN d AVYS*K 1 -- LOCATE inducing protein ADP/ATP DFLAGGIAAAVS*K 1 -- Both translocase 1 Isoform 1 of DTVCAGVTS*AMNMAK 1 -- LOCATE Perilipin-4 Signal recognition LIDGIVLTKFDTIDDK ac VGAAIS particle receptor M o T*YITSK ac PIVFVGTGQTYCD 1 -- LOCATE subunit alpha LR Putative uncharacterized TTS*LQ d NGT*FHLK 1 -- LOCATE protein Protocadherin 15 ETTSTT*QPPASN d PQ d WGAEP 1 -- LOCATE isoform CD1-4 HR Isoform 1 of DENN domain-containing K ac S*DSGVMLPTLR 1 -- LOCATE protein 5B Clusterin-associated SGS*NDDSDIDIQEDDES*DSEL 1 -- LOCATE protein 1 EDR Mitochondrial import receptor AAAVAAAGAGEPLS*PEELLP 1 -- Both subunit TOM22 K homolog Trifunctional enzyme subunit AGLEQGSDAGYLAES*QK 1 -- Both alpha, mitochondrial Isoform 3 of A RLS*EEACPGVLSVAPTVTQPPG 1 -- Both
193 Protein Peptide Sequence Hits Ratio Source kinase anchor protein 1, mitochondrial Cytochrome b-c1 complex subunit 2, mitochondrial Branched chain keto acid dehydrogenase E1, alpha polypeptide R Percolator Score Δm (ppm) AVAQGNLSS*ADVQAAK 1 -- Both IGHHSTSDDS*SAYR 1 -- Both
194 4.8 Figure Legends Figure 4.1 Workflow of comparative quantitative phosphoproteomics of mitochondria from control mouse hearts and hearts rendered ischemic. Mitochondria were isolated from both normally perfused and global ischemic mouse hearts. Next mitochondrial proteins were extracted by methanol/chloroform precipitation. Precipitated proteins were solubilized in Rapigest detergent and the protein concentration was determined using a BCA kit. From each sample 1 mg of protein was trypsinized in the presence of Rapigest. The resultant tryptic peptides were passed through a titanium dioxide micro column for the selective enrichment of phosphopeptides. The phosphopeptides were then desalted and modified with light thiocholine (control) and heavy thiocholine (ischemic). Control and ischemic samples were mixed together, desalted and analyzed using LC-MS/MS. The mass spectrometry data were searched using MASCOT and re-scored by Percolator program to yield the identification of the peptide. Quantitative information was obtained from the relative peak intensity of the molecular ions of the phosphopeptides modified by light and heavy thiocholine respectively. Proteins of mitochondrial origin were confirmed using both the UniProt and LOCATE databases. Figure 4.2 The total ion chromatography (TIC) (0-185 min) obtained from a representative sample using LTQ-Orbitrap as described in Materials and Methods (A). The extracted ion chromatography (XIC) (0-185 min) of the full-mass scans 176
195 from the TIC (B). Figure 4.3 Fragmentation of the heavy thiocholine-modified peptide YHGHS*MSDPGVSYR identified in the subunit α of pyruvate dehydrogenase E1 at both the MS 2 and MS 3 levels. All fragment ions resulting from heavy thiocholinemodified peptides are presented in capital letters (e.g., A, B and Y). All fragment ions resulting from light thiocholine-modified peptides are presented in lower case letters (e.g., a, b and y). A. The product-ion spectrum of the quadruply charged molecular ion modified by heavy thiocholine at m/z (YHGHS*MSDPGVSYR) was obtained with an ESI-LTQ- Orbitrap instrument as described in the Materials and Methods. Shown in the spectrum are the series of B ions, B +2 8 at m/z 510.9, B at m/z 588.2, B at m/z 637.5, B at m/z Also shown in the spectrum is an example of the diagnostic triad consisting of the B fragmentation ions resulting from peptide bond cleavage (m/z = 510.9) and further neutral loss of 13 C,d 3 -trimethylamine (-63 Da, m/z = 556.8) or the 13 C,d 3 - thiocholine thiolate (-123 Da, m/z = 526.7). S* indicates the thiocholine-modified site. B. The expanded product-ion spectrum of the quadruply charged molecular ion modified by heavy thiocholine at m/z (YHGHS*MSDPGVSYR) ranging from m/z 380 to m/z 640. As shown in the spectrum, the heavy thiocholine containing B ions are accompanied by the corresponding light thiocholine containing b ions resulting from the fragmentation of the light thiocholine-modified molecular ion at m/z (YHGHS*MSDPGVSYR) that could not be excluded during the data-dependent 177
196 dissociation, thereby generating a series of B/b ion doublets at the MS 2 level with relative ratios that further confirmed the comparative quantitation at the molecular level. C. The MS 3 spectrum of the B ion at m/z resulting from the fragmentation of the quadruply charged molecular ion modified by heavy thiocholine at m/z (YHGHS*MSDPGVSYR) obtained with an ESI-LTQ-Orbitrap as described in the Materials and Methods. The ion peak at m/z corresponds to the doubly charged fragment ion generated from the neutral loss of 13 C,d 3- trimethylamine (-63 Da) from the parent ion B D. The MS 3 spectrum of the B ion at m/z resulting from the fragmentation of the quadruply charged molecular ion modified by heavy thiocholine at m/z (YHGHS*MSDPGVSYR) obtained with an ESI-LTQ-Orbitrap as described in the Materials and Methods. The ion peak at m/z corresponds to the doubly charged fragment ion generated from the neutral loss of 13 C,d 3- trimethylamine (-63 Da) from the parent ion B E. The MS 3 spectrum of the B +2 8 ion at m/z resulting from the fragmentation of the quadruply charged molecular ion modified by heavy thiocholine at m/z (YHGHS*MSDPGVSYR) obtained with an ESI-LTQ-Orbitrap as described in the Materials and Methods. The ion peak at m/z corresponds to the doubly charged fragment ion generated from the neutral loss of 13 C,d 3- trimethylamine (-63 Da) from the parent ion B F. The MS 3 spectrum of the B ion at m/z resulting from the fragmentation of the quadruply charged molecular ion modified by heavy thiocholine at m/z
197 (YHGHS*MSDPGVSYR) obtained with an ESI-LTQ-Orbitrap as described in the Materials and Methods. The ion peak at m/z corresponds to the triply charged fragment ion generated from the neutral loss of 13 C,d 3- trimethylamine (-63 Da) from the parent ion B Figure 4.4 Workflow of MASCOT Percolator reproduced with permission from Journal of Proteome Research, 2009, 8, by M, Brosch, L. Yu, T. Hubbard, and J. Choudhary. Figure 4.5 Comparative quantitation of light and heavy thiocholine-modified peptides. Relative changes in phosphorylation were evaluated for all phosphopeptides identified in three or more independent replicate samples as described in the Materials and Methods. Evident in the spectrum is the M + 4 doublet pattern of the quadruply charged molecular ions of light and heavy thiocholine-modified YHGHS*MSDPGVSYR at m/z and respectively. The greater peak intensity of the heavy thiocholinemodified YHGHS*MSDPGVSYR indicates that the phosphorylation level was increased for this peptide during induced cardiac ischemia. The relative ratio of the light and heavy molecular ion S* indicates that the phosphoserine residue was either modified by light or heavy thiocholine. 179
198 Figure 4.6 Tandem mass spectra of manually verified mitochondrial peptides with a score greater than 7 and less than 13. All fragment ions resulting from heavy thiocholine-modified peptides are presented in capital letters (e.g., A, B and Y). All fragment ions resulting from light thiocholine-modified peptides are presented in lower case letters (e.g., a, b and y). A. The product-ion spectrum of the triply charged molecular ion of AGLEQGSDAGYLAES*QK originating from protein trifunctional enzyme subunit α, modified by heavy thiocholine at m/z was obtained with an ESI-LTQ-Orbitrap instrument as described in the Materials and Methods. S* indicates the thiocholinemodified site. B. The product-ion spectrum of the triply charged molecular ion of AVAQGNLSS*ADVQAAK originating from protein cytochrome b-c1 complex subunit 2, modified by light thiocholine at m/z was obtained with an ESI-LTQ-Orbitrap instrument as described in the Materials and Methods. S* indicates the thiocholinemodified site. C. The product-ion spectrum of the quadruply charged molecular ion of IGHHSTSDDS*SAYR originating from protein branched chain keto acid dehydrogenase E1-α polypeptide, modified by light thiocholine at m/z was obtained with an ESI-LTQ-Orbitrap instrument as described in the Materials and Methods. S* indicates the thiocholine-modified site. D. The product-ion spectrum of the triply charged molecular ion of 180
199 RLS*EEACPGVLSVAPTVTQPPGR originating from protein isoform 3 of A kinase anchor protein 1, modified by heavy thiocholine at m/z was obtained with an ESI-LTQ-Orbitrap instrument as described in the Materials and Methods. S* indicates the thiocholine-modified site. 181
200 Figure
201 Figure
202 Figure
203 185
204 186

205 Figure
Mass Spectrometry. Mass spectrometer MALDI-TOF ESI/MS/MS. Basic components. Ionization source Mass analyzer Detector
 Mass Spectrometry MALDI-TOF ESI/MS/MS Mass spectrometer Basic components Ionization source Mass analyzer Detector 1 Principles of Mass Spectrometry Proteins are separated by mass to charge ratio (limit
2. Ionization Sources 3. Mass Analyzers 4. Tandem Mass Spectrometry
 Dr. Sanjeeva Srivastava 1. Fundamental of Mass Spectrometry Role of MS and basic concepts 2. Ionization Sources 3. Mass Analyzers 4. Tandem Mass Spectrometry 2 1 MS basic concepts Mass spectrometry - technique
Fundamentals of Soft Ionization and MS Instrumentation
 Fundamentals of Soft Ionization and MS Instrumentation Ana Varela Coelho varela@itqb.unl.pt Mass Spectrometry Lab Analytical Services Unit Index Mass spectrometers and its components Ionization methods:
Lecture 3. Tandem MS & Protein Sequencing
 Lecture 3 Tandem MS & Protein Sequencing Nancy Allbritton, M.D., Ph.D. Department of Physiology & Biophysics 824-9137 (office) nlallbri@uci.edu Office- Rm D349 Medical Science D Bldg. Tandem MS Steps:
PTM Discovery Method for Automated Identification and Sequencing of Phosphopeptides Using the Q TRAP LC/MS/MS System
 Application Note LC/MS PTM Discovery Method for Automated Identification and Sequencing of Phosphopeptides Using the Q TRAP LC/MS/MS System Purpose This application note describes an automated workflow
Mass Spectrometry. - Introduction - Ion sources & sample introduction - Mass analyzers - Basics of biomolecule MS - Applications
 - Introduction - Ion sources & sample introduction - Mass analyzers - Basics of biomolecule MS - Applications Adapted from Mass Spectrometry in Biotechnology Gary Siuzdak,, Academic Press 1996 1 Introduction
Biological Mass spectrometry in Protein Chemistry
 Biological Mass spectrometry in Protein Chemistry Tuula Nyman Institute of Biotechnology tuula.nyman@helsinki.fi MASS SPECTROMETRY is an analytical technique that identifies the chemical composition of
Biological Mass Spectrometry. April 30, 2014
 Biological Mass Spectrometry April 30, 2014 Mass Spectrometry Has become the method of choice for precise protein and nucleic acid mass determination in a very wide mass range peptide and nucleotide sequencing
PHOSPHOPEPTIDE ANALYSIS USING IMAC SAMPLE PREPARATION FOLLOWED BY MALDI-MS and MALDI PSD MX
 PHOSPHOPEPTIDE ANALYSIS USING IMAC SAMPLE PREPARATION FOLLOWED BY MALDI-MS and MALDI PSD MX E. Claude 1, E. Emekwue 2, M. Snel 1, T. McKenna 1 and J. Langridge 1 1: Waters Corporation, Manchester, UK 2:
Proteins: Proteomics & Protein-Protein Interactions Part I
 Proteins: Proteomics & Protein-Protein Interactions Part I Jesse Rinehart, PhD Department of Cellular & Molecular Physiology Systems Biology Institute DNA RNA PROTEIN DNA RNA PROTEIN Proteins: Proteomics
Solving practical problems. Maria Kuhtinskaja
 Solving practical problems Maria Kuhtinskaja What does a mass spectrometer do? It measures mass better than any other technique. It can give information about chemical structures. What are mass measurements
Metabolomics: quantifying the phenotype
 Metabolomics: quantifying the phenotype Metabolomics Promises Quantitative Phenotyping What can happen GENOME What appears to be happening Bioinformatics TRANSCRIPTOME What makes it happen PROTEOME Systems
Mass Spectrometry Course Árpád Somogyi Chemistry and Biochemistry MassSpectrometry Facility) University of Debrecen, April 12-23, 2010
 University of Debrecen, April 12-23, 2010") Mass Spectrometry Course Árpád Somogyi Chemistry and Biochemistry MassSpectrometry Facility) University of Debrecen, April 12-23, 2010 Introduction, Ionization Methods Mass Analyzers, Ion Activation Methods
Mass Spectrometry Course Árpád Somogyi Chemistry and Biochemistry MassSpectrometry Facility) University of Debrecen, April 12-23, 2010 Introduction, Ionization Methods Mass Analyzers, Ion Activation Methods
REDOX PROTEOMICS. Roman Zubarev.
 REDOX PROTEOMICS Roman Zubarev Roman.Zubarev@ki.se Physiological Chemistry I, Department for Medical Biochemistry & Biophysics, Karolinska Institutet, Stockholm What is (RedOx) Proteomics? Proteomics -
Protein sequence mapping is commonly used to
 Reproducible Microwave-Assisted Acid Hydrolysis of Proteins Using a Household Microwave Oven and Its Combination with LC-ESI MS/MS for Mapping Protein Sequences and Modifications Nan Wang and Liang Li
Quantification with Proteome Discoverer. Bernard Delanghe
 Quantification with Proteome Discoverer Bernard Delanghe Overview: Which approach to use? Proteome Discoverer Quantification Method What When to use Metabolic labeling SILAC Cell culture systems Small
Phosphorylation of proteins Steve Barnes Feb 19th, 2002 in some cases, proteins are found in a stable, hyperphosphorylated state, e.g.
 Phosphorylation of proteins Steve Barnes Feb 19th, 2002 in some cases, proteins are found in a stable, hyperphosphorylated state, e.g., casein more interestingly, in most other cases, it is a transient
Ionization Methods. Neutral species Charged species. Removal/addition of electron(s) Removal/addition of proton(s)
 Removal/addition of proton(s)") Ionization Methods Neutral species Charged species Removal/addition of electron(s) M + e - (M +. )* + 2e - electron ionization Removal/addition of proton(s) M + (Matrix)-H MH + + (Matrix) - chemical ionization
Ionization Methods Neutral species Charged species Removal/addition of electron(s) M + e - (M +. )* + 2e - electron ionization Removal/addition of proton(s) M + (Matrix)-H MH + + (Matrix) - chemical ionization
MALDI-TOF. Introduction. Schematic and Theory of MALDI
 MALDI-TOF Proteins and peptides have been characterized by high pressure liquid chromatography (HPLC) or SDS PAGE by generating peptide maps. These peptide maps have been used as fingerprints of protein
Introduction to Proteomics 1.0
 Introduction to Proteomics 1.0 CMSP Workshop Pratik Jagtap Managing Director, CMSP Objectives Why are we here? For participants: Learn basics of MS-based proteomics Learn what s necessary for success using
Ion Source. Mass Analyzer. Detector. intensity. mass/charge
 Proteomics Informatics Overview of spectrometry (Week 2) Ion Source Analyzer Detector Peptide Fragmentation Ion Source Analyzer 1 Fragmentation Analyzer 2 Detector b y Liquid Chromatography (LC)-MS/MS
Chapter 3. Protein Structure and Function
 Chapter 3 Protein Structure and Function Broad functional classes So Proteins have structure and function... Fine! -Why do we care to know more???? Understanding functional architechture gives us POWER
CONTENT. i iv ix. SVKM s NMIMS, School of Pharmacy and Technology Management
 CONTENT Chapter No. Title Page No. Abbreviations List of Figures List of Tables 1 Introduction 1 1.1 Practical aspects 4 1.2 Stability-indicating assay method (SIAM) 5 1.3 Regulatory aspects 6 1.4 Techniques
Comparison of mass spectrometers performances
 Comparison of mass spectrometers performances Instrument Mass Mass Sensitivity resolution accuracy Quadrupole 1 x 10 3 0.1 Da* 0.5-1.0 pmol DE-MALDI 2 x 10 4 20 ppm 1-10 fmol peptide 1-5 pmol protein Ion
Tala Saleh. Ahmad Attari. Mamoun Ahram
 23 Tala Saleh Ahmad Attari Minna Mushtaha Mamoun Ahram In the previous lecture, we discussed the mechanisms of regulating enzymes through inhibitors. Now, we will start this lecture by discussing regulation
Application of a new capillary HPLC- ICP-MS interface to the identification of selenium-containing proteins in selenized yeast
 Application of a new capillary HPLC- ICP-MS interface to the identification of selenium-containing proteins in selenized yeast Application note Food supplements Authors Juliusz Bianga and Joanna Szpunar
Time (min) Supplementary Figure 1: Gas decomposition products of irradiated DMC.
 Supplementary Figure 1: Gas decomposition products of irradiated DMC.") 200000 C 2 CH 3 CH 3 DMC 180000 160000 140000 Intensity 120000 100000 80000 60000 40000 C 2 H 6 CH 3 CH 2 CH 3 CH 3 CCH 3 EMC DEC 20000 C 3 H 8 HCCH 3 5 10 15 20 25 Time (min) Supplementary Figure 1: Gas
200000 C 2 CH 3 CH 3 DMC 180000 160000 140000 Intensity 120000 100000 80000 60000 40000 C 2 H 6 CH 3 CH 2 CH 3 CH 3 CCH 3 EMC DEC 20000 C 3 H 8 HCCH 3 5 10 15 20 25 Time (min) Supplementary Figure 1: Gas
MASS SPECTROMETRY BASED METABOLOMICS. Pavel Aronov. ABRF2010 Metabolomics Research Group March 21, 2010
 MASS SPECTROMETRY BASED METABOLOMICS Pavel Aronov ABRF2010 Metabolomics Research Group March 21, 2010 Types of Experiments in Metabolomics targeted non targeted Number of analyzed metabolites is limited
4th Multidimensional Chromatography Workshop Toronto (January, 2013) Herman C. Lam, Ph.D. Calibration & Validation Group
 Herman C. Lam, Ph.D. Calibration & Validation Group") 4th Multidimensional Chromatography Workshop Toronto (January, 2013) Herman C. Lam, Ph.D. Calibration & Validation Group MDLC for Shotgun Proteomics Introduction General concepts Advantages Challenges
4th Multidimensional Chromatography Workshop Toronto (January, 2013) Herman C. Lam, Ph.D. Calibration & Validation Group MDLC for Shotgun Proteomics Introduction General concepts Advantages Challenges
New Instruments and Services
 New Instruments and Services Liwen Zhang Mass Spectrometry and Proteomics Facility The Ohio State University Summer Workshop 2016 Thermo Orbitrap Fusion http://planetorbitrap.com/orbitrap fusion Thermo
Supporting Information. Lysine Propionylation to Boost Proteome Sequence. Coverage and Enable a Silent SILAC Strategy for
 Supporting Information Lysine Propionylation to Boost Proteome Sequence Coverage and Enable a Silent SILAC Strategy for Relative Protein Quantification Christoph U. Schräder 1, Shaun Moore 1,2, Aaron A.
Advances in Hybrid Mass Spectrometry
 The world leader in serving science Advances in Hybrid Mass Spectrometry ESAC 2008 Claire Dauly Field Marketing Specialist, Proteomics New hybrids instruments LTQ Orbitrap XL with ETD MALDI LTQ Orbitrap
Proteomics/Peptidomics
 Proteomics/Peptidomics System biology tools and preclinical models for translational research in endometriosis, ESHRE Campus workshop, 4-5 September 2009 E. Waelkens Proteomics: What? Proteins Proteomics
One Gene, Many Proteins. Applications of Mass Spectrometry to Proteomics. Why Proteomics? Raghothama Chaerkady, Ph.D.
 Applications of Mass Spectrometry to Proteomics Raghothama Chaerkady, Ph.D. McKusick-Nathans Institute of Genetic Medicine and the Department of Biological Chemistry Why Proteomics? One Gene, Many Proteins
Mass Spectrometry and Proteomics - Lecture 4 - Matthias Trost Newcastle University
 Mass Spectrometry and Proteomics - Lecture 4 - Matthias Trost Newcastle University matthias.trost@ncl.ac.uk previously Peptide fragmentation Hybrid instruments 117 The Building Blocks of Life DNA RNA Proteins
130327SCH4U_biochem April 09, 2013
 Option B: B1.1 ENERGY Human Biochemistry If more energy is taken in from food than is used up, weight gain will follow. Similarly if more energy is used than we supply our body with, weight loss will occur.
Methods in Mass Spectrometry. Dr. Noam Tal Laboratory of Mass Spectrometry School of Chemistry, Tel Aviv University
 Methods in Mass Spectrometry Dr. Noam Tal Laboratory of Mass Spectrometry School of Chemistry, Tel Aviv University Sample Engineering Chemistry Biology Life Science Medicine Industry IDF / Police Sample
Learning Objectives. Overview of topics to be discussed 10/25/2013 HIGH RESOLUTION MASS SPECTROMETRY (HRMS) IN DISCOVERY PROTEOMICS
 IN DISCOVERY PROTEOMICS") HIGH RESOLUTION MASS SPECTROMETRY (HRMS) IN DISCOVERY PROTEOMICS A clinical proteomics perspective Michael L. Merchant, PhD School of Medicine, University of Louisville Louisville, KY Learning Objectives
HIGH RESOLUTION MASS SPECTROMETRY (HRMS) IN DISCOVERY PROTEOMICS A clinical proteomics perspective Michael L. Merchant, PhD School of Medicine, University of Louisville Louisville, KY Learning Objectives
LOCALISATION, IDENTIFICATION AND SEPARATION OF MOLECULES. Gilles Frache Materials Characterization Day October 14 th 2016
 LOCALISATION, IDENTIFICATION AND SEPARATION OF MOLECULES Gilles Frache Materials Characterization Day October 14 th 2016 1 MOLECULAR ANALYSES Which focus? LOCALIZATION of molecules by Mass Spectrometry
Enhancing Sequence Coverage in Proteomics Studies by Using a Combination of Proteolytic Enzymes
 Enhancing Sequence Coverage in Proteomics Studies by Using a Combination of Proteolytic Enzymes Dominic Baeumlisberger 2, Christopher Kurz 3, Tabiwang N. Arrey, Marion Rohmer 2, Carola Schiller 3, Thomas
Nature Methods: doi: /nmeth.3177
 Supplementary Figure 1 Characterization of LysargiNase, trypsin and LysN missed cleavages. (a) Proportion of peptides identified in LysargiNase and trypsin digests of MDA-MB-231 cell lysates carrying 0,
Previous Class. Today. Detection of enzymatic intermediates: Protein tyrosine phosphatase mechanism. Protein Kinase Catalytic Properties
 Previous Class Detection of enzymatic intermediates: Protein tyrosine phosphatase mechanism Today Protein Kinase Catalytic Properties Protein Phosphorylation Phosphorylation: key protein modification
MASS SPECTROMETRIC CHARACTERIZATION OF ELASTIN PEPTIDES AND THE EFFECT OF SOLAR RADIATION ON ELASTIN. Dissertation
 MASS SPECTROMETRIC CHARACTERIZATION OF ELASTIN PEPTIDES AND THE EFFECT OF SOLAR RADIATION ON ELASTIN Dissertation zur Erlangung des akademischen Grades Doktor rerum naturalium (Dr. rer. nat.) vorgelegt
Chapter 3. Structure of Enzymes. Enzyme Engineering
 Chapter 3. Structure of Enzymes Enzyme Engineering 3.1 Introduction With purified protein, Determining M r of the protein Determining composition of amino acids and the primary structure Determining the
Applications of HPLC-MALDI-TOF MS/MS Phosphoproteomic Analysis in Oncological Clinical Diagnostics
 Current Proteomics, 2011, 8, 153-167 153 Applications of HPLC-MALDI-TOF MS/MS Phosphoproteomic Analysis in Oncological Clinical Diagnostics Courtney L. Haddock*,1, Barry Holtz 1, Neil Senzer 1,2,3,4 and
Chapter 11: Enzyme Catalysis
 Chapter 11: Enzyme Catalysis Matching A) high B) deprotonated C) protonated D) least resistance E) motion F) rate-determining G) leaving group H) short peptides I) amino acid J) low K) coenzymes L) concerted
AMINO ACIDS STRUCTURE, CLASSIFICATION, PROPERTIES. PRIMARY STRUCTURE OF PROTEINS
 AMINO ACIDS STRUCTURE, CLASSIFICATION, PROPERTIES. PRIMARY STRUCTURE OF PROTEINS Elena Rivneac PhD, Associate Professor Department of Biochemistry and Clinical Biochemistry State University of Medicine
CHM 424L Organic Laboratory, Dr. Laurie S. Starkey Introduction to Mass Spectrometry
 CM 424L rganic Laboratory, Dr. Laurie S. Starkey Introduction to Mass Spectrometry Mass spectrometry is used to determine a sample's molecular mass and molecular formula. Some structural information can
4.2 RESULTS AND DISCUSSION
 phosphorylated proteins on treatment with Erlotinib.This chapter describes the finding of the SILAC experiment. 4.2 RESULTS AND DISCUSSION This is the first global report of its kind using dual strategies
for the Identification of Phosphorylated Peptides
 Application of a Data Dependent Neutral-Loss Experiment on the Finnigan LTQ for the Identification of Phosphorylated Peptides Gargi Choudhary Diane Cho Thermo Electron, San Jose, CA Abstracted from posters
Measuring Lipid Composition LC-MS/MS
 Project: Measuring Lipid Composition LC-MS/MS Verification of expected lipid composition in nanomedical controlled release systems by liquid chromatography tandem mass spectrometry AUTHORED BY: DATE: Sven
Analysis of Alcohol and Alkylphenol Polyethers via Packed Column Supercritical Fluid Chromatography. Brian Jeffrey Hoffman
 Analysis of Alcohol and Alkylphenol Polyethers via Packed Column Supercritical Fluid Chromatography by Brian Jeffrey Hoffman Dissertation submitted to the Graduate Faculty of Virginia Polytechnic Institute
Relative Quantitation of Human Polymorphonuclear Leukocyte Cell Membrane GPEtn Lipids
 Relative Quantitation of Human Polymorphonuclear Leukocyte Cell Membrane GPEtn Lipids Using the QTRAP System with mtraq Reagents Karin A. Zemski-Berry 1, John M. Hevko 2, and Robert C. Murphy 1 1 Department
Enzymes Part III: regulation II. Dr. Mamoun Ahram Summer, 2017
 Enzymes Part III: regulation II Dr. Mamoun Ahram Summer, 2017 Advantage This is a major mechanism for rapid and transient regulation of enzyme activity. A most common mechanism is enzyme phosphorylation
Proteins are sometimes only produced in one cell type or cell compartment (brain has 15,000 expressed proteins, gut has 2,000).
.") Lecture 2: Principles of Protein Structure: Amino Acids Why study proteins? Proteins underpin every aspect of biological activity and therefore are targets for drug design and medicinal therapy, and in
Lecture 2: Principles of Protein Structure: Amino Acids Why study proteins? Proteins underpin every aspect of biological activity and therefore are targets for drug design and medicinal therapy, and in
Lipid Analysis ISOLATION, SEPARATION, IDENTIFICATION AND. Bridgwater, England LIPIDOMIC ANALYSIS. Fourth Edition. Invergowrie, Dundee, Scotland
 Lipid Analysis ISOLATION, SEPARATION, IDENTIFICATION AND LIPIDOMIC ANALYSIS Fourth Edition WILLIAM W.CHRISTIE MRS Lipid Analysis Unit, Scottish Crop Research Institute, Dundee, Scotland Invergowrie, and
Biomolecular Mass Spectrometry
 Lipids ot different than other organic small molecules Carbohydrates Polymers of monosaccharides linked via glycosidic bonds (acetals/ ketals) many different combinationsvery interesting no time ucleic
Supporting information
 Supporting information Figure legends Supplementary Table 1. Specific product ions obtained from fragmentation of lithium adducts in the positive ion mode comparing the different positional isomers of
Agilent Protein In-Gel Tryptic Digestion Kit
 Agilent 5188-2749 Protein In-Gel Tryptic Digestion Kit Agilent Protein In-Gel Tryptic Digestion Kit Instructions Kit Contents The Protein In-Gel Tryptic Digestion Kit includes sufficient reagents for approximately
Structural Elucidation of N-glycans Originating From Ovarian Cancer Cells Using High-Vacuum MALDI Mass Spectrometry
 PO-CON1347E Structural Elucidation of N-glycans Originating From Ovarian Cancer Cells Using High-Vacuum MALDI Mass Spectrometry ASMS 2013 TP-708 Matthew S. F. Choo 1,3 ; Roberto Castangia 2 ; Matthew E.
Applying a Novel Glycan Tagging Reagent, RapiFluor-MS, and an Integrated UPLC-FLR/QTof MS System for Low Abundant N-Glycan Analysis
 Applying a Novel Glycan Tagging Reagent, RapiFluor-MS, and an Integrated UPLC-FLR/QTof MS System for Low Abundant N-Glycan Analysis Ying Qing Yu Waters Corporation, Milford, MA, USA APPLICATION BENEFITS
Protein Identification and Phosphorylation Site Determination by de novo sequencing using PepFrag TM MALDI-Sequencing kit
 Application Note Tel: +82-54-223-2463 Fax : +82-54-223-2460 http://www.genomine.com venture ldg 306 Pohang techno park Pohang, kyungbuk, Korea(ROK) Protein Identification and Phosphorylation Site Determination
Tandem mass spectrometry is becoming the
 Fragmentation of Phosphopeptides in an Ion Trap Mass Spectrometer Jon P. DeGnore and Jun Qin Laboratory of Biophysical Chemistry, National Heart, Lung, and Blood Institute, National Institutes of Health,
Adenosine triphosphate (ATP)
") Adenosine triphosphate (ATP) 1 High energy bonds ATP adenosine triphosphate N NH 2 N -O O P O O P O- O- O O P O- O CH 2 H O H N N adenine phosphoanhydride bonds (~) H OH ribose H OH Phosphoanhydride bonds
Adenosine triphosphate (ATP) 1 High energy bonds ATP adenosine triphosphate N NH 2 N -O O P O O P O- O- O O P O- O CH 2 H O H N N adenine phosphoanhydride bonds (~) H OH ribose H OH Phosphoanhydride bonds
Page 1 of 5 Biochemistry I Fall 2017 Practice for Exam2 Dr. Stone Name
 Page 1 of 5 Biochemistry I Fall 2017 Practice for Exam2 Dr. Stone ame o answers will be provided. ere are some constants and equations that may be useful: K a = [+][A-]/[A] p = pka + log [A-]/[A] K a for
Chromatography Vacuum Ultraviolet Spectroscopy
 Application Note Differentiation and Determination Differentiation and Determination of Fatty Acid Methyl of Fatty Esters Acid by Gas Methyl Chromatography Esters by Vacuum Gas Ultraviolet Spectroscopy
Proteins. Amino acids, structure and function. The Nobel Prize in Chemistry 2012 Robert J. Lefkowitz Brian K. Kobilka
 Proteins Amino acids, structure and function The Nobel Prize in Chemistry 2012 Robert J. Lefkowitz Brian K. Kobilka O O HO N N HN OH Ser65-Tyr66-Gly67 The Nobel prize in chemistry 2008 Osamu Shimomura,
Mass-Spectrometric Analysis of Lipids (Lipidomics)
") Mass-Spectrometric Analysis of Lipids (Lipidomics) 1. Identification 2. Quantification 3. Metabolism Why to do lipidomics? Biology: Functions of different lipids? Medicine: Diagnostics and Therapy Industry:
Mass-Spectrometric Analysis of Lipids (Lipidomics) 1. Identification 2. Quantification 3. Metabolism Why to do lipidomics? Biology: Functions of different lipids? Medicine: Diagnostics and Therapy Industry:
Sequence Identification And Spatial Distribution of Rat Brain Tryptic Peptides Using MALDI Mass Spectrometric Imaging
 Sequence Identification And Spatial Distribution of Rat Brain Tryptic Peptides Using MALDI Mass Spectrometric Imaging AB SCIEX MALDI TOF/TOF* Systems Patrick Pribil AB SCIEX, Canada MALDI mass spectrometric
MALDI Imaging Drug Imaging Detlev Suckau Head of R&D MALDI Bruker Daltonik GmbH. December 19,
 MALDI Imaging Drug Imaging Detlev Suckau Head of R&D MALDI Bruker Daltonik GmbH December 19, 2014 1 The principle of MALDI imaging Spatially resolved mass spectra are recorded Each mass signal represents
Glycerolipid Analysis. LC/MS/MS Analytical Services
 Glycerolipid Analysis LC/MS/MS Analytical Services Molecular Characterization and Quantitation of Glycerophospholipids in Commercial Lecithins by High Performance Liquid Chromatography with Mass Spectrometric
Figure S6. A-J) Annotated UVPD mass spectra for top ten peptides found among the peptides identified by Byonic but not SEQUEST + Percolator.
 Annotated UVPD mass spectra for top ten peptides found among the peptides identified by Byonic but not SEQUEST + Percolator.") Extending Proteome Coverage by Combining MS/MS Methods and a Modified Bioinformatics Platform adapted for Database Searching of Positive and Negative Polarity 193 nm Ultraviolet Photodissociation Mass
Extending Proteome Coverage by Combining MS/MS Methods and a Modified Bioinformatics Platform adapted for Database Searching of Positive and Negative Polarity 193 nm Ultraviolet Photodissociation Mass
1. Sample Introduction to MS Systems:
 MS Overview: 9.10.08 1. Sample Introduction to MS Systems:...2 1.1. Chromatography Interfaces:...3 1.2. Electron impact: Used mainly in Protein MS hard ionization source...4 1.3. Electrospray Ioniztion:
New Instruments and Services
 New Instruments and Services http://planetorbitrap.com/orbitrap fusion Combining the best of quadrupole, Orbitrap, and ion trap mass analysis in a revolutionary Tribrid architecture, the Orbitrap Fusion
Don t miss a thing on your peptide mapping journey How to get full coverage peptide maps using high resolution accurate mass spectrometry
 Don t miss a thing on your peptide mapping journey How to get full coverage peptide maps using high resolution accurate mass spectrometry Kai Scheffler, PhD BioPharma Support Expert,LSMS Europe The world
BCH Graduate Survey of Biochemistry
 BCH 5045 Graduate Survey of Biochemistry Instructor: Charles Guy Producer: Ron Thomas Director: Glen Graham Lecture 7 Slide sets available at: http://hort.ifas.ufl.edu/teach/guyweb/bch5045/index.html David
Chapter 10. Regulatory Strategy
 Chapter 10 Regulatory Strategy Regulation of enzymatic activity: 1. Allosteric Control. Allosteric proteins have a regulatory site(s) and multiple functional sites Activity of proteins is regulated by
Introduction to Peptide Sequencing
 Introduction to Peptide equencing Quadrupole Ion Traps tructural Biophysics Course December 3, 2014 12/8/14 Introduction to Peptide equencing - athan Yates 1 Why are ion traps used to sequence peptides?
An Alternative Approach: Top-Down Bioanalysis of Intact Large Molecules Can this be part of the future? Lecture 8, Page 27
 An Alternative Approach: Top-Down Bioanalysis of Intact Large Molecules Can this be part of the future? Lecture 8, Page 27 Top-down HRAM Bioanalysis of Native Proteins/Molecules Relative Abundance 100
Quantitation of Protein Phosphorylation Using Multiple Reaction Monitoring
 Quantitation of Protein Phosphorylation Using Multiple Reaction Monitoring Application Note Authors Ning Tang, Christine A. Miller and Keith Waddell Agilent Technologies, Inc. Santa Clara, CA USA This
Mass Spectrometry Infrastructure
 Mass Spectrometry Infrastructure Todd Williams, Ph.D. Director KU Mass Spectrometry and Analytical Proteomics Laboratory Mass Spectrometry Lab B025 Malott Hall Mission The Mass Spectrometry and analytical
NIH Public Access Author Manuscript J Proteome Res. Author manuscript; available in PMC 2014 July 05.
 NIH Public Access Author Manuscript Published in final edited form as: J Proteome Res. 2013 July 5; 12(7): 3071 3086. doi:10.1021/pr3011588. Evaluation and Optimization of Mass Spectrometric Settings during
Mass Spectrometry and Proteomics - Lecture 1 - Matthias Trost Newcastle University
 Mass Spectrometry and Proteomics - Lecture 1 - Matthias Trost Newcastle University matthias.trost@ncl.ac.uk Content Lectures 1-3 The basics of mass measurement Ionisation techniques Mass analysers Detectors
Mass Spectrometry and Proteomics. Professor Xudong Yao Bioanalytical Chemistry Spring 2007
 Mass Spectrometry and Proteomics Professor Xudong Yao Bioanalytical Chemistry Spring 2007 Proteomics and -omics Roles of mass spectrometry Comparative proteomics Chemical proteomics Protein, Proteome and
Choosing the metabolomics platform
 Choosing the metabolomics platform Stephen Barnes, PhD Department of Pharmacology & Toxicology University of Alabama at Birmingham sbarnes@uab.edu Challenges Unlike DNA, RNA and proteins, the metabolome
Characterization of Noncovalent Complexes of Polyelectrolytes by Mass Spectrometry
 The University of Akron IdeaExchange@UAkron Honors Research Projects The Dr. Gary B. and Pamela S. Williams Honors College Spring 2015 Characterization of Noncovalent Complexes of Polyelectrolytes by Mass
Improve Protein Analysis with the New, Mass Spectrometry- Compatible ProteasMAX Surfactant
 Improve Protein Analysis with the New, Mass Spectrometry- Compatible Surfactant ABSTRACT Incomplete solubilization and digestion and poor peptide recovery are frequent limitations in protein sample preparation
Double charge of 33kD peak A1 A2 B1 B2 M2+ M/z. ABRF Proteomics Research Group - Qualitative Proteomics Study Identifier Number 14146
 Abstract The 2008 ABRF Proteomics Research Group Study offers participants the chance to participate in an anonymous study to identify qualitative differences between two protein preparations. We used
Glycosylation analysis of blood plasma proteins
 Glycosylation analysis of blood plasma proteins Thesis booklet Eszter Tóth Doctoral School of Pharmaceutical Sciences Semmelweis University Supervisor: Károly Vékey DSc Official reviewers: Borbála Dalmadiné
MASS SPECTROMETRY IN METABOLOMICS
 For personal use only. Please do not reuse or reproduce without the author s permission MASS SPECTRMETRY IN METABLMICS Pavel Aronov Stanford Mass Spectrometry Users Meeting August 21, 2008 rigin of Metabolomics
MS/MS Scan Modes. Eötvös University, Budapest April 16, MS/MS Scan Modes. Árpád Somogyi. Product Ion Scan Select. Scan. Precursor Ion Scan Scan
 MS/MS Modes Árpád Somogyi Eötvös University, Budapest April 16, 2012 MS/MS Modes Product Ion Precursor Ion Neutral Loss Δ ed Reaction Monitoring (SRM) 1 modes in a triple quadrupole (QqQ) (one quadrupole
Rapid, Simple Impurity Characterization with the Xevo TQ Mass Spectrometer
 Robert Plumb, Michael D. Jones, and Marian Twohig Waters Corporation, Milford, MA, USA INTRODUCTION The detection and characterization of impurities and degradation products of an active pharmaceutical
Automating Mass Spectrometry-Based Quantitative Glycomics using Tandem Mass Tag (TMT) Reagents with SimGlycan
 Reagents with SimGlycan") PREMIER Biosoft Automating Mass Spectrometry-Based Quantitative Glycomics using Tandem Mass Tag (TMT) Reagents with SimGlycan Ne uaca2-3galb1-4glc NAcb1 6 Gal NAca -Thr 3 Ne uaca2-3galb1 Ningombam Sanjib
PREMIER Biosoft Automating Mass Spectrometry-Based Quantitative Glycomics using Tandem Mass Tag (TMT) Reagents with SimGlycan Ne uaca2-3galb1-4glc NAcb1 6 Gal NAca -Thr 3 Ne uaca2-3galb1 Ningombam Sanjib
More structural information with MS n
 PRODUCT SPECIFICATIONS The LTQ XL linear ion trap mass spectrometer More structural information with MS n The LTQ XL linear ion trap mass spectrometer delivers more structural information faster and with
Organic Chemistry Laboratory Fall Lecture 3 Gas Chromatography and Mass Spectrometry June
 344 Organic Chemistry Laboratory Fall 2013 Lecture 3 Gas Chromatography and Mass Spectrometry June 19 2013 Chromatography Chromatography separation of a mixture into individual components Paper, Column,
Protein Analysis using Electrospray Ionization Mass Spectroscopy *
 OpenStax-CNX module: m38341 1 Protein Analysis using Electrospray Ionization Mass Spectroscopy * Wilhelm Kienast Andrew R. Barron This work is produced by OpenStax-CNX and licensed under the Creative Commons
Section 1 Proteins and Proteomics
 Section 1 Proteins and Proteomics Learning Objectives At the end of this assignment, you should be able to: 1. Draw the chemical structure of an amino acid and small peptide. 2. Describe the difference
Matrix Assisted Laser Desorption Ionization Time-of-flight Mass Spectrometry
 Matrix Assisted Laser Desorption Ionization Time-of-flight Mass Spectrometry Time-of-Flight Mass Spectrometry. Basic principles An attractive feature of the time-of-flight (TOF) mass spectrometer is its
(III) MALDI instrumentation
 MALDI instrumentation") Dr. Sanjeeva Srivastava (I) Basics of MALDI-TF (II) Sample preparation In-gel digestion Zip-tip sample clean-up Matrix and sample plating (III) MALDI instrumentation 2 1 (I) Basics of MALDI-TF Analyte
Dr. Sanjeeva Srivastava (I) Basics of MALDI-TF (II) Sample preparation In-gel digestion Zip-tip sample clean-up Matrix and sample plating (III) MALDI instrumentation 2 1 (I) Basics of MALDI-TF Analyte
Properties of amino acids in proteins
 Properties of amino acids in proteins one of the primary roles of DNA (but far from the only one!!!) is to code for proteins A typical bacterium builds thousands types of proteins, all from ~20 amino acids