Development of Bioanalytical Methods for Clinical Applications and Drug Screening
|
|
|
- Evan McDaniel
- 6 years ago
- Views:
Transcription


1 Cleveland State University ETD Archive 2011 Development of Bioanalytical Methods for Clinical Applications and Drug Screening Xiaohan Cai Cleveland State University How does access to this work benefit you? Let us know! Follow this and additional works at: Part of the Chemistry Commons Recommended Citation Cai, Xiaohan, "Development of Bioanalytical Methods for Clinical Applications and Drug Screening" (2011). ETD Archive. Paper 45. This Dissertation is brought to you for free and open access by It has been accepted for inclusion in ETD Archive by an authorized administrator of For more information, please contact
2 DEVELOPMENT OF BIOANALYTICAL METHODS FOR CLINICAL APPLICATIONS AND DRUG SCREENING XIAOHAN CAI Bachelor of Science in Pharmacy Huazhong University of Science and Technology JULY 2006 Master of Science in Chemistry Cleveland State University DECEMBER 2010 submitted in partial fulfillment of requirements for the degree DOCTOR OF PHILOSOPHY IN CLINICAL-BIOANALYTICAL CHEMISTRY at CLEVELAND STATE UNIVERSITY AUGUST 2011
3 This dissertation has been approved for the Department of CHEMISTRY and the College of Graduate Studies by Dissertation Chairperson, Dr. Baochuan Guo Department of CHEMISTRY Date Dr. Crystal M. Weyman Department of BIOLOGICAL, GEOLOGICAL, and ENVIRONMENTAL SCIENCE Date Dr. Xue-Long Sun Department of CHEMISTRY Date Dr. Aimin Zhou Department of CHEMISTRY Date Dr. Xiang Zhou Department of CHEMISTRY Date Dr. Robert Wei Department of CHEMISTRY Date
4 ACKNOWLEDGMENTS I would like to express my appreciation to so many mentors, friends, and family members for continuous guidance and support towards the completion of this work in this long journey. My deepest gratitude goes toward to my research advisor, Dr. Baochuan Guo, who always believes in me and encourages me when I am facing challenges. His invaluable advices and insight have great influence on my work. Additionally, he provided me with many opportunities to facilitate my ability in independent research and my development as a professional. I wish to thank him for his kindness and the rewarding experience I have had in the past four years. I wish to greatly acknowledge my committee members. I thank Dr. Xiang Zhou for training me on instrumentation, offering me a great opportunity to work as an instrumentation assistant, and spending time to improve my manuscripts. I also would like to thank Dr. Crystal Weyman, Dr. Xue-Long Sun, Dr. Aimin Zhou, and Dr. Robert Wei, who have given precious suggestions on my research. I admire their insight and expertise from different areas, which inspired many ideas throughout my research. Special thanks to my colleagues Dr. Yiding Liu, Dr. Wei Meng and Dr. Naizhen Wang from Dr. Guo s group. I enjoy the friendly working environment and I appreciate for their technical help and valuable discussion. I am also grateful to have the opportunity to work
5 with Dr. Bin Su, Dr. Bo Shen, and their research group on the projects described in the thesis. Finally, I would like to express a full heart of thanks to my beloved family and wonderful friends. I am so lucky to have their love and unconditional support to motivate me for the completion of this work. I love all of you.
6 DEVELOPMENT OF BIOANALYTICAL METHODS FOR CLINICAL APPLICATIONS AND DRUG SCREENING XIAOHAN CAI ABSTRACT In the past decade, bioanalytical method development has become an integral part of clinical diagnosis, biomarker discovery, and drug discovery and development. The new and emerged bioanalytical technologies allow the quantitative and qualitative analysis of small molecules and biomolecules with high sensitivity and specificity. Specifically, the bioanalytical methods based on LC-MS and methylation-specific PCR are well suited for detecting low-abundance metabolites, proteins, and DNA in biofluids and tissues for biomarker investigation. They offer great clinical promises for early diseases diagnosis and therapeutic interventions. Besides, the LC-MS/MS quantitative method is essential for the estimation of pharmacokinetic and toxicological properties in drug screening. In this work, modern bioanalytical technologies, together with their applications from biomarker discovery and validation in metabonomics, genomics and proteomics to drug discovery, were reviewed. Dependent on the type of molecules analyzed, different methods were established to achieve accurate and reliable detection. LC-MS/(MS) methods were developed and validated for quantitative analysis of bile acids and anticancer agent JCC76. The former has been successfully applied in a clinical study for the v
7 diagnosis of inflammatory bowel diseases; and the latter has been utilized in a pharmacokinetics study for drug screening and optimization. In terms of proteomics profiling, a LC-MS/MS method was demonstrated for comparative analysis of serum peptides with the successful identification of a potential biomarker for ovarian cancer. Lastly, a comprehensive DNA methylation profiling for hepatocellular carcinoma was conducted through methylation-specific PCR methods. These methods enabled sensitive and specific detection of DNA hypermethylation on several tumor-associated genes. In addition, this work discussed a major challenge of matrix effect in quantitative method development. Possible solutions were proposed for matrix effect prevention and troubleshooting. Moreover, standard addition coupled with internal standard method and optimizing sample extraction method was illustrated for compensating or minimizing matrix effect in chapter II and chapter III, respectively. vi
8 TABLE OF CONTENTS ABSTRACT... v TABLE OF CONTENTS... vii LIST OF TABLES... xii LIST OF FIGURES... xiii CHAPTER I: INTRODUCTION OF BIOANALYTICAL METHODS FOR CLINICAL APPLICATIONS AND DRUG SCREENING General introduction of bioanalytical methods and their applications Clinical applications for biomarker studies Bioanalysis application in drug discovery and development Modern bioanalytical technologies Principles of LC-MS LC separation MS detection Quantitative LC-MS(/MS) analysis for small molecules Mobile phase optimization Sample preparation Matrix effect Mass spectrometric analysis for proteins Identification of differentially expressed protein candidates Quantitative protein analysis vii
9 PCR based methods for DNA methylation profiling Reference CHAPTER II: QUANTITATIVE ANALYSIS OF BILE ACIDS FOR INFLAMMATOGRY BOWEL DISEASES Introduction Bile acids Inflammatory Bowel Diseases Development of a quantitative bioanalytical method for fecal bile acids Challenges for method development Materials and method Chemicals Sample collection Instrumentation and LC-MS conditions Stock and work solutions Pouch aspiration calibrator and QC samples Sample treatment of calibrators and QC samples for internal calibration Sample treatment of QC and patient samples for SA-IS Matrix effect and recovery Method validation Method application Results and discussion Separation of bile acids viii
10 Matrix effect Internal standard calibration SA-IS method Method validation Method application Conclusion Reference CHAPTER III: THE DEVELOPMENT OF A ROBUST AND SENSITIVE LC-MS/MS METHOD FOR THE QUANTIFICATION OF AN ANTI-CANCER AGENT IN RAT PLASMA Introduction of novel anti-cancer agents JCC Materials and methods Reagents and chemicals LC-MS/MS instrumentation Preparation of calibration standards and QC samples Sample preparation Method validation Pharmacokinetics study Results and Discussion Mass spectrometric and chromatographic conditions Sample extraction Method validation Linearity, sensitivity and selectivity ix
11 Matrix effect and recovery Accuracy, precision, and dilution integrity Stability Pharmacokinetics study Conclusion Reference CHAPTER IV: PROTEOMICS STUDY FOR POTENTIAL BIOMARKER ANALYSIS OF OVARIAN CANCER Introduction Materials and methods Materials Patient samples Serum peptide fractionation Online peptide trap setup Serum protein analysis by LC-MS/MS Results Identification of differentially expressed low molecular weight peptides Protein fractionation method by organic solvent precipitation LC-MS/MS analysis for different sample sets Discussion Reference x
12 CHAPTER V: COMPREHENSIVE ANALYSIS OF TUMOR-ASSOCIATED DNA METHYLATION IN HEPATOCELLULAR CARCINOMA Introduction Materials and Methods Collection of clinical tissue specimen DNA isolation from liver tissues Sodium bisulfite conversion DNA methylation analysis Specificity and sensitivity of MSP Quantitative methylation analysis Results Specificity and Sensitivity of MSP Method Gene-specific promoter methylation analysis Quantitative methylation analysis Discussion Reference xi
13 LIST OF TABLES Table 2.1: Matrix effect determined in blank pouch aspiration sample No. 398 and No. 957 for bile acids at three concentrations Table 2.2: The accuracy results determined by internal standard method Table 2.3: Calibration curve results for bile acids spiked in pouch aspiration Table 2.4: Recovery of bile acids at three concentrations Table 2.5: Accuracy and intra- and inter-precision by the SA-IS method Table 2.6: Bile Acids concentrations in patient samples Table 3.1: Accuracy and Precision of JCC76 calibration standards Table 3.2: Matrix effect and recovery of JCC76 in rat plasma Table 3.3: Intra- and Inter- assay accuracy and precision of JCC76 in rat plasma Table 3.4: Stability test of JCC76 in rat plasma Table 5.1: Clinical and pathological characters of 40 HCC patients Table 5.2: The MSP primer sequences of 21 genes Table 5.3: The methylation profiles of ten tumor suppressor genes Table 5.4: Methylation status in paired samples Table 5.5: The methylation percentage of 4 genes xii
14 LIST OF FIGURES Figure 1.1: The instrumentation setup for LC separation Figure 1.2: The schematic diagram of ESI source Figure 1.3: The operation of quadrupole MS and ion-trap MS Figure 1.4: Method development workflow for small molecule bioanalysis Figure 1.5: Illustration of four steps when performing SPE Figure 1.6: The post-column infusion experiment Figure 1.7: Infusion chromatograms Figure 1.8: Bottom-up proteomics analysis using LC-MS/MS Figure 1.9: Strategy to distinguish unmethylated cytosine and methylated cytosine by bisulfite reaction Figure 1.10: Melting curve analysis Figure 2.1: Chemical structures of bile acids and internal standard NPA Figure 2.2: Bile acids metabolism Figure 2.3: IBD and its treatment by IPAA surgery Figure 2.4: The gradient elution for the separation of bile acids Figure 2.5: Representative mass chromatograms of bile acids and NPA Figure 2.6: Calibration curves of bile acids established different solution sets Figure 2.7: Illustration of SA-IS method Figure 2.8: Chromatograms of pouch aspiration bile acids Figure 3.1: Chemical structures of JCC76 and the internal standard Figure 3.2: The precursor/product ion spectra xiii
15 Figure 3.3: The comparison of matrix effect and recovery of JCC76 in rat plasma among different LLE solvents Figure 3.4: The MRM chromatograms Figure 3.5: Mean plasma concentration-time profile of JCC Figure 4.1: Previously reported MALDI-TOF-MS pattern Figure 4.2: Online peptide trap setup scheme Figure 4.3: Differentiated LC-MS/MS chromatograms Figure 4.4: MS spectrum of chromatographic peak with matched MS information with des-alanine-fpa Figure 4.5: Chromatograms with and without a chloroform-water extraction step into the sample preparation Figure 5.1: Cytosine methylation catalyzed by DNMT Figure 5.2: The amplification results of different DNA samples Figure 5.3: Standard curves constructed for DNA quantification xiv
16 CHAPTER I INTRODUCTION OF BIOANALYTICAL METHODS FOR CLINICAL APPLICATIONS AND DRUG SCREENING 1.1. General introduction of bioanalytical methods and their applications Bioanalytical science, with a focus on qualitative and quantitative measurements in biological materials, plays a key role in understanding diseases, clinical diagnosis, and drug discovery and development. The technologies in biomedical science have made significant progress over recent years. This facilitates bioanalytical method development to become an integral component of biomarker discovery, drug metabolism/pharmacokinetic (DMPK), and toxicological monitoring. Advanced technologies and enhancements of conventional platforms emerged from bioanalysis fulfill the requirements of clinical and pharmaceutical fields, including the improvement 1
17 in mass spectrometry detection, fast chromatographic separation, high-throughput sample pretreatment, and melting curve analysis with high resolution for genomic assays. Early diagnosis of diseases has great significance in improving survival rates and minimizing current invasive diagnostic procedures. This leads to another major clinical need in the accurate detection of molecular biomarkers for chronic illnesses and cancers. The biomarker study monitors different biological entities including nucleic acids, proteins, and metabolites to reflect the pathophysiology and progression of diseases. Ideal biomarkers need to be well-understood for their functions in the pathogenic processes and their values for clinical diagnostic, prognostic, and predictive outcomes. However, these molecular biomarkers often present in low abundance in the biological samples, bringing great challenges in reliable detection and validation. Although these challenges remain, there is a large number of biomarkers developed currently and to be assessed in clinical studies for their diagnostic and prognostic applications [1]. Besides the broad bioanalytical applications in biomarker discovery, the impressive growth of quantitative bioanalysis has been also well-documented in pharmaceutical drug discovery and development. In the past decade, more than 500 novel drugs were approved by U.S. Food and Drug Administration (FDA) to prevent and treat human diseases [2]. Each year, more than 3000 on-going clinical trials are carried out in the drug development phase [3]. Despite the enormous amount of lead compounds screened in the drug discovery phase, the drug development process is costly and risky with very low rate of clinical success. This drives the rational lead optimization in the earliest stage of 2
18 drug discovery to improve the likelihood of drug approval and to prevent drug withdrawal on the market. Quantitative bioanalysis serves as a major tool for understanding pharmacological properties including absorption, distribution, metabolism, and elimination (ADME), as well as toxicity to guide the drug screening for lead candidates Clinical applications for biomarker studies Biomarkers are defined as indicators of normal biological processes, pathogenic processes, or pharmacological responses to a therapeutic intervention according to the National Institutes of Health (NIH) working group [4]. Cancers are the most studied diseases for biomarker discovery since the early detection of cancers before metastasis is always desirable to greatly improve survival. With advanced technologies for molecular biomarker measurement, thousands of potential biomarker candidates have been discovered and linked with cancers. These disease-related molecules may involve in cell regulatory and post-translational modification processes as proteins, alter the expression of downstream target molecules as nucleic acids, and represent metabolic responses as endogenous small molecules. Among different biomarker discovery tools, proteomics allows the identification, characterization, and quantification of differential protein expression involved in normal and pathological states. Blood is the most commonly used sampling source for proteome profiling since blood sampling is non-invasive compared to tissue biopsy. In cancers, the 3
19 intra- and inter-cellular events happen at the tumor tissue microenvironment, introducing the changes of accumulative protein expression in the circulating blood stream. The differentiated proteomic pattern may reflect the development of malignancy and can also provide diagnostic, prognostic and predictive value for cancers. Extra-cellular nucleic acids in biofluids is another popular source of biomarker investigation, since it can reflect the cancer cell transformation induced by gene mutation or hypermethylation [5]. The circulating free DNA and cancer-specific RNA have been profiled in numerous genomic biomarker studies for the diagnosis and staging of cancer diseases. The epigenetic changes in DNA methylation are also commonly associated with tumorigenesis. Taking place in the promoter region of CpG islands, the methylation of cytosine residue in normal cells is well-maintained in a homeostasis through a feedback regulation of DNA methyltransferase mechanism [6]. The disturbances to normal cytosine methylation are fundamental contributors to the malignancy of cancer [7]: the hypermethylation of tumor suppressor genes results in the inactivation of gene transcription and thus the loss of their intrinsic functions; global change of hypomethylation in a wide area causes repeated sequences and transposable elements, ultimately resulting in the loss of genomic stability and increased mutations [8]. These aberration events are the rationales for discovering potential genomic biomarkers to aid the diagnosis, predict the clinical outcomes, and subsequently guide the therapeutic treatment. Therefore, it is of crucial importance to develop bioanalytical tools that support the profiling of aberrant methylation. 4
20 Besides the large biomolecules in cancer biomarker study, the endogenous metabolites in cells, tissues, and body fluids start to gain more interest for reflecting human health status from their quantitative information. The most common example in clinical application is the measurement of cholesterol to monitor the cardiovascular disease by physicians. The metabolic signatures of patients reflect the biochemical changes in diseases and the disturbed metabolic pathways. The analysis of glycerophospholipids, fatty acids, steroid metabolites, and bile salts have been conducted for examining abnormal lipid metabolism and interaction of intestinal microflora for liver and intestinal diseases. These research areas provide useful sources for metabolic biomarker profiling Bioanalysis applications in drug discovery and development Drug PK and toxicity properties are key parameters in the screening and optimization of lead compounds in the drug discovery phase. An ideal drug candidate should demonstrate the ability be absorbed in the blood stream, reach desirable concentration for effective activity, and be eliminated without producing toxic metabolites. High-throughput PK screening usually starts from in-vitro assays to study the drug-drug interaction and metabolism using liver microsomes and hepatocytes as experimental systems. However, the in-vitro results cannot truly represent the real physiological environment and may lead to mistaken conclusion about drug metabolism. Therefore, it is essential to assess the PK parameters in vivo to improve the candidate selection through animal models. 5
21 In order to accurately define the drug behaviors in vitro and in vivo, bioanalytical support has been a prerequisite in the pharmaceutical industry. The large amount of compounds involved in the lead optimization requires the quantitative method to be accurate, sensitive, and high-throughput to facilitate drug discovery. These requirements can be fulfilled by accurate sampling procedures, advanced chromatographic and mass spectrometric techniques, as well as automated sample preparation methods Modern bioanalytical technologies Modern bioanalytical technologies have been significantly broadened in the last decade, demonstrating its ability in accurate qualitative and quantitative determination for protein, nucleic acids, small molecular metabolites, and drugs in biological materials. The major methodologies used for proteomics investigation are based on mass spectrometry (MS). The dramatic progresses of MS instrumentation refine mass accuracy, resolution, and dynamic ranges, ensuring the successful detection of low abundance proteins in biofluids and structural confirmation with their characteristic precursor and fragment ions. In addition, the robust and reliable liquid chromatography (LC) system in low flow rate has greatly improved the sensitivity for the MS detection and confidence for structure illustration. Besides its application in protein analysis, the hyphenation of LC and MS (LC-MS) is established as the state-of-the-art methodology for the quantitation of small molecular 6
22 compounds due to its specificity and sensitivity. It is now widely accepted as the preferred method for the quantitative measurement of small molecule drugs and endogenous metabolites in various biological matrices including plasma, serum, blood, urine, intestinal fluid, and tissue. With respect to epigenetic biomarker discovery, the majority of DNA methylation assays are based on bisulfite reaction, methylation-specific PCR (MSP), and melting curve analysis. Sodium bisulfite converts cytosine to uracil at unmethylated CpG site, leaving methylated one unchanged. The MSP methods with designed primers selectively amplify methylated DNA, bringing high analytical specificity and sensitivity Principles of LC-MS LC separation LC is the basic separation platform for bioanalysis. With this technique, target analyte can be separated with interfering protein, salts, and phospholipids content in complicated biological materials. The separation mechanisms of liquid chromatography are based on the distribution of analyte between the liquid mobile phase and a stationary phase. Depending on different type of stationary phases, different distribution mechanisms are applied. 7
23 Adsorption mechanism is applied for both normal-phase (NP) chromatography and reverse-phase (RP) chromatography. In NP chromatography, the stationary phase is a polar silica gel and the mobile phase is a non-polar solvent such as hexane, pentane, and chloroform. NP chromatography is preferable for non-polar analyte and the retention decreases as the non-polarity of analyte increases. Opposite to NP chromatography, the stationary phase of RP chromatography uses non-polar silica based packing materials after the surface modification with C8, C18, or phenyl. Accordingly, the retention decreases with increasing polarity of the compound and the amount of polar solvents. RP chromatography is suitable ideally for polar and ionic compounds, which makes it the most widely used LC application. The interaction of analyte with stationary phase and mobile phase solvent greatly depends on the hydrophobicity of the analyte. Ion-exchange chromatography is based on the ion exchange equilibrium between the ionic or polar compounds with the stationary phase. With opposite charge with the ionic functional group of the stationary phase, the ionic compounds can be retained. The elution speed is related with the ionic strength of the counter-ions, ph environment, and the modifier contained in the mobile phase. Size-exclusion chromatography is usually applied in the separation of macromolecules according to their ability to penetrate into the pores of stationary material. The elution time of analyte is merely based on their size, but not molecular weight. The retention decreases as the size increases. 8
24 Besides the aforementioned traditional chromatography, there are some modern approaches for improving chromatographic resolution and separation efficiency: ultraperformance liquid chromatography (UPLC), monolithic chromatography, and hydrophilic interaction chromatography (HILIC). Underlying the same basic principle with RP-LC, UPLC utilizes column with sub-2 μm particle size and a system that can handle elevated pressure. UPLC has great advantages in resolution, sensitivity, and speed over conventional HPLC, and thus is considered as a better tool for high throughput analysis. Monolith column is packed with highly porous material, which is designed to handle fast flow rate and ensure sufficient surface for separation at the mean time. Consequently, the separation speed and sample throughput are significantly increased. HILIC is a valuable alternative to NP chromatography for very polar compounds because polar compounds are hardly retained and experience bad reproducibility when using NP chromatography. In addition, the large portion of organic mobile phase used for the HILIC elution increases the sensitivity when coupling MS with LC for detection. In general, a sample is separated and analyzed by LC in the following sequence: the sample solution is injected through an injection port, and then delivered by the mobile phase by high-pressure pumps, and finally flowed into the column for retaining and further elution (Fig. 1.1). The instrumentation design should consider the following issues: the high-pressure is generated when the solvents are pumped into the small particle filled stationary phase; the dead volume of connecting tubes, the injector, and the mixing valve should be minimized to prevent the reduction of analyte peak resolution; the sample 9
25 residue on the tubing and injector should be avoided for carry-over issue in quantitative analysis. 10

26 Figure 1.1, The instrumentation setup for LC separation 11
27 In this work, all small molecule compounds and peptides were separated by RP-LC with a C18 column and mass spectrometric detection. A guard column was used to prevent potential damages from the injected crude samples and proteins from the biological matrices. As the heart of LC system, the column needs to achieve adequate separation with a short time, maintain the precision for the retention, and have good stability in a broad ph range MS detection MS has become a crucial part for pharmaceutical analysis and biomolecules research because of the improvements in ionization methods in the past decade. Taking advantages of powerful separation and sensitive detection, LC-MS analysis is well-suited for structural elucidation, accurate quantification, and metabolites prediction in complex biological matrices. The analyte in liquid flow eluted from the LC goes into three modules of ionization source, mass analyzer, and detector, undergoing ionization and evaporation, separation, and detection, respectively. As the basic interfacing strategy, atmospheric-pressure ionization (API) enables the MS analysis by generating ions in a steam of liquid after LC separation. A number of API sources such as electrospray (ESI) and atmospheric-pressure chemical ionization (APCI) were developed to transfer the analyte from the liquid phase to the gas phase in MS with different ionization mechanisms. 12
28 In the ESI source, a highly positive or negative voltage is applied to the end of a steel capillary probe, where the sample solution is introduced (Fig. 1.2). When traveling along the capillary probe, the sample liquid is sprayed with excess charge. The nebulization process helps the formation of small droplets for ions in solvent vapor. During their flight from the electrical field to the MS proper, the droplets pass through an evaporation chamber, allowing the evaporation of solvents with the help of heating gas and nebulization gas. In the mean time, the quick evaporation process condenses the droplets and increases the surface charge density. At the end of the evaporation, the light solvent molecules diffuse away, leaving ions to enter into the MS analyzer. 13
29 Figure 1.2, The schematic diagram of ESI source ( 14
30 Unlike ESI, the ionization process of another liquid-based ionization source APCI occurs in gas phase. Without applying high voltage, the APCI capillary enables the volatile liquid sample to be heated and spayed first, and then a corona discharge needle with a high voltage generates ions from the aerosol cloud through interaction of reagent gas and electrons. When ions are accelerated by the applied electric or magnetic field, the mass analyzer separates the ions according to their mass to charge ratio (m/z). Typical mass analyzers include quadrupole MS, ion-trap MS, and time-of-flight (TOF) MS with their own characteristics and applications. The quadrupole instrument selects ions with a certain m/z to pass through the four parallel rods with certain direct-current potential and radiofrequency. Triple quadrupole MS allows the filtration of incoming ions by the first quadrupole, the fragmentation of selected ions by the second quadrupole, and the filtration of selected fragments by the third quadrupole, achieving high specificity. Similar to quadrupole MS, the ion-trap MS captures ions by a three dimensional manner in the electrical and magnetic combined fields (Fig. 1.3). The ion-trap MS takes advantages of its high sensitivity and resolution. The TOF MS accelerates ions and determines the flight time needed for ions moving from the ion source to the detector. TOF MS is characterized with advantages in high ion transmission and unlimited mass range, but with disadvantages in precursor ion selectivity. The modern MS instrument hybridizes different type of MS analyzers on one instrument, facilitating broader MS/MS applications. 15
31 Figure 1.3, The operation of quadrupole MS and ion-trap MS ( 16
32 Quantitative LC-MS(/MS) analysis for small molecules The most prevalent method for small molecules quantification is based on quadrupole MS with ESI or APCI interface since 1990 s. The detection of target analyte ions utilizes selective-ion-monitoring (SIM) and multiple-reaction-monitoring (MRM) approaches for LC-MS and LC-MS/MS methods, respectively. The SIM mode detection is operated on single quadrupole instrument, with a particular m/z value selected for the target analyte ion. Because the impurities including proteins, phospholipids, and salts in the sample matrices may have the same m/z with target analyte, the LC-MS analysis requires more elaborate sample extraction and LC separation. Compared with SIM, MRM detection is more specific and sensitive since triplequadrupole (QqQ) MS analyzer is applied for ion filtration and collision. Particular precursor ion and product ion are selected for detection based on their unique fragmentation pathway, resulting in a great improvement of signal to noise ratio (S/N) comparing to that of SIM. The quantitative LC-MS(/MS) method development generally follows the workflow in Fig A successful bioanalytical method requires three interlinked methodologies in MS detection, chromatographic separation, and sample preparation. Some important aspects and challenges such as mobile phase choice, sample pretreatment, and matrix effect are discussed in the following sections. 17

33 Figure 1.4, Method development workflow for small molecule bioanalysis 18
34 Mobile phase optimization Mobile phase additives are often added in RP-LC for reproducible retention and the improvement of resolution and sensitivity when using MS as a detector. However, only volatile additives are compatible with LC-MS, because the non-volatile buffers such as phosphates may clog the ionization source and cause signal suppression. In addition, some volatile additives help the retention but deteriorate the MS ionization. For example, trifluoroacetic acid (TFA) is commonly used as an ion-pairing agent for increasing the retention of polar compounds. Nevertheless, it is also reported to induce significant signal suppression for some negatively and positively charged compounds [9-11]. Besides the LC modifiers, the ph of the mobile phase also has a large impact on both retention and ionization. By adding volatile acids such as formic acid, acetic acids, and their salts with ammonium in the mobile phase, the protonation of basic molecules under positive ionization mode is favored in acidic condition. Similarly, the deprotonation of some acidic molecules in negative-ion mode can increase the response by adding ammonium hydroxide as mobile phase additive. But these conditions may cause an adverse effect for retention if the hydrophobic interaction between analyte ions with the stationary phase is not sufficient [12]. In addition, the concentration of the additives is also critical since the MS response may be reduced under very high concentration, but concentration that is too low may lack buffer capacity. To solve the dilemma between retention and ionization, the selection of mobile phase composition needs to carefully consider all the characteristics of individual analyte. 19
35 Sample preparation Although LC is a powerful tool for separation, the sample pretreatment for biological sample before injecting to LC-MS is essential for accurate and reproducible analysis. The biological sample matrices are very complicated with much higher content of proteins, salts, and endogenous lipids than target analyte. The large protein content in plasma sample is problematic due to its clogging of column and reducing analytical efficiency. Also, the endogenous interference and salts in most biological samples may suppress the ionization of analyte. Conventionally, the sample cleanup has been performed by protein precipitation (PPT), liquid-liquid extraction (LLE), and solid phase extraction (SPE). PPT is popular when handling plasma sample because it is simple and fast. But the major disadvantage for PPT is that residues consisted of salts and endogenous material after the removal of proteins, which may greatly affect the MS detection [13]. Besides the use of organic solvents for denaturing proteins, other PPT additives such as acids, metal ions, and salts were reported to improve the efficiency of protein removal and disrupt the protein-drug binding [14]. LLE is an efficient technique to separate analyte from sample matrices based on the different distribution in the water-immiscible organic phase and aqueous phase. It is successful in giving excellent sample cleanup. But the disadvantages for LLE include the relatively large sample and solvent consumption, possible formation of emulsion, and unsuitability for hydrophilic compounds. Based on the conventional LLE, the salting- 20
36 out-assisted-lle is developed as a more convenient alternative by adding concentrated ammonium salt solution into a mixture of biological sample and water-miscible solvents. In this way, high-throughput LLE can be applied through the automation of the handling process in 96-well plate. The separation process of SPE method prior to sample analysis is similar to LC separation. The analyte is isolated relying on its affinity difference with the liquid sample solution and the solid SPE sorbents. Depending on the interaction of analyte and the selected solid phase, the SPE sorbents vary from polymer based ion-exchange materials to silica based materials. Typical SPE procedures start with the conditioning of the cartridge by a solvent or water (Fig. 1.5). Then the sample is added onto the cartridge and the analyte interacting with the sorbent is retained. While the interferences are removed after rinsing the cartridge with buffer or solvent, the analyte can be eluted with an organic solvent and further concentrated by evaporation and re-constitution. 21

37 Figure 1.5, Illustration of four steps when performing SPE 22
38 Conventional SPE is performed on single cartridge, with the limitation for large volume of eluates and subsequent time-consuming evaporation process. The on-line SPE mode can be fully automated for directing injection of sample without any pretreatment. This advantage promotes the use of on-line SPE and 96-well plate, together with a columnswitching system in high-throughput analysis to facilitate the extraction speed. The runtime for high-throughput analysis using SPE-LC-MS was reported to be within 5 min for many applications [15-17] Matrix effect Matrix effect is one of the major issues encountered during LC-MS method development and validation [18]. The phenomenon of matrix effect is observed when the ionization of analyte is suppressed or enhanced by the undetected co-eluting components from the biological matrix. The adverse results of matrix effect are reduced sensitivity for the detection and deteriorated precision and accuracy of the assay. According to the FDA guideline, it is required to assess the matrix effect when developing a reliable bioanalytical method. In order to quantitatively determine the absolute matrix effect, an useful strategy was proposed by Matuszewski et al. [19]. The matrix effect is evaluated by comparing the signal response of analyte obtained from a neat solution with that from a post-extraction solution. In this way, two sets of samples are examined: one set is prepared by spiking standard analyte in neat solution and the other set is prepared by spiking standard analyte 23
39 at the same concentration in the extracted solution of blank biological sample, which is termed as post-extraction solution. The difference of response from these two sets determines whether signal is suppressed or enhanced. More importantly, the relative matrix effect should be evaluated by comparing the response of analyte in post-extraction solution from different blank matrix sources. The post-column infusion of analyte is usually helpful to locate the co-eluting substances causing suppression in an LC run. A mixing tee is setup after the column elution and prior to MS ionization interface (Fig. 1.6). The post-extraction solution of a blank biological matrix is injected into the LC system, and then eluted by the mobile phase from the column. At the mixing tee, the matrix eluents mix with the analyte, which is infused constantly through an individual syringe pump. The MS monitors the signal change after the injection of post-extraction solution. The signal response of analyte should be expected to be steady in the absence of suppressing impurities. When the ion suppression or enhancement of analyte is present, the signal response will drop or increase at certain time points when interferences are eluted out, which can be easily observed on the chromatogram. In this way, the elution time of the ionization interferences and the extent of suppression or enhancement effect can be assessed through several continuous runs. The subsequent experimental design of analyte elution should avoid the co-elution with interferences. 24

40 Figure 1.6, The post-column infusion experiment used for the assessment of matrix effect 25
41 Matrix suppression is induced by different reasons ranged from endogenous compounds from inadequate sample clean-up, ion-suppression mobile phase additives, choice of ionization method, to sample storage conditions. One of the most extensively used and efficient method to solve matrix effect issue is the utility of stable isotope labeled (SIL) internal standard. Since the SIL internal standard has very similar chemical structure and properties compared to the analyte, the ionization suppression or enhancement effect on both compounds is expected to be the same level. However, the SIL internal standard is costly and sometime hard to obtain. It is also problematic for tackling the cross talk problem if the purity of SIL internal standard is not adequate. The matrix effect can also be minimized by improving the sample extraction method to remove the interferences. The endogenous compounds in biological samples have different polarity and thus are difficult to be completely removed by sample extraction methods. However, choosing the optimal sample preparation to reduce the amount of interferences is an efficient approach to ensure success in method development. Little et al. identified the phospholipids as a major contributor of matrix effect in blood and plasma by MS/MS using different extraction methods [20]. Their results suggested that the glycerophosphocholines caused matrix effect in both positive and negative ionization, with larger effect for isocratic elution than gradient elution. As the effect of different sample pretreatment methods on matrix effect, it is reported that LLE had lower signal suppression compared to SPE, followed by the PPT extract, which usually contains the most endogenous residues (Fig. 1.7) [21]. 26
![Figure 1.7, Infusion chromatograms (2.5 min) showing the ability of different sample preparation methods to remove endogenous sample components [21].](/docs-images/76/73346195/images/42-1.jpg "Panels (a) through (f) show the SRM XIC of a post-column infusion of phenacetin showing the effect of an on-column injection of 10 ml of a blank plasma sample prepared by each of the tested sample")
42 Figure 1.7, Infusion chromatograms (2.5 min) showing the ability of different sample preparation methods to remove endogenous sample components [21]. Panels (a) through (f) show the SRM XIC of a post-column infusion of phenacetin showing the effect of an on-column injection of 10 ml of a blank plasma sample prepared by each of the tested sample preparation methods. (a) Plasma protein precipitation blank. (b) Plasma Oasis SPE blank. (c) Plasma MTBE liquid-liquid extraction blank. (d) Plasma Empore C2 disk SPE blank. (e) Plasma Empore C8 disk SPE blank. (f) Plasma Empore C18 disk SPE blank. 27
43 Alternatively, adjusting the chromatographic conditions is another approach to reduce or eliminate the matrix suppression. In the RP-LC separation, the suppression effect is often found in an early time of isocratic elution program and at the end of gradient elution during the post-column infusion. Therefore, it is wise to alter the elution of target analyte at other regions of the chromatogram where the matrix effect is the lowest. Some mobile phase additives such as triethylamine (TEA) and TFA can also induce matrix effect in LC-MS analysis. The strong ion-pairing ability of these additives helps trap very polar compounds in the column and reduce peak tailing, but it also masks the detection by neutralizing the positive charge of analyte. The use of ammonium salts as a substitution or the choice of other columns with different retention mechanism can relieve this problem. In bioanalytical method development, matrix effect is more frequently reported in ESI interface MS than APCI since the ionization mechanisms are different in these two sources. In ESI, the analyte is charged when traveling in the electrical probe, then nebulized to small droplets, and at last evaporated in the gas phase. When the interfering compounds compete with the analyte for the surface charge, the charge transfer occurs if the interferences have higher proton affinity, causing the lost of charge for the analyte and the decrease of MS intensity. Compared to ESI, the APCI of analyte in liquid undergoes opposite sequence for evaporation and ionization. The evaporation of liquid solvent takes place in the capillary before the ionization by charge transfer from the corona probe. 28
44 In addition to the endogenous compounds causing matrix effect problems, other often neglected sources from the dosing vehicles and blood anticoagulant can also result in ion suppression. Dosing vehicles including propylene glycol, Tween 80, and hydroxypropylβ-cyclodextrin are often used in the pre-clinical PK studies. Undetected matrix effect in the post-dose samples would give underestimated drug concentration and generate PK results with large errors. It also has been suggested that heparin should be avoided for separating plasma from blood during sample handling [22]. Sodium EDTA usually is preferred for anticoagulation in the PK and toxicokinetics studies for the prevention of matrix effect Mass spectrometric analysis for proteins In the scientific process of biomarker discovery and evaluation, a lot of assays including ELISA, functional assays, flow cytometry, immunohistochemistry, and MS have been developed for biomarker analysis [23]. The interfacing of LC with MS, with the ability in qualification and quantitation, is the principal technique to define proteomes. Direct sequencing can be obtained by generating protein or peptide signature spectra and then imputing the spectra fingerprint into proteomics database Identification of differentially expressed protein candidates Body fluids are the major sources to characterize proteome. However, the analysis of proteins in human blood or urine presents a lot of challenges owing to the dynamic range 29
45 of protein concentration and complexity of sample components. The pre-fractionation of proteins is necessary to deplete the high-abundance proteins before MS analysis. With this purpose, different separation methods have been well developed prior to protein characterization. Two-dimensional polyacrylamide gel electrophoresis (2D-PAGE) tandem with MS analysis is the first tool used to separate and identify differentiated proteins [24]. 2D- PAGE separates thousands of proteins by two steps. Firstly, samples are isolated by their different isoelectric points and by their molecular sizes. In this step, the protein pattern can be visualized by staining the gel. Secondly, the spots representing differentially expressed proteins are excised and digested into peptides by enzymes prior to MS analysis. However, when both abundant and less abundant proteins are presented on the same gel, it is necessary to determine the relative intensity of protein spots. Matrixassisted desorption/ionization time of flight mass spectrometry (MALDI-TOF MS) is commonly applied in spot identification to generate protein or peptide fingerprint. The MALDI-TOF MS analysis takes advantages in unlimited mass range and fast analysis speed. Bioinformatics can subsequently be utilized to search the proteomic database to identity the targeted proteins or directly analyze the results for discriminating protein patterns from control to patient samples. Although 2D-PAGE with MALDI-TOF MS analysis is a simple and widespread tool for the analysis of complex protein mixtures, it have several limitations such as the relative low resolution of 2D-PAGE separation and the reproducibility of detection, and it is 30
46 restricted to protein less than 20k Da [25]. Micro-scale or nano-scale chromatographic separation enhances the speed and efficiency comparing to conventional 2D-PAGE, facilitating the incorporation of high resolution LC in tandem MS as the primary protein identification platform. The LC-MS/MS protein analysis can be performed on various mass spectrometers, such as quadurpole and linear ion traps, Orbitrap, and quadrupole-tof. The bottom-up method for protein primary sequence determination involves the enzymatic digestion of protein into small peptides (Fig. 1.8). Retaining the digested peptide in acidic condition, the C18 reverse-phase microcapillary or nano-lc columns are the most commonly used ones to fractionate peptides with high resolution. 31


 spectrum and fragmentation (MS 2 ) spectrum")
47 LC column Complex protein mixture Digested Peptide Figure 1.8, Bottom-up proteomics analysis using LC-MS/MS. Trypsin digestion is the first step for the analysis of a complex protein mixture. Afterward, the sample containing tryptic peptide is injected into the HPLC column of the LC-MS/MS system. The mass spectrometer generates parent (MS 1 ) spectrum and fragmentation (MS 2 ) spectrum created by CID. The computer will use the MS2 spectrum together with MS1 spectrum to compare the database containing theoretical peptide spectra to identify the protein of origin. 32
48 The gradient program of the LC system helps the elution of the peptides. When delivered to the mass spectrometer in acidic environment, the peptides are converted into cationic form with single or multiple charges [26]. The first stage is to produce MS 1 spectra for the m/z of various peptides. To generate more information for peptide identification, the fragments of selected peptide ions (precursor ions) are initiated. To produce fragment ions, tandem mass spectrometric analysis (MS/MS) uses collision-induced dissociation (CID) to generate MS 2 data for peptide sequence information. By searching the protein database with the acquired MS/MS spectra, the software program can identify protein with matching peptide mass fingerprinting. Clearly, the higher mass accuracy obtained from precursor ions and product ions, the more confidence for protein identification Quantitative protein analysis With the speed-up of generating biomarkers, the center of proteomics has shifted from biomarker discovery to biomarker evaluation and quantification. It is necessary to compare the amount of differentially expressed proteins among healthy and disease status. Therefore, the development of accurate methods to quantify biomarkers of interest is a reliable theme for biomarker evaluation. Currently, the established techniques for protein and peptides quantification include two general strategies: 1) non-labeling methods by correlating MS signal with relative protein quantity and 2) the use of stable isotope incorporation prior to MS analysis. 33
49 In non-labeling quantification, the quantitative information for specific peptide is derived from according ion intensity or peak areas in complex peptides mixture. The accurate quantification needs a careful calibration of instrument system and normalization of MS spectra. For LC-MS/MS quantification, peptide ion intensity counting of MS mode and spectral counting in MS/MS mode are extensively used for ion detection. With respect to peptide ion counting, the number and intensity of precursor ion or peak area at selected m/z can be obtained. The spectral counting approach refers to the number of fragment ions generated from selected peptide. The peptide levels are yielded by comparing referring the abundance of peptide between samples in two or more separate LC-MS/MS runs. Label-free approach for quantitative proteomics is preferable due to its low cost and no limitation for sample numbers [27]. However, there are still controversies for the reliability of label-free quantitative analysis. The accurate quantification of this approach requires the minimization for variations between different runs, high resolution for the chromatography to finding correlated peptide, and high MS accuracy to prevent interfering signals with similar m/z. It also assumes that the linearity of response is the same for every peptide, but in fact the spectrum count response varies from different peptides. Because of the dynamic range of peptides in a sample, the existence of high abundance peptide in the complex mixture will affect the accuracy of low abundance peptide quantization. The major stable isotope labeling methods include using isotope coded affinity tags (ICAT) and isobaric tags for relative and absolute quantification (itraq) [28]. The 34
50 basic principle of ICAT relies on a special affinity tag to react with cysteine residues and allows differentially labeled samples to be resolved with MS analysis. Two different tags, which are identical except for one has hydrogen and the other one has deuterium atoms in the linker, react with samples before protein digestion [28]. Their mass difference allows the relative quantitative measurement by MS. The disadvantages of ICAT are its limitation for proteins containing cysteine residues only and high cost due to the isotope reagent. The itraq approach allows multiplexed quantification by targeting all free amines at N terminus of all peptides and the epsilon-amino group of lysine residues. This technique enables the analysis of up to 8 samples in one run. The itraq tags contain reporter group with mass from 114 to 117 Da, balance group from 28 to 31Da, and a protein-reactive group. During each MS scan, each labeled peptide displays the same mass to charge ratio. However, the dissociation of the reporter groups displays different m/z after the fragmentation under MS/MS mode. Signals from peptides after isobaric labeling are acquired for both MS and MS/MS scanning mode, thus improving the sensitivity and specificity of detection [29]. This property has great potential in the quantification of low abundance proteins. itraq coupled with LC-MS/MS has been used as in the serum biomarker in several studies and it shows promise in determining differential expression profiles for cancer diagnosis, prognosis or monitoring of treatment [30]. 35
51 When the quantitative information is derived for cataloging the protein files in a sample, the biomarker development requires careful follow-up validation, which includes the application of targeted proteomics methods. Targeted proteomics focused on individual proteins or a panel of proteins. When the use of isotope labeled methods only can provide relative quantitative information, the use of a standardized reference in the sample provides the absolute quantification information (AQUA). It is performed by spiking an isotopically-labeled internal standard into a biological sample prior to MS analysis. The ratio of labeled to unlabeled peptide determined by MS analysis can be calculated and the abundance of specific protein can be derived. Combining AQUA with MRM method in MS analysis, the specificity and accuracy can be improved for absolute quantification. MRM involves the selection of parent ions and then monitoring the fragmentation ions from the selected parent ions, thus enabling this technique highly specific and sensitive. Because the MRM detection limit allows at low as ng/ml level, this method offers the most promise for biomarker validation. To develop proteomics biomarkers with high specificity and sensitivity for clinical application, several phases including biomarker discovery, evaluation, determination of biological relevance, and development of clinical assay are need to follow. Huge challenges were presented such the complexity, variation and dynamic range of proteins in biological samples. The new MS technologies play the most critical role in the improvement of resolution and sensitivity, bringing promises for more clinical successes. 36
52 PCR based methods for methylation profiling DNA methylation is the most studied epigenetic changes related to normal biological processes and many diseases, especially in cancer development. This covalent modification of cytosine mostly happens at CpG dinucleotides rich sites, which are associated with gene promoters. While the methylation in normal cells is regulated by the DNA methyltransferases in a steady status for a stable genome, the aberrant gene methylation represses the transcription of downstream genes. In the process of tumorigenesis, a large number of tumor suppressor genes were found to be hypermethylated in the promoter regions [31]. Based on these findings, the investigation on DNA methylation has become one of the most popular areas in molecular oncology. Technologies for the genomic DNA methylation profiling are designed with enormous improvements with regarding to sensitivity, the elimination false-positive results, and sample throughput. In currently used methodologies for methylation profiling, bisulfite conversion based method is the fundamental one to investigate the gene-specific methylation. With standard sequencing method, the similar base-pairing sequence of methylated and unmethylated cytosine cannot be distinguished. Sodium bisulfite treatment with genomic DNA can solve this problem by chemical reaction. Under certain conditions, sodium bisulfite specifically deaminates unmethylated cytosine to uracil but leaves the methylated cytosine unchanged (Fig. 1.9.). The uracil is replaced with thymine in the followed PCR amplification after bisulfite conversion. After this reaction, standard 37
53 methods such as sequencing, pyrosequencing, PCR, or mass spectrometry can be used to analyze the bisulfite-converted DNA product [32-34]. 38
54 Figure 1.9, Strategy to distinguish unmethylated cytosine and methylated cytosine by bisulfite reaction 39
55 However, bisulfite treatment may give inaccurate results when the incomplete conversion of unmethylated cytosine is misinterpreted as methylated cytosine. It is critical to ensure the reaction is complete for unmethylated DNA by spiking known unmethylated DNA with the reaction as control. Another issue is the partial degradation as a result of DNA depurinization at acidic ph, which limits the sensitivity of the PCR reaction [35]. This problem can be overcame by adjusting the proper bisulfite reaction conditions of ph, temperature and the time of reaction [35]. Direct sequencing of bisulfite treated DNA allows the detection of methylation for each CpG dinuclotide within the analyzed area, thus is considered as the golden standard for methylation profiling. Nevertheless, the cost and labor intenseness of this approach is extremely high for large-scale sample analysis. Alternatively, the differences between unmethylated and methylated DNA sequence can be characterized by melting curve analysis. Unmethylated and methylated DNA has different GC content after bisulfite conversion, presenting varied resistant levels to melting. To detect the signal of PCR product, fluorescence dyes are used for specific binding with double-stranded DNA (ds DNA). The fluorescence signal is monitored as the temperature increases, producing a melting curve to depict the relationship between fluorescence intensity with the increase of temperature. The characteristics of PCR product is indicated by the fluorescence peak with a certain melting temperature on the derivative melting curve. The fully methylated PCR product and fully unmethylated 40
56 DNA shows distinct melting peaks, while a mixture of both may show a complex pattern with both melting peak characters [36] (Fig. 1.10). 41
57 Figure 1.10, Melting curve analysis on fully methylated, fully unmethylated, and mixtures of both PCR products for methylation detection [34]. 42
58 These sequencing and MCA methods such as combined bisulfite restriction analysis (COBRA), melting curve analysis methods including methylation-sensitive singlenucleotide primer extension (MS-Snupe), and methylation-sensitive melting curve analysis (MS-MCA) all reply on the PCR amplification prior to methylation detection. Methylation-independent PCR primers utilized in these methods allow proportional amplification of methylated and unmethylated templates. However, the templates of methylated DNA have higher GC content than unmethylated templates, leading to different amplification efficiencies and PCR bias for unmethylated product. Although many attempts are reported to overcome this problem such as increasing the annealing temperature during amplification and proper primer design [37], the sensitivity of these methods remains to be improved. The development of methylation-specific PCR (MSP) in the mid-90s permits the simple and fast analysis of the DNA methylation status after bisulfite conversion. MSP method is highly sensitive and specific with designed PCR primer for the amplification of methylated sequence only. It was reported that MSP was able to detect 0.1% methylated template in a pool of unmethylated DNA [38]. MSP is also related with high falsepositive rates caused by the incomplete bisulfite conversion and possible contamination during analysis, which can be alleviated by increasing melting temperature and more stringent amplification conditions. The development of quantitative MSP (qmsp) resolves the limitation of MSP based on real-time PCR (RT-PCR). The amount of initial DNA product can be determined with 43
59 high precision and a wide range. In addition to unknown DNA products, standard methylated DNA after bisulfite treatment is serially diluted and amplified for standard curves in separated reactions. Since the quantitative results are relative to the standards, the absolute quantity of DNA only can be obtained when the absolute copies of the standards are known. As an alternative mechanism for cancer development, aberrant gene methylation has been found in the patterns of hypomethylation for global genome change and hypermethylation for specific tumor suppressor genes. The DNA methylation profiling holds promises for the biomarker discovery of cancers and other diseases for early detection. Nevertheless, these potential biomarkers are relative low abundant in biofluids or tissues, requiring the developed detection method for gene methylation to be highly sensitive and specific for potential clinical applications. A large number of target genes have been identified for colorectal cancer, breast cancer, and hepatocellular carcinoma. Moreover, the DNA methylation targets are more frequently to be observed as a panel of multiple genes rather than a single gene, suggesting a direction for improving the specificity of cancer screening. 44
60 1.3. Reference [1] Vegvari A, Marko-Varga G. Clinical protein science and bioanalytical mass spectrometry with an emphasis on lung cancer. Chem Rev 2010;110: [2] Khojasteh SC, Wong H, Hop C. Drug Metabolism and Pharmacokinetics Quick Guide, 1st ed: Springer; [3] [4] Biomarkers and surrogate endpoints: preferred definitions and conceptual framework. Clin Pharmacol Ther 2001;69: [5] Roos PH, Jakubowski N. Methods for the discovery of low-abundance biomarkers for urinary bladder cancer in biological fluids. Bioanalysis 2010;2: [6] Slack A, Cervoni N, Pinard M, Szyf M. Feedback regulation of DNA methyltransferase gene expression by methylation. Eur J Biochem 1999;264: [7] Futscher BW, Oshiro MM, Wozniak RJ, Holtan N, Hanigan CL, Duan H, et al. Role for DNA methylation in the control of cell type specific maspin expression. Nat Genet 2002;31: [8] Kulis M, Esteller M. DNA methylation and cancer. Adv Genet 2010;70: [9] Apffel A, Fischer S, Goldberg G, Goodley PC, Kuhlmann FE. Enhanced sensitivity for peptide mapping with electrospray liquid chromatography-mass spectrometry in the presence of signal suppression due to trifluoroacetic acidcontaining mobile phases. J Chromatogr A 1995;712:
61 [10] Mallet CR, Lu Z, Mazzeo JR. A study of ion suppression effects in electrospray ionization from mobile phase additives and solid-phase extracts. Rapid Commun Mass Spectrom 2004;18: [11] Annesley TM. Ion suppression in mass spectrometry. Clin Chem 2003;49: [12] Niessen WMA. Liquid chromatography-mass spectrometry, 3rd ed. New York: Talor & Francis Group; [13] Xu RN, Fan L, Rieser MJ, El-Shourbagy TA. Recent advances in high-throughput quantitative bioanalysis by LC-MS/MS. J Pharm Biomed Anal 2007;44: [14] Polson C, Sarkar P, Incledon B, Raguvaran V, Grant R. Optimization of protein precipitation based upon effectiveness of protein removal and ionization effect in liquid chromatography-tandem mass spectrometry. J Chromatogr B Analyt Technol Biomed Life Sci 2003;785: [15] Niederlander HA, Koster EH, Hilhorst MJ, Metting HJ, Eilders M, Ooms B, et al. High throughput therapeutic drug monitoring of clozapine and metabolites in serum by on-line coupling of solid phase extraction with liquid chromatographymass spectrometry. J Chromatogr B Analyt Technol Biomed Life Sci 2006;834: [16] Schebb NH, Inceoglu B, Rose T, Wagner K, Hammock BD. Development of an ultra fast online-solid phase extraction (SPE) liquid chromatography electrospray tandem mass spectrometry (LC-ESI-MS/MS) based approach for the determination of drugs in pharmacokinetic studies. Anal Methods 2011;3:
62 [17] Kantiani L, Farre M, Grases IFJM, Barcelo D. Determination of antibacterials in animal feed by pressurized liquid extraction followed by online purification and liquid chromatography-electrospray tandem mass spectrometry. Anal Bioanal Chem 2010;398: [18] Matuszewski BK, Constanzer ML, Chavez-Eng CM. Matrix effect in quantitative LC/MS/MS analyses of biological fluids: a method for determination of finasteride in human plasma at picogram per milliliter concentrations. Anal Chem 1998;70: [19] Matuszewski BK, Constanzer ML, Chavez-Eng CM. Strategies for the assessment of matrix effect in quantitative bioanalytical methods based on HPLC-MS/MS. Anal Chem 2003;75: [20] Little JL, Wempe MF, Buchanan CM. Liquid chromatography-mass spectrometry/mass spectrometry method development for drug metabolism studies: Examining lipid matrix ionization effects in plasma. J Chromatogr B Analyt Technol Biomed Life Sci 2006;833: [21] Bonfiglio R, King RC, Olah TV, Merkle K. The effects of sample preparation methods on the variability of the electrospray ionization response for model drug compounds. Rapid Commun Mass Spectrom 1999;13: [22] Mei H, Hsieh Y, Nardo C, Xu X, Wang S, Ng K, et al. Investigation of matrix effects in bioanalytical high-performance liquid chromatography/tandem mass spectrometric assays: application to drug discovery. Rapid Commun Mass Spectrom 2003;17:
63 [23] Ackermann BL, Hale JE, Duffin KL. The role of mass spectrometry in biomarker discovery and measurement. Curr Drug Metab 2006;7: [24] Zhang YT, Geng YP, Zhou L, Lai BC, Si LS, Wang YL. Identification of proteins of human colorectal carcinoma cell line SW480 by two-dimensional electrophoresis and MALDI-TOF mass spectrometry. World J Gastroenterol 2005;11: [25] Simpson KL, Whetton AD, Dive C. Quantitative mass spectrometry-based techniques for clinical use: biomarker identification and quantification. J Chromatogr B Analyt Technol Biomed Life Sci 2009;877: [26] Pisitkun T, Hoffert JD, Yu MJ, Knepper MA. Tandem mass spectrometry in physiology. Physiology (Bethesda) 2007;22: [27] Pisitkun T, Johnstone R, Knepper MA. Discovery of urinary biomarkers. Mol Cell Proteomics 2006;5: [28] Gygi SP, Rist B, Gerber SA, Turecek F, Gelb MH, Aebersold R. Quantitative analysis of complex protein mixtures using isotope-coded affinity tags. Nat Biotechnol 1999;17: [29] Thompson A, Schafer J, Kuhn K, Kienle S, Schwarz J, Schmidt G, et al. Tandem mass tags: a novel quantification strategy for comparative analysis of complex protein mixtures by MS/MS. Anal Chem 2003;75: [30] DeSouza LV, Grigull J, Ghanny S, Dube V, Romaschin AD, Colgan TJ, et al. Endometrial carcinoma biomarker discovery and verification using differentially tagged clinical samples with multidimensional liquid chromatography and tandem mass spectrometry. Mol Cell Proteomics 2007;6:
64 [31] Esteller M. Epigenetic gene silencing in cancer: the DNA hypermethylome. Hum Mol Genet 2007;16 Spec No 1:R [32] Eckhardt F, Lewin J, Cortese R, Rakyan VK, Attwood J, Burger M, et al. DNA methylation profiling of human chromosomes 6, 20 and 22. Nat Genet 2006;38: [33] Tost J, Gut IG. Analysis of gene-specific DNA methylation patterns by pyrosequencing technology. Methods Mol Biol 2007;373: [34] Tost J, Schatz P, Schuster M, Berlin K, Gut IG. Analysis and accurate quantification of CpG methylation by MALDI mass spectrometry. Nucleic Acids Res 2003;31:e50. [35] Raizis AM, Schmitt F, Jost JP. A bisulfite method of 5-methylcytosine mapping that minimizes template degradation. Anal Biochem 1995;226: [36] Kristensen LS, Hansen LL. PCR-based methods for detecting single-locus DNA methylation biomarkers in cancer diagnostics, prognostics, and response to treatment. Clin Chem 2009;55: [37] Wojdacz TK, Borgbo T, Hansen LL. Primer design versus PCR bias in methylation independent PCR amplifications. Epigenetics 2009;4: [38] Palmisano WA, Divine KK, Saccomanno G, Gilliland FD, Baylin SB, Herman JG, et al. Predicting lung cancer by detecting aberrant promoter methylation in sputum. Cancer Res 2000;60:
65 CHAPTER II QUANTITATIVE ANALYSIS OF BILE ACIDS FOR INFLAMMATORY BOWEL DISEASES 2.1. Introduction Bile acids Bile acids are produced in the hepatocytes through the oxidation of cholesterol. They are composed of a steroid structure with side chain terminating in a carboxylic acid and hydroxyl groups (Fig. 2.1). After conjugating with taurine or glycine in the liver, bile acids are excreted into gallbladder, released into intestinal tract, reabsorbed in the terminal ileum, and then back to enterohepatic circulation, leaving a small part entering into the colon [1,2] (Fig. 2.2). In the terminal ileum, cecum and colon, primary bile acids 50
66 including cholic acid (CA) and chenodeoxycholic acid (CDCA) are metabolized by bacterial flora through two major reactions: one is deconjugation to produce free bile acids and taurine or glycine from conjugated bile acids; and the second one is dehydroxylation to form secondary bile acids deoxycholic acid (DCA), ursodeoxycholic acid (UDCA) and lithocholic acid (LCA) [3]. The numerous metabolic conversions of bile acids bring the complexicity of bile acids composition in biological fluids. 51
67 Figure 2.1, Chemical structures of bile acids (a) and internal standard NPA (b) 52

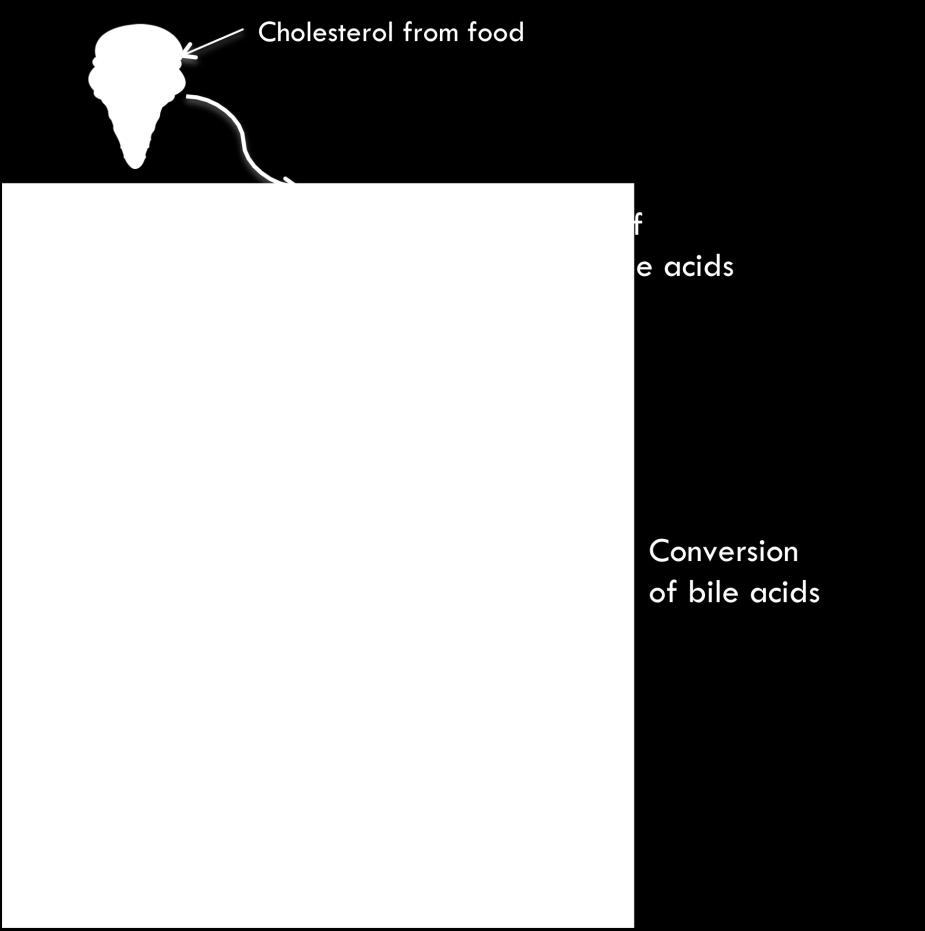
68 Figure 2.2, Bile acids metabolism 53
69 Under the physiological conditions, bile acids are only present at low concentrations in the peripheral circulation due to the hepatic extraction and intestinal absorption. The excretion of bile acids from feces stands for 10% -15% of total daily bile acids production in human. In hepatobiliary and intestinal diseases, the cholesterol metabolism is disturbed, affecting the synthesis of bile acids and conversion of bile acids in different biological fluid (serum, bile, urine, and feces). The bile acids quantitative and qualitative changes in feces provide possible correlation with the development and prevention of liver diseases and intestinal diseases Inflammatory Bowel Diseases (IBD) Inflammatory bowel disease (IBD), including Crohn s disease (CD) and ulcerative colitis (UC), significantly affects the quality of life of many patients in western world [4]. A standard surgical procedure called ileal pouch anal anastomosis (IPAA) is usually used for the treatment of UC. However, patients often develop inflammatory complications of ileal pouch after the surgery, among which, pouchitis is the most common and nonspecific one [5](Fig. 2.3). The non-specific symptoms of pouchitis bring great challenges in the diseases diagnosis and management. 54


70 Figure 2.3, IBD and its treatment by IPAA surgery ( 55
71 The pathophysiology of pouchitis is not completely understood yet, while one of the important factors could be the bacterial overgrowth in the ileal pouch reservoir [6]. In hepatobiliary and intestinal disorders, the abnormal cholesterol metabolism affects the bile acids synthesis, enterohepatic circulation, and biotransformation process, thus changing its composition in biofluids. Kruis et al. and Natori et al. reported that altered bacterial conversion of primary to secondary bile acids was related to abnormal intestinal microflora in UC patients [7, 8]. Therefore, monitoring the change of bile acids profile through bile acids quantification may serve as a useful diagnostic test for the ileal pouch diseases developed for the treatment of IBD Development of a quantitative bioanalytical method for fecal bile acids Challenges in method development Due to the complex composition and minor difference between bile acids components, the quantification of fecal bile acids is challenging. Most of the current methods use gas chromatography mass spectrometry (GC-MS) for the analysis of bile acids in feces [9, 10]. Because of the comprehensive bile acids analysis requires the separation of free bile acids and the conjugated ones, the major disadvantage of the GC-MS approach is the tedious and time-consuming derivatization and pre-fractionation steps prior to analysis. LC-ESI-MS is a powerful technique for the simultaneous analysis of multiple bile acids in biological materials including plasma, serum and urine with high specificity and 56
72 selectivity [11,12]. One of the challenges is the separation for the dihydroxy C 24 bile acids presenting isomeric structures. The detection of bile acids is often operated in SIM mode for free bile acids and MRM mode for glycine and taurine conjugates. There was also a report that utilized LC-ESI-MS to analyze fecal bile acids, but its accuracy and precision were not reported [13]. Matrix effect is another common problem associated with analysis of a complex biological sample with mass spectrometry. This phenomenon in ESI was observed when the target analyte is co-eluted with other bio-fluid components [14]. The endogenous phospholipids, proteins and fatty acids in the biological samples are the main source of the matrix effect. The ionization of analyte in mass spectrometry can vary greatly, which in turn significantly affects accuracy and precision of measurements [15,16]. The affected signal intensity can be explained as the competition among ions for the limited droplet surface charge [17]. For example, Scherer et al. reported the matrix effect during the analysis of bile acids in serum [18]. We also encountered serious matrix suppression problem during the course of our own analysis of fecal materials. In this work, we have developed a simple and effective method termed as standard addition with internal standard (SA-IS) method to overcome the large quantitative errors brought by matrix effect. Combining standard addition with internal standard, the SA-IS method takes advantages of both, which compensates matrix effect and variations in sample preparation and MS detection. In this study, we studied seven bile acids CA, CDCA, DCA, UDCA, LCA, taurochenodeoxycholic acid (TCDCA), and 57
73 glycochenodeoxycholic acid (GCDCA) using the SA-IS method along with a simple sample pretreatment procedure. The sensitivity, accuracy, reproducibility of this method were evaluated and improved to the acceptable range for the quantitative determination of bile acids in fecal materials such as pouch aspiration. We expect that the SA-IS approach developed in this work can be a general method for the quantitative analysis of other complex samples by LC-ESI-MS, in which the matrix effect exists Chemicals and methods Chemicals CA, CDCA, DCA, UDCA, LCA, GCDCA, TCDCA, N-1-napthylphthalamic acid (NPA), ammonium hydroxide and ammonium acetate were purchased from Sigma-Aldrich Chemical (St Louis, MO, USA). HPLC-grade methanol and acetonitrile were also purchased from Sigma-Aldrich. Deionized water was generated by a Millipore water purification system (Billerica, MA, USA). Syringes and syringe filters were obtained from VWR international (Wester Chester, PA, USA) Sample collection The pouch aspiration used in this study is one kind of homogenous fecal materials. Diagnostic or surveillance pouch endoscopies, a subspecialty of the Pouthitis Clinic at Cleveland Clinic (Cleveland, OH, USA), were performed as a part of routine clinical care. 58
74 The project was approved by Institutional Review Board at Cleveland Clinic. Informed consent was obtained from all patients. Before pouch endoscopy, each enrolled patient was given one Fleets enema, and in 5 10 min the patient went to empty the pouch. Pouch aspiration samples were collected during pouch endoscopy and stored at 20 C Instrumentation and LC-MS conditions The LC-MS system consisted of an Agilent 1100 series HPLC (Santa Clara, CA, USA) and a Waters Micromass Quattro II triple quadrupole mass spectrometer (Manchester, UK). A Luna C18 column (150 mm, 2mm i.d., 5 μm) with a guard column (40 mm, 2mm i.d.) from Phenomenex (Torrance, CA, USA) was used for the chromatographic separation. The mobile phase was a gradient mixture of 10 mm ammonium acetate ammonium hydroxide buffer at ph 8.0 (A) and 10mM ammonium acetate in acetonitrilemethanol 3:1 (B). The gradient elution program is illustrated in Figure 2.4. The HPLC column was first equilibrated with an initial mobile phase of 30% B. The mobile phase was then increased to 65% B within 6 min and increased to 72% B from 6.1 to 14 min. Afterward the mobile phase was changed to 90% B in 1 min and maintained for 5 min. At 20 min, the proportion was adjusted back to the initial ratio condition of 30% B and maintained for 10 min to re-equilibrate the column. During the entire analysis the flow rate was 200 μl/min. The injection volume was 10 μl and the total run time was 30 min for each sample including the re-equilibration. 59
75 % B 100% 80% 60% 40% 20% 0% Time (min) Figure 2.4, The gradient elution for the separation of bile acids 60
76 Negative ESI mode was adopted for the mass spectrometer operation. A small portion of flow (50 μl/min) was introduced to the mass spectrometer with a post-column split ratio of 1:4. Direct infusion of each bile acid at 1 μmol/l and the internal standard (IS) at 10 μmol/l was used to fine tune the mass spectrometry conditions. The ion source temperature was maintained at 95 C and the capillary voltage was set at 3.0 kv. Nitrogen nebulization and drying gas were held at 12 and 300 L/h, respectively. Cone voltage was at 50 V. Detection of bile acids was performed using selective-ion monitoring (SIM) mode. The deprotonated molecules of the free and conjugated bile acids were recorded at m/z (LCA), (UDCA, CDCA and DCA), 407 (CA), 448 (GCDCA), and 498 (TCDCA). Micromass Masslynx (Version 3.3) was utilized for system operation, data acquisition, and data processing Stock and working solutions Stock solutions of each bile acid and IS were prepared at a concentration of 14 mmol/l by carefully weighting each compound and dissolving them in methanol. Stock solutions were stored under 20 C. The dilution buffer, 70% mobile phase B, was used for the preparation of bile acid working solutions at 20, 40, 80, 100, 200, 400, 800, 1000, 1600, and 2000 μmol/l per compound. The one with the highest concentration was prepared by mixing equal volumes of seven bile acid stock solutions together; other lower concentrations were obtained by serial dilution. The IS working solution at 4000 μmol/l was prepared by diluting the IS stock solution. 61
77 Pouch aspiration calibrators and Quality Control (QC) samples The collected pouch aspiration samples were homogenous and thawed before use. The blank pouch aspiration lots, which had no detectable ion signals for given bile acids, were obtained from different IBD patients. The calibrators and QC samples used different two lots of blank pouch aspiration. Bile acids calibrators of 0.05, 0.1, 0.25, 0.5, 1, 2.5 and 5 μmol/l were obtained by spiking 15 μl bile acid working solutions of 20, 40, 100, 200, 400, 1000 and 2000 μmol/l into 30 μl blank pouch aspiration, respectively. In the same way, bile acids QC samples of 0.2, 2 and 4 μmol/l were prepared by spiking 15 μl bile acids working solutions of 80, 800 and 1600 μmol/l into 30 μl blank pouch aspiration, accordingly. There is a 400 times concentration difference between the stock solution and wanted final concentration of bile acids considering the sample treatment procedures described in the following section Sample treatment of calibrators and QC samples for internal calibration After thawing the pouch aspiration calibrators and QC samples to room temperature from 20 C, they were homogenized using a mixer. Prior to sample extraction, each aliquot of 45 μl calibrators and QC samples was mixed with 15 μl IS working solution for the internal standard calibration. For the sample preparation, each of the mixed samples was added with ethanol to obtain a total volume of 600 μl. The whole mixture was sonicated by an ultrasonic bath for 15 min. After a centrifugation at 10,000 rpm for 5 min, 100 μl supernatant was removed and diluted 10 times using the dilution buffer. The solution was 62
78 then filtered using a syringe filter with a pore size of 0.45 μm. Finally, the filtrated solution was injected into LC-MS system for analysis Sample treatment of QC and patient samples for SA-IS Two portions of QC sample and patient sample were needed for each analysis when applying the SA-IS method. The QC sample analysis required each portion as 45 μl and the patient samples analysis required each portion as 30 μl. Before the sample extraction, one portion was spiked with 15 μl IS working solution, and the other was spiked with both the 15 μl IS working solution and 15 μl bile acid working solution at 800 μmol/l. The following sample preparation procedure was the same as that described in the section Sample Pretreatment of Calibrators and QC Samples for Internal Calibration Matrix effect and recovery For the evaluation of matrix effect in pouch aspiration, the chromatographic peak area ratios of bile acids to IS in matrix-contained solution were compared with those for the non-matrix contained solution. The matrix-contained samples were prepared as follows: a 30 μl blank pouch aspiration sample was extracted, diluted, and filtrated by the procedure described above. Further, bile acids and IS working solution were spiked into the post-extraction (SPE) solution. The non-matrix contained solutions of bile acids were the reference samples and were prepared by diluting bile acids work solution using 63
79 dilution buffer. The matrix effect was determined in two different lots of blank pouch aspiration under three concentration levels: 0.2, 2 and 4 μmol/l. For the determination of extraction recovery, the chromatographic peak area ratio of bile acids to IS in the spiking-before-extraction (SBE) solution was compared with that in the SPE solution. The preparation method of bile acids and IS in the SBE solution was the same as preparation of QC standards. The recovery was also determined under three concentration levels: 0.2, 2 and 4 μmol/l Method validation After the development of this SA-IS method, we validated it by assessing the linearity, limit of detection (LOD), lower limit of quantification (LLOQ), and the intra- and interassay precision and accuracy. Bile acids calibration curves were constructed over the range of μmol/l. The peak area ratios of bile acids to the IS in the pouch aspiration sample (y) were regressed against the concentration of spiked standard bile acids (x). The LOD and LLOQ samples were prepared by spiking 15 μl bile acid working solutions with 30 μl blank pouch aspiration. The LOD for bile acids in pouch aspiration was determined when the signal-to-baseline noise ratio was above 3. The LLOQ was the lowest concentration of bile acids in pouch aspiration that could be determined within a precision and an accuracy of 20%. 64
80 Intra-assay precision and accuracy were determined in five replicates of QC samples at 0.2, 2 and 4 μmol/l prepared in the same run. Inter-assay precision and accuracy were measured in three different runs. The precision was expressed in terms of percentage coefficient of variation (CV%) and accuracy was expressed in terms of percent relative errors (RE%) Method application To test the feasibility of this SA-IS method in fecal material analysis, we determined the bile acids profiles for a preliminary clinical application. The clinical pouch aspiration samples were collected from the patients diagnosed as having pouchitis and normal pouch after IPAA surgery Results and discussion Separation of bile acids A broad range of the bile acids physicochemical properties including PKa and hydrophobicity, along with the minor difference between some isomeric bile acids, bring great challenges in bile acids separation. The free and conjugated bile acids have different PKa range at 3.9 ± 0.1 and 5.0 ± 0.1, respectively [19]. The Log D values of bile acids distribute from 0 to 4 for all bile acids [20]. Among these seven compounds, UDCA and 65
81 CA are the most hydrophilic bile acids, while DCA and LCA are the most hydrophobic ones. The separation of bile acids CDCA, UDCA, DCA, LCA, CA, TCDCA, and GCDCA was achieved with a Luna C18 column from Phenomenex. The isomeric bile acids CDCA and DCA were the most difficult to separate. The mobile phase was optimized to achieve complete separation of these two isomers by using different ratio of methanol, acetonitrile, and mobile phase additives. The addition of methanol to the organic mobile phase could sharpen bile acids peaks [21]. The retention times and sensitivity of bile acids were improved by adding ammonium salts into the mobile phase and adjusting the ph by ammonium hydroxide at ph 8.0. When the mobile phase is basic, the variation of log P on the change of ph is the lowest, and consequently the deprotonation of bile acids is promoted. Three different concentrations of ammonium acetate: 2, 10, and 20 mm were tested in the mobile phase. We found that 10 mm ammonium acetate yielded the highest ionization intensity and best separation. With this optimized mobile phase conditions, gradient elution was applied to separate the analytes within 20 min and to sufficiently isolate three isomers of UDCA, CDCA, and DCA, as well as other bile acids (Fig. 2.5). 66
82 Figure 2.5, Representative mass chromatograms of bile acids at 0.1 μmol/l and IS NPA at 10 μmol/l 67
83 Matrix effect The variation of analyte signal after the extraction process for the biological sample is often contributed by extraction recovery and matrix effect. Recovery variation is mainly caused by the extraction efficiency, while matrix effect is introduced by co-eluting interference existing in the extracted solution. When the matrix interference shows higher proton affinity than targeted analyte, proton is transferred from the ionized analyte to the interference, causing the lost ion intensity of partial analyte [14]. It has been reported that, when LC-MS was used to analyze biological samples such as urine and plasma, matrix effect often occurred and caused deterioration of the precision and accuracy of the analysis [22-24]. The evaluation of matrix effect during LC-MS analysis usually employed the following methods: post-column infusion, post-extraction spike, and the comparison of standard calibration slopes. In this study, the post-extraction spike method and the comparison of standard calibration curves were employed to assess the matrix effect on bile acids in pouch aspiration samples. NPA was selected as IS to normalize MS signal for all bile acids because of their similar structures and chemical properties [25](Fig. 2.1). After the normalization of MS variation by the IS, the matrix effect (ME %) was measured by comparing the peak area ratios of 68
84 bile acids to IS spkied in post-extraction solution and with those in dilution buffer according to [26]: ME% (1 R SPE R DB ) 100% where R SPE represents the peak area ratio determined in the SPE solution of blank pouch aspiration and R DB represents the peak area ratio determined in the dilution buffer. The positive ME% indicates matrix suppression of target analytes; the negative ME% indicates an enhancement of ionization by sample matrix; and zero of ME% indicates no matrix effect is present. In addition, we compared the ME% from two different batches (No.398 and No. 957) of blank pouch aspiration at three concentrations: 0.2 μmol/l, 2 μmol/l, and 4 μmol/l. In addition, three calibration curves of bile acids were established in the non-matrix contained solution, matrix contained solution after extracting blank plasma sample lot 1, and matrix contained solution after extracting blank plasma sample lot 2 for matrix effect evaluation also. The slopes were compared between three calibration curves. As shown in Table 2.1, the ME% in sample 398 (except for 4 μmol/l CDCA and DCA) ranged from 7.6 to 38%, indicating severe ion signal suppression by the pouch aspiration sample matrix. In sample No. 957 the ME% was even larger. These results were confirmed in the results from the calibration curves for bile acids in different matrix solutions (Fig. 2.6). The slopes of calibration curves established in non-matrix contained solution were higher than that in two different matrix-contained solutions. In addition, the level of ion suppression resulting from the pouch aspiration matrix varied greatly 69
85 between different samples. This is not surprising due to the highly complex nature of fecal materials such as pouch aspiration. 70
86 Table 2.1 Matrix effect determined in blank pouch aspiration sample No. 398 and No. 957 for bile acids at three concentrations (n=3) Bile Acids Concentration (μmol/l) No. 398 ME (%) No. 957 ME (%) CA CDCA UDCA DCA LCA TCDCA GCDCA
87 a. CA b. CDCA c. UDCA d. DCA Concentration (μm) Concentration (μ M) e. LCA Concentration (μ M) f. TCDCA Concentration (μ M) Concentration (μ M) Concentration (μ M) g. GCDCA Concentration (μ M) Figure 2.6, Calibration curves of bile acids: CA (a), CDCA (b), UDCA (c), DCA (d), LCA (e), TCDCA (f), and GCDCA (g) established in different solution sets: non-matrix contained solution ( in orange), extracted solution of blank pouch aspiration lot #1 ( in blue), and extracted solution of blank pouch aspiration lot # 2 ( in purple) 72
88 Internal standard calibration To evaluate the availability of internal calibration for compensating matrix effect and determining bile acids in pouch aspiration, calibration curves were established from pouch aspiration calibrators. The calibrator and QC standards were prepared from two different batches of blank pouch aspiration samples. The QC standards of three spiked concentrations were measured based on the calibration curves, and the results were listed in Table 2.2. For most of the bile acids, the analytical accuracy with the internal standard method was low considering RE% ranges from -50.4% to 64.6%. These large quantitative errors resulted from the sample-to-sample variations in the matrix components. More specifically, such great errors were caused by significant differences between the level of matrix effect of QC standards and that of calibrators. Therefore, the internal standard calibration was not suitable for bile acids analysis when the matrix varied among samples. 73
89 Table 2.2 The accuracy results determined by internal standard method (n=5) Bile Acids Spiked Concentration (μmol/l) Accuracy RE(%) CA CDCA UDCA DCA LCA TCDCA GCDCA
90 SA-IS method Several approaches were reported to reduce matrix suppression [15,16,27]. One of most effective approaches is the use of isotope-labeled analogues as internal standards. However, the presence of multiple analytes in pouch aspiration requires multiple isotopelabeled internal standards, which are costly and difficult to obtain. Using appropriate sample extraction procedure is another approach to reduce the matrix effect. We tried to clean up the co-eluting substance by LLE and SPE. However, since the hydrophobicity of bile acids has a broad range, it is difficult to develop an LLE method ensuring low matrix interference and good recovery. Also the large number of lipids and lysophospholipids, which are similar with bile acids with regarding to structure and polarity, presents in pouch aspiration, causing the co-elution of bile acids and the interference when using SPE methods. In addition, the matrix interference, with significant sample-to-sample variation, could not be removed completely by the same sample cleanup method. As a result, all of these purification attempts failed to reduce the matrix effect within 15% for all the bile acids. Standard addition was another option reported to compensate the matrix effect in LC-MS analysis [28,29]. It measures the concentration of analyte in an unknown sample by comparing the response difference between before and after the addition of a known amount of analyte to that of the original sample. However, standard addition alone cannot correct the loss of analytes associated with sample preparation. As a result, we 75
91 investigated the SA-IS method that combined standard addition with internal standard to measure the concentrations of bile acid components in pouch aspiration. The use of standard addition will eliminate adverse matrix effect on accuracy and precision, while the use of internal standard will compensate for incomplete extraction and variability in sample preparation and MS detection. The SA-IS method is illustrated in Fig.2.7. C unk represents the unknown concentration of a bile acid in a pouch aspiration sample; C SA represents the spiked concentration of the bile acid in the same pouch aspiration after standard addition. The peak area ratios of the bile acid to IS in the original sample and in standard addition samples are R unk and R SA, respectively. The peak area ratios are regressed against the concentration of bile acid spiked in. C unk is calculated according to: C unk C SA R unk (R SA R unk ) With the SA-IS method, each pouch aspiration sample was divided into two aliquots: the first one was spiked with only IS, and the other was spiked with the bile acids mixture and IS. The validation results showed that the SA-IS is effective in correcting the matrix effect and more accurate than internal standard method. 76
92 Figure 2.7, Illustration of SA-IS method 77
93 Method validation Linearity: Two requirements are needed when applying the SA-IS: 1) a good linear relationship between the analyte concentration and according signal response; 2) zero signal response in the absence of analyte. The linearity were studied by analyzing the calibrators, which were blank pouch aspiration samples spiked with bile acids and IS. We observed that calibration curves established by plotting the peak area ratio of analyte to IS vs. the concentrations of each bile acid were linear within the range of 0.05 μmol/l- 5 μmol/l with correlation coefficient of (Table 2.3). 78
94 Table 2.3 Calibration curve results for bile acids spiked in pouch aspiration Bile Acids Range (μmol/l) Calibration curve of standard bile acid in blank pouch aspiration sample slope y-intercept correlation coefficient CA CDCA UDCA DCA LCA TCDCA GCDCA
95 Sensitivity: The sensitivity of this method was assessed in term of the limit of detection (LOD) and the lower limit of quantification (LLOQ). For all the bile acids, the LOD was 1 nmol/l using a signal-to-noise ratio of 3. LOD was determined by spiking the bile acid standards into the blank pouch aspiration samples. The LLOQ was 0.05 μmol/l as the lowest end of the calibration in this study. Recovery: We performed the recovery study by determining the peak area ratios of bile acids to IS in SPE solution and SBE solution. The percent recovery was calculated as: Recovery% R SBE R SPE 100% Independent of the LC-ESI-MS interface and ionization method, the recovery measures the efficiency of bile acids extraction process during sample pre-treatment. The recovery of different bile acids varied from 91% to 109.8%, 86.7% to 99.8% and 91.3% to 111.4% under 0.2μmol/L, 2μmol/L and 4μmol/L levels, respectively (Table 2.4). This showed that our sample preparation method was adequate to recover bile acids from pouch aspiration. 80
96 Table 2.4 Recovery of bile acids at three concentrations (n=3) Concentration Bile Acids (μmol/l) Recovery (%) CA CDCA UDCA DCA LCA TCDCA GCDCA
97 Accuracy and Precision: Accuracy in terms of percent relative error was determined five replicates per concentration for three different QC samples of 0.2, 2 and 4 μmol/l. The relative error of the SA-IS method was -7.0% to 12.1%, which was within the acceptable values for FDA guideline ( 20% for LLOQ and 15% for all QC samples) (Table 2.5). The intra- and inter-assay precision of this SA-IS method were investigated by five replicating analysis of the QC samples in triplicate run. The CV % ranged from 0.8% to 11.4%. The results have shown that this analytical method is accurate and precise for the quantification of bile acids in pouch aspiration within the range of 0.05 μmol/l-5 μmol/l. 82
98 Table 2.5 Accuracy and intra- and inter-precision in the analysis of bile acids in pouch aspiration by the SA-IS method Bile Acids Spiked Concentration (μmol/l) Accuracy RE(%) (n=5) Intra-assay CV(%) (n=5) Inter-assay CV(%) (n=3) CA CDCA UDCA DCA LCA TCDCA GCDCA
99 Method application During the treatment of UC, pouchitis is the most common and non-specific inflammatory disease developed in the built ileal pouch after IPAA surgery. Currently the diagnosis criteria of pouchitis are mainly based on clinical symptoms and endoscopic and histologic value inflammation [5]. To study of the bile acids profile for diseases developed after IPAA, we applied the SA-IS method to measure the concentration of bile acids in the pouch aspiration samples from the patients diagnosed as pouchitis (No. 570 and No. 588) and normal pouch (No. 839 and No. 232). The SIM chromatograms demonstrated that all bile acids peaks were clearly detected and sufficiently separated (Fig. 2.8). Comparing to normal pouch patients, pouchitis patients showed a relatively higher concentration of total bile acids and increased ratio of conjugated bile acids (Table 2.6). However, a broader investigation with more pouch aspiration samples will be required in future studies to determine whether the bile acids profile will become a new index for the diagnosis of pouchitis. 84
100 Figure 2.8, Chromatograms of bile acids in pouch aspiration sample No
101 Table 2.6 Bile acids concentrations in four pouch aspiration samples of patients diagnosed as pouchitis and normal pouch after IPAA Bile Acids Class Primary Secondary Bile Acids Pouchitis Found concentrations (μmol/l) Normal Pouch No. 570 No. 588 No. 839 No. 232 CA CDCA TCDCA GCDCA UDCA ND a 9.6 DCA LCA Total Bile Acids (μmol/l) Secondary Bile Acids (%) Conjugated Bile Acids (%) a Not detected 86
102 The SA-IS method developed in this work can potentially be used to study bile acids profile in patients with other types of IBD, from whom fecal materials can be collected during the routine colonscopic surveillance. In addition, the SA-IS method is accurate and robust, thus it can serve as a reference for researchers to develop other technologies to profile bile acids in fecal materials Conclusion Severe matrix effect was observed when quantifying bile acids in pouch aspiration by LC-ESI-MS. Ionization suppression caused by co-eluting matrix components varied greatly among samples, and it introduced large errors for the measurement using the internal standard method. In this study, a standard addition coupled with internal standard method has been developed and validated to solve the matrix effect problem. We demonstrated that this SA-IS method could effectively correct the ionization suppression effect caused by matrix molecules, thus significantly improve the accuracy of measurements. To the best of our acknowledge, this is the first study utilizing the combination of standard addition and internal standard to correct matrix effect during the LC-MS analysis. Compared with existing methods, the SA-IS method involves internal standard and simple sample preparation. The method was validated to ensure high sensitivity, accuracy, and precision. We have successfully demonstrated its potential use in analysis of bile acids in pouch aspiration. The SA-IS method can be a general method for bioanalysis in the presence of matrix effect. 87
103 2.4. Reference [1] AM L. The Bile Acids. New York: Plenum Press; [2] Einarsson K, Ericsson S, Ewerth S, Reihner E, Rudling M, Stahlberg D, et al. Bile acid sequestrants: mechanisms of action on bile acid and cholesterol metabolism. Eur J Clin Pharmacol 1991;40 Suppl 1:S [3] Bernstein H, Bernstein C, Payne CM, Dvorakova K, Garewal H. Bile acids as carcinogens in human gastrointestinal cancers. Mutat Res 2005;589: [4] Lakatos PL. Recent trends in the epidemiology of inflammatory bowel diseases: up or down? World J Gastroenterol 2006;12: [5] Shen B, Fazio VW, Remzi FH, Lashner BA. Clinical approach to diseases of ileal pouch-anal anastomosis. Am J Gastroenterol 2005;100: [6] Salemans JM, Nagengast FM. Clinical and physiological aspects of ileal pouchanal anastomosis. Scand J Gastroenterol Suppl 1995;212:3-12. [7] Kruis W, Kalek HD, Stellaard F, Paumgartner G. Altered fecal bile acid pattern in patients with inflammatory bowel disease. Digestion 1986;35: [8] Natori H, Utsunomiya J, Yamamura T, Benno Y, Uchida K. Fecal and stomal bile acid composition after ileostomy or ileoanal anastomosis in patients with chronic ulcerative colitis and adenomatosis coli. Gastroenterology 1992;102: [9] Keller S, Jahreis G. Determination of underivatised sterols and bile acid trimethyl silyl ether methyl esters by gas chromatography-mass spectrometry-single ion monitoring in faeces. J Chromatogr B Analyt Technol Biomed Life Sci 2004;813:
104 [10] Batta AK, Salen G, Batta P, Tint GS, Alberts DS, Earnest DL. Simultaneous quantitation of fatty acids, sterols and bile acids in human stool by capillary gasliquid chromatography. J Chromatogr B Analyt Technol Biomed Life Sci 2002;775: [11] Alnouti Y, Csanaky IL, Klaassen CD. Quantitative-profiling of bile acids and their conjugates in mouse liver, bile, plasma, and urine using LC-MS/MS. J Chromatogr B Analyt Technol Biomed Life Sci 2008;873: [12] Ye L, Liu S, Wang M, Shao Y, Ding M. High-performance liquid chromatography-tandem mass spectrometry for the analysis of bile acid profiles in serum of women with intrahepatic cholestasis of pregnancy. J Chromatogr B Analyt Technol Biomed Life Sci 2007;860: [13] Perwaiz S, Tuchweber B, Mignault D, Gilat T, Yousef IM. Determination of bile acids in biological fluids by liquid chromatography-electrospray tandem mass spectrometry. J Lipid Res 2001;42: [14] Cote C, Bergeron A, Mess JN, Furtado M, Garofolo F. Matrix effect elimination during LC-MS/MS bioanalytical method development. Bioanalysis 2009;1: [15] Mei H, Hsieh Y, Nardo C, Xu X, Wang S, Ng K, et al. Investigation of matrix effects in bioanalytical high-performance liquid chromatography/tandem mass spectrometric assays: application to drug discovery. Rapid Commun Mass Spectrom 2003;17:
105 [16] Dams R, Huestis MA, Lambert WE, Murphy CM. Matrix effect in bio-analysis of illicit drugs with LC-MS/MS: influence of ionization type, sample preparation, and biofluid. J Am Soc Mass Spectrom 2003;14: [17] Jemal M, Xia YQ. LC-MS Development strategies for quantitative bioanalysis. Curr Drug Metab 2006;7: [18] Scherer M, Gnewuch C, Schmitz G, Liebisch G. Rapid quantification of bile acids and their conjugates in serum by liquid chromatography-tandem mass spectrometry. J Chromatogr B Analyt Technol Biomed Life Sci 2009;877: [19] Fini A, Roda A. Chemical properties of bile acids. IV. Acidity constants of glycine-conjugated bile acids. J Lipid Res 1987;28: [20] Roda A, Minutello A, Angellotti MA, Fini A. Bile acid structure-activity relationship: evaluation of bile acid lipophilicity using 1-octanol/water partition coefficient and reverse phase HPLC. J Lipid Res 1990;31: [21] Ando M, Kaneko T, Watanabe R, Kikuchi S, Goto T, Iida T, et al. High sensitive analysis of rat serum bile acids by liquid chromatography/electrospray ionization tandem mass spectrometry. J Pharm Biomed Anal 2006;40: [22] Tranfo G, Paci E, Sisto R, Pigini D. Validation of an HPLC/MS/MS method with isotopic dilution for quantitative determination of trans,trans-muconic acid in urine samples of workers exposed to low benzene concentrations. J Chromatogr B Analyt Technol Biomed Life Sci 2008;867:
106 [23] Van Eeckhaut A, Lanckmans K, Sarre S, Smolders I, Michotte Y. Validation of bioanalytical LC-MS/MS assays: evaluation of matrix effects. J Chromatogr B Analyt Technol Biomed Life Sci 2009;877: [24] Dorlo TP, Hillebrand MJ, Rosing H, Eggelte TA, de Vries PJ, Beijnen JH. Development and validation of a quantitative assay for the measurement of miltefosine in human plasma by liquid chromatography-tandem mass spectrometry. J Chromatogr B Analyt Technol Biomed Life Sci 2008;865: [25] Mims D, Hercules D. Quantification of bile acids directly from plasma by MALDI-TOF-MS. Anal Bioanal Chem 2004;378: [26] Bansal S, DeStefano A. Key elements of bioanalytical method validation for small molecules. AAPS J 2007;9:E [27] Benijts T, Dams R, Lambert W, De Leenheer A. Countering matrix effects in environmental liquid chromatography-electrospray ionization tandem mass spectrometry water analysis for endocrine disrupting chemicals. J Chromatogr A 2004;1029: [28] Ito S, Tsukada K. Matrix effect and correction by standard addition in quantitative liquid chromatographic-mass spectrometric analysis of diarrhetic shellfish poisoning toxins. J Chromatogr A 2002;943: [29] Basilicata P, Miraglia N, Pieri M, Acampora A, Soleo L, Sannolo N. Application of the standard addition approach for the quantification of urinary benzene. J Chromatogr B Analyt Technol Biomed Life Sci 2005;818:
107 CHAPTER III THE DEVELOPMENT OF A ROBUST AND SENSITIVE LC-MS/MS METHOD FOR THE QUANTIFICATION OF AN ANTI-CANCER AGENT IN RAT PLASMA 3.1. Introduction of anti-cancer agent JCC76 In United States, more than 40,000 women die each year from metastatic breast cancer. Overexpression of human epidermal growth factor receptor 2 (Her2) occurs in about 25%-30% metastatic breast cancer. As a member of ErbB family of receptor tyrosine kinases [1], HER2 is preferred for ligand binding and the receptor dimerization activated multiple downstream signaling cascades, which promote cellular proliferation, survival, migration, invasion, and differentiation. HER2 overexpressed breast cancer has an increased tendency for metastasis and leads to a relative resistance to same cytotoxic and hormone therapy [2,3]. Therefore, HER2 tumors are considered to be more aggressive and often have poor prognosis [4]. Previous research showed that the level of HER2 92
108 expression was closely related to the tumor growth, indicating HER2 as on of the most valuable targets for breast cancer therapy [5,6]. Nimesulide is a nonsteroidal anti-inflammatory drug (NSAIDs) that inhibits cyclooxygenase-2 (COX-2) activity. Besides its anti-inflammatory activity, nimesulide has been reported to inhibit proliferation and induce apoptosis of a variety of human cancer cell lines including lung, ovarian, and breast cancer [7-9]. Other research demonstrated that the novel sulfonanilide derivatives of nimesulide significantly increased the activity in inhibiting breast cancer cell growth in comparison to that of nimesulide [10-11]. JCC76 {Cyclohexanecarboxylic acid [3-(2,5-dimethyl-benzyloxy)- 4-(methanesulfonylmethyl-amino)-phenyl]-amide} is a novel compound deviated from nimesulide without COX-2 inhibitory activity [12]. Recently, this lead compound JCC76 was found to have potent activity against human epidermal growth factor receptor 2 (HER2) overexpressing breast cancer [10]. In the in vitro study, JCC76 was found to dramatically inhibit HER2 overexpression cell proliferation (i.e., SKBR-3, BT474 and MDA-MB-453 cell lines) [13]. In addition, this compound induced apoptosis in HER2 overexpressing cells (i.e., SKBR-3), but it was less active in HER2 negative cells (i.e., MCF-7 and MDA-MB-231), which suggested the selective inhibition of HER2 overexpressing breast cancer cells [13]. In the in vivo study, JCC76 significantly decreased the size of breast tumor in the mice xenograft experiments [14]. Based on these results of pharmacological study, JCC76 demonstrated high potential to be a target therapeutic agent acting on HER2 positive breast cancer. 93
109 In order to provide insights into the drug developability for targeted breast cancer therapy, a quantitative method for JCC76 is needed for the further pharmacological and toxicological studies. To date, no analytical assay for JCC76 has been reported. The low concentration of JCC76 in blood requires the measurement to be sensitive and specific. Because of the multiple blood sampling from a single animal model during a short time, only a low volume of sample can be used for each analysis. In previous studies, the extraction methods for the class of COX-2 inhibitors, which have similar chemical structure with JCC76, employed large amount of sample volume ( μl) and solvent consumption (4-8 ml), and complex sample pre-treatment procedures of solid phase extraction for each analysis [15-17]. In this work, we have developed a single-step LLE method to clean up the sample matrix and to ensure high extraction recovery. The extraction procedure is fast and simple, and it consumes less sample volume and solvent. Furthermore, the present study provided a short time for each LC-MS/MS analysis and high sensitivity with a lower limit of quantification (LLOQ) of 0.3 ng/ml. Finally, we successfully illustrated the preclinical application of this method with a pharmacokinetics study of JCC76 in rats Material and methods Reagents and chemicals 94
110 JCC76 and IS (compound 75) were synthesized according to previously published procedures (Fig. 3.1) [18]. Their purities were higher than 97%, confirmed by NMR and HPLC analysis. Methanol, acetonitrile, ethyl acetate, and methyl tert-butyl ether (MTBE) of HPLC grade and ammonium formate were purchased from Sigma-Aldrich (St. Louis, MO, USA). N-hexane of HPLC grade was obtained from Pharmco-AAPER (Shelbyville, KY, USA). Deionized water was purified by Barnstead NANOpure water purification system from ThermoScientific (Waltham, MA, USA). Pooled blank rat plasma was purchased from Lampire Biological Laboratories (Pipersville, PA, USA). 95

111 Figure 3.1, Chemical structures of JCC76 and the internal standard Compound 75 96
112 LC-MS/MS instrumentation The HPLC system consists of two LC-20AD pumps, a DGU-20A 3 degasser, a SIL-20AC autosampler, and a CBM-20A module (Shimazu, Tokyo, Japan). The chromatographic separation was performed on a Luna C18 column (2.0 mm 150 mm, 5 μm) with a guard column (2 mm 40 mm, 5 μm) from Phenomenex (Torrance, CA, USA). The mobile phase was a mixture of aqueous ammonium formate (ph 3.7; 5 mm)-methanol (1:9, v/v). Isocratic elution at a flow rate of 0.2 ml/min was employed. The injection volume was 5 μl and each run time was 5 min. The mass spectrometric detection was performed on an AB Sciex QTrap 5500 system (AB Sciex, Toronto, Canada) with positive electrospray ionization (ESI + ). The multiple reaction monitoring (MRM) function was used to measure the transition of m/z 445 to and m/z to for JCC76 and IS, respectively. The optimized parameters for detecting JCC76 and IS were set as following: the ion spray voltage was 5500 ev; the temperature was at 450 C; the heating gas (GS1), nebulization gas (GS2), and curtain gas (CUR) were 30, 40, and 45 psi, respectively. Compound parameters, including declustering potential (DP), entrance potential (EP), collision energy (CE), and collision exit potential (CXP) for both JCC76 and IS, were set at 60, 10, 21, and 10 V, respectively. Data acquisition and quantitation were performed using Analyst software version Preparation of calibration standards and QC samples 97
113 The stock standard solutions of JCC76 and IS were prepared by dissolving each compound in acetonitrile at 1 mg/ml and stored at -20 C. One set of JCC76 working solutions at 3, 10, 20, 100, 200 and 1000 ng/ml, was prepared by serial dilution from the stock solution with water-acetonitrile (1:1, v/v), and then used for preparing the calibration standards. Another set of JCC76 working solutions at 3, 9, 90, and 900 ng/ml was made in the similar way, and used for preparing QC samples. The working solution of IS was prepared by diluting the IS stock solution to 50 ng/ml. All of the working solutions were freshly prepared before use. The calibration standards were prepared by spiking 5 μl of JCC76 working solutions into 45 μl blank rat plasma to give the final concentration of JCC76 at 0.3, 1, 2, 10, 2 and 100 ng/ml. The QC samples were prepared in a similar way at 0.3, 0.9, 9 and 90 ng/ml, representing lower limit of quantification (LLOQ), low QC (LQC), middle QC (MQC) and high QC (HQC) of JCC76 in plasma, respectively. All of the calibration standards and QC samples were further treated in the same sample preparation procedure described below Sample preparation Aliquots of 50 μl rat plasma sample, from the calibration standards, QC samples and pharmacokinetics study samples, were mixed with 5 μl IS working solution (50 ng/ml). After vortexing for 10 seconds, the samples went through a single step liquid-liquid extraction with 500 μl of an MTBE-hexane mixture (1:2, v/v). After vortexing for 60 s, 98
114 the mixture was centrifuged at 10,000 rpm for 5 min. Then 420 μl supernatant was separated, and evaporated using a centri-vap vacuum evaporation system (Labconco, MO, USA). The dry residues were reconsititued in 42 μl 50% acetonitirle for LC-MS/MS analysis Method validation Calibration, sensitivity, and selectivity: Calibration curves were constructed by using the peak area ratios of JCC76 to IS (y) versus concentrations of JCC76 (x) in the calibration standards. The weighted linear regression was generated by using 1/x as weighting factor. The LLOQ was determined as the lowest concentration in calibration curve that can be quantified with the accuracy and precision within 20%. The selectivity of this method was evaluated by testing the presence of the interfering peak in blank plasma samples from six different sources. Matrix effect and recovery: The absolute/relative matrix effect and recovery were studied at three QC levels: 0.9, 9 and 90 ng/ml. The absolute matrix effect was determined by comparing the peak area of analyte spiked in the post-extraction solution of blank plasma with those of standard solution at equivalent concentration. The relative matrix effect was studied by comparing the peak area ratio of analyte and IS spiked in the blank plasma post-extraction solution with that in standard solution. The post-extraction solution was prepared by extracting blank plasma using procedures in section
115 The absolute recovery was determined by comparing the peak area of JCC76 spiked in plasma before extraction with that in post-extraction spiked sample. The relative recovery was determined by comparing the peak area ratio of JCC76 to IS spiked in plasma before extraction with that in post-extraction spiked sample. Accuracy and precision: Intra- and inter-assay precision and accuracy were assessed using QC samples at four different concentrations: LLOQ, LQC, MQC and HQC. Intraassays were carried with five replicates (n=5) for each concentration in the same day, while inter-assays were performed with five replicates (n=5) in different days. The precision results were expressed as percent relative standard deviation (% RSD) and the accuracy results were expressed as percent relative error (% RE). The dilution QC was also prepared to study the accuracy and precision in cases when samples concentration was above the highest concentration of the calibration curve. The dilution QC samples (n=5) contained were prepared by spiking JCC76 into blank rat plasma at 900 ng/ml, and then were 10 times diluted with blank rat plasma before extraction. Following the same sample preparation procedures, the dilution QC samples were analyzed and their concentrations were compared with the nominal concentration. Stability: The storage stability was investigated with blank plasma spiked with JCC76 at LQC level (0.9 ng/ml) and HQC level (90 ng/ml) in triplicates going through the following conditions: sitting in room temperature for 4, 6 and 24 hr, three freeze-thaw cycles, -20 C for 30 days, and post-extraction storage at 4 C for 24 hr. For the freeze- 100
116 thaw stability study, the spiked samples were subjected to three freeze (-20 C)-thaw (room temperature) cycles and each cycle was 24 hr Pharmacokinetics study The feasibility of this quantitative method was tested through a pharmacokinetics study of JCC76 in rats. Male Sprague Dawley rats (each weight g) were purchased from Charles River Laboratories International (Spencerville, OH, USA). The animals were housed in a 12 h light/dark cycle room with free access to food and water for at least 7 days to adapt to the environment. All the animal experiment procedures were performed under the guideline approved by Institutional Animal Care and Use Committee at Cleveland State University. Before the intraperitoneal(i.p) administration of JCC76 at a single dose of 5 mg/kg, animals were fasted overnight but with free access to water. Blood samples of 150 μl each time point were collected from the saphenous veins and femoral veins into heparinized tubes at 0 hr (before drug administration) and at 0.25, 0.5, 1, 1.5, 2, 3, 4, 6, and 8 h after dosing. The blood samples were centrifuged immediately at 10,000 rpm for 5 min in room temperature. The plasma samples were separated and store at 20 C until analysis. 101
117 The concentration of JCC76 in rat plasma versus time profiles were analyzed to estimate pharmacokinetics parameters using WinNonlin software version 5.2 (Pharsight Corporation, Mountain View, CA, USA) Results and Discussion Mass spectrometric and chromatographic conditions In order to optimize the MS parameters, we introduced standard JCC76 and IS in 90% methanol at 200 ng/ml through infusion into the mass spectrometer at 10 μl/min. The mass spectra from full positive scan of JCC76 and IS showed the protonated molecules [M+H] + with m/z and 439.3, respectively. The most abundant product ion after fragmentation was at m/z for JCC76 and m/z for IS (Fig. 3.2). The fragmentation reactions for both compounds were proposed as the loss of SO 2 CH 3 by 79 u. As a result, the ion detection employed multiple reaction monitoring (MRM) mode with selecting the transition of m/z for JCC76 and m/z for IS. The collision energy, spray voltage, and ion-spray voltage were fine-tuned to obtain the highest MS response. 102
118 Figure 3.2, The precursor/product ion spectra and proposed fragmentation pathways for (A) JCC76 and (B) the internal standard compound
119 The solubility of JCC76 is poor in water with a predicted high Log D value of Therefore, we chose to use a large portion of methanol in the mobile phase to elute the compound from a C18 column. Since the addition of organic acids promotes the protonation of the analyte under positive ESI, several mobile phase modifiers including formic acid, acetic acid, ammonium formate, and ammonium acetate with different concentrations were tested to optimize the chromatographic results. We observed that mobile phase consisting of 5mM ammonium formate-methanol (1:9, v/v) yielded the highest MS response of JCC76, which increased by 2 folds comparing water-methanol (1: 9, v/v) without any modifier. The retention times were 3.04 min for IS and 3.5 min for JCC76 by the isocratic elution. Using the above mobile phase, the peaks of analyte and IS were symmetrical, the sensitivity was improved, and the total run time was controlled within 5 min Sample extraction PPT has been used extensively for the preparation of plasma samples because of its simplicity [19]. To simplify our sample extraction technique, the PPT method for plasma cleaning-up was tested, but matrix suppression of 30%-33% was observed. Adding acetic acid or formic acid into rat plasma prior to the PPT pre-treatment could relieve the ion suppression of the analyte by 6-8%. However, it decreased the extraction recovery by 13-16%. LLE was reported to be more efficient and to provide cleaner extracts than PPT and the SPE for sample preparation in most cases [20]. Much effort was put into finding an 104
120 optimal extraction solvent with high extraction efficiencies and minimal matrix effect for JCC76. We tested extraction solvents ranged from polar to non-polar, which included ethyl acetate, chloroform, methyl chloride, diethyl ether, MTBE, and hexane. Among theses solvents, non-polar ones including MTBE and hexane have much higher extraction recovery than other solvents for JCC76 (Fig. 3.3), which implies that the non-polar solvents favored the extraction for hydrophobic compounds. Regarding the matrix effect, the extraction with MTBE yielded the lowest ion suppression, which agreed with other reports that suggested MTBE is especially efficient in reducing matrix effect by removing the phospholipids in plasma [21]. Based on these observations, parallel extraction experiments based on different ratios of MTBE and hexane mixtures were performed. Finally, we observed that the optimized solvents mixture consisted of MTBE-hexane (1:2, v/v) (Fig. 3.4). This LLE method produced reproducible results of matrix effect less than 10% and high recovery above 90% for the extraction of JCC76 from rat plasma. The extraction procedure is simple, and it uses small amounts of solvent and sample volume. 105

121 Figure 3.3, The comparison of matrix effect and recovery of JCC76 in rat plasma among different LLE solvents. Each column represents the mean ± S.D. (n = 3) 106
122 Method validation Linearity, sensitivity, and selectivity JCC76 calibration curves were established using double blank (blank plasma sample with neither JCC76 or IS), zero blank (blank plasma with IS only), and six non-blank calibration standards at the concentrations of 0.3, 1, 2, 10, 20, and 100 ng/ml. The IS concentration in zero blank and the calibrations standards was 5 ng/ml. The peak area ratio of JCC76 to IS (y) versus JCC76 concentration (x) was plotted using 1/x as weighting factor. The linear regression equation (the slope and intercept in the mean ± SD) obtained in five different days was y = ( )x + ( ). The linearity was excellent over the range of ng/ml with the correlation coefficients above for all calibration curves built in different days. Accuracy and precision of all calibrators were within 15% (Table 3.1). As the lowest concentration on the calibration curve, the LLOQ was 0.3 ng/ml. It was sufficient to determine the concentration of JCC76 in rat plasma for pharmacokinetic study. 107
123 Table 3.1 Accuracy and Precision of JCC76 calibration standards over ng/ml Nominal Concentration Determined Concentration Accuracy % Precision % % 3.9% % 1.7% % 7.3% % 0.8% % 1.6% % 3.6% 108
124 The selectivity was investigated from blank plasma from six different sources. LC- MS/MS chromatograms of blank plasma, blank plasma spiked with JCC76 and IS, and a rat plasma sample after i.p. administration of JCC76 were compared (Fig. 3.4). No endogenous inferences at the retention times at 3.5 min for JCC76 and at 3.04 min for IS were found in six different blank plasma samples, indicating high selectivity and specificity of this method for the analysis of JCC76 in rat plasma matrix. 109
 blank rat plasma, (B) blank plasma")
 and IS (5 ng/ml, 3.")
125 Figure 3.4, The MRM chromatograms of (A) blank rat plasma, (B) blank plasma spiked with JCC76 at LLOQ level (0.3 ng/ml 3.54 min) and IS (5 ng/ml, 3.02 min), and (C) a real rat plasma sample collected 8 hr after an i.p. administration of 5 mg/kg JCC76 spiked with IS 110
126 Matrix effect and recovery The matrix effect and extraction recovery was further evaluated at three levels: 0.9, 9, and 90 ng/ml. As shown in Table 3.2, the absolute matrix effect at three concentrations ranged from 3.1% to 9.2%, and the relative matrix effect ranged from -6.1% to 4.3%, indicating no obvious signal suppression or enhancement for the ionization of JCC76 in rat plasma matrix. The extraction of JCC76 at three levels showed absolute recovery of 89.5% to 97.3% and relative recovery of 105.1% to 106.1% after the IS normalization. The results indicated that the extraction procedure was not only sufficient to remove the interference impurities from the sample matrix. 111
127 Table 3.2, Absolute and relative matrix effect and recovery of JCC76 in rat plasma Concentration (ng/ml) Matrix Effect Absolute Relative ME ME Recovery Absolute Relative Recovery Recovery % -6.1% 96.9% 106.1% 9 8.8% 3.7% 89.5% 105.1% % 4.3% 97.3% 105.1% 112
128 Accuracy, precision, and dilution integrity As the results shown in Table 3.3, the inter- and intra-assay accuracy and precision were within 10%, indicating the this method is accurate, precise, and reproducible. Since some samples containing JCC76 above the highest concentration of calibration curve, we also investigated the accuracy and precision after ten times dilution of dilution QC by blank sample matrix. The results showed that the intra- and inter-accuracy of the dilution samples were -0.1% and 2.1%, respectively. The intra- and inter-precision results were 0.8% and 1.6%. This result suggests that the plasma sample can be diluted and then analyzed when the concentration of JCC76 is above the upper limit of calibration. 113
129 Table 3.3, Intra- and Inter- assay accuracy and precision of JCC76 in rat plasma Intra-assay Inter-assay Nominal (ng/ml) Determined (ng/ml) Accuracy %RE SD Precision %RSD Determined (ng/ml) Accuracy %RE SD Precision %RSD % % % % % % % % % % % % % % % % % % % % 114
130 Stability The results of the stability tests were summarized in Table 3.4. At room temperature, JCC76 was found to be stable for at least 24 h. The post-extraction stability study of JCC76 indicated its stability in the reconstitution solvent for at least 24 h. After three freeze-thaw cycles, the recovery of JCC76 was 78.2 % at LQC and 85.5 % at HQC levels. The long-term storage stability for JCC76 at -20 C for 30 days was 89.2 % and 79.3% at LQC and HQC levels, respectively. 115
131 Table 3.4, Stability test of JCC76 in rat plasma Storage Conditions Concentration (ng/ml) Recovery % At room temperature for 4 hr % % At room temperature for 6 hr % % At room temperature for 24 hr % % Three freeze-thaw cycles % % Post-extraction at 4 C for 24 hr % % Long-term stability (at -20 C for 30 days) % % 116
132 Pharmacokinetic study The feasibility of this method was tested by the application of a preclinical pharmacokinetics study in rats. The mean JCC76 concentration in plasma versus time profile was presented in Fig The maximum concentration of JCC76 (C max ) in plasma was 528 ng/ml, which was reached at 0.5 h (T max ) after dosing. The pharmacokinetics parameters were estimated through compartmental analysis and the concentration time profile was found to fit a two-compartment model. The estimated AUC 0-, total body clearance, and volume of distribution were 1962 (ng h)/ml, 2.5 L/(h kg), and 7.0 L/kg, respectively. 117
133 Figure 3.5, Mean plasma concentration-time profile of JCC 76 after the i.p. injection of JCC 76 at a single dose of 5 mg/kg. Each point represents the mean ± S.D. (n = 4) 118
134 3.4. Conclusion In the presented work we have developed and validated a LC-MS/MS method for the quantification of JCC76 in a biological matrix for the first time. This method is simple, sensitive, and specific for the analysis of JCC76 in rat plasma. It used a one-step liquidliquid extraction for sample preparation and a short time for LC-MS/MS analysis. The LLOQ of this method was as low as 0.3 ng/ml and the accuracy and precision were lower than 10%. The stability tests were performed under different storage and handling conditions and the results showed the suitability of this method for high throughput routine analysis. We have successfully applied this method in the determination of JCC76 in rat plasma for the pharmacokinetics study. This method will be further used in pharmacokinetics and toxicokinetics studies in animals in the future. It could be valuable for supporting the new drug investigation and application. 119
135 3.5. Reference [1] Slamon DJ, Godolphin W, Jones LA, Holt JA, Wong SG, Keith DE, et al. Studies of the HER-2/neu proto-oncogene in human breast and ovarian cancer. Science 1989;244: [2] Casalini P, Botta L, Menard S. Role of p53 in HER2-induced proliferation or apoptosis. J Biol Chem 2001;276: [3] Tiwari RK, Borgen PI, Wong GY, Cordon-Cardo C, Osborne MP. HER-2/neu amplification and overexpression in primary human breast cancer is associated with early metastasis. Anticancer Res 1992;12: [4] Dean-Colomb W, Esteva FJ. Her2-positive breast cancer: herceptin and beyond. Eur J Cancer 2008;44: [5] Roh H, Pippin J, Drebin JA. Down-regulation of HER2/neu expression induces apoptosis in human cancer cells that overexpress HER2/neu. Cancer Res 2000;60: [6] Menard S, Pupa SM, Campiglio M, Tagliabue E. Biologic and therapeutic role of HER2 in cancer. Oncogene 2003;22: [7] Grimes KR, Warren GW, Fang F, Xu Y, St Clair WH. Cyclooxygenase-2 inhibitor, nimesulide, improves radiation treatment against non-small cell lung cancer both in vitro and in vivo. Oncol Rep 2006;16: [8] Li W, Zhang HH, Xu RJ, Zhuo GC, Hu YQ, Li J. Effects of a selective cyclooxygenase-2 inhibitor, nimesulide, on the growth of ovarian carcinoma in vivo. Med Oncol 2008;25:
136 [9] Liang M, Yang H, Fu J. Nimesulide inhibits IFN-gamma-induced programmed death-1-ligand 1 surface expression in breast cancer cells by COX-2 and PGE2 independent mechanisms. Cancer Lett 2009;276: [10] Su B, Chen S. Lead optimization of COX-2 inhibitor nimesulide analogs to overcome aromatase inhibitor resistance in breast cancer cells. Bioorg Med Chem Lett 2009;19: [11] Brueggemeier RW, Su B, Darby MV, Sugimoto Y. Selective regulation of aromatase expression for drug discovery. J Steroid Biochem Mol Biol 2010;118: [12] Suleyman H, Cadirci E, Albayrak A, Halici Z. Nimesulide is a selective COX-2 inhibitory, atypical non-steroidal antiinflammatory drug. Current Medicinal Chemistry 2008;15: [13] Chen B, Su B, Chen S. A COX-2 inhibitor nimesulide analog selectively induces apoptosis in Her2 overexpressing breast cancer cells via cytochrome c dependent mechanisms. Biochem Pharmacol 2009;77: [14] Zhong B, Cai X, Yi X, Zhou A, Chen S, Su B. In vitro and in vivo effects of a cyclooxygenase-2 inhibitor nimesulide analog JCC76 in aromatase inhibitorsinsensitive breast cancer cells. J Steroid Biochem Mol Biol 2011;126: [15] Barrientos-Astigarraga RE, Vannuchi YB, Sucupira M, Moreno RA, Muscara MN, De Nucci G. Quantification of nimesulide in human plasma by highperformance liquid chromatography/tandem mass spectrometry. Application to bioequivalence studies. J Mass Spectrom 2001;36:
137 [16] Schonberger F, Heinkele G, Murdter TE, Brenner S, Klotz U, Hofmann U. Simple and sensitive method for the determination of celecoxib in human serum by highperformance liquid chromatography with fluorescence detection. J Chromatogr B Analyt Technol Biomed Life Sci 2002;768: [17] Brautigam L, Seegel M, Tegeder I, Schmidt H, Meier S, Podda M, et al. Determination of 8-methoxypsoralen in human plasma, and microdialysates using liquid chromatography-tandem mass spectrometry. J Chromatogr B Analyt Technol Biomed Life Sci 2003;798: [18] Su B, Darby MV, Brueggemeier RW. Synthesis and biological evaluation of novel sulfonanilide compounds as antiproliferative agents for breast cancer. J Comb Chem 2008;10: [19] Xu RN, Fan L, Rieser MJ, El-Shourbagy TA. Recent advances in high-throughput quantitative bioanalysis by LC-MS/MS. J Pharm Biomed Anal 2007;44: [20] Rodila RC, Kim JC, Ji QC, El-Shourbagy TA. A high-throughput, fully automated liquid/liquid extraction liquid chromatography/mass spectrometry method for the quantitation of a new investigational drug ABT-869 and its metabolite A in human plasma samples. Rapid Commun Mass Spectrom 2006;20: [21] Jemal M, Ouyang Z, Xia YQ. Systematic LC-MS/MS bioanalytical method development that incorporates plasma phospholipids risk avoidance, usage of incurred sample and well thought-out chromatography. Biomed Chromatogr 2010;24:
138 CHAPTER IV PROTEOMICS STUDY FOR POTENTIAL BIOMARKER ANALYSIS OF OVARIAN CANCER 4.1. Introduction Ovarian cancer is the leading cause of death from gynecological malignancies worldwide. The lifetime risk of ovarian cancer for women is about 1.6% and the risk increases with age and deceases with pregnancy. The majority of ovarian cancers tend to present as advanced stage, resulting in as high mortality rate as 56% [1,2]. The International Federation of Obstetrics and Gynecology (FIGO) staging system describes the early stage (stage I and II) and advanced stage (stage III and IV) of ovarian cancer as follows: stage I disease involves one or both ovaries; stage II disease is defined as the spread tumor limited to pelvis; stage III disease involves the spread tumor with 123
139 peritoneal implants; and stage IV tumor is the distant spread tumor of metastasis [3, 4]. The early diagnosis of ovarian cancer can increase survival significantly. When the tumor is still confined to the ovary in early stage, detection and surgical removal of cancerous tissues result in cure for over 90% patients [3]. However, the ovary is not symptomatic in the stage I and II. Compared to breast, prostate, and colon cancer, ovarian cancer is anatomically more difficult to be assessed during physical examination due to the location of the ovary. Therefore, a very promising approach to improve the mortality rate for ovarian cancer is to discover reliable biomarkers and to develop adequate sensitive and specific screening test for early detection. The biomarkers associated with the development of ovarian malignancy have been investigated in blood, tissue, and other biofluids using DNA microarrays and proteomics. With advantages in characterizing post-translation modifications of proteins, proteomics is believed to be one of the most attractive approaches for biomarker discovery. The technological obstacles of proteomics profiling for ovarian cancer include the lack of sensitivity of mass spectrometric detection, the mask of low-molecular weight proteins by the abundant proteins, and the discrimination of ovarian carcinoma from benign tumors. The only approved serum biomarker CA-125 has been used for remission monitoring of ovarian cancer, but not for screening. It fails to reach the sensitivity and specificity for a screening test of early stage ovarian cancer detection. The elevated level of CA-125 was found in approximately 80%-85% of patients with advanced stage ovarian cancer, but in only 50% of patients in early stage [5]. In addition, elevated levels of CA-125 are also 124
140 associated with a variety of other conditions including other cancers (pancreatic, breast, bladder, liver and lung), benign and malignant breast and colon diseases, peritoneal irritants, and benign gynecologic diseases [6-8]. Nevertheless, new technologies in mass spectrometry for discovering other novel proteomics markers are emerging, aimed to improve the sensitivity and specificity of current screening tests. Due to the dynamic range of proteins present in the serum, high abundance proteins were removed to increase the possibility of low molecular weight protein detection. Matrixassisted desorption/ionization time-of-flight mass spectrometry (MALDI-TOF-MS) has been used as an fundamental tool for proteomic study for its efficiency in detecting peptides as low as 1 femtomole [9]. In addition, there is no mass range limitation for the MALDI-TOF analysis and it is preferable for fast analysis, allowing 100 samples to be finished in less than 10 min [10]. For these major advantages, MALDI-TOF-MS was used for the quick scan of large biomolecules existed in serum samples from ovarian cancer patients. Our group reported differentiated mass spectra derived from cancer patient and normal sera by MALDI-TOF-MS analysis for three major peptide peaks of 1260, 1465, and 1545 Da [11] (Fig. 4.1). 125
141 Figure 4.1, Previous reported analysis on MALDI-TOF-MS pattern for ovarian cancer patient and normal control samples [11]. 126
142 Based on these previous findings, comparative analysis of low molecular weight protein profiling was further preformed by LC-MS/MS in this work. Several sets of samples from patients with ovarian carcinoma, benign tumors, and healthy normal controls were examined to identify carcinoma-associated proteins or peptides as valuable biomarkers for ovarian cancer progression. One of the major MS peaks, which discriminated normal control with cancer patients in MALDI-TOF scanning, was defined by LC-MS/MS analysis. The developed LC-MS/MS method greatly improved the reproducibility in peptides profiling. In addition, the protein fractionation method was refined in terms of higher extraction efficiency and less impurities. At last, the discovered biomarker was validated in benign and carcinoma samples for the improvement of early detection Materials and Methods Materials Acetonitrile and chloroform of HPLC grade, TFA, and formic acid were purchased from Sigma-Aldrich Chemical (St Louis, MO, USA). Deionized water was generated by a Millipore water purification system (Billerica, MA, USA). Phosphate-buffer saline (PBS) solution was purchase from BIO-RAD (Hercules, CA, USA) Patient samples 127
143 Human serum samples from healthy individuals were purchased from Sigma-Aldrich (St Louis, MO, USA). The serum samples from patients diagnosed with advanced stage ovarian cancer of carcinoma (N=40) and benign diseases (N=20) were obtained from Gynecologic Oncology Group (GOG) tissue bank (Buffalo, NY, USA). Among the forty carcinomas samples, there were twenty papillary serous carcinomas, ten mucinous carcinomas, five endometrioid carcinomas, and five clear cell carcinomas; As the twenty benign samples, there were ten serous benign, five mucinous benign, and five other benign. This project was approved by the Institutional Review Board at Cleveland State University Serum peptide fractionation The low molecular weight peptides were separated from the abundant proteins in serum by protein precipitation. An aliquot of 40 μl serum was mixed with 1 ml 90% methanol in water. After vortexing for 1 min, the mixture was centrifuged at 10,000 rpm by a Beckman Coulter Allegra TM X-22R Centrifuge for 5 min to precipitate the proteins. The clear supernatants were removed and then evaporated to dryness by centri-vap vacuum evaporation system (Labconco, MO, USA). The dry residues were re-dissolved in 400 μl water. Afterward, the solution was cleaned by adding 200 μl chloroform for liquid-liquid extraction. The chloroform phase and aqueous phase were well mixed by vortexing for 2 min. The mixture was centrifuged at 10,000 rpm for 5 min and the upper layer was carefully removed. After evaporating and concentrating the sample to 60 μl, an aliquot of 10 μl solution was injected to the LC-MS/MS system for analysis. 128
144 Online peptide trap setup Prior to the micro-flow LC separation, the injected peptide sample was cleaned and desalted by an online peptide trap setup. As illustrated in Fig. 4.2, at the sample loading position, the trap peptide cartridge (CapTrap, Michrom) was connected with sample injector; at sample elution position, the peptide trap was connected with elution buffer pump and capillary HPLC column. After the sample was loaded into the peptide trap in 10 min, the column switch was changed to sample elution position. The switched elution buffer eluted the sample from the trap to the HPLC column. 129

145 Figure 4.2, Online peptide trap setup 130
146 Serum protein analysis by LC-MS/MS The micro-lc-ms/ms system consisted of an Aglient 1100 HPLC, an online-extraction system, and a Bruker HCT 3000 plus ESI IonTrap Mass Spectrometer. The chromatographic separation of peptides was carried out on a Vydac C18 capillary reverse phase HPLC column (100 mm 300 μm ID, 5 μm) at room temperature (23 C). The mobile phase used 0.1 % formic acid in water: acetonitrile (99:1, v/v) as aqueous phase A and 0.1% formic acid in water: acetonitrile (1: 99, v/v) as organic phase B. The following gradient elution program was applied for all the peptide analysis: at the beginning of LC, 2% B was hold for 10 min, then increased to 90 % B in 70 min, following by maintaining 90% B for 20 min, and at last returned to 2% B for 10 min for re-equilibration. The flow was maintained at 5 μl/min through the analysis. The mass spectrometer was operated in positive ESI mode. MS/MS data were acquired at a scanning mode of standard-enhanced at a range of m/z. The nebulization gas, drying gas, and dry temperature were set as: 11 psi, 5 L/min, and 300 C, respectively. The tandem MS data were used to search matched peptide fingerprints against NCBInr protein database by Mascot Program ( The following searching parameters were applied: no trypsin, no taxonomy or modification, peptide mass tolerance is ± 1.0 Da, MS/MS tolerance is ± 0.5 Da, all possible charge states (i.e. + 1, +2, and +3), and a mass window between 0 and 100 kda. To reduce the number of false-positive signals, only significant hits with at least 4 matching peptide masses were considered as final results. 131
147 4.3. Results Identification of differentially expressed low molecular weight peptides Based on the results of MALDI-TOF-MS pattern analysis reported previously [11], the clinical serum samples of 20 ovarian caner patient and 18 normal healthy controls generated a panel of biomarkers. By comparing the typical MS pattern, significant differences were observed regarding three peaks with the following m/z: 1465 Da, 1260 Da, and 1535 Da [11]. However, this method is poor in reproducibility and is not able to identify the peptide with corresponding MS spectra. To compensate for this disadvantage, ESI-MS was used for improving the reproducibility in this study since no crystallization process during ionization is involved in ESI compared to MALDI. The mass spectrometer generated the spectra of both precursor ions and fragmentation ions, which were further analyzed by the computer to search for matching protein information in the database. Since HPLC was often necessary to separate the complex proteomic sample prior to the MS analysis, we conducted capillary LC to analyze pre-fractionated serum samples from ovarian cancer patient group and normal control group. Initially, the mixture of six patient samples and the mixture of six ovarian cancer patient samples were analyzed. From the resulting chromatograms, we noted that the major 132
148 difference between these two sample mixtures was a peak appearing at 42 min in cancer group but not in control group (Fig. 4.3). In the averaged MS spectra generated by this characteristic peak, the double charged MS peak of m/z 733 had the highest signal intensity. This finding was consistent with the result from previous MALDI-TOF-MS analysis, which showed the most abundance peptide peak at 1465 Da. 133
149 Figure 4.3, Differentiated LC-MS/MS chromatograms from ovarian cancer group (top) and control group (bottom) 134
150 Further, the mascot database searching was applied using the MS/MS peptide data acquired from the ovarian cancer sera sample. The matched peptide information was identified as des-alanine fibrinopeptide A (des-alanine-fpa) with the sequence of DSGEGDFLAEGGGVR. Des-alanine-FPA is derived from FPA by losing an amino acid and its molecule weight is 1465 Da. Interestingly, we did not find the intact FPA of 1535 Da in neither the cancer patient samples nor in the normal healthy individuals. By carefully looking at the results of Mascot searching, we found that the des-alanine-fpa fragment fingerprints matched up with the MS spectra of peak eluting at 42 min in ovarian cancer serum sample (Fig. 4.4). 135
151 Figure 4.4, The MS spectrum of chromatographic peak eluting at 42 min, with matched MS information with des-alanine-fpa 136
152 Protein fractionation method by organic solvent precipitation Previously our group has successfully removed the abundant proteins by utilizing 80% acetonitrile solution and obtained better prefractionation results compared to centrifugal ultrafiltration. To further optimize this sample preparation method, we compared the signal intensity of des-alanine-fpa in the supernatants after 80% acetonitrile precipitation and 90% methanol precipitation. The results indicated that 90% methanol precipitation yielded higher intensity of des-alanine-fpa and its fragments in the MS spectrum, suggesting a better recovery of this biomarker. The MS and MS/MS spectra were examined from the whole gradient program to find out when des-alanine-fpa was mainly eluted. This potential biomarker was separated from other hydrophobic components, which were mainly eluted out at the end of elution program with high percentage of organic phase. However, the full scan chromatogram indicated that the intensity of des-alanine-fpa was much lower than these components. These hydrophobic components may overload the reverse phase column and decrease the efficiency of chromatographic separation after a few continuous injections. To prevent the reduction of column robustness, we added a liquid-liquid extraction procedure to remove hydrophobic components after organic solvent precipitation. The supernatants after 90% methanol precipitation were subjected to a liquid-liquid extraction method using chloroform as the extracting solvent. By comparing the chromatograms with and without chloroform extraction, the MS total ion chromatograms of ovarian cancer serum sample showed much lower intensity of hydrophobic 137
153 components, but without much effect on des-alanine-fpa level (Fig. 4.5). In addition, we did not observe any decrease in the resolution and intensity of the differentiated chromatographic peaks in five continuous injections. It proved that the liquid-liquid extraction method was effective to reduce the complexity of serum by removing partial hydrophobic components. 138
154 Fig. 4.5, Improvement of chromatograms by adding a chloroform-water extraction procedure into the sample preparation. Blue line indicate sample without chloroform-water extraction and black line indicate sample with chloroform-water extraction. 139
155 LC-MS/MS analysis of different sample sets Given the finding of des-alanine-fpa as a potential biomarker by LC-MS/MS analysis, we further evaluated this biomarker in each serum sample of the patients with carcinoma, patients with benign conditions, and healthy control. The tandem MS information for each sample was processed and used for the searching of the des-alanine-fpa fingerprints. The criteria to confirm whether des-alanine-fpa exists in different samples include the MS/MS database search and the elution time at 42 min. Des-alanine-FPA peak was predominantly found in both the benign and carcinoma groups. Analysis of 20 benign samples yielded detectable des-alanine-fpa peak in 16 samples with the percentage of 80%. Among the 40 carcinoma samples subjected to analysis, 37 samples were observed with des-alanine-fpa peak, indicating the sensitivity of this biomarker as 93%. With regarding to the control group, we observed that three samples (N=20) showed desalanine-fpa signal and all other samples had negative results, suggesting a good specificity result of 85%. Considering half of the malignant tumors are transformed from the pre-existing benign cysts, the up-regulated des-alanine-fpa appearing in a high percentage of benign set is not surprising. However, when comparing the peak area or signal intensity of desalanine-fpa peak in the benign and carcinoma sets, we did not observe any significant difference on its expression levels to discriminate these two sets. This is possible if des- 140
156 alanine-fpa is not only involved in the slow growth of pre-malignant lesions before carcinogenesis, but also is associated with the fast transformation of normal ovary to carcinoma Discussion In this study, we demonstrated a LC-MS/MS method for the low molecular serum protein profiling in the biomarker discovery of ovarian cancer. One of the obstacles for protein biomarker discovery in serum is the dynamic range of protein components. To overcome this problem, extensive pre-fractionation steps were usually needed to increase the likelihood of low abundance biomarker detection. It has been reported that organic solvent precipitation was used to extract low molecular weight protein in human serum samples [12]. Compared to other methods, organic solvent precipitation method is simple, convenient, and processes high recovery for low abundance peptides. The sample pretreatment method utilized in this work was modified based on previous reports. It improved reproducibility and sensitivity by reducing the hydrophobic residues in the serum sample solution after the depletion of high abundance proteins. The developed LC-MS/MS method showed that the chromatogram of serum low molecular weight peptides differentiates from ovarian cancer patients to healthy control in a major marker peak. Further, this peak was characterized as des-alanine FPA, which is derived from fibrinopeptide by losing an amino acid of alanine. 141
157 Fibrinopeptide A (FPA) is generated from fibrinogen by thrombin during blood coagulation. Thrombosis and disseminated intravascular coagulation are common complications of cancer, and such a procoagulant state in cancer arises mainly from the capacity of tumor cells to express and release procoagulant factors. It has been reported that FPA related peptides were up-regulated in different type of cancers including ovarian cancer [13-16]. In addition, there was finding of elevated phosphor-fpa as posttranscription modification in serum of advance staged ovarian cancer samples [13]. These findings revealed a high degree of biological relevance between cancer and fibrinogen fragments. However, the mechanism of high level des-alanine-fpa and its correlation with ovarian cancer has not been reported yet. It is essential to carry out a careful followup validation using rational and rigorous methodology for ovarian cancer biomarker discovery. In the validation of des-alanine-fpa level in the sample with different sets of ovarian cancer diseases, we found that both benign and carcinoma sets had up-regulated desalanine-fpa expression compared to normal control. The challenge of differentiating benign tumors with malignant carcinoma for ovarian cancer screening remained in this work. We have not found any relation between the level of this biomarker to define different disease states such as benign and carcinoma. Serum was used as the sampling source in this study because it contains the circulating proteins and peptides shed from cancerous cells and tissues into blood. Compared to plasma, it is less complex due to the coagulation process and the removal of clotting 142
158 factors during specimen collection. Serum is generally used as an acceptable starting material for many diagnostic assays and proteomics investigations. However, the serum sampling process usually requires the coagulation process of whole blood for min, which initiates a cascade of enzymes reactions such as the formation of solid fibrin by serine proteases. During this clotting process, FPA is removed from the n-terminal segment of the alpha chains of fibrinogen by the thrombin. We were concerned that the FPA level and especially des-alanine-fpa level could be affected by clotting process of serum sampling. Variability introduced through sample collecting and storage can be misinterpreted as des-alanine-fpa level changes resulting from ovarian tumorigenesis. Consequently, further study should be carried out in examining whether the specimen sampling and storage as well as our current sample preparation method affect the desalanine-fpa level. More importantly, the verification of the des-alanine-fpa level in the plasma is essential to move this work forward. Compared to serum, the sample source of plasma avoids the specimen-to-specimen variation of clotting extent and duration and could better represent real blood proteomes. 143
159 4.5. Reference [1] Parkin DM, Bray F, Ferlay J, Pisani P. Global cancer statistics, CA Cancer J Clin 2005;55: [2] Moss C, Kaye SB. Ovarian cancer: progress and continuing controversies in management. Eur J Cancer 2002;38: [3] Jacobs IJ, Menon U. Progress and challenges in screening for early detection of ovarian cancer. Mol Cell Proteomics 2004;3: [4] Scully RE. Tumors of the ovary and maldeveloped gonads. Atlas of tumor pathology, facs 16, ser 2, Washington, DC: Armed Forces Institute of Pathology, 1979; [5] Husseinzadeh N. Status of tumor markers in epithelial ovarian cancer has there been any progress? A review. Gynecol Oncol 2011;120: [6] Kerbrat P, Lhomme C, Fervers B, Guastalla JP, Thomas L, Tournemaine N, et al. Ovarian cancer. Br J Cancer 2001;84 Suppl 2: [7] Norum LF, Erikstein B, Nustad K. Elevated CA125 in breast cancer--a sign of advanced disease. Tumour Biol 2001;22: [8] Sjovall K, Nilsson B, Einhorn N. The significance of serum CA 125 elevation in malignant and nonmalignant diseases. Gynecol Oncol 2002;85: [9] Chen CH. Review of a current role of mass spectrometry for proteome research. Anal Chim Acta 2008;624: [10] DeVoe DL, Lee CS. Microfluidic technologies for MALDI-MS in proteomics. Electrophoresis 2006;27:
160 [11] Liu Y. Technologies for proteomic and genomic biomarker analysis [12] Stasyk T, Huber LA. Zooming in: fractionation strategies in proteomics. Proteomics 2004;4: [13] Ogata Y, Heppelmann CJ, Charlesworth MC, Madden BJ, Miller MN, Kalli KR, et al. Elevated levels of phosphorylated fibrinogen-alpha-isoforms and differential expression of other post-translationally modified proteins in the plasma of ovarian cancer patients. J Proteome Res 2006;5: [14] Ebert MP, Niemeyer D, Deininger SO, Wex T, Knippig C, Hoffmann J, et al. Identification and confirmation of increased fibrinopeptide a serum protein levels in gastric cancer sera by magnet bead assisted MALDI-TOF mass spectrometry. J Proteome Res 2006;5: [15] Villanueva J, Martorella AJ, Lawlor K, Philip J, Fleisher M, Robbins RJ, et al. Serum peptidome patterns that distinguish metastatic thyroid carcinoma from cancer-free controls are unbiased by gender and age. Mol Cell Proteomics 2006;5: [16] Orvisky E, Drake SK, Martin BM, Abdel-Hamid M, Ressom HW, Varghese RS, et al. Enrichment of low molecular weight fraction of serum for MS analysis of peptides associated with hepatocellular carcinoma. Proteomics 2006;6:
161 CHAPTER V COMPREHENSIVE ANALYSIS OF TUMOR-ASSOCIATED DNA METHYLATION IN HEPATOCELLULAR CARCINOMA 5.1. Introduction Hepatocellular carcinoma (HCC) is the one of the most aggressive malignancies with the third mortality among cancer worldwide [1]. Highly prevalent in Asia and Africa, HCC is recently reported to be on the rise in many developed countries including United States, Japan, and Western Europe [2]. The clinical management of HCC, depending on its stage, includes curative approaches such as resection, orthotopic liver transplantation, local ablation, radioembolization, and sorafenib treatment [3]. Despite significant advances in HCC management, the survival rate of HCC is low due to its poor diagnosis and prognosis, high recurrence, and resistance to chemotherapy and radiotherapy [4]. 146
162 The major etiological risk factors of HCC for cancer development have been well understood. These factors include hepatitis virus infection, chronic alcohol consumption, liver cirrhosis, and aflatoxin intake [5,6]. However, the majority of HCC were detected in non-resectable advanced stages, which prevents potential curative treatments. The early diagnosis of HCC presents a lot of challenges since the imaging techniques such as CT and MRI scan are not adequate to distinguish HCC with long-term liver cirrhosis [7]. The most commonly used tumor biomarker α-fetoprotein (AFP) is helpful in the surveillance tests, but its use is also controversial because of lacking diagnostic accuracy and sensitivity [8]. Other serum biomarkers such as lectin-bound AFP, or descarboxy-prothrombin (DCP) have large limitations because they are not consistent or particularly precise for the early diagnosis of HCC [9]. Therefore, it is urgent to develop novel biomarkers for the early detection of malignancy of hepatocytes for better screening tests. The carcinogenesis for HCC development involves complicated genetic and epigenetic changes. Genomic alterations such as gene mutations, chromosomal amplifications and deletions, and unstable genomics were closely associated with HCC [10,11]. In addition, epigenetic alterations, including DNA methylation, histone modification, and altered expression of chromatin-modifying enzymes were also frequently observed in malignant transformation of hepatocytes as an alternative pathway [12]. Aberrant gene methylation has been well documented as the best-known epigenetic event in different cancers including HCC [13,14]. When DNA methylation occurs in CpG dinucleotides, a methyl 147
163 group from S-adenosyl methionine (SAM-CH 3 ) is added at the carbon five position of the cytosine ring through covalent bond (Fig. 5.1). This reaction is catalyzed by DNA methyltransferases 1, 3a, or 3b (DNMT). 148

164 Figure 5.1, Cytosine methylation catalyzed by DNMT 149
Vitamin D Metabolite Analysis in Biological Samples Using Agilent Captiva EMR Lipid
 Vitamin D Metabolite Analysis in Biological Samples Using Agilent Captiva EMR Lipid Application Note Clinical Research Authors Derick Lucas and Limian Zhao Agilent Technologies, Inc. Abstract Lipids from
Comprehensive Study of SLE as a Sample. Preparation Tool for Bioanalysis
 Comprehensive Study of SLE as a Sample Preparation Tool for Bioanalysis Wan Wang, Warren Chen, Jerry Wang Bonna-Agela Technologies 179 Southern Street, West TEDA, Tianjin, China Abstract A simple, fast,
O O H. Robert S. Plumb and Paul D. Rainville Waters Corporation, Milford, MA, U.S. INTRODUCTION EXPERIMENTAL. LC /MS conditions
 Simplifying Qual/Quan Analysis in Discovery DMPK using UPLC and Xevo TQ MS Robert S. Plumb and Paul D. Rainville Waters Corporation, Milford, MA, U.S. INTRODUCTION The determination of the drug metabolism
Metabolomics: quantifying the phenotype
 Metabolomics: quantifying the phenotype Metabolomics Promises Quantitative Phenotyping What can happen GENOME What appears to be happening Bioinformatics TRANSCRIPTOME What makes it happen PROTEOME Systems
Ultra Performance Liquid Chromatography Coupled to Orthogonal Quadrupole TOF MS(MS) for Metabolite Identification
 for Metabolite Identification") 22 SEPARATION SCIENCE REDEFINED MAY 2005 Ultra Performance Liquid Chromatography Coupled to Orthogonal Quadrupole TOF MS(MS) for Metabolite Identification In the drug discovery process the detection and
22 SEPARATION SCIENCE REDEFINED MAY 2005 Ultra Performance Liquid Chromatography Coupled to Orthogonal Quadrupole TOF MS(MS) for Metabolite Identification In the drug discovery process the detection and
MALDI-TOF. Introduction. Schematic and Theory of MALDI
 MALDI-TOF Proteins and peptides have been characterized by high pressure liquid chromatography (HPLC) or SDS PAGE by generating peptide maps. These peptide maps have been used as fingerprints of protein
The Comparison of High Resolution MS with Triple Quadrupole MS for the Analysis of Oligonucleotides
 The Comparison of High Resolution MS with Triple Quadrupole MS for the Analysis of Oligonucleotides Mohammed Abrar Unilabs York Bioanalytical Solutions Outline Introduction Why LC-MS/MS? Limitations of
Performance of an ultra low elution volume 96-well plate
 Performance of an ultra low elution volume 96-well plate Claude R. Mallet, Ziling Lu, Jeff R. Mazzeo, Uwe D. Neue Waters Corporation PittCon 2003 March 10-14 2003 Orlando, Florida Today s Challenges Faced
Using Hydrophilic Interaction Chromatography (HILIC) for the Retention of Highly Polar Analytes
 for the Retention of Highly Polar Analytes") Using Hydrophilic Interaction Chromatography (HILIC) for the Retention of Highly Polar Analytes Eric S. Grumbach,, Diane M. Diehl and Jeffrey R. Mazzeo 2003 Waters Corp. Outline Introduction HILIC Definition
Using Hydrophilic Interaction Chromatography (HILIC) for the Retention of Highly Polar Analytes Eric S. Grumbach,, Diane M. Diehl and Jeffrey R. Mazzeo 2003 Waters Corp. Outline Introduction HILIC Definition
Measuring Lipid Composition LC-MS/MS
 Project: Measuring Lipid Composition LC-MS/MS Verification of expected lipid composition in nanomedical controlled release systems by liquid chromatography tandem mass spectrometry AUTHORED BY: DATE: Sven
A Novel Solution for Vitamin K₁ and K₂ Analysis in Human Plasma by LC-MS/MS
 A Novel Solution for Vitamin K₁ and K₂ Analysis in Human Plasma by LC-MS/MS By Shun-Hsin Liang and Frances Carroll Abstract Vitamin K₁ and K₂ analysis is typically complex and time-consuming because these
Application Note # LCMS-89 High quantification efficiency in plasma targeted proteomics with a full-capability discovery Q-TOF platform
 Application Note # LCMS-89 High quantification efficiency in plasma targeted proteomics with a full-capability discovery Q-TOF platform Abstract Targeted proteomics for biomarker verification/validation
LC-MS/MS analysis of Chlorates in Milk and Whey Powder using the Agilent 6470 QQQ
 LC-MS/MS analysis of Chlorates in Milk and Whey Powder using the Agilent 6470 QQQ Anthony Sullivan, LC/MS Product Specialist Melanie Mülek and Christoph Müller LC-MS Applications Specialists Hewlett-Packard-Str.
A Definitive Lipidomics Workflow for Human Plasma Utilizing Off-line Enrichment and Class Specific Separation of Phospholipids
 A Definitive Lipidomics Workflow for Human Plasma Utilizing Off-line Enrichment and Class Specific Separation of Phospholipids Jeremy Netto, 1 Stephen Wong, 1 Federico Torta, 2 Pradeep Narayanaswamy, 2
Neosolaniol. [Methods listed in the Feed Analysis Standards]
![Neosolaniol. [Methods listed in the Feed Analysis Standards]](/thumbs/86/94003482.jpg "Neosolaniol. [Methods listed in the Feed Analysis Standards]") Neosolaniol [Methods listed in the Feed Analysis Standards] 1 Simultaneous analysis of mycotoxins by liquid chromatography/ tandem mass spectrometry [Feed Analysis Standards, Chapter 5, Section 1 9.1 ]
Neosolaniol [Methods listed in the Feed Analysis Standards] 1 Simultaneous analysis of mycotoxins by liquid chromatography/ tandem mass spectrometry [Feed Analysis Standards, Chapter 5, Section 1 9.1 ]
Overview of Matrix Effects in Bioanalysis
 Overview of Matrix Effects in Bioanalysis Patrick Bennett & Jing Tu PPD Laboratories 31March2017 Outline 1. Definitions 2. Overview of Matrix Effects 3. Regulatory guidance on matrix effect(s): FDA and
PTM Discovery Method for Automated Identification and Sequencing of Phosphopeptides Using the Q TRAP LC/MS/MS System
 Application Note LC/MS PTM Discovery Method for Automated Identification and Sequencing of Phosphopeptides Using the Q TRAP LC/MS/MS System Purpose This application note describes an automated workflow
Sample Concentration and Analysis of Human Hormones in Drinking Water
 Sample Concentration and Analysis of Human Hormones in Drinking Water Carl Fisher Applications Chemist Ion Chromatography/Sample Preparation Thermo Fisher Scientific March 1, 215 1 The world leader in
Introduction to LC/MS/MS
 Trends in 2006 Introduction to LC/MS/MS By Crystal Holt, LC/MS Product Specialist, Varian Inc. Toxicology laboratories Increased use of LC/MS Excellent LD Cheaper (still expensive) Much more robust Solves
Dr. Erin E. Chambers Waters Corporation. Presented by Dr. Diego Rodriguez Cabaleiro Waters Europe Waters Corporation 1
 Development of an SPE-LC/MS/MS Assay for the Simultaneous Quantification of Amyloid Beta Peptides in Cerebrospinal Fluid in Support of Alzheimer s Research Dr. Erin E. Chambers Waters Corporation Presented
Removal of Triton X-100 from Plasma Samples Using Mixed-Mode Solid Phase Extraction (SPE)
") Removal of Triton X- from Plasma Samples Using Mixed-Mode Solid Phase Extraction (SPE) Jonathan P. Danaceau, Erin Chambers, and Kenneth J. Fountain Waters Corporation, 34 Maple Street, Milford, MA USA
Removal of Triton X- from Plasma Samples Using Mixed-Mode Solid Phase Extraction (SPE) Jonathan P. Danaceau, Erin Chambers, and Kenneth J. Fountain Waters Corporation, 34 Maple Street, Milford, MA USA
LC-MS/MS Method for the Determination of Tenofovir from Plasma
 LC-MS/MS Method for the Determination of Tenofovir from Plasma Kimberly Phipps, Thermo Fisher Scientific, Runcorn, Cheshire, UK Application Note 687 Key Words SPE, SOLA CX, Hypersil GOLD, tenofovir Abstract
Reducing Sample Volume and Increasing Sensitivity for the Quantification of Human Insulin and 5 Analogs in Human Plasma Using ionkey/ms
 Reducing Sample Volume and Increasing Sensitivity for the Quantification of Human Insulin and 5 Analogs in Human Plasma Using ionkey/ms Erin E. Chambers and Kenneth J. Fountain Waters Corporation, Milford,
Determination of 6-Chloropicolinic Acid (6-CPA) in Crops by Liquid Chromatography with Tandem Mass Spectrometry Detection. EPL-BAS Method No.
 in Crops by Liquid Chromatography with Tandem Mass Spectrometry Detection. EPL-BAS Method No.") Page 1 of 10 Determination of 6-Chloropicolinic Acid (6-CPA) in Crops by Liquid Chromatography with Tandem Mass Spectrometry Detection EPL-BAS Method No. 205G881B Method Summary: Residues of 6-CPA are
Page 1 of 10 Determination of 6-Chloropicolinic Acid (6-CPA) in Crops by Liquid Chromatography with Tandem Mass Spectrometry Detection EPL-BAS Method No. 205G881B Method Summary: Residues of 6-CPA are
Sample Preparation Techniques for Biological Matrices: Finding the right balance to achieve optimal results
 Sample Preparation Techniques for Biological Matrices: Finding the right balance to achieve optimal results Presenter: Diana Wang Applications Engineer SPP-Support@agilent.com 1 Today s Agenda - Why sample
Rapid, Simple Impurity Characterization with the Xevo TQ Mass Spectrometer
 Robert Plumb, Michael D. Jones, and Marian Twohig Waters Corporation, Milford, MA, USA INTRODUCTION The detection and characterization of impurities and degradation products of an active pharmaceutical
Development of a Bioanalytical Method for Quantification of Amyloid Beta Peptides in Cerebrospinal Fluid
 Development of a Bioanalytical Method for Quantification of Amyloid Beta Peptides in Cerebrospinal Fluid Joanne ( 乔安妮 ) Mather Senior Scientist Waters Corporation Data courtesy of Erin Chambers and Mary
Robust extraction, separation, and quantitation of structural isomer steroids from human plasma by SPE-UHPLC-MS/MS
 TECHNICAL NOTE 21882 Robust extraction, separation, and quantitation of structural isomer steroids human plasma by SPE-UHPLC-MS/MS Authors Jon Bardsley 1, Kean Woodmansey 1, and Stacy Tremintin 2 1 Thermo
Surviving Matrix Effects Experiments. Grace van der Gugten St. Paul s Hospital, Vancouver, BC, Canada
 Surviving Matrix Effects Experiments Grace van der Gugten St. Paul s Hospital, Vancouver, BC, Canada gvandergugten@providencehealth.bc.ca Outline What are matrix effects Post Column Infusion Phospholipid
Fig. 1: Chemical structure of arachidonic acid COOH CH 3
 Elimination of Matrix Effects Using Mixed-mode SPE Plate for High Throughput Analysis of Free Arachidonic Acid in Plasma by LC-MS/MS Wan Wang, Suzi Qin, Linsen Li, Warren Chen, Jerry Wang 179, Southern
An Alternative Approach: Top-Down Bioanalysis of Intact Large Molecules Can this be part of the future? Lecture 8, Page 27
 An Alternative Approach: Top-Down Bioanalysis of Intact Large Molecules Can this be part of the future? Lecture 8, Page 27 Top-down HRAM Bioanalysis of Native Proteins/Molecules Relative Abundance 100
Analysis of Testosterone, Androstenedione, and Dehydroepiandrosterone Sulfate in Serum for Clinical Research
 Analysis of Testosterone, Androstenedione, and Dehydroepiandrosterone Sulfate in Serum for Clinical Research Dominic Foley, Michelle Wills, and Lisa Calton Waters Corporation, Wilmslow, UK APPLICATION
Efficient Quantitative Analysis of THC and Metabolites in Human Plasma Using Agilent Captiva EMR Lipid and LC-MS/MS
 Application Note Forensic Analysis Efficient Quantitative Analysis of THC and Metabolites in Human Plasma Using Agilent Captiva EMR Lipid and LC-MS/MS Authors Joan Stevens and Limian Zhao Agilent Technologies,
Methods in Mass Spectrometry. Dr. Noam Tal Laboratory of Mass Spectrometry School of Chemistry, Tel Aviv University
 Methods in Mass Spectrometry Dr. Noam Tal Laboratory of Mass Spectrometry School of Chemistry, Tel Aviv University Sample Engineering Chemistry Biology Life Science Medicine Industry IDF / Police Sample
John Haselden 1, Gordon Dear 1, Jennifer H. Granger 2, and Robert S. Plumb 2. 1GlaxoSmithKline, Ware, UK; 2 Waters Corporation, Milford, MA, USA
 Challenges of Polar Compound Analysis Routine LC/MS-based analyses usually rely on using reversed-phase column chemistries (e.g. C 18, C 8, C 4 ) in their LC methodology. However, one of the shortcomings
The Raptor HILIC-Si Column
 The Raptor HILIC-Si Column With Raptor LC columns, Restek chemists became the first to combine the speed of superficially porous particles (also known as SPP or core-shell particles) with the resolution
Matrix Factor Determination with the Waters Regulated Bioanalysis System Solution
 Matrix Factor Determination with the Waters Regulated Bioanalysis System Solution Joanne Mather, Steve Cubbedge, Debadeep Bhattacharya, and Robert S. Plumb Waters Corporation, Milford, MA, U.S. A P P L
Edgar Naegele. Abstract
 Simultaneous determination of metabolic stability and identification of buspirone metabolites using multiple column fast LC/TOF mass spectrometry Application ote Edgar aegele Abstract A recent trend in
Application Note. Abstract. Authors. Pharmaceutical
 Analysis of xycodone and Its Metabolites-oroxycodone, xymorphone, and oroxymorphone in Plasma by LC/MS with an Agilent ZRBAX StableBond SB-C18 LC Column Application ote Pharmaceutical Authors Linda L.
Analysis of Rosuvastatin in Dried Blood Spot and Plasma Using ACQUITY UPLC with 2D Technology
 Analysis of Rosuvastatin in Dried Blood Spot and Plasma Using ACQUITY UPLC with 2D Technology Claude Mallet, 1 Jennifer Simeone, 2 Paul Rainville 3 1 Workflow Integration Group, Separations Technologies,
Simultaneous Analysis of Intact Human Insulin and Five Analogs in Human Plasma Using μelution SPE and a CORTECS UPLC Column
 Simultaneous Analysis of Intact Human Insulin and Five Analogs in Human Plasma Using μelution SPE and a CORTECS UPLC Column Erin E. Chambers and Kenneth J. Fountain Waters Corporation, Milford, MA, USA
Introduction to Proteomics 1.0
 Introduction to Proteomics 1.0 CMSP Workshop Pratik Jagtap Managing Director, CMSP Objectives Why are we here? For participants: Learn basics of MS-based proteomics Learn what s necessary for success using
A Robustness Study for the Agilent 6470 LC-MS/MS Mass Spectrometer
 A Robustness Study for the Agilent 7 LC-MS/MS Mass Spectrometer Application Note Clinical Research Authors Linda Côté, Siji Joseph, Sreelakshmy Menon, and Kevin McCann Agilent Technologies, Inc. Abstract
SeQuant ZIC -HILIC For all who expect more...
 SeQuant ZIC -ILIC For all who expect more... The better choice for PLC and LC/MS of all types of polar and hydrophilic compounds EMD Millipore Corp. is a subsidiary of Merck KGaA, Darmstadt, Germany Poor
Determination of Amantadine Residues in Chicken by LCMS-8040
 Liquid Chromatography Mass Spectrometry Determination of Amantadine Residues in Chicken by LCMS-8040 A method for the determination of amantadine in chicken was established using Shimadzu Triple Quadrupole
Automated Sample Preparation/Concentration of Biological Samples Prior to Analysis via MALDI-TOF Mass Spectroscopy Application Note 222
 Automated Sample Preparation/Concentration of Biological Samples Prior to Analysis via MALDI-TOF Mass Spectroscopy Application Note 222 Joan Stevens, Ph.D.; Luke Roenneburg; Tim Hegeman; Kevin Fawcett
Simple Method (IS-MRM) to Monitor Lysophospholipids and Phospholipids During LC-MS Method Development via In-Source CID
 to Monitor Lysophospholipids and Phospholipids During LC-MS Method Development via In-Source CID") Simple Method (IS-MRM) to Monitor Lysophospholipids and Phospholipids During LC-MS Method Development via In-Source CID James Little, Eastman Chemical Company, Kingsport, TN Overview Phospholipids and
Simple Method (IS-MRM) to Monitor Lysophospholipids and Phospholipids During LC-MS Method Development via In-Source CID James Little, Eastman Chemical Company, Kingsport, TN Overview Phospholipids and
Choosing the metabolomics platform
 Choosing the metabolomics platform Stephen Barnes, PhD Department of Pharmacology & Toxicology University of Alabama at Birmingham sbarnes@uab.edu Challenges Unlike DNA, RNA and proteins, the metabolome
1. Sample Introduction to MS Systems:
 MS Overview: 9.10.08 1. Sample Introduction to MS Systems:...2 1.1. Chromatography Interfaces:...3 1.2. Electron impact: Used mainly in Protein MS hard ionization source...4 1.3. Electrospray Ioniztion:
Terminology. Metabolite: substance produced or used during metabolism such as lipids, sugars and amino acids
 Terminology Metabolite: substance produced or used during metabolism such as lipids, sugars and amino acids A metabolite may be described as a compound which is internalized, chemically converted or secreted
A High Sensitivity UPLC/MS/MS Method for the Analysis of Clopidogrel and Clopidogrel Carboxylic Acid Metabolite in Human K 2 EDTA Plasma
 A High Sensitivity UPLC/MS/MS Method for the Analysis of Clopidogrel and Clopidogrel Carboxylic Acid Metabolite in Human K 2 EDTA Plasma Jennifer L. Simeone, Paul D. Rainville, Robert S. Plumb Waters Corporation,
Determination of N-Nitrososarcosine (NSAR) in tobacco
 in tobacco") JTI-Ökolab Vienna, Austria Determination of N-Nitrososarcosine (NSAR) in tobacco Madeleine Werneth, Jutta Pani, Bernhard Mayer-Helm 2014 CORESTA CONGRESS - ST46 Québec City, Canada 12-16 October 2014 Background
JTI-Ökolab Vienna, Austria Determination of N-Nitrososarcosine (NSAR) in tobacco Madeleine Werneth, Jutta Pani, Bernhard Mayer-Helm 2014 CORESTA CONGRESS - ST46 Québec City, Canada 12-16 October 2014 Background
SeQuant ZIC -HILIC For all who expect more...
 SeQuant ZIC -ILIC For all who expect more... The better choice for PLC and LC/MS of all types of polar and hydrophilic compounds EMD Millipore is a division of Merck KGaA, Darmstadt, Germany Poor retention
Glycerolipid Analysis. LC/MS/MS Analytical Services
 Glycerolipid Analysis LC/MS/MS Analytical Services Molecular Characterization and Quantitation of Glycerophospholipids in Commercial Lecithins by High Performance Liquid Chromatography with Mass Spectrometric
Agilent 6490 Triple Quadrupole LC/MS System with ifunnel Technology. Ultra sensitive quantitative performance
 Agilent 6490 Triple Quadrupole LC/MS System with ifunnel Technology Ultra sensitive quantitative performance Unmatched quantitative performance for the most challenging analyses The Agilent 6490 Triple
What You Can t See Can Hurt You. How MS/MS Specificity Can Bite Your Backside
 What You Can t See Can Hurt You How MS/MS Specificity Can Bite Your Backside Johan van den Heever, Tom Thompson, and Don Noot Agri-Food Laboratories Branch Advances in Trace rganic Residue Analysis early
LOCALISATION, IDENTIFICATION AND SEPARATION OF MOLECULES. Gilles Frache Materials Characterization Day October 14 th 2016
 LOCALISATION, IDENTIFICATION AND SEPARATION OF MOLECULES Gilles Frache Materials Characterization Day October 14 th 2016 1 MOLECULAR ANALYSES Which focus? LOCALIZATION of molecules by Mass Spectrometry
Analysis of Alcohol and Alkylphenol Polyethers via Packed Column Supercritical Fluid Chromatography. Brian Jeffrey Hoffman
 Analysis of Alcohol and Alkylphenol Polyethers via Packed Column Supercritical Fluid Chromatography by Brian Jeffrey Hoffman Dissertation submitted to the Graduate Faculty of Virginia Polytechnic Institute
LC/MS Analysis of Various Hydrophilic Compounds Using a Polymer-Based Amino Column - Shodex TM HILICpak TM VG-50 2D
 LC/MS Analysis of Various Hydrophilic Compounds Using a Polymer-Based Amino Column - Shodex TM HILICpak TM VG-50 2D Introduction Components of pharmaceutical products and food products often include high
4th Multidimensional Chromatography Workshop Toronto (January, 2013) Herman C. Lam, Ph.D. Calibration & Validation Group
 Herman C. Lam, Ph.D. Calibration & Validation Group") 4th Multidimensional Chromatography Workshop Toronto (January, 2013) Herman C. Lam, Ph.D. Calibration & Validation Group MDLC for Shotgun Proteomics Introduction General concepts Advantages Challenges
4th Multidimensional Chromatography Workshop Toronto (January, 2013) Herman C. Lam, Ph.D. Calibration & Validation Group MDLC for Shotgun Proteomics Introduction General concepts Advantages Challenges
Shuguang Li, Jason Anspach, Sky Countryman, and Erica Pike Phenomenex, Inc., 411 Madrid Ave., Torrance, CA USA PO _W
 Simple, Fast and Accurate Quantitation of Human Plasma Vitamins and Their Metabolites by Protein Precipitation Combined with Columns Using HPLC-UV, HPLC-FLD or LC/MS/MS Shuguang Li, Jason Anspach, Sky
MASS SPECTROMETRY BASED METABOLOMICS. Pavel Aronov. ABRF2010 Metabolomics Research Group March 21, 2010
 MASS SPECTROMETRY BASED METABOLOMICS Pavel Aronov ABRF2010 Metabolomics Research Group March 21, 2010 Types of Experiments in Metabolomics targeted non targeted Number of analyzed metabolites is limited
CONTENT. i iv ix. SVKM s NMIMS, School of Pharmacy and Technology Management
 CONTENT Chapter No. Title Page No. Abbreviations List of Figures List of Tables 1 Introduction 1 1.1 Practical aspects 4 1.2 Stability-indicating assay method (SIAM) 5 1.3 Regulatory aspects 6 1.4 Techniques
Rapid and Accurate LC-MS/MS Analysis of Nicotine and Related Compounds in Urine Using Raptor Biphenyl LC Columns and MS-Friendly Mobile Phases
 Clinical, Forensic & Toxicology Applications Rapid and Accurate LC-MS/MS Analysis of Nicotine and Related Compounds in Urine Using Raptor Biphenyl LC Columns and MS-Friendly Mobile Phases By Shun-Hsin
Development of a High Sensitivity SPE-LC-MS/MS Assay for the Quantification of Glucagon in Human Plasma Using the ionkey/ms System
 Development of a High Sensitivity SPE-LC-MS/MS Assay for the Quantification of Glucagon in Human Plasma Using the ionkey/ms System Mary E. Lame, Erin E. Chambers, Sukhdev S. Bangar, and Kenneth J. Fountain
Summary Chapter 8 CHAPTER 8. Summary. Page 173
 CHAPTER 8 Summary Page 173 Chapter 2: Liquid Chromatography/Tandem Mass Spectrometry Method for Quantitative Estimation of PEG 400 and its Applications A rapid sensitive and selective MRM based method
AbsoluteIDQ p150 Kit. Targeted Metabolite Identifi cation and Quantifi cation. Bringing our targeted metabolomics expertise to your lab.
 AbsoluteIDQ p150 Kit Targeted Metabolite Identifi cation and Quantifi cation Bringing our targeted metabolomics expertise to your lab. The Biocrates AbsoluteIDQ p150 mass spectrometry Assay Preparation
Relative Quantitation of Human Polymorphonuclear Leukocyte Cell Membrane GPEtn Lipids
 Relative Quantitation of Human Polymorphonuclear Leukocyte Cell Membrane GPEtn Lipids Using the QTRAP System with mtraq Reagents Karin A. Zemski-Berry 1, John M. Hevko 2, and Robert C. Murphy 1 1 Department
Protein Precipitation for Biological Fluid Samples Using Agilent Captiva EMR Lipid 96-Well Plates
 Application Note Clinical Research Protein Precipitation for Biological Fluid Samples Using Agilent Captiva EMR Lipid 96-Well Plates Authors Limian Zhao and Megan Juck Agilent Technologies, Inc. Abstract
UPLC/MS Monitoring of Water-Soluble Vitamin Bs in Cell Culture Media in Minutes
 UPLC/MS Monitoring of Water-Soluble Vitamin Bs in Cell Culture Media in Minutes Catalin E. Doneanu, Weibin Chen, and Jeffrey R. Mazzeo Waters Corporation, Milford, MA, U.S. A P P L I C AT ION B E N E F
Comprehensive Forensic Toxicology Screening in Serum using On-Line SPE LC-MS/MS
 Comprehensive Forensic Toxicology Screening in Serum using On-Line SPE LC-MS/MS SCIEX QTRAP 4500 LC-MS/MS System and Spark Holland PICO Adrian M. Taylor 1, Peter Ringeling 2, Martin Sibum 2, Stefan Sturm
SPE-LC-MS/MS Method for the Determination of Nicotine, Cotinine, and Trans-3-hydroxycotinine in Urine
 SPE-LC-MS/MS Method for the Determination of Nicotine, Cotinine, and Trans-3-hydroxycotinine in Urine J. Jones, Thermo Fisher Scientific, Runcorn, Cheshire, UK Application Note 709 Key Words SPE, SOLA
Fundamentals of Soft Ionization and MS Instrumentation
 Fundamentals of Soft Ionization and MS Instrumentation Ana Varela Coelho varela@itqb.unl.pt Mass Spectrometry Lab Analytical Services Unit Index Mass spectrometers and its components Ionization methods:
A NOVEL METHOD OF M/Z DRIFT CORRECTION FOR OA-TOF MASS SPECTROMETERS BASED ON CONSTRUCTION OF LIBRARIES OF MATRIX COMPONENTS.
 A NOVEL METHOD OF M/Z DRIFT CORRECTION FOR OA-TOF MASS SPECTROMETERS BASED ON CONSTRUCTION OF LIBRARIES OF MATRIX COMPONENTS. Martin R Green*, Keith Richardson, John Chipperfield, Nick Tomczyk, Martin
LC/MS/MS SOLUTIONS FOR LIPIDOMICS. Biomarker and Omics Solutions FOR DISCOVERY AND TARGETED LIPIDOMICS
 LC/MS/MS SOLUTIONS FOR LIPIDOMICS Biomarker and Omics Solutions FOR DISCOVERY AND TARGETED LIPIDOMICS Lipids play a key role in many biological processes, such as the formation of cell membranes and signaling
Fast and simultaneous analysis of ethanol metabolites and barbiturates using the QTRAP 4500 LC-MS/MS system
 Fast and simultaneous analysis of ethanol metabolites and barbiturates using the QTRAP 4500 LC-MS/MS system Xiang He 1, Adrian Taylor 2 and Alexandre Wang 1 1 SCIEX, Redwood City, USA. 2 SCIEX, Concord,
LC/MS/MS Separation of Cholesterol and Related Sterols in Plasma on an Agilent InfinityLab Poroshell 120 EC C18 Column
 Application Note Clinical Research LC/MS/MS Separation of Cholesterol and Related Sterols in Plasma on an Agilent InfinityLab Poroshell EC C8 Column Authors Rongjie Fu and Zhiming Zhang Agilent Technologies
Advancing your Forensic Toxicology Analyses; Adopting the Latest in Mass Spectrometry Innovations
 Advancing your Forensic Toxicology Analyses; Adopting the Latest in Mass Spectrometry Innovations For Research Use Only. Not for use in diagnostic procedures. 1 2015 AB Sciex RUO-MKT-11-1018-A For research
Supporting information
 Supporting information Figure legends Supplementary Table 1. Specific product ions obtained from fragmentation of lithium adducts in the positive ion mode comparing the different positional isomers of
Determination of β2-agonists in Pork Using Agilent SampliQ SCX Solid-Phase Extraction Cartridges and Liquid Chromatography-Tandem Mass Spectrometry
 Determination of β2-agonists in Pork Using Agilent SampliQ SCX Solid-Phase Extraction Cartridges and Liquid Chromatography-Tandem Mass Spectrometry Application Note Food Safety Authors Chenhao Zhai Agilent
Fast quantitative Forensic Analysis of THC and its Metabolites in Biological Samples using Captiva EMR- Lipid and LC/MSMS
 Fast quantitative Forensic Analysis of THC and its Metabolites in Biological Samples using Captiva EMR- Lipid and LC/MSMS Christophe Deckers, M.Sc. Sample prep Application Scientist Types of ``Interferences``
Dienes Derivatization MaxSpec Kit
 Dienes Derivatization MaxSpec Kit Item No. 601510 www.caymanchem.com Customer Service 800.364.9897 Technical Support 888.526.5351 1180 E. Ellsworth Rd Ann Arbor, MI USA TABLE OF CONTENTS GENERAL INFORMATION
Quadrupole and Ion Trap Mass Analysers and an introduction to Resolution
 Quadrupole and Ion Trap Mass Analysers and an introduction to Resolution A simple definition of a Mass Spectrometer A Mass Spectrometer is an analytical instrument that can separate charged molecules according
Small Molecule Science: Experimental designs for achieving ultra trace analysis
 Small Molecule Science: Experimental designs for achieving ultra trace analysis Michael P. Balogh Principal scientist Waters Corporation 211 Waters Corporation 1 www.cosmoscience.org The Society for Small
Quantitative Analysis of Vit D Metabolites in Human Plasma using Exactive System
 Quantitative Analysis of Vit D Metabolites in Human Plasma using Exactive System Marta Kozak Clinical Research Applications Group Thermo Fisher Scientific San Jose CA Clinical Research use only, Not for
Agilent 6410 Triple Quadrupole LC/MS. Sensitivity, Reliability, Value
 Agilent 64 Triple Quadrupole LC/MS Sensitivity, Reliability, Value Sensitivity, Reliability, Value Whether you quantitate drug metabolites, measure herbicide levels in food, or determine contaminant levels
Quantitation by High Resolution Mass Spectrometry: Case Study of TOF MS for the Quantitation of Allopurinol from Human Plasma
 Quantitation by High Resolution Mass Spectrometry: Case Study of TOF MS for the Quantitation of Allopurinol from Human Plasma Shaokun Pang 1, Weixing Sun 2, Adrien Musuku 2, Xavier J. Misonne 1 1 SCIEX,
Rapid Lipid Profiling of Serum by Reverse Phase UPLC-Tandem Quadrupole MS
 Rapid Lipid Profiling of Serum by Reverse Phase UPLC-Tandem Quadrupole MS Mark Ritchie and Evelyn Goh Waters Pacific Pte Ltd., Singapore A P P L I C AT ION B E N E F I T S Delivers a rapid 10-min MRM method
More structural information with MS n
 PRODUCT SPECIFICATIONS The LTQ XL linear ion trap mass spectrometer More structural information with MS n The LTQ XL linear ion trap mass spectrometer delivers more structural information faster and with
2. Ionization Sources 3. Mass Analyzers 4. Tandem Mass Spectrometry
 Dr. Sanjeeva Srivastava 1. Fundamental of Mass Spectrometry Role of MS and basic concepts 2. Ionization Sources 3. Mass Analyzers 4. Tandem Mass Spectrometry 2 1 MS basic concepts Mass spectrometry - technique
Simultaneous Quantitative Analysis of Total Catecholamines and Metanephrines in Urine Using CLEAN UP CCX2 and LC-MS/MS
 Simultaneous Quantitative Analysis of Total Catecholamines and Metanephrines in Urine Using CLEAN UP CCX2 and LC-MS/MS UCT Part Numbers CUCCX256 Clean Up CCX2 (C8 + Carboxylic Acid) 500mg / 6mL SPE Cartridge
Detection of Low Level of Chloramphenicol in Milk and Honey with MIP SPE and LC-MS-MS
 Detection of Low Level of Chloramphenicol in Milk and Honey with MIP SPE and LC-MS-MS Olga Shimelis, An Trinh, and Michael Ye Supelco, Div. of Sigma-Aldrich, Bellefonte, PA T407125 Introduction Molecularly
Analytical Method for 2, 4, 5-T (Targeted to Agricultural, Animal and Fishery Products)
") Analytical Method for 2, 4, 5-T (Targeted to Agricultural, Animal and Fishery Products) The target compound to be determined is 2, 4, 5-T. 1. Instrument Liquid Chromatograph-tandem mass spectrometer (LC-MS/MS)
Analytical Method for 2, 4, 5-T (Targeted to Agricultural, Animal and Fishery Products) The target compound to be determined is 2, 4, 5-T. 1. Instrument Liquid Chromatograph-tandem mass spectrometer (LC-MS/MS)
Quantification of lovastatin in human plasma by LC/ESI/MS/MS using the Agilent 6410 Triple Quadrupole LC/MS system
 Quantification of lovastatin in human plasma by LC/ESI/MS/MS using the Agilent 641 Triple Quadrupole LC/MS system Application Note Clinical Research Author Siji Joseph Agilent Technologies Bangalore, India
Analysis of anti-epileptic drugs in human serum using an Agilent Ultivo LC/TQ
 Application Note Clinical Research Analysis of anti-epileptic drugs in human serum using an Agilent Ultivo LC/TQ Authors Jennifer Hitchcock 1, Lauren Frick 2, Peter Stone 1, and Vaughn Miller 2 1 Agilent
Extraction of a Comprehensive Steroid Panel from Human Serum Using ISOLUTE. SLE+ Prior to LC/MS-MS Analysis
 Application Note AN890 Extraction of a Comprehensive Steroid Panel from Human Serum Using ISOLUTE SLE+ Page Extraction of a Comprehensive Steroid Panel from Human Serum Using ISOLUTE SLE+ Prior to LC/MS-MS
LC-Based Lipidomics Analysis on QTRAP Instruments
 LC-Based Lipidomics Analysis on QTRAP Instruments Junhua Wang and Paul RS Baker SCIEX LC-Based Lipidomics Analysis Topics Covered Lipid extraction techniques Hydrophilic Interaction Chromatography (HILIC)
Comprehensive Two-Dimensional HPLC and Informative Data Processing for Pharmaceuticals and Lipids
 PO-CON1576E Comprehensive Two-Dimensional HPLC and Informative Data Processing for Pharmaceuticals and Lipids HPLC 2015 PSB-MULTI-06 Yoshiyuki WATABE, Tetsuo IIDA, Daisuke NAKAYAMA, Kanya TSUJII, Saki