Profiling and Imaging Mass Spectrometry
|
|
|
- Ashley Little
- 6 years ago
- Views:
Transcription
1 Profiling and Imaging Mass Spectrometry Compilation of Work from the Caprioli Lab James Mobley, Ph.D. Director of Urologic Research Associate Director of Mass Spectrometry University of Alabama at Birmingham
2 Primary Focus of Today s s Lecture? Brief Overview of Biomarker Discovery (BMD) for Clinical Applications, Why do we do it, Why do we use MALDI-ToF? Understanding Advances in MALDI-ToF Driven Profiling of Tissue Sections for BMD, and the bottlenecks in this newly emerging field. How to produce a Mass Image from a Series of Profiles. What to Do with All that Data (Following the Workflow from Pre-prosessing to Statistical Analysis). How to ID those Peaks, are they really Proteins?
3 First off.. Why Do Biomarker Discovery? To find associations between biological components (i.e. SM, FA s, Proteins) and any clinical endpoint quickly, non-invasively, affordably. To non-invasively determine.. Pathologic Changes (i.e. early detection of cancer) Aggressiveness/ Stage of Disease Predicting Rx Response Drug Target Discovery Mechanistic Studies (Systems Biology) The Potential Clinical Impact is Tremendous!!
4 Using Proteins as an Example; How new is BMD? Number of Publications BMD Publications: 51 real, 29 reviews Proteomics BMD-Proteomics Nearly half are reviews! Years Past
5 Bottlenecks in Biomarker Discovery Quick & Reproducible Protein Isolation Biological Samples Increase Acquisition Speed & Sensitivity Spectral Pre-processing & Data Analysis Streamline Protein Characterization Diagnostic Assay
 Electrophoresis 14 1223-1231. Acidic region IPG, ph 3.")

6 Can 2D PAGE Get Us There? Primarily HMW Proteins! O. Golaz etal. (1993) Electrophoresis Acidic region IPG, ph Serum Proteome Anderson, PNAS, 1977 Direct Analysis ~1000 Protein Spots 25yrs later Pieper, Proteome, 2003 Affinity, SCX, Size Exclusion Yielded 74 Fractions - 2D 3700 Proteins Spots 327 Distinct Proteins

7 What About MALDI-ToF for Biomarker Discovery? MALDI-Tof Crude Protein 2D PAGE, ID by MALDI-Tof Primarily LMW Proteins!
8 R e la tiv e P e ak Area ( 10 0 % = 1.6 fm o le ) Sensitivity is Inversely Proportional to Mass (MALDI-ToF Example) c MALDI-Tof Low 1.6 femptomole Attomole 3.9 pg/ μl 1.6 fmole 2D PAGE Relative Peak Area (100 % set equal to 1.6 fmole) Molecular Weight (kda)
9 Taking a Closer Look at our Proposed Target Primary Target: Many growth factors and cytokines are secreted into the plasma. Growth factor were previously referred to substances that promote cell growth. Promote/ Inhibit: mitogenesis, chemotaxis, apoptosis, angiogenesis, differentiation. Cytokines were simply known as proteins that exhibited immuno-modulating effects. A generic name for a diverse group humoral regulators. Chemokines are a family of cytokines previously referred to as the SIS, SIG, SCY, PF4, and Intercrine families kda, chemotactic agents, with high homology (contain C, CC, CXC, or CX3C). Known In Late 90 s, the cytokine family was limited mainly consisted of 22 lymphokines; But Now, Cytokines, including those with no names: 491, Separate Chemokines: 345 Primary Source: Cytokines Online Pathfinder Encyclopaedia
10 Advantages of MALDI-ToF for Profiling Biological Soln s and Tissue Sections Resistant to many impurities, robust! Highly sensitive in low mass range, which is just starting to be chartered. Direct Analysis on Tissue; very little protein is required for analysis. Analysis of crude extracts of biological fluids. Primarily 1+ charged proteins/ peptides (less complex specta). HTP!!
11 Directed Discovery Profiling Slice frozen tissue on cryostat (~12 μm thick) Thaw slice onto MALDI plate, allow to dry Non-Directed Discovery Imaging Droplets Apply matrix Spray coating Laser Acquire mass spectra Laser Protein profiles Protein images m/z

12 Protein Expression Profiling by MALDI-MS Human breast tumor needle biopsy 1 mm % Intensity x α β ~ α + β Mass (m/z)
 Tumor (A) Tumor (B) Tumor (B) Non Tumor (C)")
.")
13 Human Glioma Biopsy 3 mm X 5 C Tumor A B D Non-Tumor Tumor (A) Tumor (A) Tumor (B) Tumor (B) Non Tumor (C) Non Tumor (C) Non Tumor (D) Non Tumor (D) Schwartz et Al. Clin. Cancer Res., 10, (2004). m/z 15000


14 Principle of MALDI MS Imaging Frozen section MS Images Matrix application Raster of section m/z MALDI Mass Spectrum


15 Spray Deposition of Matrix on Tissue Sections Spray nebulizer for TLC plates Matrix solution Tissue section Nitrogen


16 Comparing Matrix Coatings Spotted % Intensity um Laser spot 200 μm Sprayed Mass (m/z) % Intensity Mass (m/z)

 T) 11000 13800 16600 19400 22200 25000 Mass")
17 Glioma Mouse Model - Intracranial Injection of GL261 Cancer Cells Tumor 2 mm , α , β Tumor Non tumor NT) T) x , α , β + Relative intensities NT) T) Mass (m/z)


.")
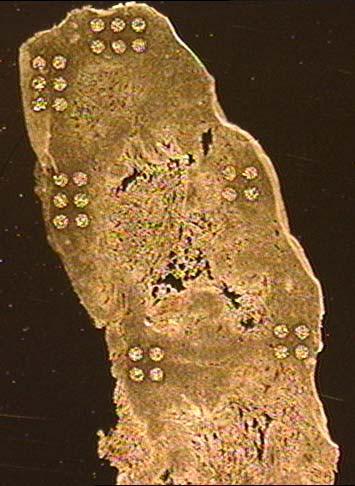
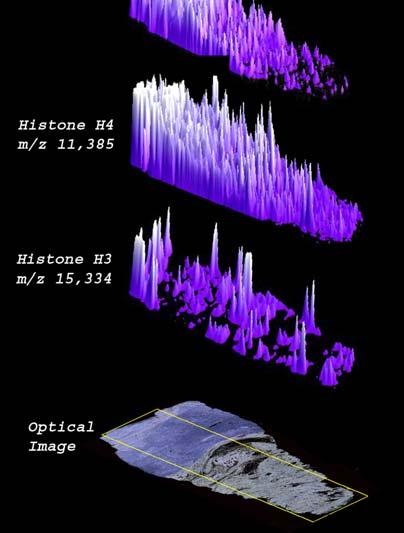
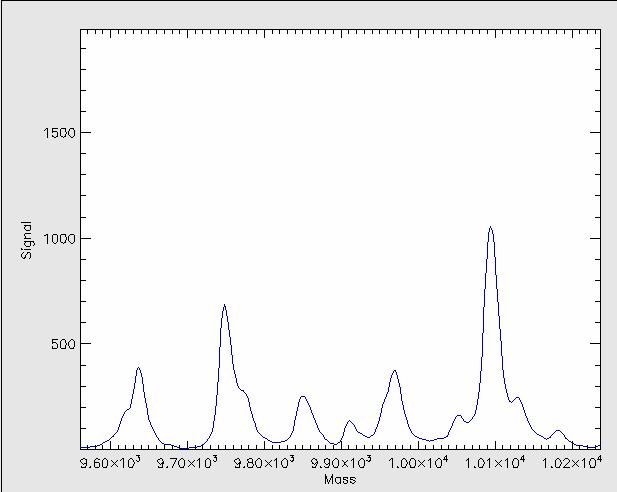
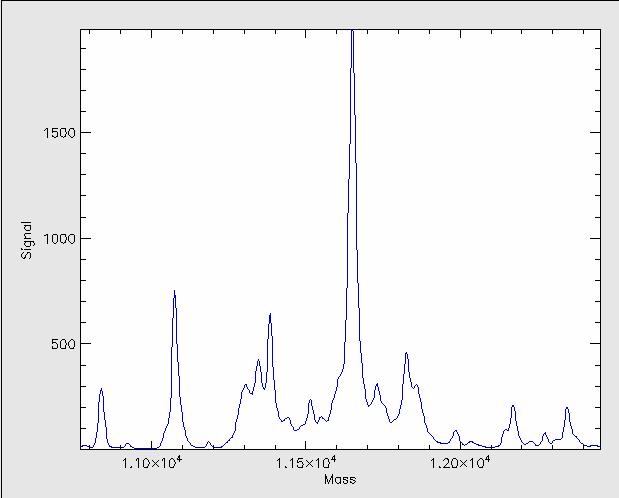
18 Glioma Mouse Model. Imaging Resolution: 100 μm 2 mm m/z 6924 m/z 7539 m/z 9910 Acyl CoAbinding protein m/z and Histone H4 m/z Cytochrome C m/z and ~ Histones H2B1 and H3 m/z m/z and α and β hemoglobins m/z Chaurand et Al. Anal Chem, 76, 86A-93A (2004). m/z m/z %
19 Can We Do Better? Tissue Profiling/Imaging How Best to Apply Matrix? Matrix Deposition Variables: Time Repr. Inherent Spot Res. Laser Demand BG Dependent Spot Size Manual Spotting seconds variable N >1mm Y Robotic Spotting minutes good N ~200µ Y Laser Capture hours good Y ~7µ to 100 µ N Current Laser Spot Size for Old STR: 25µ x 50µ


20 Hand Spotting Vs. Pico Spotting Vs. LCM 4x HandSpot ~2mm 10x PicoSpot ~200µ 100 µ


21 The Robotic Spotter Computer controlled motorized stage Drop imaging MALDI target with sample Strobe LED for drop illumination Substrate image capturing Acoustic drop ejector with reservoir

22 Acoustic Drop Ejection Technology x y Sample plate Ejection of microdroplets Matrix reservoir Coupling membrane Transducer Coupling reservoir RF generator Waveform generator Current performances: - Spot size: ~ µm - Drop ejection rate: 10 Hz - Drops per pixel: 60-80
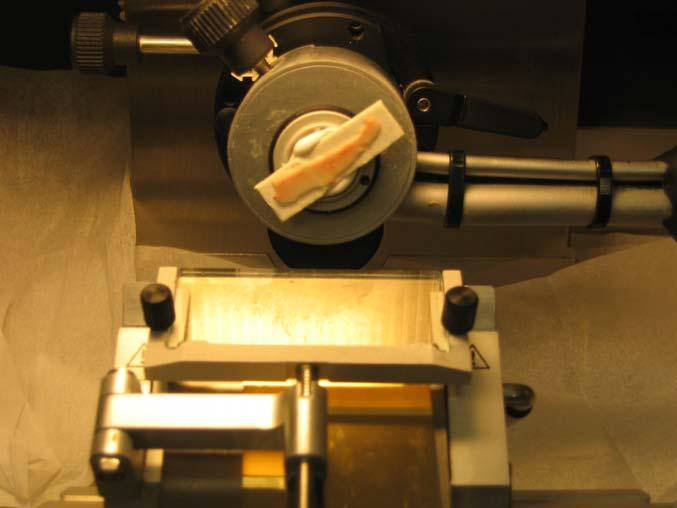
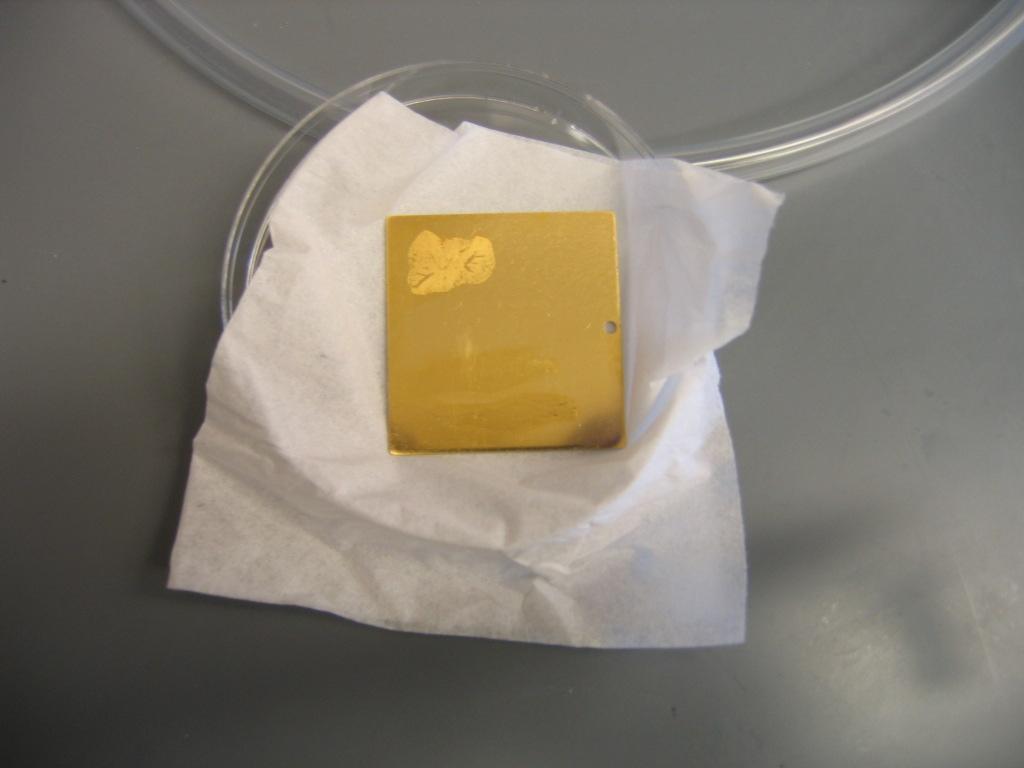
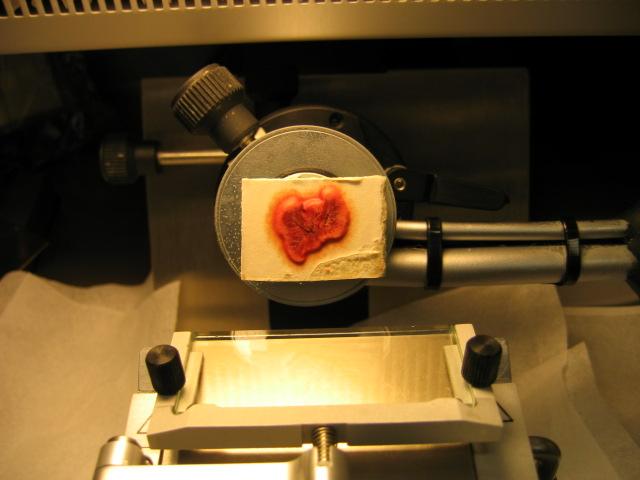
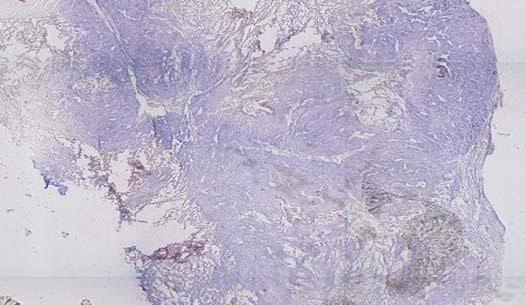
23 Tissue Sectioning for Protein Profiling


24 Seamless High Resolution Imaging of Histological Slides Whole Mouse Mammary Gland

25 Histology Directed Matrix Deposition


26 Whole Lung Sections Lung Mets


27 Automating Whole Plate Profiling Rapid Spotting Over Entire Plate MALDI-Tof Plate... A2 Not used A A4 A5 B1. B2 B3.... B4 C4 C3 C2 C1
28 Breast Cancer Early Vs. Late Disease M.G. - NO Tumor M.G. Early BCa M.G. Late BCa 2 kda 20 kda
29 Lung Results Mets from Vs. Mass Late Profiling Carcinoma Tissue of the Sections Breast Lung Mets Vs. Late Carcinoma Calgranulin A M.G. Late BCa Lung Mets 2 kda 20 kda
 Mouse brain, Analysis")
30 Manual Spotting Vs. The Robotic Spotting A) Mouse brain, Analysis of the corpus callosum B)


31 MS Imaging of a Mouse Brain Section By Robotic Spotting m/z m/z m/z μm 0 % 100 % m/z m/z 6759 m/z 7338 Intensity Mass (m/z)
32 Schematic Representation of Protein Marker Identification Homogenate Lung Tumor * m/z MD HPLC Fractions Tryptic Digestion MS/MS MALDI MS * m/z Mw Matches Mw Matches Add Post- Translational Modification Database Search Protein ID m/z


33 mucosa submucosa Normal Human Colon Biopsy 1000 µm muscle m/z Combined Image m/z 7930 m/z 8958 Combined Image


34 cortex Rat Kidney Sagittal Section medula m/z 9979 m/z 10, mm Intensity m/z 9943 m/z 17, Mass (m/z) Overlay Overlay
35 Molecular Determination of Tumor Margins Histological tumor margin Non-tumor 1 cm 15 x 100 spots 250 µm resolution Tumor Vessel Fibrous stroma Skeletal muscle Robert Caldwell,

36 B A B A C D E E C D

37 Histological vs. Molecular Assessment of the Tumor Margin:

")
38 Proteins are OK But What About Drug Distribution/ Metabolism? Better..Correlating Drug Effects with Protein Expression. Cut frozen slice (12 μm) Dose animal orally i.v. Remove tissue Apply matrix Reyzer ML et al, J Mass Spectrom, 38, (2003) Reyzer ML et al, Cancer Res 64, (2004) Laser Analyze by: MALDI MS and MALDI MS/MS
39 MMTV/HER2 Transgenic Mouse Mammary Tumors MMTV/HER2 cells transplanted in FVB female mice. Tumor grown to a size of ~200 mm 3. OSI 774 is an intracellular tyrosine kinase EGF receptor inhibitor. Administered orally for 1 week Tumor Volume (mm 3 ) Captisol 200 µl (vector) OSI mg/kg Days post-treatment Contributed by M. Sliwkowski (Genentech, Inc.)

40 O O MS/MS Analysis of OSI-774 in Tumor Tissue Tumors removed after a single 100 mg/kg dose of OSI-774 O O +H +H m/z m/z N N NH H + MW = Intensity [OSI774 + H] HC C m/z 4 hr Intensity 278 Spot #3 Monitored CAD transition m/z m/z
41 Dose Dependence of Protein Alteration (20 hr after dose) 9 control mice, Av of 54 spectra 3x3 dosed mice, Av of 9 spectra per dose thymosin β 4 Relative intensity Control 10 mg/kg 30 mg/kg 100 mg/kg Mass (m/z)
42 Analysis of MALDI-Tof Data The Workflow Raw Spectra Preprocessing Txt File Export Baseline/ noise subtraction Recalibration/ Realignment Normalization TIC Wavelet Processed Spectra Peak Picking Binning Peak Selection Supervised Feature Selection WMA T-Test Supervised Classification (training set) KNN SVM/ LOOCV Visual Inspection of Peaks rule out noise chemical adducts Biomarker List
43 Recent Example; No Data Processing Raw Files Check For Saturation! 2.5kDa 13.5kDa

44 Post Baseline and Normalization Pre Alignment Check Alignment! * 2.5kDa 13.5kDa
45 * Post-BSL/Norm/Align [No Smoothing] Good Alignment Decreased Error Smaller Bin Sizes!
46 Testing the Approach: Liver Set Doped with Known Proteins 10 Spectra/ Set 1. Baseline Correct (Efeckta) 2. Smoothing (none) 3. Calibration (Efeckta) 4. Normalize/ Transform (TIC, Wavelet, Log, Ln, CR) 5. Standardization (none) 6. Peak Picking (WMA data dependent cutoff ) m/z mix Insulin (porcine) Cytochrome C Apomyoglobin Trypsinogen Spectra contain liver extract proteins spiked with the standard proteins listed above. Concentrations are in pmol/ul (μm)
47 Relative Normalized Intensities Insulin 2+ cytc ApoM Tryp NonNormalized TIC STD's CR Wavelet WaveletTIC Peaks Identified Using all Techniques with all stds at 2 fold diff except Tryp at 1.3. TIC and TIC with Wavelet work best! 0 10k 20k 30k 40k m/z Relative Normalized Intensities NonNormalized TIC STD's CR Wavelet WaveletTIC k 8.5k m/z
48 -statistically relevant peaks that are not real! Std Set with 10 Fold Difference [Set 1 Vs. Set 4] Relative Normlized Intensities NonNormalized TIC STD's CR WaveletNorm WaveletSMNorm WaveletTIC Peaks Identified Using all Techniques with all stds at 10 fold diff except Tryp at k 20k 30k 40k m/z Std Set with 10 Fold Difference [Set 1 Vs. Set 4] Relative Normlized Intensities Std Set with 10 Fold Difference [Set 1 Vs. Set 4] NonNormalized TIC STD's CR WaveletNorm WaveletSMNorm WaveletTIC Relative Normlized Intensities 0.8 NonNormalized TIC STD's CR WaveletNorm WaveletSMNorm WaveletTIC k 8.5k 8.5k m/z 17k 18k 19k m/z - logging techniques pick shoulders not peak asymptotes!
49 Spectral Processing Increases Detection Range and Sensitivity Unprocessed Processed 1e+5 1e+5 Ins (1+) CC (1+) ApoM (1+) Ins (1+) CC (1+) ApoM (1+) log (Absolute Intensity) 1e+4 log (Normalized Intensity) 1e+4 1e+3 1e log (Protein Concentration) log (Protein Concentration) Intensity Normalized Intensity m/z m/z


50 These Techniques also Greatly Enhance MALDI Generated Images! Raw Data Processed Data Norris J.L., Cornett, D.S., Mobley J.A., Andersson M., Caprioli R.M. Processing MALDI Mass Spectra to Aid Biomarker Discovery and Improve Mass Spectral Image Quality, International Journal of Mass Spectrometry, 2006 (In Print).
51 What About Statistics? Now we can apply these data sets to really any type of statistics that one might want to employ. But be careful, we have to insure that the peaks are real and not noise and not adducts of sodium, potassium, or matrix. This is very common and the mass spec person needs to be involved again at this point!
52 Evaluation of Peaks in Pairwise Analysis with a Std. Err Plot Healthy Group CaP Patients CaP m/z 2935, CaP m/z CaP m/z CaP m/z

53 Hierarchical Clustering Analysis Carried out Statistically Differing Peaks from a Training Set M/Z CaP NL Top 280 data Points (36 Peaks) C 38C 64C 57C 37C 28C 62C 27C 71C 70C 9C 4C 50C 18C 17C 11C 8C 10C 79N 47N 48N 82N 61N 118N 9N 63N 44N 1N 11N 94N 93N 98N 64N 23N 119N 81N 97N 117N 62N 29N 28N 21N 78N 46N 66N 65N 80N 49N 115N CaP 2935 CaP
54 Clinical Serum Profiling Experiment; Example of Hierarchical Clustering Analysis Carried out on 168 Patient Sample Set g y p CaP NL n=70 n=98 Normal Local CaP Metastatic CaP
55 Clinical Test Based on Specific Protein Peaks Diagnostic Efficiency as Determined through Class Prediction by Weighted Voting Scheme General Stats: N Median Age PSA > 4.0 PSA < 4.0 Normals ( ) 86 CaP ( ) Diagnostic Stats: # Variables N Sensitivity Specificity PPV NPV Non-Predicted % 99.0 % Sensitivity; TP/ (TP + FN) TP true positive Specificity; TN/ (TN + FP) TN true negative PPV; TP/ (TP + FP) FP false positive FN false negative NPV; TN/ (TN + FN) Note: Non-predicted values were not included in final calculations
.")
56 Another Example: Biomarker Identification and Classification was Applied to a Single Section; (May be able to differentiate DCIS from IMC??) Cornett D.S., Mobley J.A., Dias, E.C., Andersson M., Arteaga C.L., Sanders M.E., Caprioli, R.M.; Histology Directed MALDI-MS Profiling Improves Throughput and Cellular Specificity in Human Breast Cancer, Journal of Molecular and Cellular Proteomics 2006 (in print).
57 What to Do with These Peaks? Top Down Proteomics Bottom up Peptidomics Medium Down Approaches Top Down Directed
58 What to do With these Markers? First and foremost validation using immunodirected or quantitative MS techniques must also be carried out. Mechanistic studies, i.e. knocking out a gene found to be involved in the disease process (LOF). This can be combined with global or directed stable isotope label studies in cell culture (i.e. SILAC, ITRAQ, ICAT).


59 Ex: HTP Validation of Novel Markers with Multiplex Bead Assays (Luminex( Luminex) Multiplex Bead Assay for cytokines The highlighted area represent populations of fluorescent beads, distinctively labeled, and carrying capture antibodies for sandwich assay of different cytokines. All detection antibodies carry the same fluorophore, which is read in a third channel to quantify sample cytokine concentration Bosch I. et. al. work in progress!
60 Quantitative Proteomics Stable Isotope Tags: (Mechanism Studies) ICAT (isotope coded affinity tag) SILAC (stable isotope labeled AA in cell culture) itraq (Isotope tags for relative and absolute and quantification) 18 O Digests (labels trypsin digested peptides at lysine and arginine) Many Other Chemical Tags
61 Conclusions?? Draw your own.. Just Another Tool in the Toolbox??? Too Soon to Know, Let s see where it takes us!
62 MSRC Richard Caprioli (Director) Shannon Cornett James Mobley Michelle Reyzer Jeremy Norris Robert Caldwell Erin Seeley Stacey Oppenheimer Sheerin Khatib-Shahid Pierre Chaurrand Kristin Burnum Kristen Herring Saturday Puolitaival Hans Reudi Aerni Greg Bowersock (IT) Ken Shriver Others Per Andren, Uppsala University Robert Weil, NIH Walter Korfmacher, Schering-Plough Markus Stoeckli, Novartis Acknowledgments Vanderbilt Collaborators Carlos Arteaga (Breat SPORE Dir.) David Carbone (Lung SPORE Dir.) Robert Coffey Jr. (GI SPORE Dir.) Marie-Claire Orgebin-Crist Ariel Deutch Dennis Hallahan Pat Levitt Robert Matusik Jason Moore Hal Moses Jennifer Pietenpol Ned Porter Yu Shyr Robert Whitehead Ken Schriver Funding NIH (NCI, GMS, NIDA) Vanderbilt University
63 Questions?
Tissue Profiling by MALDI-Tof MS: Basic Principles From Small Molecules to Proteins
 Tissue Profiling by MALDI-Tof MS: Basic Principles From Small Molecules to Proteins James Mobley, Ph.D. Proteomics Facility Vanderbilt University Imaging Mass Spectrometry of Thin Tissue Sections To obtain
Sequence Identification And Spatial Distribution of Rat Brain Tryptic Peptides Using MALDI Mass Spectrometric Imaging
 Sequence Identification And Spatial Distribution of Rat Brain Tryptic Peptides Using MALDI Mass Spectrometric Imaging AB SCIEX MALDI TOF/TOF* Systems Patrick Pribil AB SCIEX, Canada MALDI mass spectrometric
Learning Objectives. Overview of topics to be discussed 10/25/2013 HIGH RESOLUTION MASS SPECTROMETRY (HRMS) IN DISCOVERY PROTEOMICS
 IN DISCOVERY PROTEOMICS") HIGH RESOLUTION MASS SPECTROMETRY (HRMS) IN DISCOVERY PROTEOMICS A clinical proteomics perspective Michael L. Merchant, PhD School of Medicine, University of Louisville Louisville, KY Learning Objectives
HIGH RESOLUTION MASS SPECTROMETRY (HRMS) IN DISCOVERY PROTEOMICS A clinical proteomics perspective Michael L. Merchant, PhD School of Medicine, University of Louisville Louisville, KY Learning Objectives
Isolation of pure cell populations from healthy and
 Direct Analysis of Laser Capture Microdissected Cells by MALDI Mass Spectrometry Baogang J. Xu and Richard M. Caprioli Department of Chemistry, Vanderbilt University, Nashville, Tennessee, USA Melinda
Quantification with Proteome Discoverer. Bernard Delanghe
 Quantification with Proteome Discoverer Bernard Delanghe Overview: Which approach to use? Proteome Discoverer Quantification Method What When to use Metabolic labeling SILAC Cell culture systems Small
Technical Note # TN-31 Redefining MALDI-TOF/TOF Performance
 Bruker Daltonics Technical Note # TN-31 Redefining MALDI-TOF/TOF Performance The new ultraflextreme exceeds all current expectations of MALDI-TOF/TOF technology: A proprietary khz smartbeam-ii TM MALDI
Future Directions: Tissue and Cell Imaging Robert C. Murphy
 LIPID MAPS Lipidomics Workshop April 19, 2009 www.lipidmaps.org m/z 806 (16:0a/22:6-PC) [M+H] + Future Directions: Tissue and Cell Imaging Robert C. Murphy 16:0/22:6 PC m/z 806.4 Department of Pharmacology
Mass Spectrometry. Mass spectrometer MALDI-TOF ESI/MS/MS. Basic components. Ionization source Mass analyzer Detector
 Mass Spectrometry MALDI-TOF ESI/MS/MS Mass spectrometer Basic components Ionization source Mass analyzer Detector 1 Principles of Mass Spectrometry Proteins are separated by mass to charge ratio (limit
Lecture 3. Tandem MS & Protein Sequencing
 Lecture 3 Tandem MS & Protein Sequencing Nancy Allbritton, M.D., Ph.D. Department of Physiology & Biophysics 824-9137 (office) nlallbri@uci.edu Office- Rm D349 Medical Science D Bldg. Tandem MS Steps:
MALDI Imaging Mass Spectrometry
 MALDI Imaging Mass Spectrometry Nan Kleinholz Mass Spectrometry and Proteomics Facility The Ohio State University Mass Spectrometry and Proteomics Workshop What is MALDI Imaging? MALDI: Matrix Assisted
Three Dimensional Mapping and Imaging of Neuropeptides and Lipids in Crustacean Brain
 Three Dimensional Mapping and Imaging of Neuropeptides and Lipids in Crustacean Brain Using the 4800 MALDI TOF/TOF Analyzer Ruibing Chen and Lingjun Li School of Pharmacy and Department of Chemistry, University
INTRODUCTION TO MALDI IMAGING
 INTRODUCTION TO MALDI IMAGING Marten F. Snel, Emmanuelle Claude, Thérèse McKenna, and James I. Langridge Waters Corporation, Manchester, UK INT RODUCTION The last few years have seen a rapid increase in
MALDI-TOF analysis of whole blood: its usefulness and potential in the assessment of HbA1c levels
 MALDI-TOF analysis of whole blood: its usefulness and potential in the assessment of HbA1c levels Jane Y. Yang, David A. Herold Department of Pathology, University of California San Diego, 9500 Gilman
New Developments in LC-IMS-MS Proteomic Measurements and Informatic Analyses
 New Developments in LC-IMS-MS Proteomic Measurements and Informatic Analyses Erin Shammel Baker Kristin E. Burnum-Johnson, Xing Zhang, Cameron P. Casey, Yehia M. Ibrahim, Matthew E. Monroe, Tao Liu, Brendan
Proteomic Biomarker Discovery in Breast Cancer
 Proteomic Biomarker Discovery in Breast Cancer Rob Baxter Laboratory for Cellular and Diagnostic Proteomics Kolling Institute, University of Sydney, Royal North Shore Hospital robert.baxter@sydney.edu.au
MS-IMS (MALDI-IMAGING)?
?") MS-IMS (MALDI-IMAGING)? Protein Chemistry/Proteomics and Peptide Synthesis and Array Unit Biomedicum Helsinki and Haartman Institute E-Mail: marc.baumann@helsinki.fi (http://research.med.helsinki.fi/corefacilities/proteinchem)
MS-IMS (MALDI-IMAGING)? Protein Chemistry/Proteomics and Peptide Synthesis and Array Unit Biomedicum Helsinki and Haartman Institute E-Mail: marc.baumann@helsinki.fi (http://research.med.helsinki.fi/corefacilities/proteinchem)
Small Molecule Drug Imaging of Mouse Tissue by MALDI-TOF/TOF Mass Spectrometry and FTMS
 Bruker Daltonics Application Note # MT-93/FTMS-38 Small Molecule Drug Imaging of Mouse Tissue by MALDI-TOF/TOF Mass Spectrometry and FTMS Introduction Matrix Assisted Laser Desorption Ionization (MALDI)
Applications for MALDI-TOF Imaging Present and Future
 Y Position 8563 / (3000-30000) 12124 / (3000-30000) 14044 / (3000-30000) 10158 35 / (3000-30000) 15012 / (3000-30000) 10894 / (3000-30000) 4964 / (3000-30000) 12414 / (3000-30000) Area Chromatogram - All
MALDI-IMS (MATRIX-ASSISTED LASER DESORPTION/IONIZATION
 MALDI-IMS (MATRIX-ASSISTED LASER DESORPTION/IONIZATION IMAGING MASS SPECTROMETER) IN TISSUE STUDY YANXIAN CHEN MARCH 8 TH, WEDNESDAY. SEMINAR FOCUSING ON What is MALDI imaging mass spectrometer? How does
LECTURE-15. itraq Clinical Applications HANDOUT. Isobaric Tagging for Relative and Absolute quantitation (itraq) is a quantitative MS
 is a quantitative MS") LECTURE-15 itraq Clinical Applications HANDOUT PREAMBLE Isobaric Tagging for Relative and Absolute quantitation (itraq) is a quantitative MS based method for quantifying proteins subject to various different
LECTURE-15 itraq Clinical Applications HANDOUT PREAMBLE Isobaric Tagging for Relative and Absolute quantitation (itraq) is a quantitative MS based method for quantifying proteins subject to various different
Bildgebende Massenspektrometrie Erfolgreiche Anwendungen in der biomedizinischen Forschung. Markus Stoeckli
 Bildgebende Massenspektrometrie Erfolgreiche Anwendungen in der biomedizinischen Forschung Markus Stoeckli MALDI Mass Spectrometric Imaging Principle 2 MALDI MSI Markus Stoeckli September 2014 Comparison
Next-Generation Immunohistochemistry: Multiplex tissue imaging with mass cytometry
 Nat Met, April 2014 Nat Med, April 2014 Next-Generation Immunohistochemistry: Multiplex tissue imaging with mass cytometry Journal Club Timo Böge Overview Introduction Conventional Immunohistochemistry
SUNY UPSTATE MEDICAL UNIVERSITY PROTEOMICS CORE
 SUNY UPSTATE MEDICAL UNIVERSITY PROTEOMICS CORE Location: SUNY Upstate Medical University Weiskotten Hall Addition, Room 4303 750 East Adams Street Syracuse, NY 13210 Contact Information: David Kakhniashvili,
Supporting information for: Memory Efficient. Principal Component Analysis for the Dimensionality. Reduction of Large Mass Spectrometry Imaging
 Supporting information for: Memory Efficient Principal Component Analysis for the Dimensionality Reduction of Large Mass Spectrometry Imaging Datasets Alan M. Race,,, Rory T. Steven,, Andrew D. Palmer,,,
MSSimulator. Simulation of Mass Spectrometry Data. Chris Bielow, Stephan Aiche, Sandro Andreotti, Knut Reinert FU Berlin, Germany
 Chris Bielow Algorithmic Bioinformatics, Institute for Computer Science MSSimulator Chris Bielow, Stephan Aiche, Sandro Andreotti, Knut Reinert FU Berlin, Germany Simulation of Mass Spectrometry Data Motivation
Imaging Mass Microscope
 Imaging Mass Microscope imscope C146-E220 Introducing the New Era of Imaging Mass Spectrometry Imaging mass spectrometry is a revolutionary new technology. The instrument is a combination of an optical
COMBINING LASER CAPTURE MICRODISSECTION AND MALDI MASS SPECTROMETRY FOR TISSUE PROTEIN PROFILING: METHODOLOGY DEVELOPMENT AND CLINICAL APPLICATIONS
 COMBINING LASER CAPTURE MICRODISSECTION AND MALDI MASS SPECTROMETRY FOR TISSUE PROTEIN PROFILING: METHODOLOGY DEVELOPMENT AND CLINICAL APPLICATIONS By Baogang Jonathan Xu Dissertation Submitted to the
PosterREPRINT AN AUTOMATED METHOD TO SELF-CALIBRATE AND REJECT NOISE FROM MALDI PEPTIDE MASS FINGERPRINT SPECTRA
 Overview AN AUTOMATED METHOD TO SELF-CALIBRATE AND REJECT NOISE FROM MALDI PEPTIDE MASS FINGERPRINT SPECTRA Jeffery M Brown, Neil Swainston, Dominic O. Gostick, Keith Richardson, Richard Denny, Steven
PTM Discovery Method for Automated Identification and Sequencing of Phosphopeptides Using the Q TRAP LC/MS/MS System
 Application Note LC/MS PTM Discovery Method for Automated Identification and Sequencing of Phosphopeptides Using the Q TRAP LC/MS/MS System Purpose This application note describes an automated workflow
Bruker Daltonics. autoflex III smartbeam. The Standard in MALDI-TOF Performance MALDI-TOF/TOF. think forward
 Bruker Daltonics autoflex III smartbeam The Standard in MALDI-TOF Performance think forward MALDI-TOF/TOF Designed for a Routine High Level of Performance The autoflex III smartbeam brings the power of
Proteomics/Peptidomics
 Proteomics/Peptidomics System biology tools and preclinical models for translational research in endometriosis, ESHRE Campus workshop, 4-5 September 2009 E. Waelkens Proteomics: What? Proteins Proteomics
Multiplex Protein Quantitation using itraq Reagents in a Gel-Based Workflow
 Multiplex Protein Quantitation using itraq Reagents in a Gel-Based Workflow Purpose Described herein is a workflow that combines the isobaric tagging reagents, itraq Reagents, with the separation power
Quantification by Mass Spectrometry
 Quantification by Mass Spectrometry PC219 Lecture 5 30 April, 2010 sguan@cgl.ucsf.edu 1 Applications of Quantitative Proteomics Qualitative protein identification is NOT sufficient to describe a biological
MS1 and MS2 crosstalk in label free quantitation of mass spectrometry data independent acquisitions
 MS1 and MS2 crosstalk in label free quantitation of mass spectrometry data independent acquisitions MS1 528.18 +++ m/z 568.98 ++ m/z 678.34 ++ m/z MS2/SWATH June 9th, 2013 Matthew J. Rardin SIRT3 regulated
SYNAPT G2-S High Definition MS (HDMS) System
 System") SYNAPT G2-S High Definition MS (HDMS) System High performance, versatility, and workflow efficiency of your MS system all play a crucial role in your ability to successfully reach your scientific and business
SYNAPT G2-S High Definition MS (HDMS) System High performance, versatility, and workflow efficiency of your MS system all play a crucial role in your ability to successfully reach your scientific and business
Digitizing the Proteomes From Big Tissue Biobanks
 Digitizing the Proteomes From Big Tissue Biobanks Analyzing 24 Proteomes Per Day by Microflow SWATH Acquisition and Spectronaut Pulsar Analysis Jan Muntel 1, Nick Morrice 2, Roland M. Bruderer 1, Lukas
Extended Mass Range Triple Quadrupole for Routine Analysis of High Mass-to-charge Peptide Ions
 Extended Mass Range Triple Quadrupole for Routine Analysis of High Mass-to-charge Peptide Ions Application Note Targeted Proteomics Authors Linfeng Wu, Christine A. Miller, Jordy Hsiao, Te-wei Chu, Behrooz
Data Independent MALDI Imaging HDMS E for Visualization and Identification of Lipids Directly from a Single Tissue Section
 Data Independent MALDI Imaging HDMS E for Visualization and Identification of Lipids Directly from a Single Tissue Section Emmanuelle Claude, Mark Towers, and Kieran Neeson Waters Corporation, Manchester,
Imaging of lipid species by MALDI mass spectrometry
 Imaging of lipid species by MALDI mass spectrometry Robert C. Murphy, 1 Joseph A. Hankin, and Robert M. Barkley Department of Pharmacology, MS 8303 University of Colorado Denver, Aurora, CO 80045 Abstract
MS/MS to Targeted Proteomics (MRM)
") MS/MS to Targeted Proteomics (MRM) How it worked on the Human Lens Proteome Jayson Falkner PhD jay@singleorganism.com Genes Show Limited Value in Predicting Diseases With only a few exceptions, what the
MS/MS to Targeted Proteomics (MRM) How it worked on the Human Lens Proteome Jayson Falkner PhD jay@singleorganism.com Genes Show Limited Value in Predicting Diseases With only a few exceptions, what the
High-Throughput Analysis of Oligonucleotides using Automated Electrospray Ionization Mass Spectrometry
 High-Throughput Analysis of Oligonucleotides using Automated Electrospray Ionization Mass Spectrometry Mark E. Hail 1, Brian Elliott 2, Kerry Nugent 3, Jeffrey L. Whitney 1, and David J. Detlefsen 1 1
Tissue and Fluid Proteomics Chao-Cheng (Sam) Wang
 Wang") Tissue and Fluid Proteomics Chao-Cheng (Sam) Wang UAB-03/09/2004 What is proteomics? A snap shot of the protein pattern!! What can proteomics do? To provide information on functional networks and/or involvement
Tissue and Fluid Proteomics Chao-Cheng (Sam) Wang UAB-03/09/2004 What is proteomics? A snap shot of the protein pattern!! What can proteomics do? To provide information on functional networks and/or involvement
LC/MS/MS SOLUTIONS FOR LIPIDOMICS. Biomarker and Omics Solutions FOR DISCOVERY AND TARGETED LIPIDOMICS
 LC/MS/MS SOLUTIONS FOR LIPIDOMICS Biomarker and Omics Solutions FOR DISCOVERY AND TARGETED LIPIDOMICS Lipids play a key role in many biological processes, such as the formation of cell membranes and signaling
REDOX PROTEOMICS. Roman Zubarev.
 REDOX PROTEOMICS Roman Zubarev Roman.Zubarev@ki.se Physiological Chemistry I, Department for Medical Biochemistry & Biophysics, Karolinska Institutet, Stockholm What is (RedOx) Proteomics? Proteomics -
ANALYTISCHE STRATEGIE Tissue Imaging. Bernd Bodenmiller Institute of Molecular Life Sciences University of Zurich
 ANALYTISCHE STRATEGIE Tissue Imaging Bernd Bodenmiller Institute of Molecular Life Sciences University of Zurich Quantitative Breast single cancer cell analysis Switzerland Brain Breast Lung Colon-rectum
SIEVE 2.1 Proteomics Example
 SIEVE 2.1 Proteomics Example Software Overview What is SIEVE? SIEVE is Thermo Scientific s differential software solution. SIEVE will continue to enhance our current product for label-free differential
What Impact will Proteomics, Including CSF Analysis, have on the Near-term Development of Biomarkers for Nervous System Diseases?
 What Impact will Proteomics, Including CSF Analysis, have on the Near-term Development of Biomarkers for Nervous System Diseases? Daumier 1 Howard Schulman (howard.schulman@menlo.ppdi.com) Biomarker Discovery,
Mass spectrometry imaging. What does MS imaging offer?
 BMG 744 Mass spectrometry imaging Stephen Barnes, PhD With sincere acknowledgments to David Stella, PhD and Kyle A. Floyd, MS, former students in the Barnes Laboratory (2005 2012) and Kevin Schey, PhD,
4th Multidimensional Chromatography Workshop Toronto (January, 2013) Herman C. Lam, Ph.D. Calibration & Validation Group
 Herman C. Lam, Ph.D. Calibration & Validation Group") 4th Multidimensional Chromatography Workshop Toronto (January, 2013) Herman C. Lam, Ph.D. Calibration & Validation Group MDLC for Shotgun Proteomics Introduction General concepts Advantages Challenges
4th Multidimensional Chromatography Workshop Toronto (January, 2013) Herman C. Lam, Ph.D. Calibration & Validation Group MDLC for Shotgun Proteomics Introduction General concepts Advantages Challenges
Analysis of Peptides via Capillary HPLC and Fraction Collection Directly onto a MALDI Plate for Off-line Analysis by MALDI-TOF
 Analysis of Peptides via Capillary HPLC and Fraction Collection Directly onto a MALDI Plate for Off-line Analysis by MALDI-TOF Application Note 219 Joan Stevens, PhD; Luke Roenneburg; Kevin Fawcett (Gilson,
Suppression of the Malignant Phenotype of Bladder Cancer Cells Investigations of the Proteome in Relation to Phenotype and Gene Expression
 Suppression of the Malignant Phenotype of Bladder Cancer Cells Investigations of the Proteome in Relation to Phenotype and Gene Expression Topics Modulation of Phenotype by Extracellular Matrix. Bioinformatics
Increasing Molecular Coverage in Complex Biological and Environmental Samples by Using IMS-MS
 Increasing Molecular Coverage in Complex Biological and Environmental Samples by Using IMS-MS Erin Shammel Baker Kristin E. Burnum-Johnson, Jon M. Jacobs, Yehia M. Ibrahim, Daniel J. Orton, William F.
Comparison of mass spectrometers performances
 Comparison of mass spectrometers performances Instrument Mass Mass Sensitivity resolution accuracy Quadrupole 1 x 10 3 0.1 Da* 0.5-1.0 pmol DE-MALDI 2 x 10 4 20 ppm 1-10 fmol peptide 1-5 pmol protein Ion
Supplementary Information
 Supplementary Information Molecular imaging of brain localization of liposomes in mice using MALDI mass spectrometry Annabelle Fülöp 1,2, Denis A. Sammour 1,2, Katrin Erich 1,2, Johanna von Gerichten 4,
NON TARGETED SEARCHING FOR FOOD
 NON TARGETED SEARCHING FOR FOOD CONTAMINANTS USING ORBITRAP HIGH RESOLUTION MASS SPECTROMETRY Michal Godula 1, Adrian Charlton 2 and Klaus Mittendorf 1 1 Thermo Fisher Scientific, Dreieich, Germany 2 Food
Supporting Information
 Supporting Information Wiley-VCH 2006 69451 Weinheim, Germany Tissue Imaging at Atmospheric Pressure using Desorption Electrospray Ionization (DESI) Mass Spectrometry Justin M. Wiseman, Demian R. Ifa,
FPO. Label-Free Molecular Imaging. Innovation with Integrity. Discover, localize and quantify biochemical changes and molecular markers
 FPO Label-Free Molecular Imaging Discover, localize and quantify biochemical changes and molecular markers Innovation with Integrity Mass Spectrometry Bruker, the global leader in MALDI-MS technology,
Using CART to Mine SELDI ProteinChip Data for Biomarkers and Disease Stratification
 Using CART to Mine SELDI ProteinChip Data for Biomarkers and Disease Stratification Kenna Mawk, D.V.M. Informatics Product Manager Ciphergen Biosystems, Inc. Outline Introduction to ProteinChip Technology
O O H. Robert S. Plumb and Paul D. Rainville Waters Corporation, Milford, MA, U.S. INTRODUCTION EXPERIMENTAL. LC /MS conditions
 Simplifying Qual/Quan Analysis in Discovery DMPK using UPLC and Xevo TQ MS Robert S. Plumb and Paul D. Rainville Waters Corporation, Milford, MA, U.S. INTRODUCTION The determination of the drug metabolism
New Instruments and Services
 New Instruments and Services Liwen Zhang Mass Spectrometry and Proteomics Facility The Ohio State University Summer Workshop 2016 Thermo Orbitrap Fusion http://planetorbitrap.com/orbitrap fusion Thermo
Phospholipid characterization by a TQ-MS data based identification scheme
 P-CN1716E Phospholipid characterization by a TQ-MS data based identification scheme ASMS 2017 MP-406 Tsuyoshi Nakanishi 1, Masaki Yamada 1, Ningombam Sanjib Meitei 2, 3 1 Shimadzu Corporation, Kyoto, Japan,
Detection, Differentiation, and Subtyping of Botulinum Neurotoxins with Mass Spectrometry
 Detection, Differentiation, and Subtyping of Botulinum Neurotoxins with Mass Spectrometry Suzanne R. Kalb*, Hercules Moura*, Wanda I. Santana*, Jakub Baudys*, Maria I. Solano*, Adrian R. Woolfitt*, Theresa
AlphaScreen : A Straightforward and Powerful Alternative to ELISA. Martina Bielefeld-Sévigny Ph.D., R&D Director
 AlphaScreen : A Straightforward and Powerful Alternative to ELISA Martina Bielefeld-Sévigny Ph.D., R&D Director Overview AlphaScreen - an alternative to ELISA Why an alternative to ELISA? Assay principle
MALDI imaging mass spectrometry: molecular snapshots of biochemical systems
 MALDI imaging mass spectrometry: molecular snapshots of biochemical systems Dale S Cornett, Michelle L Reyzer, Pierre Chaurand & Richard M Caprioli Matrix-assisted laser desorption/ionization (MALDI) imaging
Application Note # LCMS-89 High quantification efficiency in plasma targeted proteomics with a full-capability discovery Q-TOF platform
 Application Note # LCMS-89 High quantification efficiency in plasma targeted proteomics with a full-capability discovery Q-TOF platform Abstract Targeted proteomics for biomarker verification/validation
Supporting Information MALDI versus ESI the impact of the ion source on peptide identification
 Supporting Information MALDI versus ESI the impact of the ion source on peptide identification Wiebke Maria Nadler, 1 Dietmar Waidelich, 2 Alexander Kerner, 1 Sabrina Hanke, 1 Regina Berg, 3 Andreas Trumpp
Mass spectrometry Technologies in Lipid chemistry
 Mass spectrometry Technologies in Lipid chemistry Rabah Soliymani University Of Helsinki Protein Chemistry Unit Biomedicum Helsinki Rabah.soliymani@helsinki.fi Complex_&_dynamic_mixtures (few copies to
MALDI Mass Spectrometry: A Label-Free Solution for Ultra-High-Throughput Screening
 MALDI Mass Spectrometry: A Label-Free Solution for Ultra-High-Throughput Screening MIPTEC Conference 2016 Meike Hamester, Jens Fuchser Bruker Daltonik, Bremen 1 MALDI PharmaPulse for: Biochemical Screening
2. Ionization Sources 3. Mass Analyzers 4. Tandem Mass Spectrometry
 Dr. Sanjeeva Srivastava 1. Fundamental of Mass Spectrometry Role of MS and basic concepts 2. Ionization Sources 3. Mass Analyzers 4. Tandem Mass Spectrometry 2 1 MS basic concepts Mass spectrometry - technique
SELYMATRA: Web Application for the analysis. of mass spectra
 SELYMATRA: Web Application for the analysis of mass spectra arxiv:1710.05914v1 [q-bio.qm] 15 Oct 2017 Davide Nardone, Angelo Ciaramella, Mariangela Cerreta, Salvatore Pulcrano, Gian Carlo Bellenchi, Giuseppe
Mass Spectrometry. - Introduction - Ion sources & sample introduction - Mass analyzers - Basics of biomolecule MS - Applications
 - Introduction - Ion sources & sample introduction - Mass analyzers - Basics of biomolecule MS - Applications Adapted from Mass Spectrometry in Biotechnology Gary Siuzdak,, Academic Press 1996 1 Introduction
New Instruments and Services
 New Instruments and Services http://planetorbitrap.com/orbitrap fusion Combining the best of quadrupole, Orbitrap, and ion trap mass analysis in a revolutionary Tribrid architecture, the Orbitrap Fusion
PUBLISHED VERSION Gustafsson JOR, et al. PERMISSIONS.
 PUBLISHED VERSION Gustafsson, Ove Johan Ragnar; McColl, Shaun Reuss; Hoffmann, Peter Imaging mass spectrometry and its methodological application to murine tissue, Journal of Proteomics and Bioinformatics,
Automated Sample Preparation/Concentration of Biological Samples Prior to Analysis via MALDI-TOF Mass Spectroscopy Application Note 222
 Automated Sample Preparation/Concentration of Biological Samples Prior to Analysis via MALDI-TOF Mass Spectroscopy Application Note 222 Joan Stevens, Ph.D.; Luke Roenneburg; Tim Hegeman; Kevin Fawcett
Proteomics of body liquids as a source for potential methods for medical diagnostics Prof. Dr. Evgeny Nikolaev
 Proteomics of body liquids as a source for potential methods for medical diagnostics Prof. Dr. Evgeny Nikolaev Institute for Biochemical Physics, Rus. Acad. Sci., Moscow, Russia. Institute for Energy Problems
QSTAR Operation. May 3, Bob Seward
 QSTAR Operation May 3, 2005 Bob Seward Presentation CD Contents QSTAR Hardware QSTAR Schematic 10-7 torr QSTAR Schematic Chernushevich et al, JMS 2001, 36: 849-865 Curtain Plate ESI Source ESI Source Curtain
The Analysis of Proteomic Spectra from Serum Samples. Keith Baggerly Biostatistics & Applied Mathematics MD Anderson Cancer Center
 The Analysis of Proteomic Spectra from Serum Samples Keith Baggerly Biostatistics & Applied Mathematics MD Anderson Cancer Center PROTEOMICS 1 What Are Proteomic Spectra? DNA makes RNA makes Protein Microarrays
Mass Spectrometry based metabolomics
 Mass Spectrometry based metabolomics Metabolomics- A realm of small molecules (
 a RT:. - 1.1 1 95 9 85 8 27.64 27.87 28.1 27.42 28.24 38.98 Low ph RPLC NL: 2.29E9 TIC MS TrypticBSA_Dig est_replicate1_ 2Mar18_Preci ous_18-1-6 75 7 65 48.75 65.8 Relative Abundance 6 55 5 45 28.54 48.98
AB Sciex QStar XL. AIMS Instrumentation & Sample Report Documentation. chemistry
 Mass Spectrometry Laboratory AIMS Instrumentation & Sample Report Documentation AB Sciex QStar XL chemistry UNIVERSITY OF TORONTO AIMS Mass Spectrometry Laboratory Department of Chemistry, University of
Introduction to Proteomics 1.0
 Introduction to Proteomics 1.0 CMSP Workshop Pratik Jagtap Managing Director, CMSP Objectives Why are we here? For participants: Learn basics of MS-based proteomics Learn what s necessary for success using
Using Software Tools to Improve the Detection of Impurities by LC/MS. Application Note. Christine Miller Agilent Technologies.
 Using Software Tools to Improve the Detection of Impurities Application Note Christine Miller Introduction The analysis of raw materials and finished products for or impurities presents a challenge in
AbsoluteIDQ p150 Kit. Targeted Metabolite Identifi cation and Quantifi cation. Bringing our targeted metabolomics expertise to your lab.
 AbsoluteIDQ p150 Kit Targeted Metabolite Identifi cation and Quantifi cation Bringing our targeted metabolomics expertise to your lab. The Biocrates AbsoluteIDQ p150 mass spectrometry Assay Preparation
Proteins: Proteomics & Protein-Protein Interactions Part I
 Proteins: Proteomics & Protein-Protein Interactions Part I Jesse Rinehart, PhD Department of Cellular & Molecular Physiology Systems Biology Institute DNA RNA PROTEIN DNA RNA PROTEIN Proteins: Proteomics
LOCALISATION, IDENTIFICATION AND SEPARATION OF MOLECULES. Gilles Frache Materials Characterization Day October 14 th 2016
 LOCALISATION, IDENTIFICATION AND SEPARATION OF MOLECULES Gilles Frache Materials Characterization Day October 14 th 2016 1 MOLECULAR ANALYSES Which focus? LOCALIZATION of molecules by Mass Spectrometry
Challenges in Separation Technologies
 Challenges in Separation Technologies Erin Shammel Baker Xing Zhang, Yehia Ibrahim, Matthew Monroe, Dennis Mehinagic, Justin Teeguarden, Thomas Metz and Richard D. Smith Pacific Northwest National Laboratory
LABORATÓRIUMI GYAKORLAT SILLABUSZ SYLLABUS OF A PRACTICAL DEMONSTRATION. financed by the program
 TÁMOP-4.1.1.C-13/1/KONV-2014-0001 projekt Az élettudományi-klinikai felsőoktatás gyakorlatorientált és hallgatóbarát korszerűsítése a vidéki képzőhelyek nemzetközi versenyképességének erősítésére program
MALDI-TOF Mass Spectrometry: A New Rapid ID Method in Clinical Microbiology
 MALDI-TOF Mass Spectrometry: A New Rapid ID Method in Clinical Microbiology Patrick R. Murray, PhD WW Director, Scientific Affairs BD Diagnostic Systems Outline MALDI-TOF is the most important innovation
Monitoring Tumor Therapy
 Monitoring Tumor Therapy Zenalux Biomedical, Inc. The Zenascope was used to monitor the physiological response to a vascular disrupting agent in mouse tumors. Changes in hemoglobin concentration, hemoglobin
Solving practical problems. Maria Kuhtinskaja
 Solving practical problems Maria Kuhtinskaja What does a mass spectrometer do? It measures mass better than any other technique. It can give information about chemical structures. What are mass measurements
Impact of Chromatography on Lipid Profiling of Liver Tissue Extracts
 Impact of Chromatography on Lipid Profiling of Liver Tissue Extracts Application Note Clinical Research Authors Mark Sartain and Theodore Sana Agilent Technologies, Inc. Santa Clara, California, USA Introduction
Topics. Protein Bioinformatics ( ) How a Mass Spectrometers Measure Mass. Lecture 9: Quantitative Proteomics Tuesday, April 27, 2010
 How a Mass Spectrometers Measure Mass. Lecture 9: Quantitative Proteomics Tuesday, April 27, 2010") Protein Bioinformatics (26.655) Lecture 9: Quantitative Proteomics Tuesday, April 27, 21 Robert N. Cole, Ph.D. Mass Spectrometry and Proteomics Facility Johns Hopkins School of Medicine 371 Broadway Research
Protein Bioinformatics (26.655) Lecture 9: Quantitative Proteomics Tuesday, April 27, 21 Robert N. Cole, Ph.D. Mass Spectrometry and Proteomics Facility Johns Hopkins School of Medicine 371 Broadway Research
4-Plex itraq Based Quantitative Proteomic Analysis Using an Agilent Accurate -Mass Q-TOF
 4-Plex itraq Based Quantitative Proteomic Analysis Using an Agilent Accurate -Mass Q-TOF Application Note Authors H. C. Harsha, G. S. S. Kumar, and A. Pandey Institute of Bioinformatics Bangalore India
Biotherapeutics. Biopharmaceutical Sciences Group Waters Corporation Waters Corporation 1
 Characterization of the Higher-Order Structure of Biotherapeutics Biopharmaceutical Sciences Group Waters Corporation 2011 Waters Corporation 1 FDA desire for specific innovations in biotherapeutic analysis
NAS Workshop on the Industrialization of Biology
 High throughput chemical characterization using mass spectrometry NAS Workshop on the Industrialization of Biology Jonathan V. Sweedler University of Illinois Urbana, IL USA May 2014 Funding: DOE, NSF
Phosphorylation of proteins Steve Barnes Feb 19th, 2002 in some cases, proteins are found in a stable, hyperphosphorylated state, e.g.
 Phosphorylation of proteins Steve Barnes Feb 19th, 2002 in some cases, proteins are found in a stable, hyperphosphorylated state, e.g., casein more interestingly, in most other cases, it is a transient
Application Note # MT-111 Concise Interpretation of MALDI Imaging Data by Probabilistic Latent Semantic Analysis (plsa)
") Application Note # MT-111 Concise Interpretation of MALDI Imaging Data by Probabilistic Latent Semantic Analysis (plsa) MALDI imaging datasets can be very information-rich, containing hundreds of mass
Application Note # MT-111 Concise Interpretation of MALDI Imaging Data by Probabilistic Latent Semantic Analysis (plsa) MALDI imaging datasets can be very information-rich, containing hundreds of mass
Benefits and Characteristic Applications of High Resolution GC/MS and LC/MS. Frank David RIC and Ghent University
 Benefits and Characteristic Applications of High Resolution GC/MS and LC/MS. Frank David RIC and Ghent University Mass Spectrometry Structure Elucidation Selective and Sensitive Detection Identification
Sample Preparation is Key
 PLOS ONE DOI: 10.1371/journal.pone.0117232 February 6, 2015 Presented by Katie Gibbs Sample Preparation is Key Sample extraction and instrumental analysis methods are well documented in metabolomics. Understanding
Layered-IHC (L-IHC): A novel and robust approach to multiplexed immunohistochemistry So many markers and so little tissue
: A novel and robust approach to multiplexed immunohistochemistry So many markers and so little tissue") Page 1 The need for multiplex detection of tissue biomarkers. There is a constant and growing demand for increased biomarker analysis in human tissue specimens. Analysis of tissue biomarkers is key to
Page 1 The need for multiplex detection of tissue biomarkers. There is a constant and growing demand for increased biomarker analysis in human tissue specimens. Analysis of tissue biomarkers is key to