The Functional Role of Receptor-Interacting Protein 140 (RIP140) in Innate. Immunity and Metabolic Syndrome A DISSERTATION SUBMITTED TO THE FACULTY OF
|
|
|
- Gyles Shaw
- 6 years ago
- Views:
Transcription
1 The Functional Role of Receptor-Interacting Protein 140 (RIP140) in Innate Immunity and Metabolic Syndrome A DISSERTATION SUBMITTED TO THE FACULTY OF UNIVERSITY OF MINNESOTA BY Yi-Wei Lin IN PARTIAL FULFILLMENT OF THE REQUIREMENTS FOR THE DEGREE OF DOCTOR OF PHILOSOPHY Dr. Li-Na Wei, Advisor DECEMBER 2016
2 Yi-Wei Lin 2016
3 Acknowledgements I would like to thank my thesis advisor, Dr. Li-Na Wei, for offering me such a great opportunity and support to study and research in my Ph.D. life in University of Minnesota. Without her guidance, advice and support, it would be difficult for me to accomplish any work in scientific field. I deeply appreciate what she provides and guides me and that will become a greatly positive impact on my life and career. I also thank my committee members, Dr. Timothy Walseth, Dr. Jennifer Hall, Dr. Frank Burton and and Dr. Jordan Holtzman for their advice and assistance. It is a great experience to have my Ph.D. life in Wei s lab. It s my pleasure to meet all great colleagues and friends here. I would like to thank for friendship and collaboration from all past and current lab members of Wei s group. Without their friendship and collaboration, this work cannot be accomplished. Finally, I would like to thank my parents in Taiwan, my wife Chein-Ju and my lovely kids Ethan and Rayen. I truly thank you for your understanding and support that I can keep persuading my academic achievements. i
4 This thesis is dedicated to my lovely family. Dedication ii
5 Abstract Metabolic diseases, such as type II diabetes (T2DM), atherosclerosis and other cardiovascular diseases, are prevalent and are important health issues in the modern world. T2DM contributes to the development of various metabolic diseases. Atherosclerosis is one of the major causes leading to multiple cardiovascular diseases. In order to develop therapeutic strategies, understanding the mechanisms of these metabolic diseases is crucial. It is known that the immune system is highly involved in initiation and progression of metabolic diseases. Macrophages are one of the major leukocytes in innate immunity. Macrophages have two major polarized phenotypes: classical/pro-inflammatory (M1) and alternative/anti-inflammatory (M2). It is widely accepted that M1-M2 switch in macrophage population is essential in disease progression or damage recovery; however, the detailed mechanism of macrophage phenotype switch has not been fully elucidated. In addition, the effect of altering the macrophage phenotype on treating metabolic diseases remains uncertain. Receptor-interacting protein 140 (RIP140) is a co-regulator of numerous nuclear receptors and transcription factors. RIP140 is expressed in various cell types including adipocytes, liver, muscle, heart, neurons, and cells in the monocyte macrophage lineage. Studies showed that RIP140 expression is positively associated with the progression of metabolic disorders such as obesity, insulin resistance, and glucose intolerance. In addition, studies indicate that RIP140 acts as a co-activator of NFκB to promote macrophage M1 activation and pro-inflammatory responses. My studies further build on iii
6 this knowledge to uncover the role of RIP140 in the metabolic diseases. First, it was found that RIP140 elevates cholesterol content in macrophages by reducing expression of ABC transporters, which are responsible for cholesterol efflux. The elevated cytosolic cholesterol induces foam cell formation and further enhances progression of atherosclerosis. This study indicated that reducing RIP140 levels effectively ameliorates high-cholesterol diet-induced atherosclerosis. Second, my study found that reducing RIP140 in macrophages leads to macrophage M2 polarization, resulting in adipose tissue remodeling to brown/beige adipose tissue. This further ameliorates high fat diet-induced T2DM associated metabolic disorders. Moreover, later studies address how RIP140 mediates macrophage M2 activation and M1/M2 switch by its cytosolic function in a wound healing animal model. Final study is to identify a beneficial taxonomic repertoire from macrophage specific RIP140 knockdown (MφRIP140KD) mice. Fecal microbiota transplantation (FMT) from HFD-fed MφRIP140KD to wild type (WT) mice acquired the benefits from donors, which is resistant to development of HFD-induced metabolic diseases. Taken together, this thesis studies elucidate novel functions of RIP140 in polarization and inflammatory responses in macrophages, and identify the benefits of reducing RIP140 expression in macrophages. These findings contribute to our understanding of the relationship between immune and metabolic systems as well as provide a therapeutic target of resolving inflammation and preventing/improving metabolic profiles in T2DM, and atherosclerosis. iv
7 Table of Contents Page Acknowledgement i Dedication ii Abstract... iii List of Tables viii List of Figures...ix Chapter I Introduction 1-6 l l l Innate immunity activation 2 Inflammation and metabolic diseases.4 Receptor- interacting protein (RIP140).5 Chapter II RIP140 contributes to foam cell formation and atherosclerosis by regulating cholesterol homeostasis in macrophages 7-30 l l l l l Introduction 9 Materials and Methods..11 Results..15 Discussion..20 Figures.23 v
8 Chapter III Reducing RIP140 expression in macrophage facilitates white adipose tissue browning and prevents high fat diet-induced insulin resistance l l l l l Introduction.33 Materials and Methods..36 Results..41 Discussion..48 Figures.52 Chapter IV RIP140 orchestrates the dynamics of macrophage M1/M2 polarization l l l l l Introduction.72 Materials and Methods..74 Results..79 Discussion..85 Figures.89 Chapter V Gut microbiota from metabolic disease-resistant, macrophage-specific RIP140 knockdown mice improves metabolic phenotype and gastrointestinal integrity l l l l l Introduction..108 Materials and Methods 110 Results Discussion Figures..125 vi
9 Summary and future direction.135 Bibliography 139 vii
10 List of Tables Table S5-1 Gut microbiome metagenome prediction.134 viii
11 List of Figures Figure 2-1 RIP140 enhances oxidized LDL-promoted cholesterol accumulation in macrophages..23 Figure 2-2 RIP140 suppresses reverse cholesterol transport in macrophages..25 Figure 2-3 Oxidized LDL modifies RIP140 on lysine acetylation to repress LXR..26 Figure 2-4 RIP140 knockdown in macrophage ameliorates atherosclerosis in ApoE null mice Figure S2-1 RIP140 enhances acetylated LDL-promoted cholesterol accumulation in macrophages..29 Figure S2-2 Knockdown of RIP140 in the macrophage does not alter plasma cholesterol and triglyceride level in either normal or western diet fed mice...30 Figure S2-3 Knockdown of RIP140 represses atherosclerotic plaque formation.30 Figure 3-1 MφRIP140KD mice exhibit improved metabolic phenotypes 52 Figure 3-2 MφRIP140KD mice show browning in vwat..54 Figure 3-3 Induction of browning phenotype in MφRIP140KD produced with BMT.56 Figure 3-4 Decreased total ATM and altered M1/M2 profile in the vwat of MφRIP140KD mice...58 Figure 3-5 Monocyte and macrophage recruitment..59 Figure S3-1 RIP140 expression in macrophages..60 Figure S3-2 MφRIP140KD mice exhibit browning in vwat..62 Figure S3-3 Characterization of iwat and BAT of MφRIP140 KD and WT mice 63 Figure S3-4 Induction of browning phenotype in RIP140 KD produced using BMT..65 ix
12 Figure S3-5 FACS analyses of cell populations in the SVF of WT and KD mice, and under ND and HFD 66 Figure S3-6 The gating strategy of FACS analyses..68 Figure S3-7 The experimental design to detect ATM recruitment in vivo...69 Figure 4-1 ET established by degrading RIP140 facilitates macrophage M2 polarization 89 Figure 4-2 Reducing RIP140 level promotes wound healing by facilitating M1 - M2 switch.91 Figure 4-3 Preventing RIP140 degradation delays wound healing by inhibiting M1-M2 switch.93 Figure 4-4 RIP140 translocates to the cytosol and suppresses M2 marker gene expression via reducing STAT6 phosphorylation 95 Figure 4-5 RIP140 suppresses STAT6 phosphorylation by targeting Calpain 1/2 to activate PTP1B phosphatase..97 Figure S4-1 RIP140 expression in PM transfected with WT or Y3F mutant RIP140 followed by control or LPS stimulation Figure S4-2 Knockdown efficiency 100 Figure S4-3 Altering RIP140 levels affects IL4-induced M2 activation 101 Figure S4-4 In vitro wound healing assay..102 Figure S4-5 Bone marrow transplantation efficiency validation 102 Figure S4-6 Non-degradable mutant RIP140 (RIP140-Y3F) can also translocate to the cytosol in macrophages upon IL-4 treatment x
13 Figure S4-7 Endogenous RIP140 translocates to the cytosol in macrophages upon IL-13 treatment..104 Figure S4-8 RIP140 knockdown still increases pstat6 levels in macrophages treated with kinase inhibitor, but fails to affect PTP1B gene expression 105 Figure 5-1 Macrophage RIP140 level alters the composition and functional repertoire of intestinal microbiota.125 Figure 5-2 FMT transfers gut microbiota from donor to recipient.127 Figure 5-3 Receiving FMT from MφRIP140KD mice ameliorates diet-induced diabetic traits..129 Figure 5-4 Receiving FMT from MφRIP140KD mice improves colon health Figure S5-1 Taxonomic profile of the gut microbiome..132 Figure S5-2 Body weight of mice xi
14 Chapter I Introduction 1
15 Innate immunity activation The immune system, comprised of adaptive and innate immune systems, is the crucial defense mechanism that protects the host against numerous pathogens from viruses to parasites, and toxins that are lethal or cause disease[1]. The adaptive immune system, also known as specific immune system, is composed of two types of adaptive immune responses: humoral immunity, mediated by antibodies produced by B lymphocytes, and cell-mediated immunity, mediated by T lymphocytes[2]. Adaptive immune system provides immunological memory responses after an initial exposure to a specific pathogen. After B and T cell initial activation by a specific pathogen, memory B and T cells develop and respond to repeat specific pathogen exposure throughout one s life. This feature of adaptive immunity allows for a highly specialized, systemic and long lasting protection[3]. The innate immune system, also known as non-specific immune system, is the first line and dominant defense against infection. Unlike the adaptive immune system, the innate immune system creates a rapid, but short lived and non-specific protection to infection[1]. The innate immune system also contributes to activation of adaptive immune system[4]. The major components of innate immune system are anatomical barriers, circulating plasma proteins, and innate leukocytes[5, 6]. Anatomical barriers mainly consist of epithelial surfaces including skin, gastrointestinal and respiratory tracts. Antimicrobial peptides are secreted by these epithelial surfaces, providing chemical protection against infection. Epithelial cell layers provide physical protection. Circulating 2
16 plasma proteins composed of the complement system are primarily synthesized in the liver. These proteins circulate in blood and lymphatic fluid in an inactive form and are rapidly activated upon sensing pathogens. These proteins play an important role in early stages of infection by lysing pathogens and in later stages of infection by recruiting and activating innate leukocytes[7]. Innate leukocytes, including macrophage, neutrophils, eosinophils, basophils, dendritic cells, mast cells, and natural killer (NK) cells, recognize non-self components or injured self-cells by pattern recognition receptors, leading to rapid inflammatory response[8]. As a major component of innate leukocytes, macrophages play an important role in initiating inflammation to protect the host from pathogen infection or tissue damage[9, 10]. Macrophage precursors originate from bone marrow as circulating monocytes before entering tissues and differentiating into tissue-resident macrophages[11]. Tissueresident macrophages such as brain microglia cells, liver Kupffer cells, peritoneal macrophages, adipocyte macrophage, lung alveolar macrophages, bone osteoclast, and so on are involved in maintaining tissue homeostasis and health[12, 13]. Macrophages are highly heterogeneous and exhibit diverse functional phenotypes in response to different environmental cues[11, 14]. Generally, macrophages are polarized into two types of activation, classical/pro-inflammatory activation (M1) and alternative/anti-inflammatory activation (M2)[15, 16]. M1 macrophages are activated by toll-like receptor ligands and interferon-γ. They produce high levels of pro-inflammatory cytokines, such as interleukin-1β (IL-1β), IL-6 and tumor necrosis factor-α (TNF-α), as well as reactive 3
17 nitrogen and oxygen intermediates[17]. M1 macrophages generally possess strong microbicidal and tumoricidal activities and initiate inflammation. M2 macrophages are activated by IL-4 or IL-13 to produce anti-inflammatory cytokines such as IL10, and transforming growth factor-β (TGF-β), arginase 1 and resistin-like molecule-α (RELMα)[18, 19]. They are involved in resolution of inflammation, parasite containment, tissue remodeling and homeostasis. Uncontrolled macrophage polarization is frequently implicated in diseases such as sepsis, autoimmune diseases, metabolic diseases, and cancers [20-23]. Thus, the population of macrophage subtype and their functional properties are crucial to modulate immune responses. Inflammation and metabolic diseases Metabolic syndrome, including obesity, high blood pressure, hyperglycemia, high levels of serum triglyceride level, and low levels of high-density lipoprotein (HDL), presents a serious health condition associated with metabolic diseases such as type 2 diabetes mellitus (T2DM) and cardiovascular diseases[24]. The causes of metabolic diseases are complicated, however, emerging studies show that systemic and local inflammation is implicated in metabolic diseases[25-28]. Metabolic syndrome association with chronic inflammation was first reported in 1901[29]. Moreover, researchers have found that inflammatory cytokines inhibit insulin sensitivity and cause hyperglycemia which lead to deleterious immune responses[13]. These findings indicate that inflammatory responses and the immune system are highly associated with metabolic diseases. Macrophages have been identified to regulate important metabolic activities, 4
18 such as thermoregulation, cholesterol homeostasis and insulin sensitivity, and might be further involved in other metabolic pathologies[30-34]. Based on this information, it is clear that the population of macrophage phenotype plays an important role in metabolic diseases, however it remains unclear how the macrophage population is regulated and how that contribute to metabolic diseases development/progression. Receptor-interacting protein 140 (RIP140) Receptor-interacting protein 140 (RIP140, as known as NRIP1) is highly conserved among vertebrate species including rodent, chicken, zebra fish, and xenopus[35, 36]. RIP140 is expressed in various cell type s including adipocytes, liver, muscle, heart, neurons and cells of the monocyte macrophage lineage[37-39]. RIP140 was initially described as a co-repressor of various transcription factors and nuclear receptors, including ER, PPAR, PLXR, RAR, RXR, TR2, TR4, RelA and so on[40-42]. RIP140 modulates gene transcription mainly through its four repressive domains that interact with histone deacetylases (HDACs), C-terminal binding proteins (CtBPs), DNA modifying enzymes and other chromatin remodeling complexes[43-47]. Whole body RIP140-knockout or RIP140 knockdown transgenic mice exhibit reduced fat content, resistance to diet-induced obesity, infertility in females, cognitive impairment, and emotional regulation disorder[48-50]. These phenotypes demonstrate the importance of RIP140 in lipid and glucose metabolism, ovulation and neuron functions. In addition to the repressive activity, recent studies indicate that RIP140 acts as a co-activator of genes involving in inflammation, ovulation and lipogenesis[51-53]. Several studies have 5
19 demonstrated that post-translational modifications (PTMs) including acetylation, phosphorylation, methylation, sumoylation, pyridoxal 5 -phosphoate conjugation, play a critical role in regulating protein stability, repressive/active activities, interacting partners, and sub-cellular localization of RIP140[37, 42, 45, 54-59]. In addition to regulatory functions in the nucleus, RIP140 was also identified to interact with kinases or enzymes in cytoplasm involved in GLUT4 and adiponectin vehicle transport and lipolysis in adipocytes[60-62], as well as attenuation of ER stress to protect cells from death in neurons[63]. Emerging studies have suggested that RIP140 contributes to M1 inflammatory responses by acting as a co-activator of nuclear factor-κb[64, 65]. Based upon the knowledge of RIP140 functions in macrophage activation, I am interested in understanding the unknown functional role of RIP140 in inflammation related diseases. In my studies, I used multiple diseases models including atherosclerosis, T2DM, and wound healing to address these questions. 6
20 Preface This chapter has been published: Yi-Wei Lin, Pu-Ste Liu, Neeta Adhikari, Jennifer L. Hall, Li-Na Wei (2015) RIP140 contributes to foam cell formation and atherosclerosis by regulating cholesterol homeostasis in macrophages. J Mol Cell Cardiol., 79; PMID: YWL., PSL., and NA designed the experiments, analyzed the data, and performed the experiments. JLH and LNW. designed the experiments, analyzed the data, LNW provided financial support and is the guarantor of this work and, as such, had full access to all the data in the study and takes responsibility for the integrity of the data and the accuracy of the data analysis. 7
21 Chapter II RIP140 contributes to foam cell formation and atherosclerosis by regulating cholesterol homeostasis in macrophages 8
22 Introduction Hallmarks of atherosclerosis are abnormal cholesterol metabolism and inflammation[66]. Macrophages are critically involved in cholesterol metabolism and inflammation in the progression of atherosclerosis [67]. Macrophages scavenge excess peripheral cholesterol by uptake of LDL, and transport intracellular cholesterol to highdensity lipoprotein (HDL), which can be stored or excreted by the liver through reverse cholesterol transport (RCT) [68]. However, when cholesterol levels are pathologically elevated, cholesterol-laden macrophages become inflammatory and turn to active foam cells [67, 69]. Macrophage-derived foam cell formation marks the initiation of atherosclerosis. Cholesterol retention in the macrophage promotes foam cell formation. In macrophages, the ATP-binding membrane cassette transporter A-1 (ABCA1) and ATPbinding membrane cassette transporter G-1 (ABCG1) are the major transporters mediating RCT: ABCA1 regulates RCT to apolipoprotein A-I (ApoAI), and ABCG1 regulates RCT to mature HDL [70]. Receptor Interacting Protein 140 (RIP140) is a protein found in metabolic tissues, such as liver, muscle and adipose tissue [39, 40]. As a versatile co-regulator of various transcription factors, RIP140 regulates metabolism, such as fat accumulation in adipocytes, by affecting the expression of metabolic genes [60, 61, 71, 72]. RIP140 also exerts various regulatory functions through its extensive post-translational modifications, including various forms of phosphorylation, lysine-acetylation, lysine methylation, arginine methylation, vitamin B6 conjugation, and ubiquitination, etc [42, 54, 56-58]. 9
23 RIP140 is also known to be expressed in the monocyte-macrophage lineage and can regulate inflammatory responses [53, 64, 73]. Our recent study indicated that accumulation of intracellular cholesterol in the macrophage elevated RIP140 and that RIP140 expression was sufficient to enhance inflammatory cytokine production and the inflammatory potential of the macrophage [65]. In this study, we provide novel data showing that RIP140 promotes foam cell formation by reducing cholesterol efflux. This process is mediated through the repression of ABCA1 and ABCG1. Further, cholesterol loading stimulates RIP140 s posttranslational modification that enhances its repressive activity. In vitro, augmenting RIP140 levels in the macrophage affects the efficiency of foam cell formation. Our preliminary study indicated that, fed a normal chow, mice with reduced RIP140 expression in macrophages, such as by macrophage specific RIP140 knockdown (MφRIP140KD), exhibited no particular phenotypic changes. However, in ApoE null mice, lowering RIP140 levels specifically in the macrophage reduced the severity of western diet-induced atherosclerosis 10
24 Materials and Methods Animals All studies were approved under University of Minnesota Institutional Animal Care and Use Committee. MφRIP140KD transgenic mice were generated as described before[65], which carry a short hairpin RNA (shrna)-expressing transgene driven by macrophage-specific human CD68 promoter. ApoE null mice were obtained from the Jackson Laboratory. Animals were maintained in the animal facilities in the University of Minnesota. Six-week-old male mice were fed with a western diet (0.2% w/w total cholesterol, #D12079B, Research Diets, NJ, USA) for 16 weeks. Six mice were studied for each group. Cell Culture and Chemicals The mouse macrophage cell line was purchased from American Type Culture Collection. Cells were maintained as described previously. Mouse primary peritoneal macrophage was obtained as described[65]. Briefly, 4% thioglycollate was IP injected into mice. After 4 days, peritoneal macrophages were collected by peritoneal lavage. Cells were incubated with 50ng/ml oxldl or AcLDL (Intra Cel Resource, MD, USA) respectively to induce foam cell formation. GW3965 hydrochloride (G6295, Sigma- Aldrich, MO, USA) at 5 mm was used for LXR agonist treatment [74]. 11
25 Histology Aortic sinus tissues were collected after mice were sacrificed and perfused. Collected aortic sinus tissues were fixed in 4% paraformaldehyde overnight, transferred to 30% sucrose overnight and embedded in O.C.T. compound (Sakura Finetek, UK). Frozen sections were cut at 10 um thickness. Specific antibodies were applied for histological staining by using VECTASTAIN Elite ABC kit (PK-6101, Vector Labs, CA, USA) and DAB substrate kit (SK-4100, Vector Labs, CA, USA) according to manufacturer s instructions. RIP140 (ab42126), a-smooth muscle actin (a-sma, ab5694) and Mac2 (ab2785) antibodies were purchased from Abcam (Cambridge, UK). Sirius Red Staining Tissue sections were air-dried and stained with 0.1% picro-sirius red solution, which was prepared by dissolving 500 mg sirius red (365548, Sigma-Aldrich, MO, USA) in 500 ml saturated picric acid (SP9200, Fisher Scientific, MA, USA), for 1 hour. Slides were washed with acidified water prepared by adding 5 ml acetic acid to 1 L ddh2o, and images were acquired using microscope Zeiss (Axioplan 2 Upright). Oil Red O Staining Fixed cells or tissue sections were air-dried after incubated with 60% isopropanol at room temperature then stained with oil red O (O0625, Sigma-Aldrich, MO, USA) working solution. After 10 minutes staining, samples were washed with ddh2o and images were acquired by microscope (Zeiss Axioplan 2 Upright). Oil red O was eluted by 12
26 100% isopropanol and measured optical density at 500 nm to quantitate staining. Oil red O stock solution was prepared by dissolving 350 mg oil red O in 100 ml isopropanol. Oil red O working solution was prepared by mixing 6 ml oil red O stock solution and 4 ml ddh2o. Aortae from ApoE null or ApoE null/rip140 KD male mice were fixed in 4% formaldehyde. Staining of the aortae was done according to established procedure [75]. After rinsing in water, the aortae were placed in 60% Isopropanol for 2 minutes, followed by staining in 60% Oil Red O in water for 1 h at room temperature. The excess stain was removed by placing the tissues in isopropanol followed by water for a few seconds. For quantification of plaque area, aortae were stained aorta were cut open, pinned down and imaged under a 1X objective on the Zeiss Stereoscope for analysis. The red stained areas representing atherosclerotic plaques were measured using the AxioVision software. Data is represented as percent ratio of total plaque area over total vessel area. Reverse Transcription and Quantitative PCR RNA was isolated and purified by Trizol reagent followed by manufacturer s instruction. Reverse transcription was conducted by using High-Capacity cdna Reverse Transcription Kit containing RNase Inhibitor (Applied Biosystems). Quantitative PCR (qpcr) was carried out as described previously[65]. Primer information is available upon request. Each expression analysis was performed triplicate and normalized to b-actin. 13
27 Cholesterol Fluorometric and Triglyceride Colorimetric Assay Cholesterol fluorometric assay and triglyceride colorimetric assay were performed using a commercial available assay kits according to the manufacturer s instruction ( and , Cayman, MI, USA). Plasma were isolated by using EDTAcoated micro-container (365974, BD, NJ, USA). Intracellular cholesterol concentration was normalized to protein concentration. Cholesterol Efflux Assay Cholesterol efflux assay was followed and modified by established procedure[76]. Briefly, cells were incubated with 50ng/ml AcLDL and 10 m ci of H3-cholesterol (NET139001MC, Perkin Elmer, MA, USA) overnight to induce foam cell formation. Cells were then incubated with Apo A-I (SRP4693, Sigma-Aldrich, MO, USA) or HDL (L8039, Sigma-Aldrich, MO, USA) in DMEM medium with 0.2% cholesterol free BSA for 6 hours. Culture medium were collected after rpm to remove cells. Cells were lysed by 0.1N NaOH. Radioactivity in medium and cells was measured by scintillation counter. Cholesterol efflux rate was calculated as (medium cpm)/(medium + cell cpm) x 100%. Western Blotting Protein isolation and Western blotting were performed as described before[61]. Antibodies purchased from Abcam (Cambridge, UK) are: RIP140 (ab42126), ABCA1 (ab18180), ABCG1 (ab52617). Antibodies purchased from Santa Cruz Biotechnology 14
28 (TX, USA) are: b-actin (SC-47778), ERK1 (SC-93), ERK2 (SC-153). Antibodies obtained from Cell Signaling Technology (MA, USA) is phospho-erk1/2 (9101). Chromatin Immunoprecipitation Assay Chromatin immunoprecipitation (ChIP) assay was performed as described[77] using the RIP140 antibody (ab42126, Abcam, Cambridge, UK). Primers for LXR-binding promoter regions of ABCA1 and ABCG1 in qpcr were: 5 - GGGGAAAGAGGGAGAGAACAG-3 /5 - GAATTACTGGTTTTTGCCGC-3 (for ABCA1) and 5 - TGCCCTGTAGTAACCTCTGTA-3 /5 - TCATGTGCGACTCCTCCCA-3 (ABCG1) [78]. Statistical Analysis Experiments were carried out at least twice and results were presented as means ± SD. Comparisons between groups were made by unpaired two-tailed Student s t-tests, or 1-way and 2-way ANOVA. P values of 0.05 were considered statistically significant. Results RIP140 promotes modified LDL induced macrophage foam cell formation To examine the effects of RIP140 on macrophage-derived foam cell formation, we altered the expression level of RIP140 in primary peritoneal macrophage by infection with lentivirus encoding RIP140 expression vector or RIP140-specific shrna. Two modified forms of LDL, oxidized LDL (oxldl) and acetylated-ldl (AcLDL), were 15
29 applied to cells to induce foam cell formation. Using oil red O staining to detect foam cell formation, we found that macrophages with elevated RIP140 levels were more susceptible to modified LDL-induced foam cell formation (Fig. 2-1A upper panel, S2-1A), while macrophages with lowered RIP140 levels were more resistant to this induction (Fig. 2-1B upper panel, S2-1B). Quantification of intracellular total cholesterol (TC), free cholesterol (FC) and esterified cholesterol (CE) further validates our finding (Fig. 2-1A lower panel, 2-1B lower panel). Data from the macrophage cell line Raw showed consistent results (data not shown). RIP140 suppresses reverse cholesterol transport (RCT) by repressing the expression of ABC transporters ABC transporters mediated active RCT is critical to the removal of accumulated cholesterol from macrophages. To determine how RIP140 regulated LDL-induced macrophage-derived foam cell formation, we examined the expression of ABCA1 and ABCG1. The data show that elevating RIP140 repressed ABCA1 and ABCG1 expression (Fig. 2-2A), whereas lowering RIP140 enhanced ABCA1 and ABCG1 expression (Fig. 2-2B). We further validated whether RIP140 altered the function of ABCA1 and ABCG1 in mice by employing transgenic murine lines with macrophage specific RIP140 knockdown (MφRIP140KD)[65]. Peritoneal macrophages were isolated from wild type and MφRIP140KD mice, and cholesterol efflux functional assays were performed. Figure 2-2C shows that MφRIP140KD macrophages exhibited an increased cholesterol efflux rate to Apo A-I, which indicates the function of ABCA1, and an increased cholesterol 16
30 efflux rates to HDL, which indicates the function of ABCG1. In sum, specific knockdown of RIP140 in primary macrophages increases cholesterol efflux, while increasing RIP140 expression in primary macrophages decreases cholesterol efflux. Oxidized LDL modifies RIP140 on lysine acetylation to repress LXR and suppress the expression of ABCA1 and ABCG1 Various post-translational modifications on RIP140 regulate its versatile functions. We previously reported that extracellular-signal-related kinase 2 (ERK2) activation stimulates its Tyr204 phosphorylation, leads to its lysine acetylation and enhances its gene repressive activity[56]. We thus examined whether RIP140 could be posttranslationally modified by modified forms of LDL. The data show that oxldl indeed enhanced lysine acetylation on RIP140 and promoted its HDAC3 recruitment a hallmark of its gene repressive activity (Fig. 2-3A). We further employed RIP140 K158/287Q mutant (mimicking its constitutive lysine acetylation, CP) and K158/287A mutant (mimicking a lack of lysine acetylation, CN) in Raw cells to determine the effects of these post-translational modifications on RIP140 function[56]. It appears that cells with RIP140 CP mutant expressed less ABCA1 and ABCG1 (Fig. 2-3B), indicating that lysine acetylated RIP140 possesses more repressive activity on ABCA1 and ABCG1 genes. Liver X receptor (LXR) is a key transcriptional factor to regulate ABCA1 and ABCG1 expression, and RIP140 can be a co-regulator for LXR[79]. We employed ChIP to examine the occupancy of RIP140 on these gene regulatory regions. The data show that oxldl indeed enhanced the binding of RIP140 to LXR response element on the 17
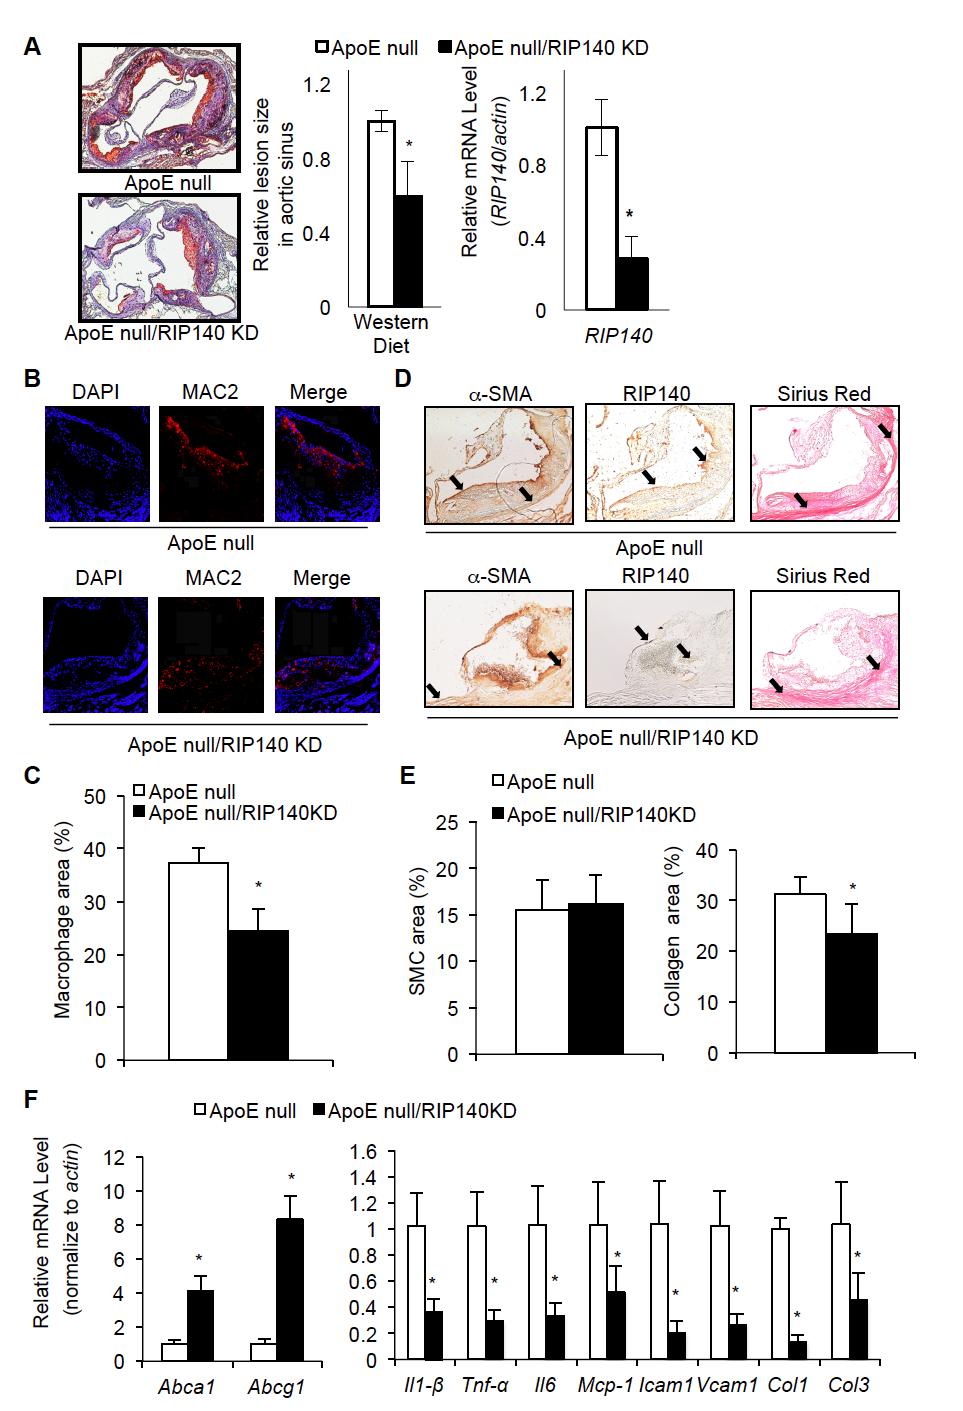
31 promoter of ABCA1 and ABCG1 (Fig. 2-3C). To further validate RIP140 indeed acted to suppress LXR activation of ABCA1 and ABCG1 expression, we tested the effects of LXR agonist, GW3965 hydrochloride. As shown in Fig. 2-3D, LXR agonist activated the expression of ABCA1 and ABCG1, but both their basal and induced expression levels were dramatically reduced when RIP140 level was elevated by over-expression. All together, these results validate that lysine acetylated RIP140 represses the expression of ABCA1 and ABCG1 via co-regulating (co-repressing) LXR on the promoters of these genes. Specific RIP140 knockdown in the macrophage attenuates western diet-induced atherosclerosis To assess the function of RIP140 in diseases where foam cells play a key role, we employed a well-established atherosclerosis animal model, ApoE null mice[80]. We crossed the MφRIP140KD mice, where RIP140 in the macrophage populations was specifically silenced, with the ApoE null mice to generate macrophage RIP140 knockdown in the ApoE null background (ApoE null/rip140kd). Right panel of Fig. 2-4A shows that the macrophage RIP140 expression level in these ApoE null/rip140kd mice was reduced as compared to the control ApoE null mice. The ApoE null and ApoE null/rip140kd mice were fed with a western diet for 16 weeks to induce atherosclerosis. The body weight and plasma concentrations of triglyceride (TG) and cholesterol after normal diet feeding or western diet feeding were not affected by RIP140 knockdown in the macrophage (Figure S2-2), therefore we only focus on phenotype of animals with 18
32 western diet feeding. However, the lesion size in the aortic sinus of ApoE null/rip140kd mice was reduced as compared to the ApoE null mice (p < 0.05) (Fig. 2-4A, left and middle panel, Fig. S2-3). In addition, plaque composition was analyzed in histological staining for major constituents of atherosclerotic plaques: α-smooth muscle actin (α-sma) for smooth muscle cells (SMC), MAC2 for macrophages, and sirius red for collagen (Fig. 2-4B-E). The expression of RIP140 was monitored in the plaque areas (Fig. 2-4D). Quantification of staining indicates that fewer macrophages and fewer collagens were found in the plaque areas of aortic sinus of ApoE null/rip140kd mice, but no apparent change was detected for SMC (Fig. 2-4B-E). As compared to the ApoE null mice, the ApoE null/rip140kd mice expressed significantly lower levels of proinflammatory markers [tumor necrosis factor-α (Tnf-α), interleukin 1-β (Il1-β), interleukin 6 (Il6) and Monocyte Chemoattractant Protein-1 (Mcp-1)] in the aortic root (Fig. 2-4F). Furthermore, ApoE null/rip140kd mice expressed significantly lower levels of endothelial adhesion molecules [intracellular adhesion molecule 1 (Icam1) and vascular cell adhesion molecule 1 (Vcam1)], as well as extracellular matrix [collagen 1 (Col1) and collagen 3 (Col3)] in the aortic root (Fig. 2-4F). Taken together, these data support that reducing RIP140 levels in the macrophage can significantly inhibit the progression of atherosclerosis. 19
33 Discussion Cholesterol imbalance, especially in the macrophage, is a major culprit triggering atherosclerosis. Macrophages can engulf excess cholesterol via specific receptors and also exert reverse cholesterol transport to expel cholesterol[81, 82]. It has been suggested that reducing cholesterol retention in the macrophage can ameliorate atherosclerosis. The current study provides a proof of concept in animal models of atherosclerosis and identifies a new target, RIP140, for augmenting this disease. The study also determines the mechanism that RIP140 represses the expression of ABCA1 and ABCG1 to reduce RCT and that cholesterol can alter RIP140 s post-translational modification that further escalates its RCT-repressing effects. This current study also shows that reduction in macrophage s RIP140 level lowers the expression levels of pro-inflammatory cytokines. This is in line with our previous report that RIP140 activates pro-inflammatory cytokine production by serving as a coactivator of NF-κB [65]. Thus, lowering the level of RIP140 in the macrophage can reduce macrophage-derived foam cell formation and contribute to reduced inflammation, ultimately this helps to ameliorate atherosclerosis and dampen monocyte/macrophage accumulation in the plaque. Given that RIP140 affects steroid receptor inhibition, it would be interesting to see whether macrophage specific reduction in RIP140 level would similarly reduce foam cell formation and inflammation in female animals. Studies have indicated that LDL triggers p42/44 MAPK (ERK1/2) activation[83, 84]. We previously reported that activated ERK1/2 stimulates RIP140 20
34 phosphorylation[56]. This current study shows that oxldl activates ERK1/2, which can stimulate RIP140 s phosphorylation and subsequently induce its lysine-acetylation to enhance its transcriptional co-repressive activity, which is in line with previous observations, and validates that fat contents in the cell can affect RIP140 s biological activity. In the macrophage, RIP140 functions to repress the expression of ABCA1 and ABCG1 by co-repressing LXR-target genes such as ABCA1 and ABCG1. Thus, lowering RIP140 levels or altering RIP140 modification, such as blocking its phosphorylation or lysine-acetylation, can reduce its repressive effects on ABCA1 and ABCG1, and can be beneficial. In vivo animal study provides strong evidence that reducing RIP140 levels in the macrophage could be a therapeutic strategy for atherosclerosis. We previously reported that MiR-33 targets RIP140 s 3 UTR to repress its expression[73]. Other studies showed that MiR-33 also reduces the expression of ABCA1 and ABCG1[85, 86]. It has also been shown that Mir-33 deficiency raised HDL to increase cholesterol efflux[87]. Thus, while MiR-33 can effectively reduce RIP140 levels, it may not be a therapeutically viable strategy in the case of atherosclerosis because of its broad effects. Currently, there is no specific compound that can directly repress RIP140 levels or augment its post-translational modifications. Further worthy studies are needed such as to screen for compounds that can specifically target RIP140 to reduce its expression level or to augment its post-translational modifications. Furthermore, RIP140 21
35 can also serve as a disease maker, such as in assessing the risk or progression of atherosclerosis. 22

36 Figures 23
37 Fig. 2-1 RIP140 enhances oxidized LDL-promoted cholesterol accumulation in macrophages. (A) Upper panel: intracellular cholesterol accumulation was assessed by oil red O staining in primary peritoneal macrophages overexpressing RIP140. Lower panel: Quantification of TC, FC and CE. (B) Upper panel: intracellular cholesterol accumulation was assessed by oil red O staining in primary peritoneal macrophages with knockdown of RIP140. Lower panel: Quantification of TC, FC and CE. Data were presented as fold change. The concentration from the control group was arbitrarily set as 1, *P<0.05. Experiments were performed for three times. 24
38 Fig. 2-2 RIP140 suppresses reverse cholesterol transport in macrophages. (A) ABCA1 and ABCG1 protein and mrna levels of primary peritoneal macrophages with overexpression of RIP140. (B) ABCA1 and ABCG1 protein and mrna levels of primary peritoneal macrophages with knockdown of RIP140. (C) Macrophages from MφRIP140KD mice exported more cholesterol to ApoA-I, via ABCA1, and HDL, via ABCG1. Data were presented as mean±sd, *P<0.05. Experiments were performed three times. 25
 The effect of RIP140 mutants on ABCA1 and ABCG1 expression.")
39 Fig. 2-3 Oxidized LDL modifies RIP140 on lysine acetylation to repress LXR. (A) Activation of ERK1/2, and lysine-acetylation of RIP140 and its interaction with HDAC. OxLDL induced ERK1/2 activation to promote lysine-acetylation on RIP140 and its interaction with HDAC3. (B) The effect of RIP140 mutants on ABCA1 and ABCG1 expression. CP, RIP140 mutant mimicking constitutive lysine-acetylation; CN, RIP140 negative mutation for lysine-acetylation; EV, control vehicle only. (C) CHIP assay. Binding of RIP140 to LXR response element on ABCA1 and ABCG1 promoter area was enhanced by oxldl treatment. (D) Effects of LXR agonist on mrna levels of ABCA1 and ABCG1 in Raw macrophages overexpressing RIP140. Data were presented as mean±sd, *P<0.05. Experiments were performed three times. 26
40 27
41 Fig. 2-4 RIP140 knockdown in macrophage ameliorates atherosclerosis in ApoE null mice. (A) Oil red O staining of aortic sinus (left panel) and quantitative relative lesion size (middle panel) after 16 weeks western diet feeding. Average lesion size of ApoE null mice was set as 1. Relative macrophagic RIP140 mrna expression level is shown on the right panel. (B) Mac2 staining of plaques in aorta sinus area. (C) Quantification of macrophage infiltration areas. (D) α-sma (a-smooth muscle actin), RIP140 and sirius red staining of plaques in aorta sinus areas. (E) Quantification of SMC (smooth muscle cells) and collagen areas. (F) mrna levels of Tnf-α, Il1-β, Il6, MCP-1, Icam1, Vcam1, Col1 and Col3 in aortic root. Data show results from ApoE null mice crossed with MφRIP140KD mice. Experiments were performed two times. 28
 Intracellular cholesterol accumulation was assessed by oil red O staining, presented by image and quantification, in primary peritoneal macrophages overexpressing RIP140.")
42 Fig. S2-1 RIP140 enhances acetylated LDL-promoted cholesterol accumulation in macrophages. (A) Intracellular cholesterol accumulation was assessed by oil red O staining, presented by image and quantification, in primary peritoneal macrophages overexpressing RIP140. (B) Intracellular cholesterol accumulation was assessed by oil red O staining, presented by image and quantification, in primary peritoneal macrophages with knockdown of RIP140. Data were presented as fold change by mean±sd, and the concentration from the control group was set as 1, *P<0.05. Experiments were performed three times. 29
 and triglyceride (right panel) concentration in plasma of mice with normal diet or western diet feeding. Fig.")
43 Fig. S2-2 Knockdown of RIP140 in the macrophage does not alter plasma cholesterol and triglyceride level in either normal or western diet fed mice. Cholesterol (left panel) and triglyceride (right panel) concentration in plasma of mice with normal diet or western diet feeding. Fig. S2-3 Knockdown of RIP140 represses atherosclerotic plaque formation. Right panel: representative oil red o staining in aortae. Left panel: quantification of en face oil red o staining in aorta. Data were presented in ratio of plaque area to total area, as mean±sd. 30
44 Preface This chapter has been published: Pu-Ste Liu*, Yi-Wei Lin*, Bomi Lee, Sherlly K. McCrady-Spitzer, James A. Levine, and Li-Na Wei (2014) Reducing RIP140 expression in macrophage alters ATM infiltration, facilitates white adipose tissue browning, and prevents high-fat diet-induced insulin resistance. Diabetes, 63(12); PMID: * These authors contributed equally to this work PSL. and YWL. designed the experiments, analyzed the data, and performed the experiments. BL, SKM.-S., and JAL. performed the experiments. LNW. designed the experiments, analyzed the data, and provided financial support. LNW is the guarantor of this work and, as such, had full access to all the data in the study and takes responsibility for the integrity of the data and the accuracy of the data analysis. 31
45 Chapter III Reducing RIP140 expression in macrophage facilitates white adipose tissue browning and prevents high fat diet-induced insulin resistance 32
46 Introduction Macrophages are found in all tissues and, when activated by various signals, mainly function in innate immunity such as to regulate inflammatory responses. Functionally, macrophages are binarily classified into classically activated (M1) and alternatively activated (M2) states[14]. Molecular determinants for certain specific macrophage phenotypes have been investigated[15, 16], and different tissue macrophages have diverse gene expression and transcriptional profiles[88]. In the white adipose tissue (WAT), both the number and state of activation of adipose tissue macrophages (ATMs) can be altered by various factors and usually reflect the WAT s metabolic state[89]. For instance, in a high-fat diet (HFD)-induced obesity model, ATM populations dramatically expand from a healthy 10 15% of stromal cells (mostly in the M2 state that is suggested to maintain the homeostasis and insulin sensitivity of the adipose tissue) to a 45 60% representation (mostly due to increased infiltration/recruitment of inflammatory monocytes that turn into M1 macrophages)[19]. This indicates a state of chronic lowgrade inflammation of the WAT. Concurrently, WAT enlarges and remodels to accommodate the demand in fat storage, and the substances released from these enlarged white adipocytes, especially fatty acids, further worsen the degree of inflammation, resulting in a vicious cycle of chronic inflammation in the WAT and leading to insulin resistance (IR)[25, 26]. 33
47 M2 ATMs predominate in lean mice, and obesity induces the accumulation of M1 ATMs, leading to a pro-inflammatory state[90]. Recent studies have indicated that certain populations of circulating monocytes may be more susceptible to recruitment to AT[14]. In addition, other AT-derived molecules, such as chemokines and inflammatory mediators, have also been evaluated for their roles in recruiting and activating these monocytes/atms[91]. The mechanism behind the shift in ATM phenotypes may be related to changes in circulating monocyte populations and/or differential recruitment of various monocyte subtypes to AT. In mice, CCR2 + Ly6C + monocytes are preferentially recruited to the sites of tissue inflammation and precursors of classically activated M1 macrophages. In contrast, CCR2 - Ly6C - monocytes appear to be regulated by different stimuli and may play a role in patrolling non-inflamed tissues and give rise to resident tissue macrophages[11, 92]. Importantly, monocytes are generally expanded with the progression of obesity, suggesting that these monocytes may present inflammatory mediators of obesity-induced inflammation. Which monocyte population traffics to AT in HFD-induced obesity is not well defined[93]. Receptor interacting protein 140 (RIP140; also known as Nrip1) is a widespectrum transcription coregulator[36, 38] and highly expressed in various cell types, including adipocytes[37], neurons, and cells in the monocyte macrophage lineage[73]. In differentiating adipocytes, RIP140 functions as a corepressor for heterochromatinization of gene loci that are to be silenced in mature adipocytes[94]; in fully expanded adipocytes, RIP140 undergoes sequential posttranslational modifications and translocates to the 34
48 cytoplasm to participate in cytosolic events such as GLUT4 vesicle transport, adiponectin vesicle transport, and lipolysis[60, 61]. A recent study[95] indicated that knockout of RIP140 in mice caused browning within white fat depots. RIP140 blocked the browning program through repression of the expression of brown AT (BAT) and beige genes and a triacylglycerol futile cycle in WAT. In M1 macrophages, RIP140 contributes to their inflammatory response by acting as a coactivator of nuclear factor-κb and regulates endotoxin tolerance[64, 65]. We also found that an HFD elevates RIP140 expression in peritoneal macrophages (PMs), which activates tumor necrosis factor-α and interleukin (IL)-1β expression and enhances macrophages inflammatory potential, thereby contributing to increased susceptibility to septic shock[73]. However, whether RIP140 plays a functional role in monocytes and ATMs in obesity is unknown. In order to examine whether RIP140 is involved in ATM homeostasis, we generated transgenic mice with RIP140 knockdown (KD) in monocytes/macrophages, as well as using bone marrow transplantation (BMT) procedures. We detected a browning phenotype in AT of these mice in which RIP140 was reduced only in monocytes/macrophages. This phenotype was associated with increased thermogenesis and energy expenditure, as well as improved insulin sensitivity particularly under HFD. This was also correlated with reduced M1 circulating monocytes and their recruitment into WAT of these animals. 35
49 Materials and Methods Animal All studies were carried out using male C57Bl/6 mice from The Jackson Laboratory and maintained in the animal facility of University of Minnesota and approved by the University of Minnesota Institutional Animal Care and Use Committee. MφRIP140KD mice were generated as previously described. Mice were fed a normal diet (ND) containing 18% calories from fat and undetectable cholesterol (2018; Harlan Teklad, Madison, WI) or an HFD containing 60% calories from fat and 345 mg cholesterol/kg (F3282; Bio-Serv, West Chester, PA). Glucose Tolerance and Insulin Tolerance Tests Glucose tolerance test (GTT) or insulin tolerance test (ITT) was performed after overnight fasting. After baseline blood collection, mice were i.p. injected with D-glucose (2 g/kg) or insulin (0.75 units/kg). Blood glucose levels at indicated time points were measured with a standard glucometer. Metabolic Measurement Indirect calorimetry was performed at 12 weeks of age (n = 6 mice/group) to measure oxygen consumption (vo 2 ). Animals were trained to habituate metabolic cages 3 days before measurement and maintained in a 12-h light/dark cycle in individual chambers with free access to chow and water. vo 2 measurement was recorded every 4 36
50 min for 2 days and normalized to body mass using Oxymax (Columbus Instrument, Columbus, OH). Food intake was monitored by weighing food hoppers. Insulin Signaling Mice were fed an HFD for 15 weeks and overnight fasted the night before. Mice were intraperitoneally administered with/without insulin. Ten minutes later, visceral WAT (vwat) was collected for extracting protein. PM Isolation Mice were i.p. injected with 4% thioglycollate and killed 4 days later. PMs were collected by peritoneal lavage with 10 ml 13 PBS and plated with DMEM plus 10% FBS. Nonadherent cells were removed 24 h later. Adherent cells were 90% macrophages. Conditioned Medium of BM-Derived Macrophage Cells BM-derived macrophage (BMDM) cells were harvested from femurs and tibias of 8-week-old mice and plated at cells/plate in DMEM plus 10 mg/ml macrophage colony-stimulating factor plus 10% FBS for 8 days differentiation prior to use. Differentiated BMDMs were switched to 10% FBS-containing medium and stimulated with IL-4 for 12 h. IL-4 medium is then removed, and BMDM cells continue to be cultured for 12 h for the collection of conditioned medium (CM). 37
51 BMT BM cells were labeled with PKH26 (Red Fluorescent Cell Linker Mini Kit; Sigma-Aldrich) in vitro and retroorbitally injected into lethally irradiated recipient WT mice with a dose of 10 7 cells. Recipient mice were allowed 4 to 5 weeks to reconstitute their hematopoietic systems with wild-type (WT) or MφRIP140KD BM cells. PKH26 expression in BM cells of the recipient mice was monitored to determine BMT efficiency. Plasma Measurements Blood was collected at the time of sacrifice, and fasting plasma insulin level in mice unfed for 16 h was measured using an insulin ELISA kit (catalog number EZRMI- 13K; Millipore). Plasma adiponectin levels were measured using an adiponectin ELISA kit (catalog number EZMADP-60K; Millipore). Total cholesterol levels were determined using a cholesterol assay kit ( ; Cayman Chemical Company). Serum triglycerides and free fatty acids were measured using an L-type TG H kit and NEFA C kit (Wako Chemicals). Isolating Stromal Vascular Fraction of WAT WAT was minced and digested with type II collagenase (Sigma-Aldrich), filtered through a 100-mm nylon sieve, and centrifuged at 500 g to separate floating adipocytes from the stromal vascular fraction (SVF) pellet. SVF was treated with an RBC lysis buffer (Sigma-Aldrich). 38
52 In Vitro Adipocyte Differentiation SVF was isolated and differentiated for 8 days as following: preadipocytes were isolated and cultured in medium containing 10% FBS, 0.5 mmol/l isobutylmethylxanthine, mmol/l indomethacin, 1 mmol/l dexamethasone, 850 nmol/l insulin, 1 nmol/l T3, and 1 mmol/l rosiglitazone for 2 days. Cells were switched to a maintenance medium containing 10% FBS, 850 nmol insulin, and 1 nmol/l T3 for 6 days. Control- or MφRIP140KD BMDM-CM was added on day 2 in adipocyte differentiation for a total of 6 days. Following adipocyte differentiation, on day 8, cells were incubated with 10 mmol/l isoproterenol for 4 h for stimulate thermogenesis. Reagents Anti-phosphorylated insulin receptor substrate-1 (IRS-1; Ser307), anti-akt, anti phosphorylated Akt (Ser473), anti βactin (Santa Cruz Biotechnology), and anti IRS-1 (Upstate Biotechnology) were used in Western blotting. Rabbit anti-cd137 (Abcam), rabbit anti-tmem26 (Imgenex), rabbit anti UCP-1 (Abcam), and rat anti-perilipin A (Abcam) were used for immunofluorescence. RNA Isolation and Gene Expression Analyses Total RNA was isolated using TRIzol (Invitrogen). Reverse transcription of 2 mg RNA was performed with a High-Capacity cdna Reverse Transcription Kit containing RNase Inhibitor (Applied Biosystems). Quantitative real-time PCR (qpcr) was 39
53 performed as described previously. Each gene-expression experiment was performed in triplicate. Primer sequence is available upon request. Mitochondrial DNA Content Genomic DNA was isolated from vwat using the DNeasy Blood & Tissue Kit (Qiagen), and mitochondrial DNA (mtdna) copy numbers were determined by qpcr using primers specific for mtdna-encoded genes (CytB) and nuclear-encoded genes (H19). Relative mtdna were measured and calculated by normalizing CytB expression level to H19 level. Immunohistochemistry Tissues samples were fixed, embedded in paraffin, and sectioned. A morphometric study was performed in vwat sections stained with hematoxylin and eosin. Flow Cytometry Cell-surface antigens were blocked with Fc Block (20 mg/ml; BD Biosciences) and stained with fluorophoreconjugated antibodies or isotype control antibodies for 1 h. Fluorophore-conjugated primary antibodies used in these studies are F4/80-FITC, CD11c-phycoerythrin, and CD206 Alexa Fluor 647 (ebioscience); CD45-phycoerythrin (BD Biosciences), CD19-FITC (BD Biosciences), CD4-PerCP (ebioscience), CD3e- FITC (ebioscience), CD115 Alexa Fluor 488 (BD Biosciences), and Ly6G Alexa Fluor 40
54 647 (BD Biosciences). After incubation with antibodies, cells were washed and centrifuged at 500 g for 5 min, resuspended in 1 ml washing buffer, and analyzed on an FACSCalibur using FlowJo software. Statistical Analysis Experiments were performed at least twice, and results were presented as means±sd. Comparisons between groups were made by unpaired two-tailed Student t tests or one-way and two-way ANOVA. P values of #0.05 were considered statistically significant (*P, 0.05; **P, 0.01; ***P, 0.001). Results RIP140 Expression in ATM Is Elevated by HFD Feeding, and Lowering RIP140 Expression in Monocytes/Macrophages Improves HFD-Induced IR To first examine the effects of HFD on the expression of RIP140 in macrophages, particularly ATMs, we collected ATMs from mice fed an ND or HFD for 3 or 15 weeks and determined RIP140 mrna levels. As shown in Supplementary Fig. 3-1A, the RIP140 mrna level in ATM is significantly elevated in the HFD-fed mice as compared with the ND-fed mice. To validate the functional role of RIP140 in monocytes/macrophage in vivo, we used a monocyte/macrophage-specific promoter, CD68[96], to express RIP140-specific inhibitory short hairpin RNAs[65] that mimic endogenous micrornas to generate monocyte/macrophage-specific KD of RIP140 in transgenic mice (MφRIP140KD). We systemically analyzed two MφRIP140KD mouse 41
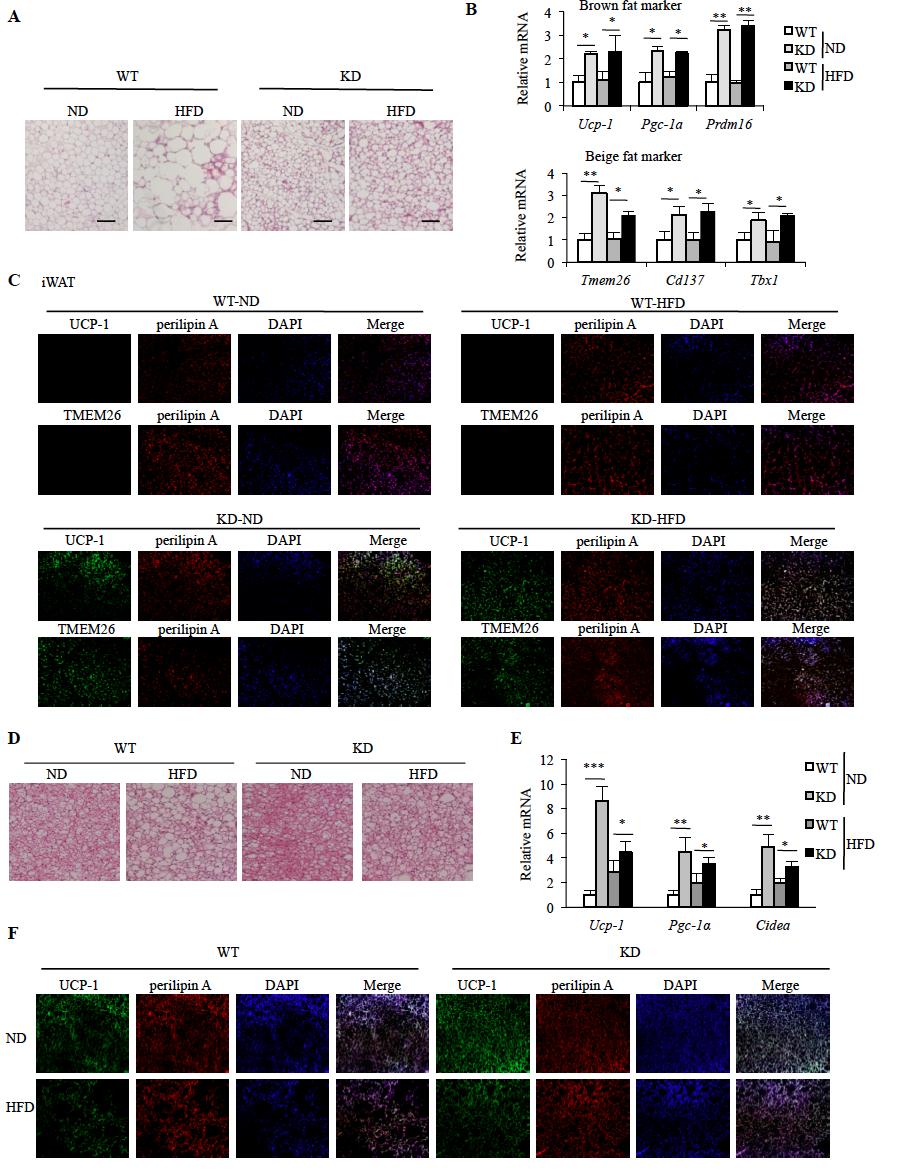
55 lines (KD-1 and -2) for which issue-specific KD efficiency was similar in PMs, BMDMs, and ATMs (Fig. S3-1B). Both lines also exhibited similar metabolic features. MφRIP140KD mice are healthy and fertile, resist HFD-induced weight gain and systemic IR (Fig. 3-1A and B), and have superior metabolic profiles in such parameters as fasting glucose level, fasting insulin level, serum adiponectin, cholesterol levels, free fatty acid, and triglycerides (Fig. 3-1C). Consistently, in vwat, proinflammatory adipokine mrna levels are significantly lower, while adiponectin mrna levels are much higher for the MφRIP140KD mice (Fig. 3-1D). Also, the typical suppression (under HFD) of insulinstimulated Akt-IRS activation in vwat is abolished in the MφRIP140KD mice (Fig. 3-1E). According to these metabolic measures, we conclude that MφRIP140KD mice are healthy and resist HFD-induced systemic IR and adipose inflammation. Enhanced vwat Browning in HFD-Fed MφRIP140KD Mice We conducted gross anatomical examination and found that typical expansion of WAT depots after a HFD feeding was reduced in MφRIP140KD mice for both inguinal WAT (iwat) and vwat (Fig. 3-2A). HFD-induced liver weight gain was also reduced in MφRIP140KD mice (data not shown). Interestingly, there was no apparent difference in other organs including interscapular BAT, muscle, and bone (not shown). Because the most profound change was detected in WAT depots, we then focused our attention to characterize vwat and iwat. It appears that the vwat of MφRIP140KD mice has multilocular fat cells and shows no adipocyte enlargement even after 15 weeks of HFD feeding (Fig. 3-2B). Consistently, markers of brown fat (UCP-1) and beige fat (TMEM26 42
56 and CD137) are evident in the vwat sections of MφRIP140KD mice even after HFD feeding (Fig. S3-2A); furthermore, mrna levels of brown adipogenic markers (Pgc-1α, Ucp-1, and Prdm16)[97] and beige fat markers (Tmem26, Cd137, and Tbx 1)[98] are elevated in MφRIP140KD mice, and their vwat contains significantly more mitochondria, consistent with increased mitochondrial activity markers (Fig. 3-2C and D). UCP-1 protein level is also elevated in vwat of MφRIP140KD mice as compared with WT mice (Fig. S3-2B). Interestingly, the expression of estrogen-related receptor g, but not estrogen-related receptor a, is increased in the MφRIP140KD mice (data not shown). As in vwat, iwat of MφRIP140KD mice readily harvests multilocular fat cells (Fig. S3-3A) and expresses higher levels of brown fat (Ucp-1, Pgc-1α, and Prdm16) and beige fat (Tmem26, Cd137, and Tbx1) markers under an ND (Fig. S3-3B and C). But unlike vwat, iwat has no further increase in browning under HFD. While UCP-1 expression is readily high in the BAT of both WT and MφRIP140KD mice under ND, there is no further increase in browning in the BAT of MφRIP140KD mice under HFD (Fig. S3-3D F). These data show that the most dramatic change in MφRIP140KD mice is the browning of vwat, particularly after an HFD feeding. We further examined whether CM of RIP140 KD macrophages could directly cause WAT browning. We collected WT and RIP140 KD macrophage CM to culture preadipocytes collected from vwat depots of WT mice for in vitro adipocyte differentiation. As shown in Fig. 3-2E, RIP140 KD macrophage CM indeed enhances all the markers tested that are indicative of browning, such as Ucp-1, Pgc-1α, Cidea, Dio, Acsl, and Acoxl. It has been reported that cold stress or IL-4 induction can enhance M2 macrophage polarization to produce catecholamines in 43
57 BAT and WAT[30]. We found that MφRIP140KD ATM expresses higher levels of tyrosine hydroxylase (TH), the rate-limiting enzyme in catecholamine synthesis (Fig. 3-2F, left panel), and that RIP140 KD also enhances TH mrna level in macrophage stimulated with IL4 (Fig. 3-2F, right panel). We then investigated whether RIP140 KD mice would alter their energy expenditure. As shown in Fig. 3-2G, HFD-fed MφRIP140KD mice indeed have a higher level of energy expenditure (vo 2 consumption) in both the dark and light phases. As shown in Fig. 3-2H, food uptake is not significantly altered in MφRIP140KD mice. Accordingly, we conclude that MφRIP140KD mice have dramatically altered their vwat, indicative of browning that might be caused by factors secreted by RIP140 KD macrophages. These animals resist typical chronic HFD-induced vwat remodeling and adipose inflammation. The promoter used to drive the short hairpin RNA, CD68, is most active in the monocyte macrophage lineage, with negligible activity in other immune cells such as eosinophil, neutrophils, T, and B cells (Fig. S3-1C). To further rule out potential effects from other nonmacrophage cells and/or potential developmental factors, we used BMT to generate MφRIP140KD only in the adult stage and named these BM restricted RIP140 KD animals KD WT. We then analyzed the vwat of these KD WT animals. Hematoxylin and eosin histology reveals that the vwat of KD WT mice apparently also contains multilocular fat cells (Fig. 3A), with similar elevation in brown fat (UCP-1) and beige fat (TMEM26) markers, particularly after HFD feeding (Fig. S3-4). Consistently, mrna levels of brown adipogenic (Pgc-1α, Ucp-1, and Prdm16) and 44
58 beige fat (Tmem26, Cd137, and Tbx1) markers (Fig. 3-3B), mitochondria number (Fig.3-3C), mitochondrial activity markers (Fig. 3-3D), and TH levels (Fig. 3-3E) are all significantly increased in the vwat of KD WT mice under an HFD. Further, KD WT mice gain less weight (Fig. 3-3F) and exhibit better systemic insulin sensitivity (Fig. 3-3G) and superior serum metabolic parameters such as fasting glucose level, fasting insulin level, serum adiponectin, cholesterol, free fatty acid, and triglyceride levels (Fig. 3-3H) as compared with WT WT mice under an HFD. KD WT mice also have a higher level of energy expenditure (vo 2 consumption) in both the dark and light phases (Fig. 3-3I). As shown in Fig. 3-3J, food uptake is similar between the two types of BMT mice. These results confirm that reducing RIP140 levels in macrophage either from birth or during adult stages reduces adipose inflammation, facilitates vwat browning, and improves systemic insulin sensitivity in mice under an HFD. Decrease in M1 and Increase in M2 ATMs in HFD-Fed MφRIP140KD Mice As described above, MφRIP140KD mice show vwat browning and an improved metabolic profile even after a long-term HFD feeding. To determine how an HFD might impact on various cell populations in the SVF of vwat, we analyzed leukocyte populations. As predicted, all immune cells in WT mice, including macrophages, neutrophils, eosinophils, and T and B lymphocytes are increased under HFD as compared with ND (Fig. S3-5). HFD fed MφRIP140KD mice have a significant increase only in 45
59 their macrophage population (Fig. 3-4A, left), but not neutrophils, eosinophils, or T or B lymphocytes (Fig. S3-5). Importantly, M1 expansion (Fig. 3-4A, middle) occurs to a lesser degree, and the M2 population is increased (Fig. 3-4A, right) in MφRIP140KD mice, suggesting that typical HFD-induced M1 expansion (mostly from recruitment) in vwat is reduced in MφRIP140KD mice. We subsequently validated the gene expression profiles of SVF from vwat. In WT mice, all of the examined M1 markers (Cd11c, Il1β, Il6, Nos2, and Tnfα) in the ATM of vwat are dramatically elevated under an HFD, whereas such elevation is almost entirely abolished in the vwat of MφRIP140KD mice (Fig. 3-4B). Moreover, in MφRIP140KD mice, all of the examined M2 markers (Arg1, Il10, Mgl1 [Cd301], Mgl2, Mrc1 [Cd206], and Mrc2) are already significantly elevated under ND, and most of these M2 markers become even further elevated upon HFD feeding (Fig. 3-4C). These data confirm that lowering the RIP140 level in macrophages reduces the inflammatory population and increases the anti-inflammatory population. Together, changes in ATM populations could contribute to the reduction in HFD-induced adipose inflammation. Decreased Circulating Proinflammatory Monocytes and M1 Recruitment in ATM of HFD-Fed MφRIP140KD Mice We analyzed the numbers of circulating CD115 + Ly6C + (proinflammatory) and/or Ly6C (anti-inflammatory) monocytes in WT and MφRIP140KD mice using FACS (gating strategy provided in Supplementary Fig. 6). As shown in Fig. 3-5A, left, 46
60 CD115 + Ly6C + and Ly6C circulating monocyte populations are comparable between WT and KD under an ND. But under an HFD, the CD115 + Ly6C + inflammatory monocyte number is higher in WT mice as compared with MφRIP140KD mice. By contrast, the CD115 + Ly6C anti-inflammatory monocyte number is higher in MφRIP140KD mice as compared with WT mice (Fig. 3-5A, right). The results demonstrate that lowering the RIP140 level in the monocyte/macrophage lineage affects the blood monocyte populations by reducing inflammatory monocytes, especially under HFD. ATMs are originally derived from BM and differentiated in AT from infiltrated monocytes[99]. Previous results (Fig. 3-4A) indicate that ATM infiltration in vwat is decreased in HFD-fed MφRIP140KD mice. We thus examined whether RIP140 affects ATM dynamics also because of reduced monocyte recruitment. To directly monitor the infiltration of monocyte/macrophage into vwat, we transferred PKH26-labeled BM (ATM progenitor) cells from WT and MφRIP140KD mice into normal mice and followed the distribution of these labeled cells in the vwat of recipient mice after HFD. Fig. S3-7 depicts the experimental design and FACS data. Statistical analyses are shown in Fig. S3-5B. Under an ND, the recruitment of all PKH26-labeled ATMs is relatively constant (1.5% in WT and 2.6% in MφRIP140KD mice); but after an HFD, recruitment is significantly altered: 36.2% in WT and 25.8% in MφRIP140KD mice. This is consistent with the difference in the ATM profile between WT and MφRIP140KD (Fig. 3-4A). We then examined changes in the expression patterns of key cytokine receptors in the SVF and vwat fraction. As expected, M1-specific CCR2 and its chemokine ligands are elevated in HFD-fed WT mice, but the elevation of these M1 molecular markers is 47
61 significantly reduced in MφRIP140KD mice (Fig. 3-5C), supporting that HFD-induced recruitment of M1 state ATMs is also retarded in MφRIP140KD mice. These data are consistent with the reduction of proinflammatory M1 ATM in HFD fed MφRIP140KD mice. Discussion Obesity-induced chronic inflammation is critical in the pathogenesis of IR and other metabolic diseases[100]. A significant advance in our understanding of obesityassociated inflammation and IR is the recognition of the critical role of ATMs[25]. Evidence has accumulated that in obese mice and humans, there is an increase in M1 ATMs and decrease in M2 ATMs. In this study, we found that RIP140 expression is increased in ATMs of HFD-fed mice, and it plays an important role in regulating HFDinduced monocyte and ATM polarization that contributes to AT inflammation. It has been reported that cold stress or IL-4 can enhance M2 in BAT and WAT[30]. In WAT, M2 releases catecholamines to enhance lipolysis, which provides fuel to BAT for thermogenesis. Studies have suggested that converting white adipocytes into brown or brown-like (beige) adipocytes in WAT (stimulating WAT browning) can be a useful strategy in managing obesity and IR. In this study, we uncover a function of RIP140 in ATMs to regulate adipocyte phenotype. Reducing RIP140 results in fewer M1 and more M2, which is beneficial to adipose tissue remodeling and improves its antiinflammatory status, particularly under an HFD feeding. Our data also provide evidence 48
62 that it is possible to enhance browning of WAT, even under an HFD feeding, by lowering RIP140 to reduce M1 and increase M2 polarization in ATMs, which improves insulin sensitivity. How RIP140 KD macrophage stimulates the browning of WAT remains to be elucidated. To this end, we detected browning effects caused directly by CM of MφRIP140KD macrophages and elevation in catecholamine-synthesizing rate-limiting enzyme, TH, in MφRIP140KD animal s ATMs. We also found that RIP140KD could enhance the expression of TH in IL-4 stimulated macrophages. RIP140 may regulate TH expression in macrophages, thereby modulating catecholamine production to affect vwat browning. A recent study[95] showed ablating RIP140 in adipocytes stimulated browning, suggesting cell-autonomous repressive activity of RIP140 in the browning program of adipocytes. Our study indicates RIP140 also plays a negative role in adipose tissue browning through its action in ATMs. Accordingly, it is tempting to speculate that RIP140 can be a negative, physiological regulator of AT browning. Recent studies indicated that ATM arises from a lineage that includes BM precursors and blood monocytes[99]. M1 ATM increases by recruiting a population of Ly6C + monocytes through CCR2 CCL2 signaling[101]. Our data support this idea. We observed that reducing RIP140 more significantly affects Ly6C + circulating monocyte population and inhibits the M1-type ATM recruitment in AT. In mice, Ly6C + monocytes accumulate in AT and elicit inflammation[102], whereas Ly6C monocytes participate in resolving inflammation[103]. A predominance of the Ly6C over Ly6C + monocyte population was observed in the peripheral blood of HFD-fed MφRIP140 KD mice (Fig. 49
63 3-5A). The alteration of Ly6C + and Ly6C circulating monocyte subsets could contribute to the M2-dominant shift of ATMs in HFD-fed MφRIP140 KD mice. M2 ATMs could proliferate in situ during obesity-inducing inflammation[104]. Although Ly6C monocytes have been suggested to give rise to M2 macrophages, this relationship has not been firmly established[105]. The dramatic reduction in M1 by lowering RIP140 levels with a relative increase in M2 would contribute to the overall dynamic changes in ATM populations seen in MφRIP140 KD mice. However, studies are required to determine whether and how lowering RIP140 may also enhance the M2-dominant shift. In our previous studies, we showed that regulating RIP140 levels in macrophages controls the inflammatory response, including endotoxin tolerance[65] and septic shock[73]. Under HFD feeding, although circulating monocyte/macrophage numbers are decreased in RIP140KD mice as compared with WT mice, RIP140KD mice in fact harvest fewer Ly6C + pro-inflammatory monocytes, but more Ly6C anti-inflammatory monocytes. Overall, it may be concluded that downregulating RIP140 in macrophages will reduce pro-inflammation and increase anti-inflammation. However, responses of these animals to various infectious agents remain to be examined. In conclusion, RIP140 is involved in regulating monocyte and ATM homeostasis. Reducing RIP140 correlates with attenuation in circulating M1 and reduction in M1 recruitment to ATMs. The dynamic changes in these important innate immune cell populations impact the overall polarization pattern of ATMs in fat tissues. This particular 50
64 ATM phenotype is beneficial to the browning in vwat and the improved metabolic phenotype of these animals. 51
65 Figures 52
66 Fig. 3-1 MφRIP140KD mice exhibit improved metabolic phenotypes. (A) The average body weight of WT and MφRIP140KD (KD) mice fed an ND or HFD for 15 weeks. (B) ITT and GTT determined after 15 weeks of ND or HFD feeding. (C) Serum insulin, glucose, adiponectin, cholesterol, free fatty acid, and triglyceride levels in ND- or HFDfed WT and KD mice. (D) qpcr results showing mrna levels of pro- and antiinflammatory cytokines in the vwat of ND- or HFD-fed WT and KD mice. (E) Insulin signaling components in ND- or HFD-fed WT and KD adipose tissues. For A and B, twoway ANOVA test was performed. For C and D, Student test was used. All experiments were performed three times and presented as mean±sd; n = 5 to 6 mice/group. *P < 0.05; **P < 0.01; ***P <
67 54
68 Fig. 3-2 MφRIP140KD mice show browning in vwat. (A) Body weight normalized iwat, vwat, and BAT tissue mass (WT: n = 6;KD: n = 6). (B) Left, histological staining of vwat. Scale bars, 200 mm. Right, WT and KD mice were fed an ND or HFD for 15 weeks. Sections of vwat were stained with hematoxylin & eosin, and adipocytes were counted and presented as numbers per millimeter. (C) qpcr results of mrna levels in brown (left) and beige (right) fat markers in vwat. (D) mtdna content and mitochondrial activity markers in vwat. (E) In vitro adipocyte differentiation using untreated (unconditioned medium), CM of WT, or RIP140 KD macrophage. (F) Left, qpcr of relative TH mrna levels in ATM of vwat. Right, qpcr of relative TH mrna levels in macrophages from WT or RIP140 KD, with or without IL-4 treatment. (G) Analyses of energy expenditure of WT and KD mice. vo 2 consumption was measured in the dark and light phases as described in Materials and Methods (WT: n = 12; KD: n = 12). (H) Food intake was monitored and normalized to body weight. For A F and H, Student test was used and presented as mean±sd. For G, Student test was used and presented as mean±sem. *P < 0.05; **P < 0.01; ***P <
69 56
70 Fig. 3-3 Induction of browning phenotype in MφRIP140KD produced with BMT. (A) After BMT reconstitution, WT WT and KD WT mice were fed an ND or HFD for 15 weeks. Histological staining of vwat. Scale bars, 200 mm (WT: n = 6; KD: n = 6). (B) qpcr data showing mrna levels of brown and beige fat markers in vwat (WT: n = 6; KD: n = 6). mtdna content (C) and mitochondrial activity markers (D) in vwat were detected. (E) qpcr of relative TH mrna levels in ATMs of vwat. (F) Body weight ofwt WT and KD WT mice fed an ND or HFD for 15 weeks. (G) ITT and GTT determined after 15 weeks of ND or HFD feeding. H: Serum insulin, glucose, adiponectin, cholesterol, free fatty acid, and triglyceride levels in ND- or HFD-fed WT WT and KD WT mice. (I) Energy expenditure of WT WT and KD WT mice. vo 2 consumption was measured in the dark and light phases as described in Materials and Methods (WT: n = 6; KD: n = 6). (J) Food intake was monitored and normalized to body weight. For B J, Student test was used and presented as mean±sd. Experiments were performed two times. *P < 0.05; **P < 0.01; ***P <
71 Fig. 3-4 Decreased total ATM and altered M1/M2 profile in the vwat of MφRIP140KD mice. (A) FACS evaluation of ATM population of the SVF in vwat. The statistic results show the ATM population and M1/M2 distribution in vwat of WT and KD, under ND or HFD, that is normalized to the vwat mass. The analyzed cells are from the SVF as shown in Fig. S3-5A. (B) and (C) qpcr determining mrna levels in the SVF of vwat. Student test was used and presented as mean±sd. n = 5 to 6 mice/group. All experiments were performed two times. #P < 0.05 and ##P < 0.01 for comparison of ND-RIP140 mice with HFD-RIP140 KD mice. *P < 0.05; **P < 0.01; ***P <
72 Fig. 3-5 Monocyte and macrophage recruitment. (A) Quantification of circulating CD115 + Ly6C + (pro-inflammatory) and/or Ly6C (anti-inflammatory) monocyte analyzed by FACS. (B) Quantification of F4/80 + PKH26 + (indicative of recruited ATM) in vwat analyzed by FACS. (C) qpcr analyses of mrnas of chemokines and their cognate receptors in the SVF or total vwat. Data are presented as mean±sd; n = 4 mice/group and Student test was used. Data were performed in duplicate. *P < 0.05; **P < 0.01; ***P <
73 60
74 Fig. S3-1 RIP140 expression in macrophages (A) HFD elevates RIP140 levels in ATM. Total RNA was isolated from ATM (as F4/80 positive cells) collected from the SVF of ND and HFD-fed WT mice for 3 or 15 weeks. RIP140 mrna levels were measured by qpcr. (B) Relative mrna levels of RIP140 in peritoneal macrophages (PM), BMM (bone marrow derived macrophage) and ATM from two different RIP140 KD mouse lines (KD-1 and -2) were detected using qpcr. (C) Analysis of RIP140expression levels in macrophages (top, where KD shows a very dramatic reduction), eosinophils, neutrophils, T and B lymphocytes (all have RIP140 levels and are not affected by KD) by using FACS. Data are presented as mean±sd; n=5-6 mice per group and Student s test was used. *P<0.05; **P<0.01; 61
, TMEM26 (green), or CD137 (green), and co-stained with perilipin A (red) and DAPI (blue).")
75 Fig. S3-2 MφRIP140KD mice exhibit browning in vwat. (A)WT and KD mice were fed a ND or a HFD for 15 weeks. Sections of vwat were analyzed by immunological staining of UCP- 1 (green), TMEM26 (green), or CD137 (green), and co-stained with perilipin A (red) and DAPI (blue). (magnification x200) (B)The protein expression of UCP-1 in vwat of ND- or HFD-fed WT and KD. 62
76 63
77 Fig. S3-3 Characterization of iwat and BAT of MφRIP140 KD and WT mice. (A) Histological staining of iwat. Scale bar=200 µm. (WT:n=6; KD:n=6) (B) Relative mrna levels of brown and beige fat markers in iwat. (C) Immunological staining of UCP-1 (green), TMEM26 (green), and co-staining with perilipin A (red) and DAPI (blue) (magnification x200). (D) Histological staining of BAT. (E) Relative mrna levels of BAT markers in BAT. (F) Immunological staining of UCP-1 (green), co-staining with perilipin A (red) and DAPI (blue). Student s test was used for B and E.Data were presented as mean±sd *P<0.05; **P<0.01; ***P< All data were performed two times. 64
, TMEM26 (green), and costained with DAPI (blue), with PKH26 (red) as positive control for the donor")
78 Fig. S3-4 Induction of browning phenotype in RIP140 KD produced using BMT. WT WT and KD WT mice were fed a ND or a HFD for 15 weeks. Sections of vwat were analyzed by immunological staining of UCP-1 (green), TMEM26 (green), and costained with DAPI (blue), with PKH26 (red) as positive control for the donor cells. (magnification x200) (WT:n=6; KD:n=6) 65
79 66
80 Fig. S3-5 FACS analyses of cell populations in the SVF of WT and KD mice, and under ND and HFD.(A) The FACS gating strategy for immune cells in the SVF of mice. SVF was collected form vwat, and mononuclear cells were gated for FSC/SSC. Dead cell fractions were removed. The gated CD45 + CD11b + F4/80 + cells (macrophages) were examined with anti-cd11c (as M1) or anti-cd206 (as M2) antibody. Other cell types were gated and analyzed as indicated. (B) Macrophages are, but neutrophils, eosinophils, T and B cells are not, affected by KD or HFD. Quantification of immune cells in the SVF of WT and KD mice, under ND and HFD. 67
81 Fig. S3-6 The gating strategy of FACS analyses of monocyte population in the bloodof WT and KD mice.blood sampleswere collected from WT and KD miceand circulatingcd115 + Ly6C + (pro-inflammatory) and/or Ly6C - (anti-inflammatory) monocytes were gated and analyzed by FACS. 68
82 Fig. S3-7 The experimental design to detect ATM recruitment in vivo. PKH26 labeled bone marrow cells were transplanted into recipient animals. After feeding a ND or HFD for 3 weeks, the sections and SVF of vwat were obtained for florescence staining and FACS analysis. The gating strategy of FACS analyses of macrophages in the SVF of mice is shown at the bottom. Cells were stained with CD45 and F4/80 antibody (as macrophages marker), then detected by FACS. PKH-26+ cells were scored, representing recruited cells. 69
83 Preface This chapter has been published: Yi-Wei Lin*, Bomi Lee*, Pu-Ste Liu, and Li-Na Wei (2016) Receptor-Interacting Protein 140 Orchestrates the Dynamics of Macrophage M1/M2 Polarization. J Innate Immun. 8(1): PMID: *These authors contributed equally to this work. YWL. and BL. designed the experiments, analyzed the data, and performed the experiments. PSL. performed the experiments. LNW. designed the experiments, analyzed the data, and provided financial support. LNW is the guarantor of this work and, as such, had full access to all the data in the study and takes responsibility for the integrity of the data and the accuracy of the data analysis. 70
84 Chapter IV RIP140 orchestrates the dynamics of macrophage M1/M2 polarization 71
85 Introduction Macrophages belong to the innate immune cells and play a central role in inflammation and host defense; they are highly heterogeneous and exhibit diverse functional phenotypes in response to different environmental cues [11, 106]. In general, they undergo two types of polarized activation, classical pro-inflammatory activation (M1) and alternative anti-inflammatory activation (M2) [14, 20]. The M1 macrophage produces high levels of proinflammatory cytokines, reactive nitrogen and oxygen intermediates, and it generally harbors strong microbicidal and tumoricidal activities. The M2 macrophage is anti-inflammatory and primarily involved in resolving inflammation, parasite containment and tissue remodeling. When tissues are damaged following infection or injury, inflammatory monocytes are recruited from circulation and differentiated into macrophages as they migrate into the affected tissues. These recruited macrophages often first show M1 phenotype, producing proinflammatory cytokines such as interleukin-1 (IL-1) and tumor necrosis factor α (TNFα). Subsequently, the recruited macrophages then shift to more M2-like, producing regulatory cytokines such as interleukin-10 (IL-10) and transforming growth factor β (TGFβ). It remains unclear whether M1 to M2 phenotype switch occurs in the same macrophage, but it is widely accepted that M1-M2 switch among macrophage populations is an essential process during recovery [107]. This macrophage phenotype switch must be tightly regulated to maintain the homeostasis of innate immunity. Uncontrolled macrophage polarization is frequently implicated in diseases such as sepsis, autoimmune diseases, and cancers, etc [20-23]. Cytokines that stimulate M1 or M2 phenotype have been largely uncovered and 72
86 principal transcription factors for M1 versus M2 activation are also well characterized [16, ]; however, whether the dynamics of M1-M2 switch, or the homeostatic control of this phenotypic switch involves cell-autonomous factors in macrophages is unknown. Upon infection inflammation occurs as a defense mechanism; but uncontrolled inflammation leads to dangerous pathological states including septic shock [111, 112]. An important host adaptation to protect against septic shock is to establish a state of endotoxin tolerance (ET) where macrophages become transiently unresponsive and fail to produce inflammatory cytokines upon further endotoxin challenges [113, 114]. Molecules that may mediate ET by suppressing TLR signaling have been reported [ ]. Recently, we have reported that a nuclear coregulator, Receptor Interacting Protein 140 (RIP140) [53] which is involved in various physiological processes [42], also plays a crucial role in the establishment of ET [65]. We found that RIP140 is the principal nuclear coactivator of NF-κB in endotoxin-challenged M1 macrophages, and that upon endotoxin challenge it is rapidly degraded by Syk-initiated ubiquitination, which renders NF-κB inactive [65]. Thus, reducing RIP140 protein level facilitates ET and protects against septic shock [65, 73]. Others have shown that endotoxin challenged M1 macrophages, while unable to respond to further endotoxin stimulation, can still respond to stimuli for M2 polarization [118, 119]. Is a state of ET required for proceeding to M2 polarization? Are there cellular factors regulating the progression of stimulated macrophages from M1, ET and then M2? These are central questions to be addressed in this study. 73
87 Numerous disease conditions involve the coordination of inflammatory and antiinflammatory responses [120]. Wound healing encompasses macrophage M1 polarization and transition to a state of ET and then to M2 phenotype. When this transition is out of control, macrophages could be locked into a specific phenotype, leading to chronic inflammation and tissue destruction. In this study, we uncover that RIP140 not only is crucial for M1-ET establishment, but also can negatively regulate the progression of macrophage switch to a M2 state during recovery. Interestingly, this particular function of RIP140 in M2-stimulated macrophages is executed by its cytosolic form, which activates a specific cytosolic phosphatase that inactivates the master regulator of M2 polarization, pstat6. We employ both in vitro and in vivo wound healing models to demonstrate the dual functions of RIP140 in regulating the dynamics of macrophage M1- M2 phenotypic switch and explain, at least partially, the plastic nature of macrophage polarization in various disease conditions. Materials and Methods Reagents Reagent sources are LPS (Sigma-Aldrich #L4391), IFN-γ (Invitrogen #PMC4031), IL-4 and IL-13 (Cell signaling #5208, 5242), antibodies for RIP140 (Abcam ab42126), CAPNS1 (ab28237), pstat6 (Cell signaling #9361), PTP1B (Santa Cruz sc-1718), STAT6 (M-20 sc-981), α-tubulin (B-7 sc-5286), Lamin A/C (346 sc-7293), HA (SC- 7392), β-actin (C4, sc-47778), kinase inhibitor Staurosporine (S5921, Sigma), PTP 74
88 inhibitor I (sc , Santa Cruz), PTP1B inhibitor XXII (593741, Calbiochem), SHP1/2 PTPase inhibitor (565851, Calbiochem), and Calpain inhibitor ( , Calbiochem). Cell culture, lentivirus production and transduction RAW264.7 cells were cultured in DMEM medium supplemented with 10% FBS and 1% antibiotics. Cells were transfected using Lipofectamine LTX and PLUS reagent (Invitrogen). WT-RIP140 and Y3F-RIP140 expression and RIP140-shRNA lentivirus were as described [65]. PTP1B shrna lentivirus constructs were from Genomic Center at the University of Minnesota: sirna sequence: #1-GCGGCTATTTACCAGGACATT, #2- CTGCCTCTTACTGATGGACAA. Cell fractionation, Immunoblotting and Immunofluorescence Cells were suspended in a hypotonic buffer, lysed with RIPA [61] and the nuclear fraction was obtained from the pellet. Endoplasmic Reticulum Isolation Kit (Sigma, ER0100) was used for ER and cytosolic fractionation. Whole cell lysates were prepared 3 days after virus transduction or 2 days after transfection in RIPA buffer. Protein was quantified with Bradford, separated by 8% SDS-PAGE and analyzed by immunoblotting. For immunofluorescence, cells fixed on coverslips were permeabilized for 5 min at RT and stained with antibodies, and mounted using a DAPI-contained mounting buffer. The 75
89 slides were imaged under a confocal microscope (Olympus FluoView 1000 BX2 Upright Confocal). RNA isolation and gene expression analyses Total RNA was isolated using TRIzol (Invitrogen). Reverse transcription (RT, 2 µg) was performed using High-Capacity cdna Reverse Transcription Kit (Applied Biosystems). Quantitative real-time PCR (qpcr) was performed with SYBR enzyme mix (Applied Biosystems). Each gene expression experiment was performed in triplicate. Expression levels were normalized to β-actin. Chromatin-immunoprecipitation (ChIP) assay Raw264.7 cells were cross-linked with 1% formaldehyde, lysed, sonicated and immunoprecipitated with antibodies against STAT6 (Santa Cruz) or RNA Pol II (Millipore) overnight. Following decrosslinking, DNA was isolated and analyzed by qpcr for STAT6-binding and non-binding regions. Arginase 1 promoter STAT6 binding site: (F) TGAACAGGCTGTAGCCAACA, (R) AGCACCCTCAACCCAAAGTG, STAT non-binding site: (F) TCTGATGATGCCAAGTAGCC (R) GGACAAGCCACAGTCAGAGA. 76
90 In vitro phosphatase activity assays RAW264.7 cells were infected with RIP140-trageting shrna lentivirus followed by IL-4 stimulation. Cell lysates were prepared (50 mm HEPES, 0.1 mm EGTA, 0.1 mm EDTA, 120 mm NaCl and 0.5% NP-40) and incubated with immobilized capture antibody specific to PTP1B bound microplates and washed to remove unbound materials. A synthetic phosphopeptide substrate was added, and the free phosphate generated by PTP1B was detected using malachite green and molybdic acid, and determined by the absorbance at 620 nm. Animals All studies were carried out using male C57BL/6J mice from The Jackson Laboratory and maintained in the animal facility of University of Minnesota. Animal studies were approved by University of Minnesota Institutional Animal Care and Use Committee. MφRIP140KD transgenic mice were generated as previously described [65]. Peritoneal macrophages (PM) isolation and bone marrow transplantation were performed as described [121]. Flowcytometry Macrophages in the wounds were isolated by enzymatic digestion [122]. Cell surface antigens were blocked with Fc block (20 ug/ml; BD Biosciences), incubated with fluorophore-conjugated antibodies or isotype control antibodies for 1h. Fluorophore- 77
91 conjugated primary antibodies were from BioLegend: F4/80-FITC (#123122), CD11cphycoerythrin (#117308) and CD206-Alexa Fluor 647 (#141712). Cells were washed and centrifuged at 500 g for 5 minutes and re-suspended in 1 ml washing buffer for FACS Calibur analyses using WinMDI software and gating strategy was described as previous [28]. Briefly, wound macrophages were collected and mononuclear cells were gated for FSC/SSC. Dead cell fractions were removed. The gated CD11b + F4/80 + cells were examined with anti-cd11c (as M1) or anti-cd206 (as M2) antibody. In vitro Wound healing assay 293TN cells monolayer on 6-well plates at a 90% confluence was scraped using a pipette tip to produce a wound, incubated with conditioned medium of primary macrophages transfected with a control, RIP140-knockdown or RIP140-overepresion vector. After 24h and 48h, photographs were taken and analyzed by Image J software to determine wound closure. In vivo Wound healing assay Cutaneous wounds were made on both sides of the shaved mice back (2 wounds per animal) with a 5mm round biopsy punch under anesthesia. Wound size was recorded daily until the wound was closed, and analyzed by Image J. 78
92 Statistical analysis Experiments were performed at least twice and results were presented as means ± SD. One way ANOVA and Student s t-test was used. P values of 0.05 or less were considered statistically significant (*P<0.05; **P<0.01; ***P<0.001). Results Failure to establish RIP140 degradation-mediated endotoxin tolerance (ET) prevents macrophage M2 polarization We previously showed that RIP140 is required for macrophage M1 polarization but it then must be rapidly degraded in order to establish ET and prevent inflammatory storm such as sepsis. In this current study we first found that under the condition when ET fails to be established and RIP140 cannot be degraded, such as following stimulation with IFN-γ [123], subsequent M2 polarization is severely dampened. Fig. 4-1a shows that, as predicted, in LPS-treated M1 macrophage RIP140 protein is degraded without altering its mrna level, which is abolished in IFN-γ pretreated cells. Fig. 4-1b shows that IL4- stimulated M2 polarization, as shown in LPS-tolerated cells, is dramatically dampened in IFN-γ pretreated cells. We speculated that RIP140 might play a regulatory (negatively) role in macrophage polarization for transition to M2, and employed a non-degradable mutant RIP140, Y3F (Tyr364, Tyr418 and Tyr436 all mutated into phenylalanine to prevent degradation) (Fig. S4-1) [65] to test this possibility. Fig. 4-1C shows that indeed, expressing this non-degradable RIP140 (Y3F), but not the wild type RIP140 (WT), significantly diminishes the effect of IL4-stimulated M2 polarization as supported by the 79
93 significantly reduced the expression of M2 markers. These results demonstrate a pivotal role for RIP140 not only in promoting M1 polarization during an inflammatory response, but also in controlling phenotypic switch from M1 to M2 state. Reducing RIP140 level promotes wound healing by facilitating M1-M2 switch Macrophage M1-M2 phenotype switch is critical to wound healing. We then asked whether and how changing RIP140 levels might affect wound healing efficiency. We first employed a macrophage specific RIP140 knockdown (MφRIP140KD) mouse as an in vivo model [65] where RIP140 protein level in monocyte-macrophage populations is reduced for 90-95% (Fig. S4-2). As shown in Fig. 4-2a, wound closure in MφRIP140KD mice (two independent lines KD-1 and -2) is more efficient than that in WT mice. We then examined the dynamics of M1-M2 switch during wound healing process (Fig. 4-2b). In WT mice (closed markers), M1-M2 switch occurs approximately on the 5 th day after the wound; whereas in MφRIP140KD KD (open markers), M1-M2 switch occurs approximately on the 3 rd day. Consistently, in the wounds, the levels of all the examined M1 marker genes (TNFα, inos and IL-1β) are lower in MφRIP140KD mice than in WT mice (Fig. 4-2c); whereas the levels of all the examined M2 marker genes (Arg I, TGFβ and VEGF) are significantly elevated in MφRIP140KD mice (Fig. 4-2d). These data support the notion that RIP140 protein level is an important factor that regulates the kinetics of macrophage phenotypic switch in, and thus the efficiency of, wound healing process. 80
94 We then utilized in vitro primary macrophage (PM) culture to examine the effects of altering RIP140 protein levels in M2 polarization (Fig. S4-3a). Using lentivirus to over-express or knockdown RIP140 in primary PM, we found IL-4 induction of all characteristic M2 genes is significantly attenuated by over-expressing RIP140 (left), but it is significantly elevated by knocking down RIP140 (right). Further, the activity of arginase I (Arg I), a critical factor in M2 macrophages, is significantly elevated by knocking down RIP140 level and reduced by elevating RIP140 level (Fig. S4-3b). We further employed in vitro wound healing model of 293TN monolayer cultures supplemented with conditioned media of macrophage cultures where RIP140 level had been altered (Fig. 4-2e and Fig. S4-4). It appears that the conditioned medium of RIP140- overexpressing, IL4-treated macrophage culture suppresses healing in the wounded 293TN culture (top panel in Fig. 4-2e and left panel in Fig S4-4), whereas the conditioned medium of RIP140 knockdown, IL4-treated macrophage culture significantly improves wound closure (bottom panel in Fig. 4-2e and right panel in Fig S4-4). These results support that RIP140 regulates macrophage M1-M2 switch to affect wound healing both in vivo and in vitro. Preventing RIP140 degradation delays wound healing We next examined whether preventing RIP140 degradation in macrophages would delay wound healing in vivo. In order to specifically monitor the effects elicited by disturbing the dynamics of macrophage polarization in adult stages, we employed bone marrow transplantation (BMT) to replace animal s endogenous macrophages with 81
95 myeloid cells carrying either GFP only, WT RIP140-GFP or the non-degradable mutant Y3F RIP140-GFP, and examined their wound healing processes. Comparable BTM efficiency was validated (Fig. S4-5). It appears that wound healing in mice receiving myeloid cells carrying WT RIP140 is slightly delayed as compared to those receiving GFP only (control), but complete healing (with 100% wound closure) occurs on day 12 for both groups. Interestingly, wound closure in mice receiving Y3F-RIP140 is significantly less efficient; by day 12, their wounds close for only 70%. (Fig. 4-3a). Further, in the wounds of the Y3F-RIP140 group, M1 population is expanded but the M2 population is reduced, as compared to the WT RIP140 group (Fig. 4-3b). Consistently, in the wounds of the Y3F-RIP140 group, along the course of healing the expression of all the monitored M1 marker genes (TNFα, inos and IL-1β) is significantly elevated and the expression of all the monitored M2 marker genes (Arg I, TGFβ and VEGF) is significantly lowered (Fig. 4-3c, 4-3d). These data further validate the notion that elevating RIP140 protein level such as by blunting its degradation in monocytes/macrophages during injury facilitates and locks these macrophages in their M1 state, resulting in impaired wound healing process. RIP140 suppresses M2 macrophage polarization by inhibiting activation of STAT6 (phosphorylation) in the cytosol We noticed that the suppressive effect of RIP140 on M2 gene expression is evident only after treatment with M2 cues such as IL-4 (Fig. S4-3), indicating that RIP140 targets the downstream signaling pathway of IL-4. Interestingly, in IL-4 82
96 stimulated cells endogenous RIP140 is gradually translocated from the nucleus to the cytosol (Fig. 4-4a, 4-4b), which appears to be also true for the RIP140-Y3F mutant protein (fig. S6). Nuclear-cytosolic translocation of RIP140 also occurs in macrophages stimulated with other anti-inflammatory cytokines such as IL-13 (Fig. S4-7). To understand how RIP140 inhibits IL-4 signaling pathways, we examined several potential targets and found that RIP140 suppresses the activation of the master signal transducer for M2, STAT6 phosphorylation at Tyr641 (Fig. 4-4c), resulting in its decreased DNA binding, as well as RNA polymerase II recruitment to the promoter of its target genes such as Arg-1 (Fig. 4-4d). These results indicate that upon IL-4 stimulation, RIP140 is translocated from the nucleus to the cytosol where it suppresses the activation of the master regulator STAT6 (phosphorylation at Tyr641). M2 target gene expression is thus dampened. RIP140 targets Calpin1/2 to activate PTP1B to reduce STAT6 phosphorylation To examine how RIP140 suppresses the activation of STAT6, i.e. its phosphorylation at tyr641, we examined two possibilities - either impairing its kinase or enhancing its phosphatase activity, since RIP140 does not form complex with STAT6 (Data not shown). It appears that RIP140 does not affect the kinase, because silencing RIP140 still affects the induction of pstat6 even though kinases are blocked by inhibitors like Staurosporine (Fig. S4-8a). In stead, it probably targets dephosphorylation of pstat6. PTP1B has been reported as a phosphatase for pstat6 [124]. Indeed, both a general phosphatase inhibitor and a PTP1B-specific inhibitor, but not the SHP-1/2 83
97 specific inhibitor, blocks RIP140-triggered reduction in pstat6 level (Fig. 4-5a). The specificity of RIP140 to PTP1B is further confirmed, because silencing PTP1B abolishes the suppressive effect of RIP140 (Fig. 4-5b). In vitro phosphatase enzyme assay substantiates that RIP140 regulates PTP1B activity that inactivates (de-phosphorylates) pstat6 (Fig. 4-5c) without affecting PTP1B mrna levels (Fig. S4-8b). We found that RIP140 and PTP1B are co-localized in the cytosol of IL-4 treated macrophages (Fig. 4-5d). Further, the level of active PTP1B, typically cleaved from its precursors on the ER membrane, is increased by over-expressing RIP140 (Fig. 4-5e). We speculated that in IL4-treated cells, RIP140 is exported to the cytosol and translocated to ER to facilitate the activation of PTP1B precursors, and performed ER and cytosol fractionation to examine the distribution of the active and inactive forms of PTP1B protein. Elevating RIP140 level increases the active, cytosolic PTP1B and reduces the inactive, ER-associated PTP1B (Fig. 4-5f), supporting that RIP140 enhances PTP1B activity by facilitating the cleavage of its precursor. PTP1B precursor on the ER is cleaved by a calcium-dependent protease calpain. Interestingly, we found that RIP140 forms complexes with the calpain regulatory subunit, CAPNS1, in the presence or absence of IL-4 (Fig. 4-5h); further, calpain inhibitor pre-treatment completely blocks RIP140-regulated PTP1B cleavage in IL-4-treated M2 PM (Fig. 4-5g). These data are consistent with previous reports that PTP1B is one of the targets of caplain1/2 [125, 126], and CAPNS1 is necessary for calpain1/2 activity [127, 128]. All together, the data demonstrate that in IL-4 treated macrophages, RIP140 is increasingly translocated from 84
98 the nucleus to become more associated with the calpain regulatory subunit to regulate calpain1/2 activity, which cleaves PTP1B precursor from ER, releasing active PTP1B to inactivate pstat6 in the cytosol. Discussion In this study we used ET and wound healing models to understand the regulation of M1/M2 polarization. While it has been reported that macrophages in the ET state exhibit M2-like features and they are more sensitive to M2 cues, the underlying mechanism was elusive [118, 119]. Here we demonstrate that the level of RIP140 protein is crucial a) RIP140 suppresses the activation of the M2 master regulator STAT6, and b) for inflammatory macrophages to proceed to a state of ET, RIP140 level must be reduced. As such, ET macrophages generally have low RIP140 levels and are more sensitive to M2 activation. As wound healing progresses, macrophage phenotype switches from M1 to M2 [107]. The transition from inflammatory, M1 polarization to alternative antiinflammatory M2 polarization is critical to the healing process. One critical molecular event in this transition is the rapid reduction of NF-κB coactivator RIP140 protein level, which allows timely dampening of inflammation (via inactivation of NF-κB). Lowering RIP140 level by rapid degradation is made possible by the action of a specific SCF E3 ubiquitin ligase that ubiquitinates RIP140 [65]. The current study extends our previous finding and demonstrates a new function of RIP140, which is to regulate the dynamics of 85
99 M1 vs. M2 polarization. On the cellular level, M1 to M2 transition requires the establishment of ET, at least for TLR-4 mediated stimulation, which is also orchestrated by altering the level of RIP140 protein level (fig. 2b). We employed two animal models to support this conclusion, a MφRIP140KD transgenic mouse model where RIP140 level in macrophage is reduced from birth, and a bone marrow transplant generated macrophage replacement model where a non-degradable RIP140 mutant protein, Y3F, is introduced only during adult stages. Our data clearly show that the accumulated RIP140 protein level, even only in adults, is crucial to the dynamics of macrophage phenotype transition. An unexpected finding in this in vivo wound experiment shown in fig. 3d is that Arg1 gene expression is higher in Y3F-RIP140 mice than wild type mice on day 10. It is important to note that gene regulation, especially in whole animals, can involve more complicated regulatory pathways. Y3F-RIP140 could possibly exert additional effects that might have disturbed Arg1 gene regulation, causing a higher level of ArgI gene expression in certain points of the wound healing process, as surprisingly observed on day 10 of this experiment. However, the expression of two additional M2 markers TGFβ and VEGF and the M2 population analysis from FACS all support the notion that preventing RIP140 degradation (to elevated RIP140 level) indeed delays wound healing, which involves inhibiting M1-M2 switch. 86
100 An interesting mechanistic finding is that the new M2-suppressive function of RIP140 is achieved by its cytosolic form, exported from the nuclei in M2 cue-stimulated macrophages. RIP140 was initially identified as a co-regulator of numerous transcription factors in the nucleus, but increasing studies reveal that in various cell types and stimulated by different signal inputs, nuclear RIP140 can be exported to the cytosol to regulate a wide variety of biological processes. Interestingly, all these events are highly cell type-selective and signal-specific. For instance, in mature adipocyte, lipid signal stimulates its export to the cytosol to regulate AS160 to modulate insulin sensitivity [61]. In differentiated neurons, ER stress stimulates RIP140 export to the cytosol and then to ER where it interacts with IP3R to modulate ER store calcium release, thereby protecting neurons from apoptosis [63]. In this current study, we uncover RIP140 exported to the cytosol in M2 cue-stimulated macrophage to suppress the efficiency of M2 polarization. Clearly, in macrophages RIP140 modulates the homeostasis of innate immunity via its dual functions in M1 and M2 states. With this dual control in place, macrophages may not over-react to either stimulus. A fault in this control may result in devastating situations such as sepsis or delayed wound healing (when RIP140 cannot be degraded or exported in time). Surprisingly, the cytosolic RIP140 suppresses the M2 master regulator pstat6 by targeting the regulatory step of a specific phosphatase of STAT6, PTP1B, in the ER/cytosol. This is achieved by its increasing association with the calpain s regulatory subunit, CAPNS1, in IL-4 treated cells to further activate calpain1/2, that cleaves PTP1B precursor and renders its activation. Whether and how RIP140 association 87
101 with CAPNS1 would alter calpain1/2 activity remain to be determined. Activated PTP1B then efficiently de-phosphorylate pstat6, thereby reducing M2 target gene activation. PTP1B is a negative regulator for insulin and leptin signaling pathways [129, 130]. Currently, a PTP1B inhibitor, Trodusquemine, and PTP1B specific antisense oligonucleotides are in phase 2 clinical trial for treating diabetes or obesity [131, 132]. Clearly, in innate immune cells, RIP140 protein expression level and its sub-cellular localization are critical to the maintenance of macrophage s functional plasticity. Factors and molecules regulating its protein level and sub-cellular distribution can also be potential therapeutic targets. However, the mechanism underlying M2 cue (such as IL4 and IL13)-stimulated nuclear export of RIP140 remains to be determined. Further, while RIP140 can be associated with the calpain regulatory subunit, CAPNS1, it remains unclear how this affects calpain activity. Rigorous biochemical studies are needed in order to understand molecular details of activation of this specific protease complex. 88
102 Figures 89
103 Fig 4-1 ET established by degrading RIP140 facilitates macrophage M2 polarization. a. Western blotting (top) and qpcr (bottom) analyses of RIP140 in primary peritoneal macrophages (PM) with or without IFN-γ pretreatment 16h followed by LPS (10ng/ml) treatment for 24 h. b qpcr analyses of M2 marker gene expression in PM with or without IFN-γ pretreatment followed by LPS stimulation, and then treated with (black bars) or without (open bars) IL4 for 6h. Results are presented relative to control (neither LPS nor IFN-γ). c qpcr analyses of M2 marker gene expression in either lentinvirus- WT-RIP140 (WT) or lentivirus-y3f-rip140 (Y3F) infected (for 48 hours) PM that were then challenged with LPS for 18h and followed by control or IL4 stimulation for 6h. Results are presented relative to WT infected cells with control treatment. Data are representative of three experiments (means±s.d.), and Student s t-test (n=3) was used (*P<0.05; **P<0.01; ***P<0.001). 90
104 91
105 Fig. 4-2 Reducing RIP140 level promotes wound healing by facilitating M1 - M2 switch a Daily record of wound closure on WT and MφRIP140KD mice. Data show three experimental results of two independent MφRIP140KD lines (means±s.d.). One way ANOVA test was used *P<0.05 (WT vs KD-1); P<0.05 (WT vs KD-2). b FACS evaluation of M1 (F4/80 + CD11C +, top panel) and M2 (F4/80 + CD206 +, bottom panel) populations on the wounds of WT and MφRIP140KD mice. The numbers of M1 and M2 populations are normalized to the wound mass (cell numbers per mg). Data show three experimental results (means±s.d.). Student s t-test (n=3) was used *P<0.05 (WT-M1 vs KD-M1); P<0.05 (WT-M2 vs KD-M2). c and d shown qpcr analyses of mrna levels of M1 and M2 marker genes, respectively, of the wounds in WT and MφRIP140KD mice. e In vitro wound healing assay. Data show three experimental results (means±s.d.). Student s t-test (n=3) was used *P<0.05; **P<0.01; ***P<
106 93
107 Fig. 4-3 Preventing RIP140 degradation delays wound healing by inhibiting M1-M2 switch a Daily record of wound closure from mice receiving (via BMT) WT-GFP, WT-RIP140 or Y3F-RIP140 expressing cells. One way ANOVA test was used *P<0.05; **P<0.01 (Ctrl-GFP vs Y3F-RIP140). b FACS analyses of M1 and M2 populations in the wounds. The results show the number of M1 and M2 populations normalized to the wound mass (cell numbers per mg). c and d show qpcr analyses of mrna levels of M1 and M2 marker genes, respectively, of the wounds. Data show three experimental results (means±s.d.). Student s t-test (n=3) was used *P<0.05; **P<0.01; ***P<0.001 (WT- RIP140 vs Y3F-RIP140). 94
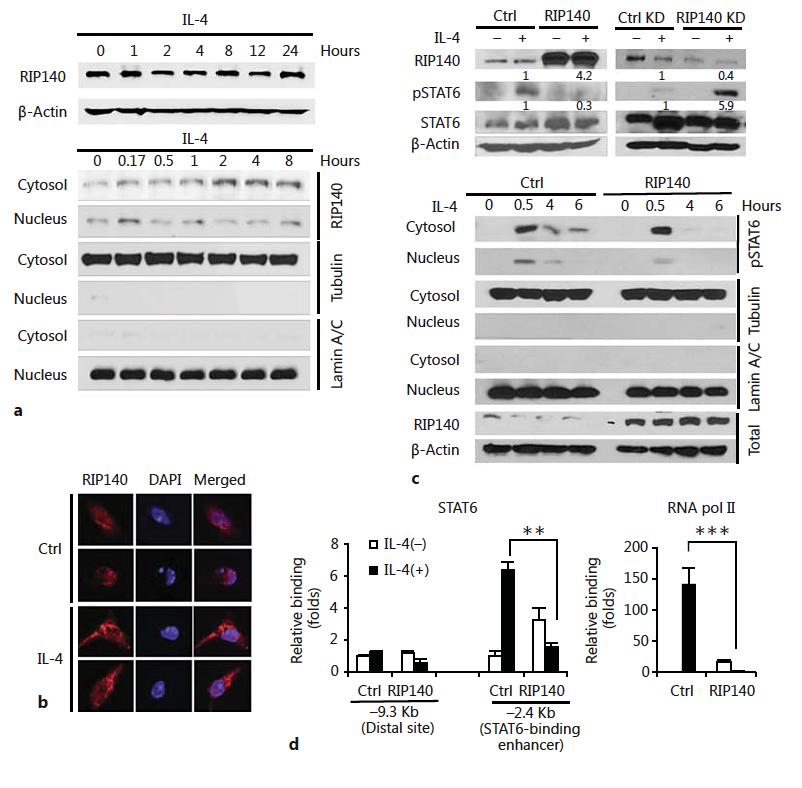
108 95
109 Fig. 4-4 RIP140 translocates to the cytosol and suppresses M2 marker gene expression via reducing STAT6 phosphorylation. a Western blot analyses of endogenous RIP140 from total cellular extracts (top) and the nuclear and cytosolic fractions (bottom) in IL-4- treated RAW264.7 cells. b Immunofluorescence analyses of endogenous RIP140 (red) in IL-4-treated RAW264.7 cells. c Western blot analyses of phospho-stat6 (pstat6) and STAT6 protein from total cellular extracts from RIP140-overexpression (RIP140) or - knockdown (RIP140 KD) RAW264.7 cells, with or without IL-4 treatment (top). Western blot analyses of pstat6 and STAT6 protein from the nuclear and cytosolic fractions (bottom) in RIP140 overexpressed RAW264.7 cells with time-course IL-4 treatment. d ChIP assay of STAT6 and RNA pol II binding on endogenous Arg1 promoter, in the distal region without STAT6 binding sites and the -2.4 kb region containing the STAT6 binding site, in IL-4-treated RAW264.7 cells. IL-4 was treated with 10ng/ml for 6hr (ctop, b and d). Data show three experimental results (means±s.d.). Student s t-test (n=3) was used (*P<0.05; **P<0.01; ***P<0.001). 96
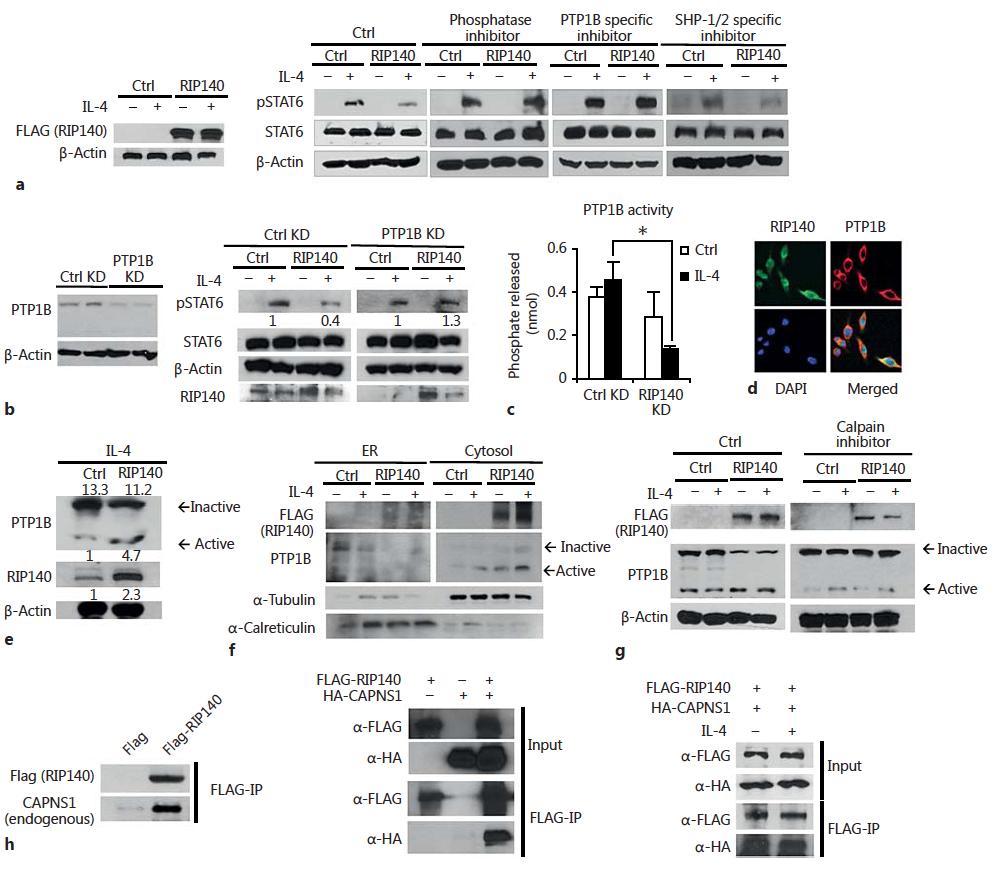
110 97
111 Fig. 4-5 RIP140 suppresses STAT6 phosphorylation by targeting Calpain 1/2 to activate PTP1B phosphatase. a Western blot analyses of pstat6 and STAT6 protein in IL-4- treated control vs. RIP140-overexpressing (left) RAW264.7 cells. Cells were pretreated with a general phosphatase inhibitor, PTP1B specific inhibitor or SHP-1/2 specific inhibitor before IL-4 stimulation (10ng/ml), and analyzed with specific antibodies. b Western blot analyses of PTP1B protein expression in RAW264.7 cells treated with control or PTP1B knockdown shrna (left). Western blot analyses of pstat6 and STAT6 protein in IL-4-treated control or RIP140-overexpressing RAW264.7 cells after control or PTP1B knockdown (right). c PTP1B phosphatase activity in RAW264.7 cells treated with control or RIP140 knockdown, and with or without IL-4 treatment. d Immunofluorescence analyses of RIP140 (green), PTP1B (red) and DAPI (blue) in IL-4- treated RAW264.7 cells. e Western blot analyses of PTP1B peptides in control or RIP140-overexpressing PM with IL-4 treatment. f Western blot analyses of FLAG- RIP140, PTP1B, Tubulin and Calrecticulin in ER and cytosolic fractions of RAW264.7 cells treated with control or IL-4, and with or without RIP140-overexpressing. g Western blot analyses of PTP1B in PM treated with control or IL-4, and with or without RIP140- overexpressing, and in the presence (right) or absence (left) of calpain inhibitor. h Coimmunoprecipitation (Co-ip) of Flag-RIP140 and endogenous calpain regulatory subunit (CAPNS1) in IL-4-treated RAW264.7 cells (left). Co-ip of Flag-RIP140 and HA- CAPNS1 in 293TN cells (middle). Co-ip of Flag-RIP140 and HA-CAPNS1 in RAW264.7 cells with or without IL-4 (10ng/ml) treatment (right). Data show three 98
112 experimental results (means±s.d.). Student s t-test (n=3) was used (*P<0.05; **P<0.01; ***P<0.001). 99

113 Fig. S4-1 RIP140 expression in PM transfected with WT or Y3F mutant RIP140 followed by control or LPS stimulation. Protein and mrna level were analyzed by western blotting and qpcr. Fig. S4-2 Knockdown efficiency. The expression level of RIP140 protein (left) and mrna (right) in WT and MφRIP140KD mice. 100
114 Fig. S4-3 Altering RIP140 levels affects IL4-induced M2 activation. a qpcr analyses of M2 gene expression in control vs. RIP140 over-expressing (left) or RIP140-knockdown (right) mouse PM, with or without IL-4 stimulation. b Arginase activity assay. Data are presented as urea concentrations, and show three experimental results (means±s.d.). Student s t-test (n=3) was used (*P<0.05; **P<0.01; ***P<0.001). 101
 or RIP140- knockdown (RIP140siRNA).")
115 Fig. S4-4 In vitro wound healing assay. In vitro wound healing was assessed using 293TN cells supplemented with conditioned medium of macrophage with RIP140 over-expression (Flag-RIP140) or RIP140- knockdown (RIP140siRNA). IL-4 was used to trigger M2 polarization of macrophages whereas Ctrl denotes treatment with a control solution without cytokine. Fig. S4-5 Bone marrow transplantation efficiency validation. GFP intensity in bone marrow cells of the receiving mice following BMT with cells carrying either Ctrl-GFP, WT-RIP140 or Y3F-RIP
 treated RAW264.7 cells.")
116 Fig. S4-6 Non-degradable mutant RIP140 (RIP140-Y3F) can also translocate to the cytosol in macrophages upon IL-4 treatment. a Western blot analyses of FLAG-RIP140 Y3F from total cell lysate in IL-4 (10ng/ml) treated RAW264.7 cells. b Western blot analyses of FLAG-RIP140 Y3F from the cytosolic/nuclear fractions of IL-4 (10ng/ml) treated RAW264.7 cells. Data show three experimental results. 103
 treated RAW264.7 cells.")
117 Fig. S4-7 Endogenous RIP140 translocates to the cytosol in macrophages upon IL-13 treatment. a Western blot analyses of endogenous RIP140 from total cell lysate in IL-13 (10ng/ml) treated RAW264.7 cells. b Western blot analyses of RIP140 from the cytosolic/nuclear fractions of IL-13 (10ng/ml) treated RAW264.7 cells. Data show three experimental results. 104
 control vs. RIP140 knockdown RAW264.")
118 Fig. S4-8 RIP140 knockdown still increases pstat6 levels in macrophages treated with kinase inhibitor, but fails to affect PTP1B gene expression. a Western blot analyses of phospho-stat6 and STAT6 levels in IL-4-treated (10ng/ml) control vs. RIP140 knockdown RAW264.7 cells, with or without pretreatment with kinase inhibitor Staurosporine (50ng/ml). b qrt-pcr analyses of RIP140 and PTP1B mrna levels in control (flag) vs. RIP140-overexpressing RAW264.7 cells with or without IL-4 treatment (10ng/ml, 6hr). Data show three experimental results (means±s.d.). Student s t-test (n=3) was used (*P<0.05; **P<0.01; ***P<0.001). 105
119 Preface This chapter has been published Yi-Wei Lin*, Emmanuel Montassier*, Dan Knights, and Li-Na Wei (2016) Gut microbiota from metabolic disease-resistant, macrophage-specific RIP140 knockdown mice improves metabolic phenotype and gastrointestinal integrity. Scientific Reports 6: PMID: *These authors contributed equally to this work. YWL. and EM designed the experiments, analyzed the data, and performed the experiments. DK and LNW. designed the experiments, analyzed the data, LNW provided financial support and is the guarantor of this work and, as such, had full access to all the data in the study and takes responsibility for the integrity of the data and the accuracy of the data analysis. 106
120 Chapter V Gut microbiota from metabolic disease-resistant, macrophage-specific RIP140 knockdown mice improves metabolic phenotype and gastrointestinal integrity 107
121 Introduction Metabolic syndrome, including obesity, high blood pressure, hyperglycemia, high levels of serum triglyceride level, and low level of high-density lipoprotein (HDL), presents a serious health condition associated with metabolic diseases such as type 2 diabetes and cardiovascular diseases [24]. Recent studies have demonstrated that intestinal homeostasis, harmonious interactions between the microbiota and the host immune system, is critical to the maintenance of normal physiology, metabolism and immune regulations [133, 134], and that the gut microbiota are involved in the development of numerous diseases [135]. The diversity and composition of intestinal microbiota could be altered by the host s diet and/or genome, and is associated with the host s systemic and local inflammatory responses that are critically important in the development of metabolic diseases [ ]. Manipulation of the gut microbiota by fecal microbiota transplantation (FMT) has been applied in various disease models and clinical trials, such as inflammatory bowel diseases (IBD), Clostridium difficile infection (CDI) and neurodevelopmental disorders[ ]; however, the specific taxonomic repertoire for protection, particularly under a disease-prone condition such as high fat diet (HFD) feeding, has never been identified. Further, the underlying mechanism remains elusive. Receptor interacting protein 140 (RIP140, also known as NRIP1) is a widespectrum nuclear coregulator involved in various biological processes leading to diseases [42, 53]. Specifically related to metabolic regulation where inflammation plays a key role, 108
122 RIP140 is a critical regulator of innate immunity, mediated by its functions in macrophage polarization. RIP140 is a M1 activator by co-activating NF-κB [65], and a M2 repressor through suppressing STAT6 [143]. We previously generated mice with macrophage-specific knockdown of RIP140 (MφRIP140KD) [65] where the M2 macrophage population is dramatically expanded and the M1 macrophage population is reduced. These mice are protected against endotoxin shock [65] and HFD-induced metabolic diseases [121, 144], and exhibit improved wound healing [143]. Further, their local innate immunity, such as anti-inflammatory potential in adipose tissues, is dramatically improved [121, 145]. We therefore speculated possible beneficial shifts in their gut microbiota and intestinal innate immune status, and tested the potential to transfer, via FMT, their protective phenotype to recipient wild type (WT) animals also under HFD feeding. We first determined the repertoire of intestinal microbiota affected by genotype, i.e., MφRIP140KD mice vs. WT mice, and then carried out FMT, reciprocally, to validate efficacy of the transfer of gut microbiota. We found that FMT, from MφRIP140KD to WT, transferred not only the specific taxonomic repertoire of MφRIP140KD to WT recipient but also their intestinal innate immune feature (elevated M2 anti-inflammatory population) and tissue integrity. Both of these transferred features are associated with protection against HFD-induced metabolic abnormality in recipient animals. This study defines a specific taxonomic repertoire that confers protection against diet-induced metabolic diseases, and validates the efficacy of FMT in treating metabolic syndrome. 109
123 The study also suggests a protective mechanism via transferring microbiome-associated intestinal innate immunity and tissue integrity. Materials and Methods Animals and FMT procedure Male C57Bl/6 mice were purchased from the Jackson Laboratory and maintained in the animal facility of University of Minnesota on a 12-h light/dark photocycle. All animal studies were approved and conducted according to guidelines of the University of Minnesota Institutional Animal Care and Use Committee. MφRIP140KD transgenic mice were generated as described before[65]. For experiments in Fig. S5-1A, 18 WT and 18 MφRIP140KD mice were used. For FMT experiments, we adopted a commonly used FMT experimental design where three individually housed animals had been used per group [ ]. The procedure is descried as following. Briefly, eight-week-old male mice (6 WT and 6 KD) were housed individually and fed a high fat diet containing 60% calories from fat and 345 mg cholesterol/kg (F3282; Bio-Serv, West Chester, PA). After 7-weeks HFD feeding, feces was collected and stored for microbiome analyses and FMT later (pre-fmt samples). Fresh ampicillin solution (0.5g/L) was added in drinking water every 3 days for a week[152]. FMT was then performed using pre-fmt samples, daily for three days, starting from 8-weeks of HFD feeding (one week post antibiotics treatment). Fecal samples were then collected, one week after FMT, for four more weeks. Metabolic measurement (see later) was performed. Animals were then sacrificed for 110
124 collecting blood, colons and visceral white adipose tissues. Detailed sequence analyses and statistical analyses were provided in supplemental information. 16S rrna gene amplification and sequencing Fecal samples were kept frozen at -80 C until they were processed. After fecal DNA isolation (MoBio, Carlsbad, CA fecal DNA kit), amplicons spanning the variable region 4 of bacterial 16S rrna were generated and sequenced using Illumina Mi-seq platform at the University of Minnesota Genomic Center, Twin Cities, MN. The 16S rrna sequencing data from the Illumina runs were trimmed and chimera filtered using Quantitative Insights Into Microbial Ecology (QIIME) [153] with default parameters which include several quality filtering steps for sequence lengths, endtrimming, and minimum quality score. We performed operational taxonomic units (OTUs) assignment using NINJA-OPS against the Greengenes 13.8 database as a reference [154]. Hematoxylin and Eosin (H&E) Staining After mice were sacrificed, colon tissues were fixed, embedded in paraffin, sectioned and stained as described previously [121]. Images were taken and analyzed by Zeiss Axioplan 2 Upright Microscope in University Imaging Centers in U. of Minnesota. Hemotoxylin and eosin staining kit was purchased from Fisher Scientific. 111
125 Metabolic Measurement Indirect calorimetry was performed as described previously[121] to measure volumetric oxygen consumption (vo 2 ) on mice. Briefly, animals were housed in individual chambers with free access to food and water in a 12-h light/dark cycle. vo 2 was recorded and normalized to body weight using Oxymax (Columbus Instrument, Columbus OH.) Glucose tolerance test (GTT) and insulin tolerance test (ITT) GTT and ITT were performed after overnight fasting. Animal baseline blood samples were collected. D glucose (2 g/kg) or insulin (0.75 units/kg) was i.p. injected into animals. Blood glucose levels were measured at indicated time points with a glucometer (OneTouch Ultra). Gut permeability assay In vivo gut permeability assay was performed as described previously [155]. Briefly, mice were fed 0.6 mg/g FITC-labeled dextran (Sigma) after fasting for 5 hrs. Serum samples were collected at indicated time points and analyzed (485nm/535nm) using a microplate reader (Tecan Infinite M100 pro). RNA isolation and quantitative real-time PCR RNA was isolated using Trizol. Reverse transcription was performed using a High-Capacity cdna Reverse Transcription Kit containing RNase Inhibitor (Applied 112
126 Biosystems). Quantitative real-time PCR (qpcr) was carried out with Maxima SYBR Green qpcr Master Mixes (Thermo Scientific) as described previously [144]. Primers for Tnfα (QT ), Arg1 (QT ), Ucp1 (QT ) and Cd137 (QT ) were purchased from Qiagen.. Each analysis was performed triplicate and normalized to β-actin. Flow Cytometry Fc Block (20 mg/ml; BD Biosciences) was used to block cell-surface antigens. After blocking cells were stained with fluorophore conjugated antibodies or isotype control antibodies. Fluorophore-conjugated primary antibodies were purchased from BioLegend: F4/80-Alexa Fluor 488, CD11b-PerCP/Cy5.5, CD11c-phycoerythrin, and CD206-Alexa Fluor 647. After incubation with antibodies, cells were washed and centrifuged, re-suspended in a washing buffer, and analyzed on a FACSCalibur using FlowJo Results Genotype alters the composition and functional repertoire of intestinal microbiota We first confirmed that HFD affected the composition of the gut microbiota (Fig. S5-1A). Interestingly, when comparing the effect of genotype, we found that the effect was most profound under HFD feeding, based on 16s rrna sequences of unweighted UniFrac distance metric (Fig. 5-1A, S5-1B and S5-1C) (PERMANOVA, p = 0.04). Moreover, supervised learning using Random Forests, a machine learning method using 113
127 OTUs as predictive features, accurately assigned samples to their source population based on taxonomic profiles at the OTU level (83.3% accuracy, 3 times better than the baseline error rate for random guessing). Using LEfSe [156], we found that 6 genera were significantly different between WT and MφRIP140KD mice fed a HFD (LDA log10 score >2). Specifically, MφRIP140KD profile was associated with a significant gain in Odoribacter, Coprococcus, Lautropia, Luteimonas, Candidatus Arthromitus and Pseudomonadaceae when compared to WT mice. (Fig 5-1B, S5-1D). We then constructed a KD microbiome index from this panel of taxa that highly differentiated between WT and MφRIP140KD mice under HFD. This KD index corresponded to the sum of relative abundances of the 6 differentiating taxa. We found that the median KD index was 0.30 (IQR= 0.05) in MφRIP140KD mice and 0.17 (IQR= 0.01) in WT mice (Mann-Whitney U test, p= 0.002) (Fig. 5-1C, right panel). Moreover, ROC curve analysis showed that our KD index was a strong predictor of the genotype, with an area under the curve of 0.91 (Fig. 5-1D). In order to determine the KD index threshold that best predicts genotype, we performed leave-one-out cross-validation on our KD indices. Each held-out KD index was treated as a new sample, independently from the initial cohort, on whom we tested and subsequently refined the optimal index cutoff to separate WT and MφRIP140KD. This Leave-one-out (LOO) cross-validation procedure demonstrated that the taxon panel was able to predict the genotype in a new sample, with an accuracy of 83% at a specificity of 80%. Thus, our LOO analysis predicted genotype with reasonable accuracy and identified 114
128 taxa associated with resistance to diet induced metabolic diseases that can serve as future biomarkers. These data demonstrated that genotype, that is WT vs. MφRIP140KD profile, is strongly associated with a specific taxonomic repertoire in mice fed a HFD and that only 6 taxa can be used to predict the genotype of a mouse Using PICRUSt [157], we found that the gut microbiota functional repertoire is significantly different between WT and MφRIP140KD mice. This algorithm estimates the functional potential of microbial communities given the current 16S rrna gene survey and a set of currently sequenced reference genomes. PICRUSt predictions in human and mouse gut microbiomes are expected to have 80-90% accuracy. First, beta-diversity plots generated from Bray Curtis distance matrices showed a separation between WT and MφRIP140KD mice fed a HFD (PERMANOVA, p = 0.041) (Fig. 5-1E). Moreover, supervised learning using Random Forests, with the predicted metagenome table collapsed at level 3 KEGG Orthology groups as predictive features, accurately assigned samples to their source population based on predicted metagenomic profiles (75% accuracy, 2 times better than the baseline error rate for random guessing). We also identified significant differences in microbial functional pathways in the fecal samples of WT and MφRIP140KD mice fed a HFD (level 3 KEGG Orthology groups, Mann- Whitney U test, False Discovery Risk corrected p-value <0.20). The fecal microbiome of MφRIP140KD mice is enriched in functional categories associated with fatty acid metabolism, lysine, valine, leucine and isoleucine degradation, caprolactam degradation, styrene and atrazine degradation, and depleted in categories associated with galactose 115
129 metabolism, purine metabolism, cysteine and methionine metabolism, D-Glutamine and D-glutamate metabolism, nicotinate and nicotinamide metabolism, amino sugar and nucleotide sugar, thiamine metabolism and primary bile acid biosynthesis (Table S5-1). Using CAZY GH assignments, we found that 5 glycoside hydrolase families were increased in MφRIP140KD mice as compared to WT mice, including GH17, PL5, GT4, GT9 and AA1, whereas 10 glycoside hydrolase families showed a loss of abundance in KD mice as compared to WT mice, including GT14, GH36, GH3, GH18, GH115, GH78, GH65, GH130, GT32 and GH127 (LDA score (log10) >2) (Fig. 5-1F)Together, these findings demonstrate that, in addition to a change in taxonomy, the genotype is associated with marked change in functional profile and glycoside hydrolase repertoire in animals fed a HFD. Fecal microbiota transplantation transfers gut microbiota from donor to recipient mice Our previous studies showed that MφRIP140KD mice are resistant to dietinduced metabolic diseases[144, 158]. Since gut microbiota are strongly associated with hosts health, we proposed that gut microbiota in MφRIP140KD mice could be associated with their metabolic protection features particularly under HFD. We thus performed reciprocal FMTs, from WT or MφRIP140KD fed a HFD into WT or MφRIP140KD mice in four groups: WT WT (WT receiving WT), KD WT (WT receiving KD), 116
130 WT KD (KD receiving WT) and KD KD (KD receiving KD). The experimental design is depicted in Fig. 5-2A. To first validate FMT efficiency, we examined changes in the diversity of recipient KD mice receiving FMT from donor WT mice (WT KD). Unweighted UniFrac based PCoA showed differences between fecal samples collected from recipient MφRIP140KD mice before FMT (i.e. native MφRIP140KD mice) and four weeks after FMT (WT KD) (PERMANOVA, p = 0.04), but did not show significant differences between fecal samples of WT KD mice four weeks after FMT and native WT mice (PERMANOVA, p = 0.19). Moreover, fecal samples of recipient MφRIP140KD mice after FMT (WT KD) differed in terms of overall diversity when comparing to fecal samples of native MφRIP140KD mice (PERMANOVA, p = p 0.048), but did not differ when comparing to fecal samples of native WT mice (PERMANOVA, p = 0.192) (Fig. 5-2B, left panel). We also examined changes in diversity of recipient WT mice receiving FMT from donor MφRIP140KD mice (KD WT). Unweighted UniFrac PCoA showed differences between fecal samples of recipient WT mice before FMT (i.e. native WT mice) and four weeks after FMT (KD WT) (PERMANOVA, p = 0.02), but did not show significant differences between fecal samples of KD WT mice and native MφRIP140KD mice (PERMANOVA, p = 0.06). Moreover, fecal samples of recipient WT mice after FMT (KD WT) differed in terms of diversity when comparing to fecal samples of native WT mice (PERMANOVA, p = p 0.043), but did not differ when 117
131 comparing to fecal samples of native MφRIP140KD mice (PERMANOVA, p = 0.071) (Fig. 5-2B, right panel). Using the KD microbiome index described above, we found that WT KD mice acquired a WT fecal microbiota signature; KD WT mice acquired a KD fecal microbiota signature. The KD index differed between native MφRIP140KD mice (i.e. fecal sample collected before FMT) and WT KD mice post FMT (MWU test, p = 0.012) but the KD index did not differ between native WT mice and WT KD mice post FMT (MWU test, p = 0.28) (Fig. 5-2C, left panel). Following the same trend, the KD index differed between native WT mice (i.e. fecal sample collected before FMT) and KD WT mice post FMT (MWU test, p = ) but the KD index did not differ between native KD mice and KD WT mice post FMT (MWU test, p = 0.28) (Fig. 5-2C, right panel). To further explore this trend, we performed Bayesian source tracking on each of the post FMT fecal samples. This allows us to estimate the contribution of bacteria from the native WT mice, native MφRIP140KD mice or from unknown sources (one or more sources absent from the training data) in the post FMT samples. We found that the fecal samples of WT KD mice were dominated by bacteria, predicted genes or CAZY GH of native WT mice (Fig. 5-2D, left panel); on the other hand, fecal samples of KD WT mice were dominated by bacteria, predicted genes or CAZY GH of native MφRIP140KD mice (Fig. 5-2D, right panel). 118
132 Based on these findings, we conclude that WT KD mice post FMT acquired the microbiota signature of the WT genotype and KD WT mice acquired that of the KD genotype. Healthy gut microbiota ameliorate diet-induced metabolic syndrome. To determine if gut microbiota from MφRIP140KD mice could benefit recipient mice under HFD, we performed a series of metabolic tests on post-fmt mice. MφRIP140KD typically have elevated anti-inflammatory activities in their adipose tissues [121, 159]. We therefore first examined if adipose innate immunity was affected by FMT. It appeared that mice receiving FMT from MφRIP140KD mice (KD WT) indeed have reduced M1 inflammatory marker (Tnfα) and elevated level of M2 antiinflammatory marker (Arg1) in white adipose tissue (Fig. 5-3A). Furthermore, these mice express stronger beige (Cd137) and brown (Ucp1) fat markers (Fig. 5-3B). Mice receiving FMT from KD mice (KD WT or KD KD) were resistant to HFD-induced weight gain and insulin resistance compared to mice receiving FMT from WT mice (WT WT or WT KD) (Fig. 5-3C, Fig. S5-2). KD WT mice show a higher rate of energy expenditure (O 2 consumption) in both the light and dark phases (Fig. 5-3D). Taken together, our data show that FMT could transfer not only the good gut microbiota, but also the HFD-resistant, protective phenotype of the donor, MφRIP140KD. To gain insights into the possible mechanism, we examined the innate immune potential and tissue integrity of the gastrointestinal (GI) tract, because gut microbiota 119
133 make direct contact with GI tract, affecting the microenvironment. We first monitored intestinal permeability (Fig. 5-4A) and found that both KD WT and KD KD mice have decreased intestinal permeability, indicating that they are less susceptible to lowgrade inflammation that could contribute to the development of metabolic syndrome [160]. These mice also exhibit fewer pathological features in the colon, with apparently decreased hyperplasia (Fig. 5-4B). In terms of local (intestinal) innate immunity as monitored by M1 vs. M2 ratio (Fig. 5-4C), these mice have elevated M2 and lowered M1 markers and a reduced M1/M2 ratio indicative of improved anti-inflammation in the GI tract. Discussion Our study is the first to identify microbiota-associated biomarkers that correlate with protection against diet-induced metabolic syndrome. The study also uncovers a specific taxonomic repertoire in mice with an elevated anti-inflammatory potential under HFD feeding, and validates the efficacy of FMT to transfer protection against HFDinduced metabolic diseases. The study also elucidates the mechanism involving augmentation in GI innate immune status and its tissue integrity. Several taxa associated with MφRIP140KD mice were previously found protective against insulin resistance or dyslipidemia. Thus our findings of specific intestinal microbiota enriched in MφRIP140KD mice are consistent with a proposed role in glucose homeostasis for these commensal bacteria. In the present study, we found the 120
134 specific taxonomic repertoire consists of 6 genera of bacteria enriched in MφRIP140KD mice, which are correlated with resistance to diet-induced metabolic syndrome: Odoribacter, Coprococcus, Lautropia, Luteimonas, Candidatus Arthromitus and Pseudomonadaceae. Odoribacter splanchnicus was previously reported to be associated with a healthy fasting serum lipid profile, defined as a positive correlation with HDL cholesterol and a negative correlation with total- or LDL cholesterol. Importantly, Odoribacter splanchnicus was also positively correlated with HbA1c [161]. Another study reported that eradicating Candidatus arthromitus in the mouse gut microbiota resulted in metabolic changes that led to obesity [162]. A study also showed that noncaloric artificial sweeteners drove the development of glucose intolerance through induction of compositional and functional alterations to the intestinal microbiota including a decrease in Candidatus arthromitus [163]. Moreover, a study in humans reported a substantial reduction in abundance of Coprococcus in obese and nonalcoholic steatohepatitis (NASH) subjects as compared to healthy subjects [164]. Furthermore, Pseudomonadaceae was found increased in zebrafish larvae following probiotic supplementation that resulted in a down-regulation of the expression of genes that decrease glucose levels in the blood [165]. Thus the presence of some taxa could be helpful in assessing risk of developing diet-induced metabolic syndrome. In addition, we found suggestive evidence that microbiota-associated functional modules are significantly different between WT and MφRIP140KD mice using PICRUSt. Importantly, several of the KEGG modules differentiating WT and MφRIP140KD mice 121
135 are implicated in lipid and glucose metabolism. Nicotinamide, found depleted in MφRIP140KD, was previously reported to be involved in the development of type 2 diabetes, through an increase in reactive oxygen species, subsequent oxidative stress and insulin resistance [166]. Purine, found depleted in MφRIP140KD mice, could modulate insulin sensitivity and was associated with the development of diabetic microvascular complication [167]. D-Glutamine and D-glutamate metabolism, found depleted in MφRIP140KD mice, was found strongly associated with insulin resistance in a previous study in humans [168]. Other investigations have highlighted associations of branchedchain amino acids (i.e., isoleucine, leucine, and valine) with obesity, impaired glucose tolerance, and insulin resistance, which is consistent with our findings that isoleucine, leucine, and valine degradation pathways are enriched in MφRIP140KD mice [ ]. Valine, of which degradation module was found increased in MφRIP140KD mice, was associated with insulin resistance [172]. Cysteine and methionine metabolism, found decreased in MφRIP140KD mice, were also previously associated with obesity and insulin resistance. In mice, cysteine intake decreases glucose tolerance, with upregulation of lipogenic and diabetogenic enzymes that induce fat gain [173]. In humans, increased plasma total cysteine was associated with obesity and insulin resistance [174, 175]. A study in rats showed that long-term exposure to atrazine caused obesity in those fed a HFD, leading to diabetes. This is also consistent with our findings that styrene and atrazine degradation are enriched in MφRIP140KD mice [176]. Furthermore, amino sugar and nucleotide sugar metabolism, found decreased in MφRIP140KD mice, was reported to have a direct linkage with diabetes and metabolic syndrome [177]. 122
136 We also found that several glycoside hydrolase families are correlated with MφRIP140KD mice and protection against diet-induced metabolic syndrome. GH18, found decreased in MφRIP140KD mice was reported to be a biomarker for endothelial dysfunction, atherosclerosis, insulin resistance, and Type 2 Diabetes Mellitus [178, 179]. Thus the presence of some microbiota-associated glycoside hydrolase families could also assess risk in developing diet-induced metabolic syndrome. We also demonstrated here that FMT can be performed reciprocally and effectively. WT mice receiving FMT from MφRIP140KD mice acquired the MφRIP140KD phenotype, and MφRIP140KD mice receiving FMT from WT mice acquired the WT phenotype. Using Bayesian source tracking [180], we showed that the taxonomy and functional modules associated with MφRIP140KD were transferred to WT mice, suggesting that commensal bacteria and microbiota-associated modules correlated with resistance to diet-induced metabolic syndrome are substantially transferred to the diseased animals and augment disease outcome. Mechanistically, we found that FMT effectively transferred the protective innate immune phenotype (enhanced M2, antiinflammatory potential) of the donor animals to the recipients under HFD, which also is associated with the improved GI tissue integrity in the recipients (Fig. 4C). These results provide a proof-of-concept that innate immunity affects gut microbiota, and vise versa, and that the protection can be effectively transferred by FMT. How microbiota affects host innate immunity, either systemically or locally, remains to be examined. 123
137 A small, randomized, double-blind controlled study showed that FMT, using stool from lean donors, significantly improves insulin sensitivity in obese male individuals, with butyrate-producing intestinal bacteria increasing in intestinal samples [139]. Our results validate the therapeutic efficacy of FMT from animals resistant to diet-induced metabolic syndrome, particularly those with improved innate immunity. 124
138 Figures 125
139 Fig. 5-1 Macrophage RIP140 level alters the composition and functional repertoire of intestinal microbiota (A) Beta diversity comparisons of the gut microbiomes of the fecal samples collected from WT and MφRIP140KD mice receiving High Fat Diet. Analyses were performed on 16S rrna V4 regions data with a rarefaction depth of reads per sample. Principal coordinates analysis of Unweighted UniFrac distances. Proportion of variance explained by each principal coordinate axis is denoted in the corresponding axis label. The plot shows a separation between samples from WT and MφRIP140KD mice receiving High Fat Diet (PERMANOVA, p = 0.04). (B) Summary of the taxa that differentiate WT from MφRIP140KD mice receiving HFD using Linear discriminant analysis Effect Size analysis (LEfSe). (C) Left: KD microbiome index corresponding to the sum of number of genera among the differentiating taxa. Data were presented with Mann Whitney U test: p-value = Right: KD microbiome index corresponding to the total relative abundance of the differentiating taxa. Data were presented with Mann Whitney U test: p-value = (D) ROC curve analysis for KD microbiome index. (E) Beta-diversity plots from Bray-Curtis distance matrices for genome analysis. (F) CAZY GH assignments for glycoside hydrolase families analysis. 126
140 127
141 Fig. 5-2 FMT transfers gut microbiota from donor to recipient. (A) A scheme showing FMT experiment. (B) Left: Unweighted UniFrac based PCoA from MφRIP140KD mice receiving FMT from WT (WT KD) mice. Right: Unweighted UniFrac based PCoA from WT mice receiving FMT from MφRIP140KD (KD WT) mice. (C) Left panel: KD microbiome index in MφRIP140KD mice receiving FMT from WT (WT KD) mice. Right panel: KD microbiome index in WT mice receiving FMT from MφRIP140KD (KD WT) mice. (D) Representative pie chart of Bayesian source-tracking analysis of taxonomy, predicted metagenome and predicted GH of WT KD mice post FMT 4 weeks (left panel) and KD WT mice post FMT 4 weeks (right panel). Source contributions were averaged across samples within the population. WT WT: WT receiving WT, KD WT: WT receiving KD, WT KD: KD receiving WT and KD KD: KD receiving KD. 128
142 129
143 Fig. 5-3 Receiving FMT from MφRIP140KD mice ameliorates diet-induced diabetic traits. (A) qpcr of Tnfa (M1) and Arg1 (M2) in visceral white adipose tissues. Student test (n=3) was used and presented as mean±sd, *P < (B) qpcr of Ucp1 (brown fat) and Cd137 (beige fat) in visceral white adipose tissues. Student test (n=3) was used and presented as mean±sd, *P < 0.05; **P < (C) GTT (left) and ITT (right) determined after 14 weeks of HFD feeding Student test (n=3) was used and presented as mean±sd, *P < 0.05, **P < 0.01 (WT WT vs. KD WT); P < 0.05 (WT KD vs. KD KD). (D) Energy expenditure of FMT mice. O 2 consumption was measured in the dark and light phases and presented as vo 2 (ml/kg/hr) (n=3 in each group). Student test was used and presented as mean±sem. *P < 0.05; **P < 0.01; ***P < (WT WT vs. KD WT), P < 0.05; P < 0.01; P < (WT KD vs. KD KD). 130
144 Fig. 5-4 Receiving FMT from MφRIP140KD mice improves colon health. (A) Serum levels of FITC-dextran in FMT mice. Student test was used and presented as mean±sd. *P < 0.05; **P < 0.01 for comparison of WT WT mice with KD WT mice. P < 0.05 for comparison of WT WT mice with KD WT mice. (n=3 in each group). (B) Representative H&E staining of colon sections. (C) FACS analysis of gut macrophage population in colon. Student test was used and presented as mean±sd. *P < 0.05; **P < (n=3 in each group). 131
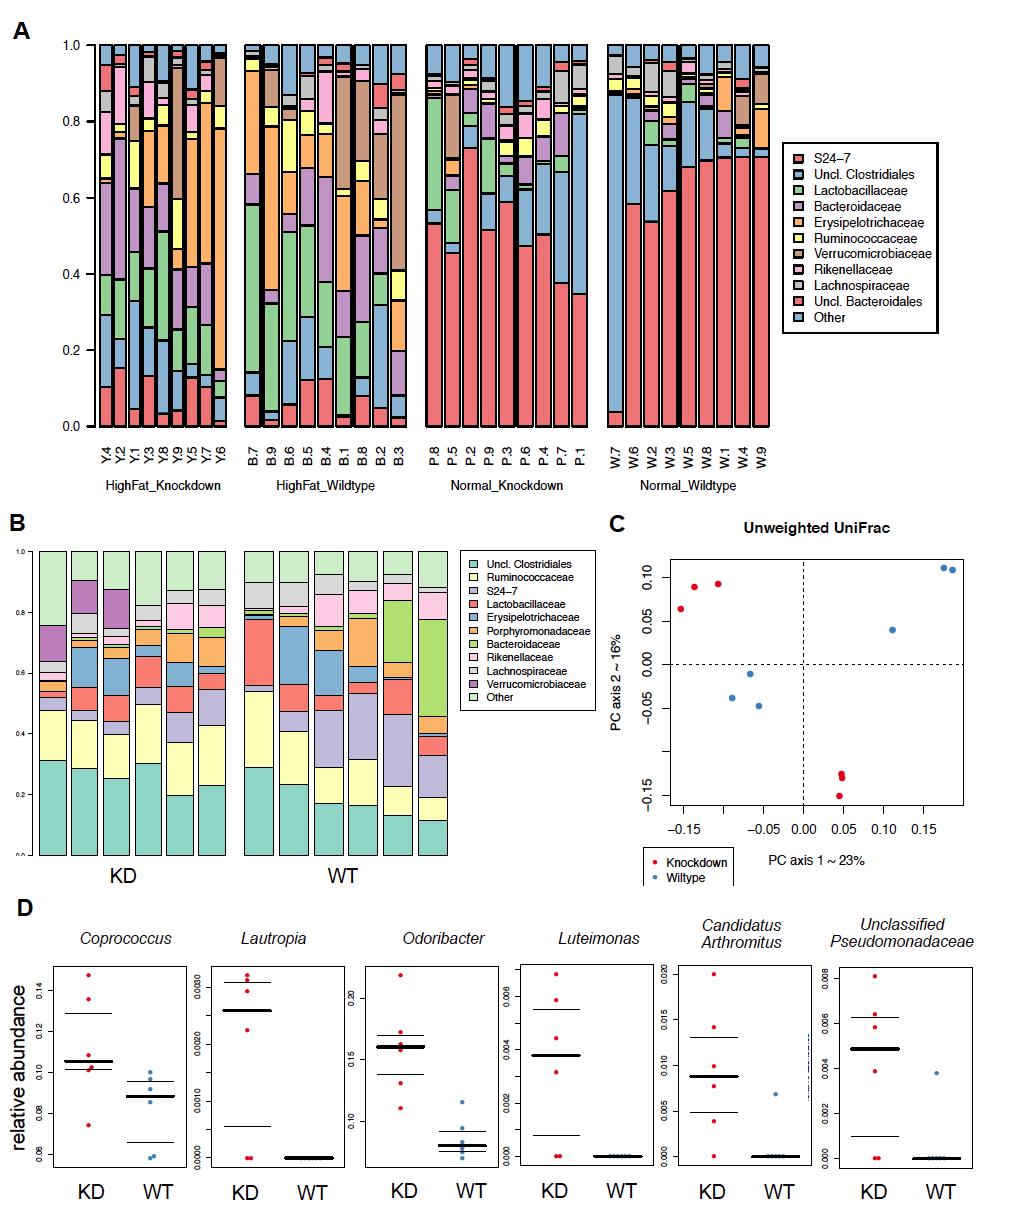
145 132
146 Fig. S5-1 Taxonomic profile of the gut microbiome (A) Taxonomic profile of the gut microbiome of the fecal samples collected from WT and MφRIP140KD mice receiving ND and HFD. Relative taxa abundance plots summarized at family level. Mice are represented along the horizontal axis, and relative taxa frequency is denoted by the vertical axis. (N=9 in each group). (B) Taxonomic profile of the gut microbiome of the fecal samples collected from WT and MφRIP140KD mice receiving HFD. Relative taxa abundance plots summarized at family level. Mice are represented along the horizontal axis, and relative taxa frequency is denoted by the vertical axis. (N=6 in each group). (C) Beta diversity comparisons of the gut microbiomes of the fecal samples collected from wildtype and knockdown mice receiving High Fat Diet. Analyses were performed on 16S rrna V4 regions data with a rarefaction depth of reads per sample. Principal coordinates analysis of Unweighted UniFrac distances with principal coordinates 1 and 2. Proportion of variance explained by each principal coordinate axis is denoted in the corresponding axis label. This plot showed a separation between samples from WT and MφRIP140KD mice receiving High Fat Diet (PERMANOVA, p = 0.04). (D) Relative abundance of the taxa that differentiate WT and MφRIP140KD mice receiving HFD using Linear discriminant analysis Effect Size analysis (LEfSe). 133


147 Table S5-1 Gut microbiome metagenome prediction Gut microbiome metagenome prediction. Black color represents genes increased in WT mice. Red color represents genes increased in MφRIP140KD mice. Fig. S5-2 Body weight of mice Body weight of mice after HFD before sacrifice. Student test was used and presented as mean±sd. *P < 0.05, n=3 in each group. 134
General Laboratory methods Plasma analysis: Gene Expression Analysis: Immunoblot analysis: Immunohistochemistry:
 General Laboratory methods Plasma analysis: Plasma insulin (Mercodia, Sweden), leptin (duoset, R&D Systems Europe, Abingdon, United Kingdom), IL-6, TNFα and adiponectin levels (Quantikine kits, R&D Systems
Quantitative Real-Time PCR was performed as same as Materials and Methods.
 Supplemental Material Quantitative Real-Time PCR Quantitative Real-Time PCR was performed as same as Materials and Methods. Expression levels in the aorta were normalized to peptidylprolyl isomerase B
Supplementary Figure S I: Effects of D4F on body weight and serum lipids in apoe -/- mice.
 Supplementary Figures: Supplementary Figure S I: Effects of D4F on body weight and serum lipids in apoe -/- mice. Male apoe -/- mice were fed a high-fat diet for 8 weeks, and given PBS (model group) or
 Glossary For TheFatNurse s For All Ages Series Adipocytes, also known as lipocytes and fat cells, are the cells that primarily compose adipose tissue, specialized in storing energy as fat. Apolipoprotein
Summary and concluding remarks
 Summary and concluding remarks This thesis is focused on the role and interaction of different cholesterol and phospholipid transporters. Cholesterol homeostasis is accomplished via a tightly regulated
Leptin deficiency suppresses progression of atherosclerosis in apoe-deficient mice
 Leptin deficiency suppresses progression of atherosclerosis in apoe-deficient mice Atherosclerosis, 2007 Chiba T, Shinozaki S, Nakazawa T, et al. Present by Sudaporn Pummoung Apolipoprotein E (apoe( apoe)
Stewart et al. CD36 ligands promote sterile inflammation through assembly of a TLR 4 and 6 heterodimer
 NFκB (fold induction) Stewart et al. ligands promote sterile inflammation through assembly of a TLR 4 and 6 heterodimer a. mrna (fold induction) 5 4 3 2 1 LDL oxldl Gro1a MIP-2 RANTES mrna (fold induction)
Supplementary Figure 1. DNA methylation of the adiponectin promoter R1, Pparg2, and Tnfa promoter in adipocytes is not affected by obesity.
 Supplementary Figure 1. DNA methylation of the adiponectin promoter R1, Pparg2, and Tnfa promoter in adipocytes is not affected by obesity. (a) Relative amounts of adiponectin, Ppar 2, C/ebp, and Tnf mrna
Cytokines modulate the functional activities of individual cells and tissues both under normal and pathologic conditions Interleukins,
 Cytokines http://highered.mcgraw-hill.com/sites/0072507470/student_view0/chapter22/animation the_immune_response.html Cytokines modulate the functional activities of individual cells and tissues both under
SUPPLEMENTARY INFORMATION
 doi:10.1038/nature12652 Supplementary Figure 1. PRDM16 interacts with endogenous EHMT1 in brown adipocytes. Immunoprecipitation of PRDM16 complex by flag antibody (M2) followed by Western blot analysis
Differential inhibition of macrophage foam-cell formation and atherosclerosis in mice by PPARα, β/δ, and γ
 Research article Related Commentary, page 1538 Differential inhibition of macrophage foam-cell formation and atherosclerosis in mice by PPARα, β/δ, and γ Andrew C. Li, 1 Christoph J. Binder, 2 Alejandra
Epigenetic regulation of macrophage polarization and inflammation by DNA methylation in obesity
 Downloaded from http:// on December 17, 2017. https://doi.org/10.1172/jci.insight.87748 Epigenetic regulation of macrophage polarization and inflammation by DNA methylation in obesity Xianfeng Wang, 1
Supplemental Table I.
 Supplemental Table I Male / Mean ± SEM n Mean ± SEM n Body weight, g 29.2±0.4 17 29.7±0.5 17 Total cholesterol, mg/dl 534.0±30.8 17 561.6±26.1 17 HDL-cholesterol, mg/dl 9.6±0.8 17 10.1±0.7 17 Triglycerides,
 Glossary For TheFatNurse s For All Ages Series Apolipoprotein B (APOB or ApoB) are the primary apolipoproteins of chylomicrons and low-density lipoproteins (LDL - known commonly by the misnomer "bad cholesterol"
In The Name Of God. In The Name Of. EMRI Modeling Group
 In The Name Of God In The Name Of God EMRI Modeling Group Cells work together in functionally related groups called tissues Types of tissues: Epithelial lining and covering Connective support Muscle movement
Innate immunity. Abul K. Abbas University of California San Francisco. FOCiS
 1 Innate immunity Abul K. Abbas University of California San Francisco FOCiS 2 Lecture outline Components of innate immunity Recognition of microbes and dead cells Toll Like Receptors NOD Like Receptors/Inflammasome
Intracellular MHC class II molecules promote TLR-triggered innate. immune responses by maintaining Btk activation
 Intracellular MHC class II molecules promote TLR-triggered innate immune responses by maintaining Btk activation Xingguang Liu, Zhenzhen Zhan, Dong Li, Li Xu, Feng Ma, Peng Zhang, Hangping Yao and Xuetao
SUPPLEMENTARY INFORMATION
 SUPPLEMENTARY INFORMATION FOR Liver X Receptor α mediates hepatic triglyceride accumulation through upregulation of G0/G1 Switch Gene 2 (G0S2) expression I: SUPPLEMENTARY METHODS II: SUPPLEMENTARY FIGURES
Supplementary Figure 1. Normal T lymphocyte populations in Dapk -/- mice. (a) Normal thymic development in Dapk -/- mice. Thymocytes from WT and Dapk
 Normal thymic development in Dapk -/- mice. Thymocytes from WT and Dapk") Supplementary Figure 1. Normal T lymphocyte populations in Dapk -/- mice. (a) Normal thymic development in Dapk -/- mice. Thymocytes from WT and Dapk -/- mice were stained for expression of CD4 and CD8.
Supplementary Figure 1. Normal T lymphocyte populations in Dapk -/- mice. (a) Normal thymic development in Dapk -/- mice. Thymocytes from WT and Dapk -/- mice were stained for expression of CD4 and CD8.
Adipose Tissue as an Endocrine Organ. Abdel Moniem Ibrahim, MD Professor of Physiology Cairo University
 Adipose Tissue as an Endocrine Organ Abdel Moniem Ibrahim, MD Professor of Physiology Cairo University Functions of Adipose Tissue Adipose tissue expresses and secretes a variety of bioactive peptides,
Potential Atheroprotective Effects of Ixmyelocel-T Cellular Therapy. Kelly J. Ledford, Nikki Murphy, Frank Zeigler, Ronnda L.
 Potential Atheroprotective Effects of Ixmyelocel-T Cellular Therapy Kelly J. Ledford, Nikki Murphy, Frank Zeigler, Ronnda L. Bartel 1 Ixmyelocel-T, an expanded, autologous multicellular therapy cultured
Innate Immunity II. Integration. Lindsay Nicholson Advanced Immunology L2
 Innate Immunity II Integration Lindsay Nicholson Advanced Immunology L2 l.nicholson@bristol.ac.uk Lecture 1 Defining Innate Immunity Recognition and effector mechanisms (I) Lecture 2 Recognition and effector
GPR120 *** * * Liver BAT iwat ewat mwat Ileum Colon. UCP1 mrna ***
 a GPR120 GPR120 mrna/ppia mrna Arbitrary Units 150 100 50 Liver BAT iwat ewat mwat Ileum Colon b UCP1 mrna Fold induction 20 15 10 5 - camp camp SB202190 - - - H89 - - - - - GW7647 Supplementary Figure
Question 1. Kupffer cells, microglial cells and osteoclasts are all examples of what type of immune system cell?
 Abbas Chapter 2: Sarah Spriet February 8, 2015 Question 1. Kupffer cells, microglial cells and osteoclasts are all examples of what type of immune system cell? a. Dendritic cells b. Macrophages c. Monocytes
Serum Amyloid A3 Gene Expression in Adipocytes is an Indicator. of the Interaction with Macrophages
 Serum Amyloid A3 Gene Expression in Adipocytes is an Indicator of the Interaction with Macrophages Yohei Sanada, Takafumi Yamamoto, Rika Satake, Akiko Yamashita, Sumire Kanai, Norihisa Kato, Fons AJ van
Supplementary Materials for
 www.sciencesignaling.org/cgi/content/full/8/407/ra127/dc1 Supplementary Materials for Loss of FTO in adipose tissue decreases Angptl4 translation and alters triglyceride metabolism Chao-Yung Wang,* Shian-Sen
SUPPLEMENTARY DATA. Supplementary Table 1. Primers used in qpcr
 Supplementary Table 1. Primers used in qpcr Gene forward primer (5'-3') reverse primer (5'-3') β-actin AGAGGGAAATCGTGCGTGAC CAATAGTGATGACCTGGCCGT Hif-p4h-2 CTGGGCAACTACAGGATAAAC GCGTCCCAGTCTTTATTTAGATA
ROMANIAN ACADEMY INSTITUTE OF CELLULAR BIOLOGY AND PATHOLOGY NICOLAE SIMIONESCU. PhD THESIS Summary
 ROMANIAN ACADEMY INSTITUTE OF CELLULAR BIOLOGY AND PATHOLOGY NICOLAE SIMIONESCU PhD THESIS Summary INVOLVEMENT OF ALARMIN HMGB1 IN INFLAMMATORY PROCESSES ASSOCIATED WITH VASCULAR DYSFUNCTION IN HYPERLIPIDEMIA
Males- Western Diet WT KO Age (wks) Females- Western Diet WT KO Age (wks)
 Females- Western Diet WT KO Age (wks)") Relative Arv1 mrna Adrenal 33.48 +/- 6.2 Skeletal Muscle 22.4 +/- 4.93 Liver 6.41 +/- 1.48 Heart 5.1 +/- 2.3 Brain 4.98 +/- 2.11 Ovary 4.68 +/- 2.21 Kidney 3.98 +/-.39 Lung 2.15 +/-.6 Inguinal Subcutaneous
Relative Arv1 mrna Adrenal 33.48 +/- 6.2 Skeletal Muscle 22.4 +/- 4.93 Liver 6.41 +/- 1.48 Heart 5.1 +/- 2.3 Brain 4.98 +/- 2.11 Ovary 4.68 +/- 2.21 Kidney 3.98 +/-.39 Lung 2.15 +/-.6 Inguinal Subcutaneous
Taylor Yohe. Project Advisor: Dr. Martha A. Belury. Department of Human Nutrition at the Ohio State University
 Atherosclerosis Development and the Inflammatory Response of Hepatocytes to Sesame Oil Supplementation Taylor Yohe Project Advisor: Dr. Martha A. Belury Department of Human Nutrition at the Ohio State
SUPPLEMENTARY INFORMATION
 Supplementary Figures Supplementary Figure S1. Binding of full-length OGT and deletion mutants to PIP strips (Echelon Biosciences). Supplementary Figure S2. Binding of the OGT (919-1036) fragments with
Supplementary Figure 1 Role of Raf-1 in TLR2-Dectin-1-mediated cytokine expression
 Supplementary Figure 1 Supplementary Figure 1 Role of Raf-1 in TLR2-Dectin-1-mediated cytokine expression. Quantitative real-time PCR of indicated mrnas in DCs stimulated with TLR2-Dectin-1 agonist zymosan
INTERACTION DRUG BODY
 INTERACTION DRUG BODY What the drug does to the body What the body does to the drug Receptors - intracellular receptors - membrane receptors - Channel receptors - G protein-coupled receptors - Tyrosine-kinase
The Adaptive Immune Response. B-cells
 The Adaptive Immune Response B-cells The innate immune system provides immediate protection. The adaptive response takes time to develop and is antigen specific. Activation of B and T lymphocytes Naive
Supplementary Figure 1:
 Supplementary Figure 1: (A) Whole aortic cross-sections stained with Hematoxylin and Eosin (H&E), 7 days after porcine-pancreatic-elastase (PPE)-induced AAA compared to untreated, healthy control aortas
Supplementary Figure 1
 Supplementary Figure 1 how HFD how HFD Epi WT p p Hypothalamus p p Inguinal WT T Liver Lean mouse adipocytes p p p p p p Obese mouse adipocytes Kidney Muscle Spleen Heart p p p p p p p p Extracellular
SUPPLEMENTARY INFORMATION. Supplemental Figure 1. Body weight and blood glucose parameters of chow-diet (CD)
") SUPPLEMENTARY INFORMATION LEGENDS Supplemental Figure. Body weight and blood glucose parameters of chow-diet (CD) fed and high-fat diet (HFD) fed mice. (A) Body weight was measured at the beginning of
SUPPLEMENTARY INFORMATION LEGENDS Supplemental Figure. Body weight and blood glucose parameters of chow-diet (CD) fed and high-fat diet (HFD) fed mice. (A) Body weight was measured at the beginning of
Innate Immunity. Chapter 3. Connection Between Innate and Adaptive Immunity. Know Differences and Provide Examples. Antimicrobial peptide psoriasin
 Chapter Know Differences and Provide Examples Innate Immunity kin and Epithelial Barriers Antimicrobial peptide psoriasin -Activity against Gram (-) E. coli Connection Between Innate and Adaptive Immunity
SUPPLEMENTARY METHODS
 SUPPLEMENTARY METHODS Histological analysis. Colonic tissues were collected from 5 parts of the middle colon on day 7 after the start of DSS treatment, and then were cut into segments, fixed with 4% paraformaldehyde,
Supplementary Materials for
 www.sciencesignaling.org/cgi/content/full/8/389/ra79/dc1 Supplementary Materials for HDL-bound sphingosine 1-phosphate acts as a biased agonist for the endothelial cell receptor S1P 1 to limit vascular
2.5. AMPK activity
 Supplement Fig. A 3 B phos-ampk 2.5 * Control AICAR AMPK AMPK activity (Absorbance at 45 nm) 2.5.5 Control AICAR Supplement Fig. Effects of AICAR on AMPK activation in macrophages. J774. macrophages were
BIOL212 Biochemistry of Disease. Metabolic Disorders - Obesity
 BIOL212 Biochemistry of Disease Metabolic Disorders - Obesity Obesity Approx. 23% of adults are obese in the U.K. The number of obese children has tripled in 20 years. 10% of six year olds are obese, rising
Structure and Function of Antigen Recognition Molecules
 MICR2209 Structure and Function of Antigen Recognition Molecules Dr Allison Imrie allison.imrie@uwa.edu.au 1 Synopsis: In this lecture we will examine the major receptors used by cells of the innate and
Chapter 16 Innate Immunity: Nonspecific Defenses of the Host
 Module 10 Chapter 16 Innate Immunity: Nonspecific Defenses of the Host The concept of immunity Immunity: ability to protect against from microbes and their o Aka, Susceptibility: vulnerability or lack
Supplementary Figure 1. DJ-1 modulates ROS concentration in mouse skeletal muscle.
 Supplementary Figure 1. DJ-1 modulates ROS concentration in mouse skeletal muscle. (a) mrna levels of Dj1 measured by quantitative RT-PCR in soleus, gastrocnemius (Gastroc.) and extensor digitorum longus
2. Innate immunity 2013
 1 Innate Immune Responses 3 Innate immunity Abul K. Abbas University of California San Francisco The initial responses to: 1. Microbes: essential early mechanisms to prevent, control, or eliminate infection;
Supplementary Figure 1.
 Supplementary Figure 1. Increased expression of cell cycle pathway genes in insulin + Glut2 low cells of STZ-induced diabetic islets. A) random blood glucose measuers of STZ and vehicle treated MIP-GFP
Medical Virology Immunology. Dr. Sameer Naji, MB, BCh, PhD (UK) Head of Basic Medical Sciences Dept. Faculty of Medicine The Hashemite University
 Head of Basic Medical Sciences Dept. Faculty of Medicine The Hashemite University") Medical Virology Immunology Dr. Sameer Naji, MB, BCh, PhD (UK) Head of Basic Medical Sciences Dept. Faculty of Medicine The Hashemite University Human blood cells Phases of immune responses Microbe Naïve
Medical Virology Immunology Dr. Sameer Naji, MB, BCh, PhD (UK) Head of Basic Medical Sciences Dept. Faculty of Medicine The Hashemite University Human blood cells Phases of immune responses Microbe Naïve
ΦΛΕΓΜΟΝΗ ΚΑΙ ΔΙΑΒΗΤΗΣ
 ΦΛΕΓΜΟΝΗ ΚΑΙ ΔΙΑΒΗΤΗΣ ΘΩΜΑΣ ΠΑΠΑΔΟΠΟΥΛΟΣ, MD, PHD ΕΠΕΜΒΑΤΙΚΟΣ ΚΑΡΔΙΟΛΟΓΟΣ ΙΑΤΡΙΚΟ ΔΙΑΒΑΛΚΑΝΙΚΟ ΚΕΝΤΡΟ Inflammation as a cause of disease has entered the popular imagination. Diet ( macronutrients )
Tissue factor-par2 signaling promotes diet-induced obesity and adipose
 Supplementary figures for Tissue factor-par2 signaling promotes diet-induced obesity and adipose inflammation. Leylla Badeanlou 1, Christian Furlan-Freguia 2, Guang Yang 1, Wolfram Ruf 2,3, and Fahumiya
11/25/2017. THE IMMUNE SYSTEM Chapter 43 IMMUNITY INNATE IMMUNITY EXAMPLE IN INSECTS BARRIER DEFENSES INNATE IMMUNITY OF VERTEBRATES
 THE IMMUNE SYSTEM Chapter 43 IMMUNITY INNATE IMMUNITY EXAMPLE IN INSECTS Exoskeleton made of chitin forms the first barrier to pathogens Digestive system is protected by a chitin-based barrier and lysozyme,
Title of file for HTML: Supplementary Information Description: Supplementary Figures and Supplementary Table
 Title of file for HTML: Supplementary Information Description: Supplementary Figures and Supplementary Table Title of file for HTML: Peer Review File Description: Innate Scavenger Receptor-A regulates
Newly Recognized Components of the Innate Immune System
 Newly Recognized Components of the Innate Immune System NOD Proteins: Intracellular Peptidoglycan Sensors NOD-1 NOD-2 Nod Protein LRR; Ligand Recognition CARD RICK I-κB p50 p65 NF-κB Polymorphisms in Nod-2
control kda ATGL ATGLi HSL 82 GAPDH * ** *** WT/cTg WT/cTg ATGLi AKO/cTg AKO/cTg ATGLi WT/cTg WT/cTg ATGLi AKO/cTg AKO/cTg ATGLi iwat gwat ibat
 body weight (g) tissue weights (mg) ATGL protein expression (relative to GAPDH) HSL protein expression (relative to GAPDH) ### # # kda ATGL 55 HSL 82 GAPDH 37 2.5 2. 1.5 1..5 2. 1.5 1..5.. Supplementary
Nature Medicine doi: /nm.3150
 Nature Medicine doi:10.1038/nm.3150 Supplementary Table 1 Primer sequences used for q-pcr analysis Gene Forward primer Reverse primer Abca1 CAGCTTCCATCCTCCTTGTC CCACATCCACAACTGTCTGG Abcg1 GTACCATGACATCGCTGGTG
Intrinsic cellular defenses against virus infection
 Intrinsic cellular defenses against virus infection Detection of virus infection Host cell response to virus infection Interferons: structure and synthesis Induction of antiviral activity Viral defenses
HOW THE MICROBIOME AFFECTS OUR HEALTH
 HOW THE MICROBIOME AFFECTS OUR HEALTH THE INTESTINAL BARRIER AND INTESTINAL PERMEABILITY Intestinal Barrier: a functional body Defense from translocation of dietary antigens, bacteria or bacterial endotoxins
Host cell activation
 Dept. of Internal Medicine/Infectious and Respiratory Diseases Stefan Hippenstiel Epigenetics as regulator of inflammation Host cell activation LPS TLR NOD2 MDP TRAF IKK NF-κB IL-x, TNFα,... Chromatin
Metabolic Syndrome. DOPE amines COGS 163
 Metabolic Syndrome DOPE amines COGS 163 Overview - M etabolic Syndrome - General definition and criteria - Importance of diagnosis - Glucose Homeostasis - Type 2 Diabetes Mellitus - Insulin Resistance
TD-BF01: Innate immunity to microorganisms
 TD-BF01: Innate immunity to microorganisms I. Toll receptors (adapted from Takeuchi, O. et al. (1999) Immunity 11:443; Kawai, T. et al. (1999) Immunity 11:115; Hemmi, H. et al. (2000) Nature 408:740; Muzio,
The Innate Immune Response
 The Innate Immune Response FUNCTIONS OF THE IMMUNE SYSTEM: Recognize, destroy and clear a diversity of pathogens. Initiate tissue and wound healing processes. Recognize and clear damaged self components.
Natural Killer T cells and their functions in atherosclerosis and obesity: a therapeutic perspective for cardiovascular diseases
 REVIEW Natural Killer T cells and their functions in atherosclerosis and obesity: a therapeutic perspective for cardiovascular diseases A.M. van de Vrugt 1 and E. Kalkhoven 2 1 Biology of Disease Master
Innate Immunity. Bởi: OpenStaxCollege
 Innate Immunity Bởi: OpenStaxCollege The vertebrate, including human, immune system is a complex multilayered system for defending against external and internal threats to the integrity of the body. The
T-cell activation T cells migrate to secondary lymphoid tissues where they interact with antigen, antigen-presenting cells, and other lymphocytes:
 Interactions between innate immunity & adaptive immunity What happens to T cells after they leave the thymus? Naïve T cells exit the thymus and enter the bloodstream. If they remain in the bloodstream,
Overview of the immune system
 Overview of the immune system Immune system Innate (nonspecific) 1 st line of defense Adaptive (specific) 2 nd line of defense Cellular components Humoral components Cellular components Humoral components
Chapter 24 The Immune System
 Chapter 24 The Immune System The Immune System Layered defense system The skin and chemical barriers The innate and adaptive immune systems Immunity The body s ability to recognize and destroy specific
Supplementary Table 2. Plasma lipid profiles in wild type and mutant female mice submitted to a HFD for 12 weeks wt ERα -/- AF-1 0 AF-2 0
 Supplementary Table 1. List of specific primers used for gene expression analysis. Genes Primer forward Primer reverse Hprt GCAGTACAGCCCCAAAATGG AACAAAGTCTGGCCTGTATCCA Srebp-1c GGAAGCTGTCGGGGTAGCGTC CATGTCTTCAAATGTGCAATCCAT
Supplemental Information. Increased 4E-BP1 Expression Protects. against Diet-Induced Obesity and Insulin. Resistance in Male Mice
 Cell Reports, Volume 16 Supplemental Information Increased 4E-BP1 Expression Protects against Diet-Induced Obesity and Insulin Resistance in Male Mice Shih-Yin Tsai, Ariana A. Rodriguez, Somasish G. Dastidar,
PPAR history of research
 PPAR Rubens, 1640 PPAR history of research number of publications 3000 2000 1000 0 till now: : 16 296 publications 1985 1990 1995 2000 2005 year liver, brown adipocytes, kidney, heart, skeletal muscles,
Chronic variable stress activates hematopoietic stem cells
 SUPPLEMENTARY INFORMATION Chronic variable stress activates hematopoietic stem cells Timo Heidt *, Hendrik B. Sager *, Gabriel Courties, Partha Dutta, Yoshiko Iwamoto, Alex Zaltsman, Constantin von zur
Pathophysiology of Lipid Disorders
 Pathophysiology of Lipid Disorders Henry Ginsberg, M.D. Division of Preventive Medicine and Nutrition CHD in the United States CHD is the single largest killer of men and women 12 million have history
Chapter 10 (pages ): Differentiation and Functions of CD4+ Effector T Cells Prepared by Kristen Dazy, MD, Scripps Clinic Medical Group
: Differentiation and Functions of CD4+ Effector T Cells Prepared by Kristen Dazy, MD, Scripps Clinic Medical Group") FIT Board Review Corner September 2015 Welcome to the FIT Board Review Corner, prepared by Andrew Nickels, MD, and Sarah Spriet, DO, senior and junior representatives of ACAAI's Fellows-In-Training (FITs)
FIT Board Review Corner September 2015 Welcome to the FIT Board Review Corner, prepared by Andrew Nickels, MD, and Sarah Spriet, DO, senior and junior representatives of ACAAI's Fellows-In-Training (FITs)
University of California, San Diego La Jolla CA 92093
 AD Award Number: W81XWH-11-1-0131 TITLE: Role of Inflammation and Insulin Resistance in Mouse Models of Breast Cancer PRINCIPAL INVESTIGATOR: Jerrold Olefsky, M.D. CONTRACTING ORGANIZATION: University
T Cell Effector Mechanisms I: B cell Help & DTH
 T Cell Effector Mechanisms I: B cell Help & DTH Ned Braunstein, MD The Major T Cell Subsets p56 lck + T cells γ δ ε ζ ζ p56 lck CD8+ T cells γ δ ε ζ ζ Cα Cβ Vα Vβ CD3 CD8 Cα Cβ Vα Vβ CD3 MHC II peptide
1Why lipids cannot be transported in blood alone? 2How we transport Fatty acids and steroid hormones?
 1Why lipids cannot be transported in blood alone? 2How we transport Fatty acids and steroid hormones? 3How are dietary lipids transported? 4How lipids synthesized in the liver are transported? 5 Lipoprotien
MACROPHAGE "MONOCYTES" SURFACE RECEPTORS
 LECTURE: 13 Title: MACROPHAGE "MONOCYTES" SURFACE RECEPTORS LEARNING OBJECTIVES: The student should be able to: Describe the blood monocytes (size, and shape of nucleus). Enumerate some of the monocytes
Supplementary data Supplementary Figure 1 Supplementary Figure 2
 Supplementary data Supplementary Figure 1 SPHK1 sirna increases RANKL-induced osteoclastogenesis in RAW264.7 cell culture. (A) RAW264.7 cells were transfected with oligocassettes containing SPHK1 sirna
Effector T Cells and
 1 Effector T Cells and Cytokines Andrew Lichtman, MD PhD Brigham and Women's Hospital Harvard Medical School 2 Lecture outline Cytokines Subsets of CD4+ T cells: definitions, functions, development New
Supplemental Information Supplementary Table 1. Tph1+/+ Tph1 / Analyte Supplementary Table 2. Tissue Vehicle LP value
 Supplemental Information Supplementary Table. Urinary and adipose tissue catecholamines in Tph +/+ and Tph / mice fed a high fat diet for weeks. Tph +/+ Tph / Analyte ewat ibat ewat ibat Urine (ng/ml)
SUPPLEMENTARY INFORMATION
 doi:10.1038/nature10134 Supplementary Figure 1. Anti-inflammatory activity of sfc. a, Autoantibody immune complexes crosslink activating Fc receptors, promoting activation of macrophages, and WWW.NATURE.COM/NATURE
INFLAMMATION & REPAIR
 INFLAMMATION & REPAIR Lecture 7 Chemical Mediators of Inflammation Winter 2013 Chelsea Martin Special thanks to Drs. Hanna and Forzan Course Outline i. Inflammation: Introduction and generalities (lecture
Plasma lipoproteins & atherosclerosis by. Prof.Dr. Maha M. Sallam
 Biochemistry Department Plasma lipoproteins & atherosclerosis by Prof.Dr. Maha M. Sallam 1 1. Recognize structures,types and role of lipoproteins in blood (Chylomicrons, VLDL, LDL and HDL). 2. Explain
ACTIVATION OF T LYMPHOCYTES AND CELL MEDIATED IMMUNITY
 ACTIVATION OF T LYMPHOCYTES AND CELL MEDIATED IMMUNITY The recognition of specific antigen by naïve T cell induces its own activation and effector phases. T helper cells recognize peptide antigens through
Eukaryotic transcription (III)
") Eukaryotic transcription (III) 1. Chromosome and chromatin structure Chromatin, chromatid, and chromosome chromatin Genomes exist as chromatins before or after cell division (interphase) but as chromatids
Eukaryotic transcription (III) 1. Chromosome and chromatin structure Chromatin, chromatid, and chromosome chromatin Genomes exist as chromatins before or after cell division (interphase) but as chromatids
M.Sc. III Semester Biotechnology End Semester Examination, 2013 Model Answer LBTM: 302 Advanced Immunology
 Code : AS-2246 M.Sc. III Semester Biotechnology End Semester Examination, 2013 Model Answer LBTM: 302 Advanced Immunology A. Select one correct option for each of the following questions:- 2X10=10 1. (b)
Immune System AP SBI4UP
 Immune System AP SBI4UP TYPES OF IMMUNITY INNATE IMMUNITY ACQUIRED IMMUNITY EXTERNAL DEFENCES INTERNAL DEFENCES HUMORAL RESPONSE Skin Phagocytic Cells CELL- MEDIATED RESPONSE Mucus layer Antimicrobial
Immunology Lecture- 1
 Immunology Lecture- 1 Immunology and Immune System Immunology: Study of the components and function of the immune system Immune System a network collected from cells, tissues organs and soluble factors
Islet viability assay and Glucose Stimulated Insulin Secretion assay RT-PCR and Western Blot
 Islet viability assay and Glucose Stimulated Insulin Secretion assay Islet cell viability was determined by colorimetric (3-(4,5-dimethylthiazol-2-yl)-2,5- diphenyltetrazolium bromide assay using CellTiter
Immunology for the Rheumatologist
 Immunology for the Rheumatologist Rheumatologists frequently deal with the immune system gone awry, rarely studying normal immunology. This program is an overview and discussion of the function of the
Innate Immunity & Inflammation
 Innate Immunity & Inflammation The innate immune system is an evolutionally conserved mechanism that provides an early and effective response against invading microbial pathogens. It relies on a limited
SUPPLEMENTARY INFORMATION
 SUPPLEMENTARY INFORMATION doi:1.138/nature9814 a A SHARPIN FL B SHARPIN ΔNZF C SHARPIN T38L, F39V b His-SHARPIN FL -1xUb -2xUb -4xUb α-his c Linear 4xUb -SHARPIN FL -SHARPIN TF_LV -SHARPINΔNZF -SHARPIN
Chapter 13: Cytokines
 Chapter 13: Cytokines Definition: secreted, low-molecular-weight proteins that regulate the nature, intensity and duration of the immune response by exerting a variety of effects on lymphocytes and/or
Supplementary Information POLO-LIKE KINASE 1 FACILITATES LOSS OF PTEN-INDUCED PROSTATE CANCER FORMATION
 Supplementary Information POLO-LIKE KINASE 1 FACILITATES LOSS OF PTEN-INDUCED PROSTATE CANCER FORMATION X. Shawn Liu 1, 3, Bing Song 2, 3, Bennett D. Elzey 3, 4, Timothy L. Ratliff 3, 4, Stephen F. Konieczny
Crucial role for human Toll-like receptor 4 in the development of contact allergy to nickel
 Supplementary Figures 1-8 Crucial role for human Toll-like receptor 4 in the development of contact allergy to nickel Marc Schmidt 1,2, Badrinarayanan Raghavan 1,2, Verena Müller 1,2, Thomas Vogl 3, György
FH- FH+ DM. 52 Volunteers. Oral & IV Glucose Tolerance Test Hyperinsulinemic Euglycemic Clamp in Non-DM Subjects ACADSB MYSM1. Mouse Skeletal Muscle
 A 52 Volunteers B 6 5 4 3 2 FH- FH+ DM 1 Oral & IV Glucose Tolerance Test Hyperinsulinemic Euglycemic Clamp in Non-DM Subjects ZYX EGR2 NR4A1 SRF target TPM1 ACADSB MYSM1 Non SRF target FH- FH+ DM2 C SRF
Supplementary Figures
 Inhibition of Pulmonary Anti Bacterial Defense by IFN γ During Recovery from Influenza Infection By Keer Sun and Dennis W. Metzger Supplementary Figures d a Ly6G Percentage survival f 1 75 5 1 25 1 5 1
Chapter 17. The Lymphatic System and Immunity. Copyright 2010, John Wiley & Sons, Inc.
 Chapter 17 The Lymphatic System and Immunity Immunity Innate Immunity Fast, non-specific and no memory Barriers, ph extremes, Phagocytes & NK cells, fever, inflammation, complement, interferon Adaptive
(#4685) and p- AKT (S473) Rb mab (#9271) purchased from cell signaling Technology (Beverly,
 and p- AKT (S473) Rb mab (#9271) purchased from cell signaling Technology (Beverly,") 1 Supplemental methods cute insulin challenge: For assay of biochemical responses to insulin stimulation, we 3 4 6 7 8 9 1 anesthetized mice after a 6- h fast. We ligated vessels supplying one side of
1 Supplemental methods cute insulin challenge: For assay of biochemical responses to insulin stimulation, we 3 4 6 7 8 9 1 anesthetized mice after a 6- h fast. We ligated vessels supplying one side of