Assessing Cardiovascular Disease Risk Factors in Overweight and Obese. Mexican-American Adults. Srijana Neupane
|
|
|
- Sylvia Kennedy
- 6 years ago
- Views:
Transcription
1 Assessing Cardiovascular Disease Risk Factors in Overweight and Obese Mexican-American Adults by Srijana Neupane A Thesis Presented in Partial Fulfillment of the Requirements for the Degree Master of Science Approved September 2011 by the Graduate Supervisory Committee: Sonia Vega-Lopez, Chair Carol Johnston Gabriel Shaibi ARIZONA STATE UNIVERSITY December 2011
2 ABSTRACT Mexican Americans have an increased risk for type 2 diabetes and premature cardiovascular disease (CVD). The association of hyperglycemia with traditional CVD risk factors in this population has been established, but there is limited data regarding other non-traditional CVD risk factors. Thus, this crosssectional study was conducted to evaluate CVD risk among Mexican Americans by measuring concentrations of lipids, high-sensitivity C-reactive protein (hscrp), and cholesterol in low-density-lipoprotein (LDL) and high-densitylipoprotein (HDL) subfractions. Eighty overweight/obese Mexican-American adults participating in the Maricopa Insulin Resistance Initiative were randomly selected from each of the following four groups (n = 20 per group): nomolipidemic/normoglycemic controls (NC), dyslipidemic/normoglycemic (DN), dyslipidemic/prediabetic (DPD) and dyslipidemic/diabetic (DD). Total cholesterol (TC) was 30% higher among DD than in NC participants (p<0.0001). The DPD group had 27% and 12% higher LDL-C concentrations than the NC and DN groups, respectively. Similarly, LDL-C was 29% and 13% higher in DD than in NC and DN participants (p=0.013). An increasing trend was observed in %10- year CVD risk with increasing degree of hyperglycemia (p<0.0001). The NC group had less cholesterol in sdldl particles than dyslipidemic groups, regardless of glycemic status (p<0.0001). When hyperglycemia was part of the phenotype (DPD and DD), there was a greater proportion of total and HDL-C in shdl particles in dyslipidemic individuals than in NC (p=0.023; p<0.0001; respectively). Percent 10-year CVD risk was positively correlated with i
3 triglyceride (TG) (r=0.384, p<0.0001), TC (r=0.340, p<0.05), cholesterol in sdldl(r=0.247; p<0.05), and TC to HDL-C ratio (r=0.404, p<0.0001), and negatively correlated with HDL-C in intermediate and large HDL(r=-0.38, p=0.001; r=0.34, p=0.002, respectively). The TC/HDL-C was positively correlated with cholesterol in sdldl particles (r=0.698, p<0.0001) and HDL-C in shdl particles (r=0.602, p<0.0001), and negatively correlated with cholesterol in small (r=-0.35, p=0.002), intermediate (r=-0.91, p<0.0001) and large (r=-0.84, p<0.0001) HDL particles, and HDL-C in the large HDL particles (r=-0.562, p<0.0001). No significant association was found between %10-year CVD risk and hscrp. Collectively, these results corroborate that dyslipidemic Mexican- American adults have higher CVD risk than normolipidemic individuals. Hyperglycemia may further affect CVD risk by modulating cholesterol in LDL and HDL subfractions. ii
4 DEDICATION This thesis is dedicated to my husband and parents. Thank you, Mamu, Daddy, Mama, Papa and Niresh for your never ending love, encouragement and support. iii
5 ACKNOWLEDGMENTS I would like to appreciate many people who have helped me complete this research on time. Many thanks to my mentor Sonia Vega-Lopez, PhD for lending her expertise, guidance, enthusiasm and time in helping me develop a complete and thorough research project from my vague interest of working with minorities. Thank you, Dr. Vega-Lopez for reviewing my thesis multiple times to give it a tremendous shape and, moreover, having faith in me and in my ability to complete the research on time. I learned a lot from you, and yet have to learn more. I would like to thank Gabriel Q. Shaibi, PhD, PT for his insight and commitment to this research. Thank you, Dr. Shaibi for having your door open to any of my questions from sample collection, literature search to statistical analyses. I would like to thank Carol S Johnston, PhD, RD for her advice and support to help me succeed in mastering my coursework and in conducting meaningful project. Thank you, Dr. Johnston for helping me to understand the basics of research and its importance. I would like to thank investigators of Maricopa Insulin Resistance Initiative study and Dr. Shaibi s team members: Andres, Ariana and Joon for their valuable support and contribution. I would also like to thank our lab technicians for their help while I was working in the lab. Finally, I would like to thank my fellow graduate students who have provided their opinions, listening ears, meaningful distractions, and many laughs during my graduate study years. iv
6 TABLE OF CONTENTS Page LIST OF TABLES... ix LIST OF FIGURES... x CHAPTER 1 INTRODUCTION... 1 Hypotheses and Aims... 4 Research Applications... 4 Limitations and Delimitations... 5 Definition of Terms REVIEW OF LITERATURE... 9 Cardiovascular Disease: Prevalence and Mortality... 9 CVD Risk in Mexican Americans Metabolic Syndrome CVD Risk Factors Smoking Physical Inactivity Dyslipidemia Lipoproteins Very-Low-Density-Lipoproteins (VLDL) Intermediate-Density-Lipoproteins (IDL) Low-Density-Lipoproteins (LDL) High-Density-Lipoproteins (HDL) v
7 CHAPTER Page Chylomicrons Chylomicron Remnants Lipoprotein Metabolism and Development of Atherosclerosis LDL Subfractions HDL Subfractions Overweight/Obesity Insulin Resistance/Diabetes Insulin and Carbohydrate Metabolism Insulin and Lipid Metabolism Diabetes Mellitus Pathogenesis of CVD in Insulin Resistance/Diabetes Metabolic Disarrangements Oxidation/Glycoxidation Endothelial Dysfunction Inflammation C - reactive Protein Genetic Predisposition MATERIALS AND METHODS Maricopa County Insulin Initiative Protocol Subjects vi
8 CHAPTER Page Recruitment Informed Consent Study Protocol Present Study Protocol Materials Samples Methods Quantimetrix Lipoprint LDL System Quantimetrix Lipoprint HDL System Calculation of Framingham and HOMA Score Statistical Analysis Sample Size Calculation RESULTS Descriptive Characteristics Cardiometabolic Disease Risk Factors LDL and HDL Phenotypes Relationship between CVD Risk Factors and 10-year CVD Estimates DISCUSSION Insulin Resistance and CVD Risk Dyslipidemia LDL Subfractions vii
9 CHAPTER Page HDL Subfractions High-sensitivity C-reactive Protein Using The Framingham Risk Algorithm to Predict 10-Year CVD Risk Limitations CONCLUSION REFERENCES APPENDIX A MARICOPA INSULIN RESISTANCE INITIAVE IRB APPROVAL FORM B CONSENT FORM MARICOPA INSULIN RESISTANCE INITIAVE (ENGLISH) C CONSENT FORM MARICOPA INSULIN RESISTANCE INITIAVE (SPANISH)) D INSTITUTIONAL BIOSAFETY APPROVAL FORM OF PRESENT STUDY E DATA SUMMARY SHEETS viii
10 LIST OF TABLES Table Page 1. Characteristics of Participants Cardiometabolic Disease Risk Factors among Study Participants Pairwise Correlations among CVD Risk Factors Pairwise Correlations among CVD Risk Factors and Distribution of TC and HDL-C in LDL and HDL Subfractions, Respectively Cholesterol Distribution in LDL Subfractions HDL Cholesterol Distribution in HDL Subfractions ix
11 LIST OF FIGURES Figure Page 1. Lipoprotein Metabolism (A) Criteria for Defining Insulin Resistance in Particiants in DIR Group (B) Distribution of Fasting Glucose Concentrations among Diabetic Participants (DD Group) HOMA-Score in-between The Groups Percent 10-year CVD Risk among Participants with Increasing Degree of Hyperglycemia Total Cholesterol Distribution in LDL Subfractions Total Cholesterol Distribution in HDL Subfractions x
12 CHAPTER 1 INTRODUCTION Despite a 29.2% decrease in the death rate due to cardiovascular disease (CVD) from 1996 to 2006, it remains the leading cause of death among adults in the United States (1, 2). In 2006, CVD accounted for 34.2% of total deaths, and 1 of every 2.9 deaths was related to CVD (1). Recent data showed the prevalence is 30.7% and 30.9% in Mexican-American men and women, respectively (3). Despite a higher prevalence of CVD relative to White Americans, Mexican Americans have a lower mortality rate from CVD; however, it remains major cause of mortality in this group (4, 5). Therefore, efforts to reduce the progression and mortality from CVD in this population are needed. Risk factors for CVD include old age, male, diabetes, hypertension, smoking, dyslipidemia, and high levels of inflammatory markers (6, 7). The prevalence of heart disease is higher in younger men than in women with similar risk factors, but after menopause the prevalence increases in women compared to men (8). As defined by the National Cholesterol Education Program (NCEP) Adult Treatment Panel (ATP) III, the triad of elevated TG, low high-densitylipoprotein cholesterol (HDL-C) and small-dense LDL (sdldl) particles are independent risk factors for CVD (9). Regarding LDL (low-density lipoprotein), having sdldl particles (pattern B phenotype) poses a higher risk than having the more buoyant larger particles (9, 10). Moreover, having a pattern B LDL phenotype has been reported to coexist with other features such as dyslipidemia, insulin resistance/hyperglycemia, hypertension and hypercoagulability (10). There 1
13 is scant information regarding the role of HDL particle size on CVD risk. It has been suggested that small and large particles may have different capability to protect against CVD risk (11). Large HDL particle size is inversely associated with CVD, whereas, no such association has been seen with small HDL (shdl) particles (12). Inflammatory factors such as high-sensitivity C-reactive protein (hscrp), and cytokinines are additional risk factors for CVD (6, 7). Various research suggest that Mexican Americans tend to have one or many of these blood parameters in elevated concentrations, which indicates they are at increased risk for CVD (1, 2, 10). Homocysteine is another independent risk factor for CVD (13),(14). However, less is known about the relationship between homocysteine concentrations and CVD risk. The metabolic syndrome (MetS) is a constellation of various risk factors of metabolic origin that contribute to the development of atherosclerotic CVD (15). Several organizations have their own definition for MetS, depending on the criteria used to identify each component (16). As defined by NCEP ATP III (9), MetS occurs when there is the presence of three or more of the following risk factors: (a) abdominal obesity defined as waist circumference >102 cm in men and >88 cm in women, (b) hypertriglyceridemia: >150 mg/dl, (c) low HDL-C: <40 mg/dl in men and <50 mg/dl in women, (d) hypertension: > 130 mm Hg systolic and > 85 mm Hg diastolic, and (e) fasting hyperglycemia: >100mg/dl. Insulin resistance and obesity are considered as the underlying risk factors for the MetS and their effect on both CVD and diabetes has been suggested to be interrelated (16-18). Whereas insulin resistance is associated with being 2
14 overweight or obese, not all overweight or obese individuals are insulin resistant (18). Nevertheless, insulin resistant individuals commonly have an abnormal fat deposition in the abdominal area, either as visceral or subcutaneous fat (15). Increased abdominal fat deposition has been associated with insulin resistance (15-17). Furthermore, the cluster of abnormalities associated with obesity and insulin resistance are dyslipidemia, glucose intolerance, hyperinsulinemia, and elevated circulating hscrp and inflammatory cytokinines (5, 9, 19). It has been suggested that Mexican-American men have the highest age adjusted prevalence of abdominal obesity, hypertriglyceridemia and high fasting glucose or medication use compared to White and African-American men (20). Similarly, Mexican-American women also have the highest age adjusted prevalence of abdominal obesity, hypertriglyceridemia, low HDL-C and high fasting glucose compared to White and African-American women (20). This indicates that obesity, insulin resistance and dyslipidemia are becoming more prevalent in this group. There is limited information about the LDL phenotype, hscrp, homocysteine and their association with CVD risk in Mexican-American adults. Therefore, the main objective of this study was to evaluate CVD risk among Mexican Americans by measuring concentrations of total cholesterol (TC), LDLcholesterol (LDL-C), HDL-C, triglyceride (TG) and hscrp, as well as cholesterol in LDL and HDL particles of different sizes. We further evaluated the association between hyperglycemia with a pattern B LDL phenotype, characterized by having 3
15 a greater proportion of LDL-C in sdldl particles, or with having greater proportion of HDL-C in shdl particles in Mexican Americans. Hypotheses and Aims Hypothesis 1: Increased CVD risk in Mexican Americans living in Phoenix metropolitan area will be associated with high hscrp concentrations and the presence of a pattern B low-density lipoprotein (LDL) phenotype. Specific Aim #1: To estimate CVD risk in Mexican-American adults living in the Phoenix metropolitan area by calculating the CVD Framingham risk scores. Specific Aim #2: To evaluate the association between independent CVD risk factors, including TC, TG, hscrp, cholesterol in sdldl and shdl and CVD Framingham risk score in Mexican-American adults living in the Phoenix metropolitan area. Hypothesis 2: In Mexican Americans, hyperglycemia will be associated with having a pattern B LDL phenotype, characterized by having a greater proportion of cholesterol in sdldl particles, and with having a greater proportion of HDL-C in shdl particles. Specific Aim #3: To measure the association of hyperglycemia with having a pattern B LDL and HDL phenotype, measured by the amount of cholesterol in sdldl particles, and cholesterol and HDL-C in shdl particles in Mexican Americans. Research Application This pilot research is the initial study designed to estimate prevalence of CVD risk among Mexican-American adults living in Phoenix metropolitan area, 4
16 on the basis of which extensive evidence-based culturally sensitive interdisciplinary interventions could be designed and implemented to limit CVD risk in this population. Delimitations and Limitations The study population is limited to Mexican Americans residing in the Phoenix metropolitan area; therefore, this study is not generalizable to the other Mexican-American or Hispanic groups or to other ethnic groups. Moreover, the study is limited to adult participants; the findings of this study will not be applicable to other age groups such children, adolescents and elderly. This study has a cross-sectional design, with which no causal relationships can be established. In addition, the sample size is relatively small, which may limit the statistical power to detect significant associations. All the individuals recruited in the study are 30 years and who identify themselves as Mexican- American; the study does not control for country of birth, acculturation or other non-biological factors that may affect CVD risk. Individuals who were previously diagnosed with diabetes and/or are currently taking diabetic medication are excluded from the study; the presence of other chronic diseases (known or unknown) and medication usage may influence the individual results. The study did not control for smoking, stress level and other acute illness, which may influence hscrp concentrations. To further evaluate CVD risk among Mexican Americans, a longitudinal study that looks upon place of origin, age, gender and other genetic as well as behavioral influences is needed. 5
17 Definition of Terms 1. Cardiovascular disease (CVD): Term used to group illnesses and events that impact the heart and circulating system, including hypertension and coronary heart disease. 2. Cytokinines: Proteins released by cells that have a specific effect on the interactions between cells. Various types of cytokines are interlukins, lymphokines and tumor necrosis factor that trigger inflammation and respond to infections. 3. Dyslipidemia: Multiple lipoprotein abnormalities occurring simultaneously in the same person. These could include elevated TC, LDL-C and TG, and reduced HDL-C. 4. High-density-lipoprotein (HDL): Lipoprotein secreted from the liver and small intestine which participates in the reverse cholesterol transport process by removing cholesterol from extra-hepatic tissues and returning it to the liver. The concentration of cholesterol circulating in HDL is associated with reduced risk of CVD. 5. Low-density-lipoprotein (LDL): Lipoprotein formed in the circulation from very-low-density-lipoprotein (VLDL) through the lipoprotein-lipasemediated delipidation cascade carries most of cholesterol in the blood. The concentration of cholesterol in LDL is associated with increased risk of CVD. 6. Homocysteine: An amino acid identified as a risk factor for CVD 6
18 7. High sensitivity C-reactive protein (hscrp): Acute phase protein synthesized by liver due to stress, trauma, illness, inflammation and chronic disease condition. Its level is normally low in the blood of healthy individual, but rises with an injury, infection, or inflammation and disappears when the injury heals or the infection or inflammation goes away. It has been suggested that prolonged elevated concentrations of C- reactive protein increase the risk for CVD, hypertension, diabetes, and MetS. 8. Insulin resistance: It is the diminished ability of cells to respond to the action of insulin. Insulin stimulates entrance (absorption) of glucose from bloodstream to various body cells (tissue) and also contributes in utilization of the absorbed glucose in the body tissues. Therefore, when insulin resistance occurs the pancreas secretes excess insulin, hyperinsulinemia, in an attempt to regulate blood glucose. 9. Metabolic syndrome (MetS): The MetS is a constellation of various risk factors of metabolic origin that contribute to the development of atherosclerotic CVD. As defined by NECP ATP III, it occurs when there is the presence of three or more of the following risk factors: (1) abdominal obesity defined as waist circumference >102 cm in men and >88 cm in women, (2) hypertriglyceridemia: >150 mg/dl, (3) low HDL-C: <40 mg/dl in men and <50 mg/dl in women, (4) hypertension: > 130 mm Hg systolic and > 85 mm Hg diastolic, and (5) fasting hyperglycemia: >110mg/dl. 7
19 10. Small, dense LDL (sdldl): The sub-fraction of LDL particles that differ significantly in size, density, composition and other physiochemical properties, and are characterized by sdldl phenotypic (determined by both genetic make-up and environmental influences) particle size that has greater atherogenic potential compared to buoyant large LDL particles. The increased atherogenicity is due to its increased permeability to the sub-endothelial space and lower resistance to oxidative stress. 11. Pattern B LDL phenotype: Presence of greater proportion of LDL-C in the sdldl particles. 12. Subcutaneous fat: Fat that is accumulated beneath the epidermis (outermost layer of the skin) and is a protective wrap over the body s surface. 13. Visceral fat: Fat that is accumulated predominantly in the intra-abdominal (peritoneal) cavity, and is also known as organ fat. 8
20 CHAPTER 2 REVIEW OF LITERATURE Cardiovascular Disease: Prevalence and Mortality Cardiovascular disease (CVD) refers to the diseases that affect the heart and blood-vessels (21). This includes coronary heart disease (CHD) or coronary artery disease (CAD) characterized by impaired blood flow in the coronary arteries that can result in angina, myocardial infarction, and sudden death (21). Other forms of CVD that can also result in death are stroke, peripheral vascular disease, and congestive heart failure (22). CVD is the leading cause of death around the world in both developed and developing countries (1). In 2006, 41.3 million women (34.9%) and 38.7 million men (37.6%) were living with CVD around the world, and the worldwide death rate due to CVD was per 100,000 (2). In the same year in the United States (US) 25.8% of deaths were due to CVD in women (1). Similarly, 26% of deaths among men were related to CVD (2). Although in the US CVD death rates declined by 27.8% from 1997 to 2007, CVD still accounted for 33.6% (813,804) of all 2,426,264 deaths in 2007 (1). Looking at health disparities in the US, premature mortality due to a major cardiovascular event has been often related to racial/ethnic differences (23). In 2003, the highest percentage of premature mortality from CHD was observed in American Indians (34%), followed by Blacks (28%), Asians or Pacific Islanders (21%) and Whites (16%); however, some of these differences could be due to the age distributions of these groups (23). 9
21 There are several risk factors identified for CVD. Most of these risk factors are modifiable by making certain lifestyle-related/behavioral changes such as eating a regular healthful diet and performing regular physical activity. These alterations in lifestyle could further change the severity of the modifiable risk factors and lower the prevalence of cardiovascular events. The major modifiable risk factors for CVD are smoking, physical inactivity, hypertension, dyslipidemia, insulin resistance, diabetes, excess body weight (especially around the abdominal area), physical inactivity, proatherogenic diet (diet that are high in saturated and trans-fatty acids), and proinflammatory states (such as high concentrations of hscrp, homocystein, fibrinogen) (8). These will be discussed in detail in the CVD risk factors section. Some of the risk factors that are not modifiable are age, gender and genetic predisposition. At a younger age, men have a greater risk for CVD than women; however after menopause the risk among women increases and surpasses that of men of the same age (8). Genetic predisposition, in other words, having a family history of any kind of CVD, also increases CVD risk (8). CVD Risk in Mexican Americans Hispanics are the fastest growing minority group in the US and constitute 16.3% of the total US population (24). Mexican Americans constitute 63% of the Hispanic population (24). As it is for other ethnic groups residing in the US, CVD is the leading cause of mortality and disability among Mexican-American adults (25). Based on age adjusted estimates from the 2009 National Health Interview Survey (NHIS), the prevalence of CVD is 30.7% and 30.9% in Mexican- 10
22 American men and women, respectively. Data from a 7- to 8-year follow-up in the San-Antonio Heart Study indicated 30% more age-and-sex-adjusted CVDrelated deaths among Mexican Americans than among non-hispanic Whites (24). In this study risk factors such as current smoking, diabetes, high cholesterol, and hypertension were positively associated with CVD mortality in Mexican Americans, and all of these risk factors together contributed to 55% of overall CVD related deaths in Mexican Americans (24). In addition, community based surveillance validated that the mortality rate among Mexican-American men and women was 12% and 36% greater, respectively, than among their White counterparts (26). Many comparative studies have found that Mexican Americans, in comparison with non-hispanic Whites, have higher prevalence of CVD risk due to the greater presence of CVD related risk factors such as physical inactivity, abnormal fat deposition and obesity, and diabetes mellitus, despite having lower prevalence of hypertension (27-36). According to NHIS 2009, Hispanics are more likely to report physical inactivity (44%) than White Americans (28.4%) (34). Furthermore, according to NHANES data, 80% of Mexican-American men and 77% of Mexican-American women were either overweight or obese (33). Moreover, NHANES data set from indicated that 10.4% of Hispanic including Mexican-American adults had diagnosed diabetes compared to 6.6% of their White counterparts (32). Although hypertension is less common among Mexican Americans than in White Americans, the awareness and treatment of the disease are lower (35.2%) compared to White Americans (46.1%) 11
23 (35). However, according to NHIS data, Hispanic adults were less likely to be current cigarette smokers (men 18.4% and women 9.4%) than White adults (men 24% and 21%) (36). Metabolic Syndrome The metabolic syndrome is a cluster of risk factors for CVD and diabetes (type 2) that co-occur in the same individual (37). Although several definitions of the metabolic syndrome have been proposed, according to the National Cholesterol Education Program s Adult Treatment Panel III, the presence of metabolic syndrome is diagnosed when at least 3 of the following 5 risk factors are present: (a) fasting plasma glucose >100 mg/dl or undergoing drug treatment for elevated glucose; (b) HDL-C <40 mg/dl in men or <50 mg/dl in women or undergoing drug treatment for reduced HDL-C; (c) TG >150 mg/dl or undergoing drug treatment or elevated TG; (d) waist circumference >102 cm in men or >88 cm in women; and (e) blood pressure >130 mm Hg systolic or >85 mm Hg diastolic or undergoing drug treatment for hypertension (37). Using data from the Framingham Offspring Study from , Franco et al. (38) examined the probability of having metabolic syndrome, and probability of having CVD morbidity and mortality in the presence of specific combinations of any 3 components of the metabolic syndrome. In this cohort, hypertension was the most frequent component that was present at the diagnosis of metabolic syndrome (77.3%). The presence of central obesity increased the risk of developing metabolic syndrome by 4.75-fold. Moreover among participants who were diagnosed with metabolic syndrome, the joint presence of central 12
24 adiposity, hypertension, and hyperglycemia increased the likelihood of having a cardiovascular event by 2.36-fold and the risk of mortality from CVD by 3-fold (38). According to data from NHANES, in 2003 to 2006 about 34% of adults met the criteria for metabolic syndrome; the age-adjusted prevalence was 35.1% for men and 32.6% for women (39). Among different race/ethnic groups, the ageadjusted prevalence of metabolic syndrome among men was 37.2%, 25.3%, and 33.2% for Whites, Blacks, and Mexican Americans, respectively. Among women, the prevalence was 31.5%, 38.8%, and 40.6%, respectively (39). These data indicate that the prevalence of metabolic syndrome is in part dependent on sex and race/ethnicity. In the Atherosclerosis Risk in Communities (ARIC) Study, among the components of the metabolic syndrome, elevated blood pressure and low levels of HDL-C exhibited the strongest associations with CHD. In this study, men and women with the metabolic syndrome were 1.5 and 2 times more at risk for developing CHD than participants who had parameters within normal ranges, after adjustment for age, smoking, LDL-C, and race/ethnicity (40). In summary, elevated blood pressure, overweight/obesity, diabetes/glucose intolerance/insulin resistance and dyslipidemia are all major modifiable CVD risk factors that contribute towards the development of the metabolic syndrome (38-40). Thus, by having a cluster of risk factors, individuals with metabolic syndrome are at greater risk of developing CVD. Therefore, identification of individuals with the metabolic syndrome may provide 13
25 opportunities to intervene earlier in the development of shared disease pathways that predispose individuals to both CVD and/or diabetes. CVD Risk Factors Given the increasing burden of heart disease in modern society, there is a growing emphasis on detecting CVD risk factors in individuals who could benefit from targeted preventive efforts. This section will focus on describing the main modifiable CVD risk factors. Smoking Smoking is the major modifiable risk factor for the development and progression of CVD including CHD, stroke, peripheral vascular disease, and congestive heart failure (22). From 1998 to 2009, the percentage of US adults who were current cigarette smokers declined from 24.1% to 20.6% (36). In 2009, among American adults, 23.1% of men and 18.1% of women were current cigarette smokers (41). Between 2000 and 2004, the direct medical costs ($96 billion) and lost productivity costs ($97 billion) associated with smoking summed up to an estimate of $193 billion per year (42). According to a study conducted in Hispanic men (20-74 years old), ageadjusted cigarette smoking rates were the lowest among Mexican-American men (33.8%) compared to Puerto Rican (52.3%) and Cuban-American men (64.1%) (43). Other research studies have also shown that Mexican-American adults have lower smoking rates than other ethnic groups (44, 45). Cigarette smoking has been associated with established, traditional, CVD risk factors such as higher serum cholesterol concentrations, coronary vasomotor 14
26 reactivity, platelet aggregation, and prothombotic states (43). Cigarette smoking has also been associated with novel risk factors for CVD such as increased levels of oxidative stress, production of oxidants and higher levels of inflammatory markers like serum C-reactive protein (CRP) (44, 45). The presence of oxidants and inflammation are important mechanisms by which smoking promotes atherosclerotic plaque formation. Smoking promotes oxidative stress, in other words- oxidation of lipids, proteins, and DNA leading to cellular damage, which further leads to atherosclerosis (46, 47). Oxidative stress occurs when there is an imbalance between the production of oxidants and endogenous protective antioxidants. Smoking stimulates the generation of reactive oxygen species (ROS) such as oxidized LDL, which is taken up by macrophages, an important step in the development of foam cells that are found atherosclerotic lesions (46). Furthermore, the ROS formed during smoking decrease nitric oxide (NO) release and bioavailability (46). NO plays a vital role in regulating endothelial function and platelet activation and aggregation, and at normal levels it inhibits smooth cell proliferation and adhesion of monocytes to the endothelium (46, 47). Therefore, the impairment of endogenous NO release contributes to acute cardiovascular events as well as accelerated atherosclerosis (47). Moreover, smoking promotes a chronic inflammatory state that leads to increased white blood cells (neutrophils) count. The neutrophils are associated with a greater long-term cardiovascular reactivity by releasing ROS proteases and leukotrienes (38) that, in turn, cause endothelial cell injury and the aggregation and activation of platelets. Thus, smoking not only stimulates generation of ROS, 15
27 but also inhibits NO release and bioavailability, promotes inflammation, causes endothelial cell injury that together put individuals at increased risk of developing CVD. Physical Inactivity Physical inactivity refers to not getting the recommended level of regular physical activity. According to the US department of health and human services, the physical activity guidelines for Americans published in 2008 recommend that for health benefits, adults (18-64 years old) should do at least 150 minutes (two hours and thirty minutes) per week of moderate-intensity, or 75 minutes (one hour and fifteen minutes) per week of vigorous-intensity aerobic physical activity, or an equivalent combination of moderate- and vigorous-intensity aerobic activity (48). Aerobic activity should be performed in episodes of at least 10 minutes, and it should be spread throughout the week (48). For additional and more extensive health benefits, adults should increase their aerobic physical activity to 300 minutes (five hours) a week of moderate-intensity, or 150 minutes a week of vigorous-intensity aerobic physical activity, or an equivalent combination of moderate- and vigorous-intensity activity (48). Adults should also engage in muscle-strengthening activities that are moderate or high intensity and involve all major muscle groups on two or more days a week to reduce the risk for chronic diseases and disabilities (48, 49). Activities such as running, swimming, heavy gardening in the leisure time are known as leisure-time physical activities, and activities such as heavy household chores and strenuous job activities are known as job-related physical 16
28 activity (50). Various prospective epidemiological studies concentrating on leisure-time physical activity have consistently documented a reduced incidence of cardiovascular events in the more physically active participants (27, 51, 52). Data from the NHIS survey 2009 demonstrated that 30% of US adults do not engage in leisure time physical activity, defined as no moderate-intensity physical activity for 30 minutes 5 days a week or vigorous-intensity physical activity for 20 minutes 3 days a week (41). In addition, according to this data, the proportion of adults reporting regular leisure-time activity was positively associated with education level: 46.0% of people with a college degree or higher were regularly active compared with 21.4% of adults with less than a high school diploma (41). Furthermore, the age-adjusted prevalence of physical inactivity was higher among women than in men (34.5% vs. 30.3%) (41). Race/ethnic disparities in physical activity exist among the adult population residing in the US. According to NHIS 2009 data, the age-adjusted prevalence of physical inactivity was higher among Blacks and Hispanics than in Whites (87% and 44% vs. 28.4%) (41). Although Hispanics engage considerably more in occupational physical activity than White Americans, leisure time inactivity is 2.5 times higher in Mexican Americans compared to their White counterparts (53). Moreover, leisure-time physical inactivity is greater among Spanish-speaking Mexican-American adults relative to their English-speaking counterparts, independent of place of birth (53). Among Mexican Americans, the level of leisure time physical activity has been reported to be affected by several factors, such as environmental barriers, economic barriers, and limited access to 17
29 health education and culturally appropriate health-related materials (5, 53, 54). Economic barriers such as lower level of education, higher levels of physical activity at work, as well as time spent generating income may compete with the time available for leisure time physical activity among Mexican Americans (53). Education influences health through lifestyle behaviors such as exercise and diet, problem-solving capacity and values; therefore, if culturally appropriate health related materials and education are not available to minority populations such as Mexican Americans, it will be difficult to reach out for health and lifestyle related information (5, 53). Along with the economic deprivation, environmental barriers such as family responsibilities, social norms, lack of social support and social isolation leads to lower readiness, willingness, and ability to participate in regular leisure time physical activity in this minority group (54). However, information on how these factors specifically affect physical activity among Mexican Americans is limited. The precise mechanisms through which physical activity lowers CVD risk are not completely understood. Prior studies have demonstrated favorable effects of physical activity on traditional CVD risk factors. In a study design of a total of 111 sedentary, overweight men and women with mild-to-moderate dyslipidemia were randomly assigned to participate for six months in a control group or for eight months in one of three exercise groups: high-amount high-intensity exercise, the caloric equivalent of jogging 20 miles per week at % of peak oxygen consumption; low-amount high-intensity exercise, the equivalent of jogging 12 miles per week at % of peak oxygen consumption; or low- 18
30 amount moderate-intensity exercise, the equivalent of walking 12 miles per week at % of peak oxygen consumption. This study found a high-amount-highintensity of regular exercise, even in the absence of clinically significant weight loss, can significantly improve the overall lipoprotein profiles, i.e. concentrations of lipids and increase in the concentrations of larger LDL and HDL subfractions (55). Moreover, the data revealed that exercise of low-amount-moderate-intensity significantly decreased the concentrations of cholesterol in sdldl and concentration of sdldl particles, and increased the average size of LDL particles, even when plasma LDL-C concentration was not changed (55). The same low-amount-moderate-intensity of exercise also increased the total HDL-C concentration, the concentration of large HDL particles, and the average size of HDL particles and decreased the concentrations of TG and total VLDL- TG at the margin of statistical significance (55). Similarly, data from another study conducted with overweight sedentary females revealed that after 12-months of treatment with exercise (either vigorous intensity/high duration; moderate intensity/high duration; moderate intensity/moderate duration; or vigorous intensity/moderate duration) and diet (energy intake between 1200 and 1500 kcal/d and dietary fat intake between 20% and 30% of total energy intake), the participants in all groups achieved significant weight loss (p<0.01) and increase in cardiorespiratory fitness level (p=0.04); regardless of different exercise durations and intensities (56). In addition, several research studies have shown that the regular physical activity may work through additional biological mechanisms to reduce coronary risk by reducing inflammatory and hemostatic markers as well as 19
31 traditional CVD risk factors. The inverse association between physical activity and CVD continues even after adjustments for traditional CVD risk factors, such as blood pressure, lipids, and adiposity (27). The protective effect has been in part attributed to reduced inflammation. A study that had a six-week aerobic physical training session improved the inflammatory markers in adults with existing stable CVD; CRP concentrations decreased by 23.7% and plasma vascular cell adhesion molecule-1 (VCAM-1) concentrations declined by 10.23% (29). Similarly data from a study with 27,055 healthy women confirmed the inverse relation between physical activity and CVD risk (28). In this study inflammatory/hemostatic biomarkers and blood pressure were the largest contributors for CVD (32.6% and 27.1%, respectively) that were favorably modified with physical activity. Dyslipidemia Dyslipidemia, a major modifiable risk factor for CVD, is defined as either one or a combination of elevated fasting concentrations of LDL- C and TG, and low levels of HDL-C that contributes to atherosclerosis (1). Dyslipidemia can occur due to both modifiable and non-modifiable factors. The most important secondary cause of dyslipidemia in developed countries is a sedentary lifestyle with excessive dietary intake of saturated fat, cholesterol, and trans-fats. Other common modifiable cause of dyslipidemias are: diabetes, alcohol overuse, chronic kidney disease, hypothyroidism, primary biliary cirrhosis and other liver diseases, and usage of drugs, such as thiazides, β-blockers, retinoic acid, highly active antiretroviral agents, estrogen and progestin, and glucocorticoids (57). 20
32 There are also non-modifiable risk factors for dyslipidemia due to genetic predisposition related to the presence of single/multiple gene mutations that result in either overproduction or defective clearance of TG and LDL-C, or in underproduction or excessive clearance of HDL-C (57). Some of the examples are: familial hypercholesterolemia, familial defective apoprotein B 100 (apo B 100 ), LPL deficiency, apoprotein C 2 (apo C 2 ) deficiency, familial hypertriglyceridemia, familial combined hyperlipidemia, familial dysbetalipoproteinemia and familial LCAT deficiency, familial HDL deficiency, hepatic lipase deficiency and sitosterolemia (57). The dyslipidemia caused by genetic defects are less common compared to the dyslipidemia attributed by other modifiable factors (58, 59). In the United States, dyslipidemia especially elevated TC and LDL-C are important risk factors for CVD (59). In addition, diabetic dyslipidemia, characterized by having elevated TG and low HDL-C further exacerbates the CVD risk among individuals with diabetes (57). Data from NHANES reported that 16.2% of the US population had hypercholesterolemia, but the ageadjusted prevalence of high LDL-C in the US adults decreased from (26.6%) to (25.3%). This reduction in prevalence could be due to increased awareness (24%), use of pharmacological lipid-lowering treatment (29%), and LDL-C control (21%) (60, 61). Although all of the components of dyslipidemia individually increase CVD risk, research supporting causality is strongest for elevated TC and LDL-C concentrations (59). A large longitudinal study recruiting participants for the Multiple Risk Factor Intervention Trial has demonstrated a continuous positive 21
33 relationship of TC with risk of CVD; there was a low incidence of CVD among individuals with a low TC concentration, even in the presence of other risk factors such as smoking and hypertension (62). Recently, longitudinal studies have reported that the concentration of apo B 100, the major apoprotein carried by LDL, is a stronger predictor of CVD than LDL-C (63, 64). Although LDL-C and TC are considered key components in the atherosclerosis that leads to CVD, prospective studies have suggested HDL-C and TG also have an effect on CVD risk; therefore they are the secondary lipid targets for therapeutic interventions (65). Prospective studies have demonstrated a strong inverse association between HDL-C and CVD; it has been estimated that with each 1 mg/dl decrease of HDL-C the risk for CVD events increases by 2%, whereas the risk for CVD events is reduced by 6% with each 1 mg/dl increase of HDL-C (65). Data from a longitudinal study that followed men and women from 1972 to 1976 reported an inverse correlation between HDL-C and CVD mortality, particularly for women, after controlling for age, LDL-C, TG, BMI, systolic blood pressure and smoking (24). There is also evidence of a strong inverse association between the concentration of apoprotein A 1 (apo A 1 ), the major apoprotein in HDL, and CVD risk due to its antiatherosclerotic properties. (66, 67). Regarding TG, the studies supporting hypertriglyceridemia as an independent risk factor for CVD are not as strong as other lipid components because the TG concentration is influenced by biological factors such as physical inactivity, obesity, excess alcohol consumption (68). However, hypertriglyceridemia further increases the risk of CVD by increasing sdldl particles, mainly due to greater synthesis of 22
34 VLDL, and it is an independent risk factor for metabolic syndrome (63, 68). Several cohort studies together provided an evidence of greater direct independent association between TG and CVD risk in women than in men; however, this relation was lost when controlled for HDL-C (69, 70). There are several reports documenting differences in lipid profiles among people from various ethnic/racial backgrounds. An earlier NHANES report (data from ) including 2,256 Mexican-American and 4,624 non-hispanic- White adults (>20 years) indicated that Mexican Americans had lower prevalence of dyslipidemia than non-hispanic Whites (31% vs. 35%) (71). Mexican Americans also had lower awareness (33% vs. 56%) and lower pharmacotherapy treatment rates for dyslipidemia (14% vs. 30%) than Whites (71). In contrast, more recent NHANES data ( ) shows that the lipoprotein profile of Mexican Americans is in fact more atherogenic than that of Whites (1). Mexican- American men have about 6% more LDL-C, 3% less HDL-C and 13% more TG than White men. Among women, Mexican-Americans had almost similar LDL-C, 8% less HDL-C and 8% more TG than White women (1). Similarly, a study in hypertensive adults including 1,286 non-hispanic Black and 1,070 non-hispanic White participants reported about 1.5 times greater prevalence as well as 2.7 times greater treatment and 1.8 times greater control of dyslipidemia among Whites than in Blacks (72). Nevertheless, awareness and treatment for dyslipidemia continues being inadequate among Hispanics. Among four different ethnic groups participating in the MESA study, Black and Hispanics, were approximately15% and 20% less likely to be treated, and both (Blacks and 23
35 Hispanics) were approximately 30% less likely to be controlled than Whites; Chinese Americans, on the other hand, were 20% less likely to have dyslipidemia, with no differences in treatment and control rates for dyslipidemia than Whites (73). Lipoproteins There are different types of lipoproteins that vary in function and size depending upon the ratio of lipid to protein within the particle, and in having different proportions of lipid and different apoproteins (74). Such composition differences influence the density of the particle, which further helps to classify the various lipoproteins. In order of lowest (the most concentration of lipid) to highest density, the lipoprotein fractions are: chylomicrons, very-low-density lipoproteins (VLDLs), intermediate-density lipoproteins (IDLs), low-density lipoproteins (LDLs), and high-density lipoproteins (HDLs) (74). Very-Low-Density-Lipoproteins (VLDL) VLDL is synthesized in the liver. It contains one apo B 100 molecule per particle, as well as other apoproteins (C and E). The main functions of VLDL are to carry TG to extra hepatic tissues and exchange lipids with HDL; when cholesteryl esters transferred from HDL to VLDL via cholesterol ester transfer protein (CETP), while TG and phospholipids are transferred from VLDL to HDL (75). The VLDL is larger in size because of its large TG content and thus can carry more molecules of cholesterol ester per particle than LDL (75). 24
36 Intermediate-Density-Lipoproteins (IDL) IDL is an intermediate between VLDL and LDL and can also be called a VLDL remnant. It has a short half-life in the bloodstream and has a little physiological importance (74), although the level remains high during hypertriglyceridemia. IDL originates in the blood, when TG is removed from VLDL, during the delipidation cascade or via CETP activity (76). Therefore, IDL has a greater proportion of cholesterol and cholesteryl esters than VLDL. Low-Density-Lipoproteins (LDL) LDL is formed in the intravascular compartment from VLDL and IDL. Of the total amount of the proteins in LDL, about 98% are apo B 100. LDL is the major carrier of cholesterol esters in humans (74). The plasma concentration is determined by the rate of entry into the plasma and rate of clearance by the liver and extra hepatic tissues (74). The main function of LDL is to work as a major carrier of cholesterol, by transporting cholesterol from plasma to the peripheral tissues or liver for its use in cellular metabolism such as conversion into other metabolites, membrane construction and storage (74). Heterogenity of LDL is associated with different degrees of atherosclerotic risk; sdldl is more susceptible to oxidation and therefore more atherosclerotic than large buoyant LDL (77). High-Density-Lipoproteins (HDL) HDL is made in the liver as well as in the intestine (74). It is a smaller and denser lipoprotein with higher protein content, but does not have apo B. Its primary role is to transport cholesteryl ester back to the liver, but it also plays a 25
37 role in reverse cholesterol transport, i.e. movement of cholesterol from peripheral tissues to the liver, and exchange of TG for cholesteryl ester with TG-rich lipoproteins such as VLDL and IDL through the action of CETP (78). The amount of HDL-C in the circulation is inversely related to atherosclerosis and coronary artery disease risk due to its 4 major protective properties: (1) antioxidant: it prevents lipid peroxide formation, removes lipid oxidation products from LDL and reduces monocyte-endothelial cell interaction induced by oxidized LDL; (2) anti-inflammatory: it reduces endothelial-derived adhesive proteins and hence macrophages binding and transmigration; (3) it improves endothelial function through restoration of endothelial nitric oxide synthase (enos) production, enhancement of endothelium-dependent vasodilation, inhibition of endothelin-1 synthesis, and maintenance of endothelial cell integrity by preventing apoptosis, migration and proliferation; and (4) antithrombotic: it increases blood flow through nitric oxide and prostacyclin production (75, 79). HDL is secreted by the liver as a nascent HDL that contains apo A 1. As these nascent HDL particles move into the circulation, they pick up free cholesterol and phospholipids (79). The apo A 1 acts as a reservoir for the phospholipids, allowing itself to bind to cholesterol released from cells, which is subsequently esterified on the surface of the HDL by the activity of the lecithin:cholesterol acyl transferase (LCAT) enzyme (79, 80). The hydrophobic cholesterol ester then moves to the core of the HDL particle and as the amount of cholesterol ester increases, the particle becomes larger and more spherical, forming HDL3 particles. The esterified cholesterol in HDL3 is then exchanged for 26
38 TG in apo B containing particles such as VLDL, IDL and their remnants via CETP activity, which generates the larger TG-rich HDL2 particles (80, 81). The hepatic lipase (HL) then hydrolyzes the TG of HDL2 thereby generating shdl particles that are taken up by the receptors located at the hepatic cells (80). Chylomicrons Chylomicrons are re-formed derivatives from exogenous sources (dietary fats) that are primarily synthesized in the intestine (some species formed in liver as well) (74). An important role of chylomicrons is to transport exogenous dietary lipids to tissues other than the liver such as adipocytes and muscle (74). Because TGs are the most abundant lipids found in the diet, chylomicrons also have abundance of triglycerides. Apoproteins that are found in chylomicrons are apo A, apo B 48, apo C and E (acquire from HDL while in circulation). Chylomicrons are transported by the blood throughout the tissues, while undergoing intravascular hydrolysis at certain tissue sites like muscle and adipose tissue. This hydrolysis occurs through the action of the enzyme lipoprotein lipase (LPL). Hydrolysis of chylomicrons releases free fatty acids and diacyglycerols that are quickly absorbed by the extra-hepatic tissues (74). Chylomicron Remnants The chylomicron remnant is a smaller particle that is less rich in TGs, but richer in cholesterol and cholesterol esters, which remain after the lipolytic action of LPL on chylomicrons. These remnants are removed from the circulation by the liver cells endocytosis following interaction of the remnant particles with specific receptors apo C or apo E receptors present in the liver cells (82). 27
39 Lipoprotein Metabolism and Development of Atherosclerosis Lipoproteins are a diverse class of carrier particles that contain varying amounts of TG, cholesterol, phospholipids and proteins. Their roles are to transport lipids in the intravascular circulation. Figure 1 shows the intravascular metabolism of lipoproteins. The cholesteryl ester that is formed in the liver is incorporated into the nascent TG-rich lipoprotein VLDL. As VLDL travels into the circulation, some of the TGs are taken up by extra hepatic tissues via the action of the enzyme lipoprotein lipase (LPL), forming IDL, and ultimately LDL. Both IDL and LDL can go back to the liver via LDL receptor-mediated uptake. Circulating cholesterol can also be transferred back to the liver through the reverse cholesterol transfer process (79). For this process, HDL removes cholesterol from the extra hepatic tissues, and carries it back to the liver; the intravascular cholesterol esterification is done by the activity of the enzyme, LCAT, which mainly occurs within HDL (79). Apoproteins are the protein portion of lipoproteins. They mainly serve as structural components of the lipoproteins. Their functions include increasing solubility, recognition sites for cell surface receptors, and activators or coenzymes for lipoprotein metabolism (74). Each lipoprotein particle has one or more apoproteins. According to the structure and function, apoproteins are divided into several classes and subclasses, but the function of all is not yet understood. Apoprotein-A 1 (apo A 1 ) is the major apoprotein in HDL and is a main activator for the enzyme, LCAT (74). It also has an anti-inflammatory and antioxidant properties. Apoprotein-B 100 (apo B 100 ) is synthesized in the liver and is present in 28
40 VLDL, IDL and LDL. It is also a ligand for the LDL receptors in the liver and extrahepatic tissues. Apoprotein-C 2 (apo C 2 ) is also synthesized in liver, and is transferred into the circulation in HDL. It is picked up by VLDL while circulating in lymph and blood, and is also an activator for LPL (78, 79). In contrast, apo C 3 inhibits LPL activity, and could interfere with apo-c 2 -mediated activation of LPL when it is abundant within VLDL particles. Apoprotein-E (apo E) is also an important factor of the fate of VLDL-TG, since it displaces apo-c 2, thus interfering with LPL activation (74). In addition, it is a ligand for chylomicron remnant receptor as well as LDL receptor in the liver (74). Atherosclerosis is a form of chronic inflammation resulting from interaction between modified lipoproteins, monocytes-derived macrophages, T- cells and the normal cellular elements of the arterial wall. While LDL plays an essential role as a vehicle for the delivery of cholesterol at the peripheral tissue, macrophages play a central role in the atherogenic process by modulating the lipid metabolism (83). The recruitment of macrophages to lesion-prone sites of large arteries is regulated by cell adhesion molecules such as vascular cell adhesion molecule-1 (VCAM-1), inter-cellular adhesion molecule-1 (ICAM-1) that are expressed on the surface of endothelial cells in response to inflammatory stimuli (83). Further, migration of macrophages into the artery wall is likely to be stimulated by oxidized LDL, which can directly attract monocytes (83). The accumulation of cholesterol-loaded macrophages, or foam cells, in the arterial wall is the representation of atherosclerotic lesion (83, 84). The transition from the relatively simple fatty streak to the more complex lesion is characterized by 29
41 the immigration of smooth muscle cells from the medial layer of the artery wall past the internal elastic lamina and into the intimal, or sub-endothelial, space. Intimal smooth muscle cells may proliferate and take up modified lipoproteins, contributing to foam cell formation, and synthesize extracellular matrix proteins that lead to the development of the fibrous cap (84). This phase of lesion development is influenced by interactions between macrophages and T-cells that result in a broad range of chronic inflammatory state. Although advanced atherosclerotic lesions can lead to ischemic symptoms as a result of progressive narrowing of the vessel lumen, acute cardiovascular events that result in myocardial infarction and stroke are generally due to the plaque rupture and thrombosis (83, 84). Plaque rupture exposes plaque lipids and tissue factor to blood components, initiating the coagulation cascade, platelet adherence, and thrombosis. LDL Subfractions According to ATP III, high-circulating LDL-C concentrations still remain the primary cause of CVD (9). Although the association between LDL-C concentrations and CVD has been well established, a relatively high proportion of individuals with CVD have plasma LDL-C concentrations in the normal range. LDL particles are heterogeneous according to their size, density, composition, and physicochemical properties (77). LDL can be separated into seven different kinds of particles, and based on size of particles and concentration of cholesterol in these particles, it is possible to have two main LDL phenotypes: LDL subclass A (phenotype A) is characterized by having large and buoyant LDL particles and 30
42 having greater concentration of cholesterol in larger LDL particles, and LDL subclass B (phenotype B) is characterized by having small, dense LDL(sdLDL) particles and having greater concentration of cholesterol in sdldl particles (85). It has been reported that the presence of sdldl particles increases the risk of coronary artery disease threefold even at normal cholesterol concentrations (77). The association between phenotype B and increased risk for CAD was first demonstrated in retrospective studies(86, 87) and was later supported by prospective studies (88, 89). The small dense particles are formed by an exchange of lipids between LDL and TG-rich lipoproteins such as VLDL and IDL. The cholesteryl ester contained in the core of LDL particles is exchanged for TG by CETP; HL increases lipolysis of TG-rich LDLs, reducing the core volume of the particles (90). The formation of sdldl particles increases with the presence of TG-rich lipoproteins. Thus, there is a positive correlation between TG and sdldl. The sdldl particles do not present themselves alone but exist together with the condition such as dyslipidemia, hypertension, insulin resistance and hypercoagulability (10). Individuals who have those coexisting conditions frequently have increased waist circumference and increased concentrations of CRP (91). Particularly during insulin resistance, an increased flux of free fatty acids from the periphery to the liver stimulates hepatic TG synthesis, which in turn, promotes the assembly and secretion of TG containing large VLDLs (92). When these larger VLDLs are lipolyzed by lipoprotein lipase, a population of LDL particles with changed apo B conformation is produced. These particles fail to 31
43 bind efficiently to LDL receptors and so have a prolonged residence time in the circulation. While these LDLs remain in the circulation, cholesteryl esters are replaced by TG by the action of CETP. TG rich LDL is a good substrate for hepatic lipase that finally generates sdldl. The sdldl particles are considered more atherogenic compared to the large buoyant ones due to the following reasons: 1) they have reduced affinity for LDL receptors (93); 2) they have greater binding capacity with endothelial glycoproteins that are heavily glycosylated (93); 3) they have greater tendency to penetrate the arterial intima(94); 4) they have reduced antioxidant defense, therefore, more readily oxidized by free radicals leading to modification of the apo B of LDL and rapid uptake by macrophage scavenger receptors (93). In a prospective study, the Quebec Cardiovascular Study, the presence of sdldl particles was associated with a 3.6-fold increase in the risk of ischemic heart disease, independent of the other confounding variables like diabetes, medication use and systolic blood pressure (89). At the 13-year follow up from the same study, concentrations of cholesterol in the large LDL subfraction were not associated with an increased CVD risk (95). In fact, men with elevated cholesterol concentrations within large LDLs had a more favorable CVD risk profile compared with individuals with low cholesterol concentration in the large LDL subfraction; but the concentrations of cholesterol in the sdldl subfraction were positively related to CHD events and risk (95). Similarly, another study done with healthy adults confirmed that, among men, the risk of developing CHD was significantly correlated with the amount of cholesterol in sdldl particles after 32
44 adjusting for age, smoking, diabetes, BMI, SBP and LDL-C (96). The correlation was not significant after adjustments of TG and HDL-C (96). In women, however, CHD development was not at all correlated with the concentrations of cholesterol in sdldl particles (96). A large multi-ethnic cohort study done with healthy individuals found that small and large LDL particle concentrations were inversely correlated with each other, and when LDL subclass was taken into consideration, increased total LDL particle number was associated with increased carotid intimal-medial wall thickness (28). Several risk factors contribute to the presence of a pattern B phenotype, such as increased concentration of TG rich lipoproteins, low HDL-C, and increased hepatic lipase activity. It has also been suggested that genetic background as well as race/ethnicity also contribute to LDL heterogeneity (81). A study that included Mexican Americans and Whites from the San Antonio, TX area reported significantly smaller LDL size in Mexican Americans predicting higher prevalence of LDL phenotype B in Mexican Americans than in non- Hispanic Whites. However, after adjusting for TG, glucose and insulin concentrations the difference was no longer statistically significant (97). Another study that included three ethnic groups; African Americans, Hispanics and non- Hispanic Whites, showed the ethnic differences in LDL size after adjusting for confounding factors such as: obesity, body fat distribution, glucose levels and insulin sensitivity, with the greatest amount of sdldl particles in Mexican Americans. However, after adjusting for TG and HDL-C the ethnic differences in LDL size diminished and it was no longer significant (98). 33
45 Although LDL heterogeneity appears to be a useful indicator of having CVD in presence of other CVD risk factors such as insulin resistance, obesity and/or dyslipidemia, there is scanty information about LDL phenotype and its association with CVD in Mexican Americans (81). Therefore there is a pressing need to conduct more research regarding LDL phenotype and its influence in CVD risk among Mexican Americans to derive more conclusive information in this population. HDL subfractions Similar to LDL particles, HDL particles are also categorized by their size; particles with various sizes play different roles in protection against CVD events. Clinical studies have often grouped HDL subfractions into large and shdl on the basis of particle size and generally correspond to the HDL2 and HDL3 levels obtained through gradient gel electrophoresis (99). Studies have shown that the size and distribution of HDL particles are also associated with CVD risk. These studies reported that high HDL2 concentrations were protective against CVD risk ( ). In a study with men who had a coronary angiography, age and HDL2 were the strongest predictors of the degree of CVD; individuals without CVD had two times higher concentrations of HDL2 than those with CVD (100, 101). In the same study, a weak association was observed between the HDL3 and CVD risk. Another study also reported that men with HDL2 concentrations <25 mg/dl had four times greater risk of developing myocardial infarction than those with HDL2 concentrations >39 mg/dl. Furthermore, men with HDL3 concentrations <15 mg/dl had two times higher risk than those with HDL3 concentrations >19 g/dl 34
46 (101). In this study, even after controlling for other CVD related risk factors, HDL-C and HDL2 were still inversely correlated to myocardial infarction. Similarly, in another study investigating atherosclerosis related risk with improvement in HDL particle profile, the CAD progression decreased in quantitative coronary arteriography at six months period (102). In this study, the improvement in HDL particle profile was described by higher concentration of larger HDL particles and lower concentrations of shdl particles. In contrast, in the Veterans Affairs HDL Intervention Trial (VAHIT), HDL2 particles did not predict the major CVD events, and it was concluded that increasing total HDL is more relevant against CVD risk (76). Nevertheless, not only the HDL cholesterol concentration, but also HDL particle size and the distribution of cholesterol among HDL particles have an important effect on CVD risk. A more protective effect can be achieved by increasing number of HDL2 particles and concentrations of apo A 1 compared to their smaller counterparts (11). Overweight/Obesity Obesity has become a global epidemic, 68% of adults residing in the US (72% of men and 64% of women) are either overweight or obese (29). Over the 10-year period from 1999 to 2008, the obesity prevalence increased from 28% in to 32% in among men, and from 33% in to 36% in among women (30). In addition, there are disparities in the prevalence of overweight/obesity based on race/ethnicity. Among men, Mexican Americans have a greater prevalence of being overweight/obese (80%) than Whites (73%) and Blacks (69%); among women, Blacks (78%) and Mexican 35
47 Americans (77%) have a higher prevalence than Whites (61%) (30). If the rate of obesity continues to increase at a similar trend, by 2030 it could cost $861 to $957 billion of healthcare costs, which would account for 16% to 18% of total US health expenditures (103). In the MESA study, which included participants from diverse ethnic backgrounds, excessive body weight was reported to be higher in White, African, and Hispanic Americans than in Chinese Americans; however a positive relationship between excessive body weight and CVD risk was reported even in Chinese Americans as in other ethnic groups despite of fewer Chinese Americans being overweight or obese (104). Also, in obese individuals, 17% had CAC and 45% had increased carotid IMT compared with normal body size individuals (104). Among Mexican Americans, several reports suggest that sociocultural and acculturation-related factors also affect the likelihood of being overweight/obese. According to data from NHANES that divided participants into three distinct groups: Mexico-born, the US-born Spanish-speaking, and the US-born English-speaking. In this study, Mexico-born Mexican Americans (both men and women) had smaller waist circumference than their US-born counterparts (105). Moreover, some but not all of the differences in waist circumference were explained by differences in dietary habits and physical activity. The US-born English-speaking individuals had higher levels of education, lower levels of poverty and higher employment rates than other two groups; therefore, socioeconomic status, age and education also contributed towards the differences 36
48 in the waist circumference among the groups (105). A study that included 2,420 foreign-born Hispanic adults aged 18 years and older found obesity to be related with the length of residence in the US even after adjusting for other confounding factors such as smoking, physical inactivity, self-assessed health, and chronic conditions (106). The increase in obesity was attributed to increased acculturation and adoption of inactive lifestyles of the US. Body weight adequacy is often characterized based on the body mass index (BMI), defined as an individual s weight (in kilograms) divided by height (in meter square). Based on BMI categories, overweight is defined as a BMI of 25 to 29.9 kg/m 2, and obesity is defined as BMI >30 kg/m 2. Other measurements to assess adiposity include percent body fat, waist circumference (WC), and waist-to-hip ratio (WHR). These measurements have more predictive power for estimating adiposity compared to BMI (107). Some of the disadvantages of using BMI as a measure for adiposity are: (a) BMI does not account for the difference between fat and nonfat mass such as bone and muscle; (b) BMI does not account for the changes in body composition that occur with age; and (c) BMI does not account for the relation between obesity and the outcome being measured (108). A recent study of nearly 360,000 participants from nine European countries showed that both general obesity and abdominal adiposity were associated with risk of death and support the importance of WC or WHR in addition to BMI for assessing mortality risk (31).A significant positive association has been established between obesity and increased mortality caused by CVD, some cancers, diabetes or kidney disease (109). 37
49 Obesity is associated with increased prevalence of traditional CVD risk factors such as hypertension, hyperlipidemia, diabetes and novel risk factors like hscrp concentrations (110). Moreover, obesity adversely affects the cardiac function through its influence on known risk factors such as hypertension, glucose intolerance, type 2 diabetes mellitus, dyslipidemia, and obstructive sleep apnea (110). When adipose tissue accumulates in excess amounts, numerous alterations occur in the cardiac structure and function (110, 111), including left ventricular chamber dilation, left ventricular hypertrophy, concentric remodeling, concentric left ventricular hypertrophy and left atrial enlargement. These structural changes further alter the cardiac, systolic and diastolic functions resulting in greater cardiac load, lower peripheral resistance, increased heart rate, and increase arterial pressure, which further put overweight/obese people at increased risk of heart failure and arterial fibrillation (110, 111). Therefore, an excessive body weight is an independent risk factor for abnormalities of the heart as well as of the blood vessels, and it is associated with a variety of cardiac complications including coronary heart disease, heart failure, and sudden death because of its impact on the cardiovascular system. Obesity has been demonstrated to be associated with insulin resistance (112). In the evaluation of obesity, it has become apparent that it is not only the magnitude of the increase in fat mass, but also the site of distribution that plays an important role for the development of insulin resistance, and that the intraabdominal fat has been found to be associated with the insulin resistance (113). A study done with 196 healthy individuals found that insulin resistance and obesity 38
50 attributed by intra-abdominal obesity was associated with atherogenic lipid profile: increased TG, TC, LDL-C and decreased HDL-C (113). In this study, individuals who had intra-abdominal fat and insulin resistant also had increased cholesterol concentrations in sdldl fractions, whereas the cholesterol concentration was reduced in HDL fractions. Therefore, an abnormality in body fat distribution leads to the accumulation of intra-abdominal adiposity, which in turn is associated with the development of insulin resistance, followed by dyslipidemia. Intra-abdominal fat would therefore be a contributor to an adverse lipoprotein profile and, thus, cardiovascular risk. Insulin Resistance/Diabetes Insulin Resistance Insulin is a hormone secreted by the beta-cells of the pancreas. The major role of insulin is to facilitate the transport of glucose into the cells and tissues (74). Insulin resistance occurs when the cells and tissues are unable to respond to and use insulin. It has been suggested that the decrease in glucose uptake that results from insulin resistance and the pancreas response by increasing insulin production (leading to hyperinsulinemia), which plays a vital role in the development of a variety of clinical syndromes such as obesity, hypertension and dyslipidemia, all of which increase CVD risk (77, 97, 114, 114, 115, 115, 116). At present, excess body weight and physical inactivity are thought to be the major risk factors for the development of insulin resistance. The association of obesity with insulin resistance and CVD risk is not only related to the degree of obesity but also seems to be critically dependent on body fat distribution (115). 39
51 Individuals with greater degrees of central adiposity develop CVD more frequently than do those with a peripheral body fat distribution (115). Furthermore, it has been observed that the decrease in glucose uptake mediated by insulin resistance leads to increased plasma insulin concentration, increased hepatic TG-rich VLDL secretion, and hypertriglyceridemia (114). The dyslipidemia commonly present in insulin resistance consists of hypertriglyceridemia and reduced HDL-C concentration, both of which contribute towards increased CVD risk. In addition, LDL is converted to smaller, denser particles (77). This dyslipidemia is often observed with the presence of prediabetes (i.e. the individuals with insulin resistance but without diabetes) (97). Several factors are likely to be responsible for this type of dyslipidemia such as insulin effects on the liver, apoprotein production, regulation of lipoprotein lipase, actions of cholesteryl ester transfer protein (CETP), and peripheral actions of insulin on adipose and muscle (114). Insulin and Carbohydrate Metabolism Dietary carbohydrates are ultimately broken down in the small intestine into glucose, which is then absorbed into the blood. Elevated concentrations of glucose in the blood stimulate the release of insulin, a hormone that acts on cells and tissues to stimulate uptake, utilization and storage of glucose. The effects of insulin on glucose metabolism vary depending on the target tissue (74). Two important effects are: (a) Insulin facilitates entry of glucose into muscle, adipose and several other tissues. 40
52 (b) Insulin stimulates the liver to store glucose in the form of glycogen. A large fraction of glucose absorbed from the small intestine is taken up by hepatocytes, which is converted and stored in the form of glycogen in the liver. Insulin and Lipid Metabolism The metabolic pathways for utilization of fats and carbohydrates are interrelated. Considering the important effects of insulin on carbohydrate metabolism, it can be assumed that insulin also has some important effects on lipid metabolism: (a) When the liver is saturated with glycogen, insulin promotes synthesis of fatty acids that are exported from the liver as TG in lipoproteins. TG are hydrolyzed in the circulation through the activity of lipoprotein lipase, providing free fatty acids for use in other tissues, including adipocytes, which use them to synthesize other TG (74, 114). (b) Insulin inhibits the breakdown of fat in adipose tissue by inhibiting the activity of intracellular lipase that hydrolyzes TG to release fatty acids (74, 114). Diabetes Mellitus The most prevalent form of diabetes mellitus, type 2 diabetes, is characterized by the combination of insulin resistance and defective secretion of insulin by the beta-cells of the pancreas (116). Clinically, type 2 diabetes is often diagnosed as fasting glucose >126 mg/dl and postprandial glucose (2 hr post glucose load) >200 mg/dl (117). As the United States population age, and with the increase in the prevalence of obesity and sedentary lifestyles, the prevalence of diabetes is also 41
53 increasing (1). Data from the Framingham Heart Study indicated that diabetes was increased from 5.4% in the earlier time period ( ) to 8.7% in the later time period ( ), despite a significant decline in hypertension, smoking, and elevated cholesterol (19). According to NHANES data from , about 18,300,000 adults residing in the US have diagnosed diabetes, about 7,100,000 adults have undiagnosed diabetes, and the prevalence is slightly higher in women (8.3%) than in men (7.2%) (32). Among Mexican-American men, the prevalence of diagnosed diabetes was 1.7 times higher and the prevalence of undiagnosed was 1.6 times higher than that of their White counterparts. Similarly among women, the prevalence of diagnosed diabetes was 2 times higher among Mexican Americans than among Whites, with the prevalence of undiagnosed diabetes about similar in both ethnic groups (1). Furthermore, among the US adult population, the prevalence of prediabetes, characterized by fasting glucose between 100 and <126 mg/dl, is about 37% (81,500,000 adults) (32). About 65% of people with diabetes die from heart disease or stroke, and mortality rates related to heart disease among adults with diabetes are two-tofour-times higher than the death rates for the adults without diabetes (32). On the basis of NHANES data between 1984 and 2004, the total prevalence of diabetes from 2005 to 2050, in the US, is expected to increase from 5.6% to 12%. The prevalence is expected to be increased by 99% among Whites, by 107% among Blacks, and by 127% among Hispanics (118). Data from a prospective study conducted in patients who had a myocardial infarction and no prior diagnosis of diabetes showed that one-third of individuals 42
54 actually had diabetes, which was diagnosed with a post-mi oral glucose tolerance test (119). Moreover, another third had either impaired fasting glucose or impaired glucose tolerance. Pre-diabetic individuals have an atherogenic pattern of risk factors such as hyperglycemia or hyperinsulinemia that further contributes towards the risk of developing CVD. Different ethnic groups are more likely to develop type 2 diabetes. In the Hispanic Health and Nutrition Examination Survey (HHANES) , Mexican Americans and Puerto Ricans had significantly greater prevalence of diabetes than Cubans and Whites (31). In this study, Cuban adults were more educated and had higher income than Mexican and Puerto-Rican adults; they were also more likely to have smaller number of people per household than Puerto Ricans and Mexican Americans. These socioeconomic and environmental factors could be of importance to explain the differences in the prevalence of diabetes in these Hispanic groups. However, more recent data that compares the trends of prevalence of diabetes in these three Hispanic group is not available. Pathogenesis of CVD in Insulin Resistance/Diabetes Type 2 diabetes and insulin resistance often co-occur with other CVD risk factors including dyslipidemia and hypertension (116, 117). Individuals with diabetes are at two-to-three-fold increased risk for CVD compared to those without diabetes (19). The pathogenesis of CVD in diabetes/insulin resistance is multifactorial and can be affected by metabolic factors, oxidation/glycoxidation, endothelial dysfunction and inflammation (19, 114). 43
55 Metabolic Disarrangements Metabolic disturbances associated with insulin resistance and diabetes include hyperglycemia and its derivatives, advanced glycation end products (AGEs), increased concentrations of free fatty acids, and lipoprotein alterations (19). These abnormalities are also found in individuals with the metabolic syndrome, formerly called insulin resistance syndrome (97). Similar to what is observed in with insulin resistance, lipoprotein abnormalities often observed in type 2 diabetes include elevated TG rich smaller VLDL particles and low concentration of HDL-C (114). LDL-C concentrations of diabetic individuals are similar to those without diabetes, but the particles are smaller, denser, and more atherogenic (120). The aforementioned metabolic changes in type 2 diabetes can result not only on a more atherogenic lipoprotein profile, but on altered cardiac function. This may result in part from the hypertension associated with diabetes/insulin resistance. Further, with the blockage in nerves and blood vessels done by atherosclerosis lesions, when the heart pumps blood the pressure of blood pushing against the walls of the arteries increases leading to high blood pressure (19). High blood pressure further strains the heart, damage blood vessels, and therefore increases the risk of heart attack (19). Oxidation/Glycoxidation Hyperglycemia increases oxidative stress and diminishes NO synthesis, which further leads to increased glycoxidation of circulating lipoproteins (121). In addition, hyperglycemia can result in the activation of protein kinase C, alter 44
56 insulin signaling, increase adhesion molecule gene expression on endothelial cells, and stimulate inflammation and smooth muscle cell proliferation (114, 121, 122). Diabetes can lead to the generation of free radicals by glucose-dependent and -independent mechanisms. Auto-oxidation of glucose is known to generate oxygen-centered free radicals, and the cellular oxidation of glucose leads to generation of excess ROS in mitochondria (123). Additionally, it has been proven that there is increased production of extracellular superoxide in monocytes from individuals with diabetes (123). Most molecules in the arterial wall can be modified by the spontaneous process of glycation, which is driven by hyperglycemia and is typically associated with oxidation in an irreversible process termed glycoxidation, through which proteins and lipids form advanced glycation end products (AGEs). These complex substances are highly toxic to the integrity and function of the vessel walls (120, 122, 123). It has been demonstrated an increased susceptibility to oxidative modification of LDL in insulin resistance and diabetes, in part related to compositional changes, for example, the presence of sdldl (97). Moreover, the increased generation of products of lipid peroxidation indicates an excess oxidative burden, which may be secondary to reduced antioxidant defenses (97). Oxidative stress can influence the expression of multiple genes in vascular cells that accelerates atherosclerosis (120). Evidence of oxidative damage has been demonstrated in arterial samples obtained from animal models of experimental diabetes and from human subjects with diabetes (124). 45
57 Endothelial Dysfunction Endothelial dysfunction is a shift of the actions of the endothelium toward reduced vasodilation, a proinflammatory state, and prothrombic properties (125). Endothelial dysfunction is an important early event in the pathogenesis of atherosclerosis, contributing to plaque initiation and progression (125). Endothelial dysfunction in diabetes is associated with atherosclerosis as it is accompanied by altered expression of adhesion molecules that affect thrombosis and increased permeability of oxidants and AGEs (122). Furthermore, there is evidence that there may be a discrete genetic determinant of endothelial dysfunction, as illustrated by studies of first-degree relatives of individuals with type 2 diabetes who manifest impaired endothelium dependent vasodilation in response to insulin (126). Insulin resistance promotes the release of free fatty acids from the liver; having elevated concentrations of plasma free fatty acids is harmful because of their effect on vascular cells (74, 97). Endothelial cells often utilize free fatty acids as a source of energy, but high levels of free fatty acids can lead to increased oxidative stress and diminished NO synthesis in those cells (19). Inflammation Inflammation is an essential immune response that enables survival during infection or injury and maintains tissue homeostasis under a variety of deleterious conditions (127). However, inflammation comes at the cost of a transient decline in tissue function, which can in turn contribute to the pathogenesis of diseases of altered homeostasis (127). Therefore, with insulin resistance/diabetes 46
58 inflammation not only contributes to acute cardiovascular events, but is also plays an important role in the initiation and progression of atherosclerosis (128). Several inflammatory markers have been identified in atherosclerotic lesions. Among them are cytokines and growth factors, which are released by activated macrophages (114). Cytokines increase the synthesis of platelet activating factor, stimulate lipolysis, markedly stimulate the expression of adhesion molecules, and up regulate the synthesis and cell surface expression of procoagulant activity in endothelial cells (128). Therefore, cytokines may play crucial roles not only in the initiation but also in the progression of atherosclerotic lesions. Another pathogenic phenomenon identified with insulin resistance/diabetes is increased formation of immune complexes (129). These immune complexes promote the release of tumor necrosis factor, which has been shown to up-regulate the synthesis of CRP (127). High concentrations of CRP have been demonstrated in individuals with insulin resistance, and the increase in immune complexes not only initiates and progress the process of atherosclerosis, but also contribute to plaque rupture and cardiovascular events (122, 129). C-reactive Protein Recognizing that an inflammation plays a key role in the pathogenesis of CVD led to the measurement of circulating inflammatory molecules such as C- reactive protein (CRP). A marker of systemic inflammation, CRP is an acute phase reactant that increases during tissue injury or infection. It is synthesized primarily by the hepatocytes and is stimulated by interleukin (IL)-6 and other proinflammatory cytokines (130). Hepatic production of CRP is increased by visceral 47
59 adipocyte mediated secretion of inflammatory cytokines (131). In various prospective studies, the level of circulating CRP has been measured by assessing high sensitivity C-reactive protein (hscrp), a high sensitivity assay (130). Concentrations of hscrp fluctuate in response to wide ranges of stimuli. For example, body weight, chronic as well as acute inflammation, and components of the metabolic syndrome are positively associated with hscrp; whereas weight loss and increased activity are negatively associated with hscrp (132). These associations have demonstrated the positive relationship of CRP with CVD risk factors making it as a useful component to estimate the CVD risk. Furthermore, CRP plays a vital role in the pathogenesis of atherosclerosis through several mechanisms: 1) it induces the expression of adhesion molecules by the endothelial cells, like intracellular adhesion molecule-1 (ICAM-1), vascular cell adhesion molecule-1 (VCAM-1) and E-selectin, which play an important role in the development of atherosclerosis by migrating monocytes and T-cells into the vessel wall; 2) it gradually lowers the production of NO by endothelial cells, which has a vasodilatory effects on the vascular wall; 3) it induces the release of interleukin-1 beta (IL-1 beta) and tumor necrosis factor alpha (TNF-alpha) by monocytes leading to the initiation of coagulation contributing to the pathogenesis of atherosclerosis by enhancing adhesion molecule expression, smooth cell proliferation and migration; 4) it induces apoptosis in human coronary vascular smooth muscle cells, thus promoting atherogenesis; 5) it also increases the susceptibility of endothelial cells to destruction by cell-lysis, a mechanism that could lead to plaque erosion or rupture and precipitate acute coronary syndrome; 48
60 6) it is linked to the enhanced generation of oxygen radicals by monocytes and neutrophils, thus promoting endothelial injury and development of atherosclerosis (133). CRP is increasingly being recognized as a contributor in the pathological process of several diseases, including CVD, and therefore it may be useful as an adjunct to other prognostic indicators (134). Concentration of hscrp (a measure of CRP) less than 1 mg/l is considered to be low risk for CVD, mg/l is considered to be moderate risk for CVD and greater than 3 mg/l is considered to be at high risk for CVD (21). There is growing evidence on ethnic variation in concentrations of CRP. A Canadian study that included 1,250 participants documented 2-4 times higher CRP concentrations in Aboriginals (4.25 mg/l) and South Asians (2.47 mg/l) than in Whites (1.95 mg/l) and Chinese (1.50 mg/l) (135). In this study, controlling for components of metabolic syndrome such as abdominal adiposity, BMI, TG, systolic blood pressure, glucose metabolism, HbA1c substantially reduced, although did not completely eliminate, the ethnic differences in CRP distribution. After controlling for components of metabolic syndrome and CVD the CRP concentrations decreased by 26% among Aboriginals, increased by 7% among South Asians, increased by 2% among Whites, and 55% among Chinese. Among US adults, NHANES data suggested that the ageadjusted CRP concentrations in Mexican-American and Black women was 55% and 41% higher than in their White counterparts; however CRP concentrations did not differ by race or ethnicity among men (20). In a cross-sectional study, 49
61 including 3,154 women, CRP concentrations were the highest in African- American women (3.2 mg/l), followed by Hispanics (2.3 mg/l), Whites (1.5 mg/l) and Asian women (0.6 mg/l) (136). Having a BMI >30 kg/m 2, was associated with a 6-fold increased risk of having CRP >3 mg/l. Moreover, there was a strong joint association between BMI and Waist to hip ratio (WHR) with CRP concentrations independent of age, SES, and ethnicity. In addition after adjustment for age and ethnicity, within each tertile of BMI, CRP concentrations increased with increasing WHR. Similarly, within each WHR tertile, higher CRP concentrations were observed as BMI increased (137). Although CRP appears to be a useful predictor of vascular disease in apparently healthy people, its general applicability to screening Mexican American or other ethnic populations who are at risk for CVD is currently debated because the majority of evaluations of CRP have been conducted among individuals of European origin (137). Therefore, there is a pressing need to conduct more research regarding hscrp as a screening tool for CVD risk among the Mexican-American population. Genetic Predisposition Genetic predisposition is often expressed as heredity. Heredity means parents passing their characteristics like eye color, hair color, age at onset of menopause, age at onset of chronic diseases, cognitive functioning in older age, etc. to their offspring(s) via genes (138), (139, 140). A gene is a fundamental chemical unit that carries a segment of deoxyribonucleic acid (DNA) coded with hereditary information (140). It further determines the genotype, the characteristic 50
62 a human may develop throughout their life based on information imprinted in the genes. But the characteristic that actually develops in a human is called a phenotype, which heavily depends upon the complex interaction between genes and their environment. The genetic history of the family has been predicted as an independent and non-modifiable risk factor for heart disease. Therefore, the genetic predisposition now has been recognized as a novel approach for understanding cardiovascular inheritances (141). It has been understood that the development of CVD is due to a complex interaction between environment and genetics. The relative contribution of these factors to the development of disease and the manifestation of symptoms also differs between individuals. Furthermore, genes have been identified for the particular chronic disease but the challenge is to identify the genetic components and the environments in which they are expressed, increasing the complexity of the disease. Current studies have started interpreting CVD pathways by the mutation of a large number of genes instead of the more traditional focus on single gene variants (142). A prospective genome study that followed a cohort of White female health professionals, initially free of chronic diseases, for 10.2 years confirmed the incremental contribution of genetic variation at a chromosome (9p21.3) towards the future CVD events (142). However, this genetic variation only marginally contributed towards the prediction of future CVD risk, and no independent correlation was observed between this genetic variation and traditional risk factors or inflammatory markers (hscrp). Similarly, a 51
63 longitudinal study with middle-age men, free from family history of heart disease and conventional risk factors used in the Framingham Risk algorithm, confirmed that variation in the chromosome 9p21.3 was strongly associated but was not statistically significant with CHD risk after a 15 year follow-up (143). However, the addition of a second and a third single nucleotide polymorphism (SNPs) increased the CHD risk prediction by 8.4% and 13.3%. This observation foresees that a single genotype may not be able to predict the multifactorial heart disease on its own, but when it comes together with other SNPs, that have similar allele frequency, the risk prediction can be improved significantly. Among 644 Mexican-American adults participating in the San Antonio Family Heart Study, a significant linkage between HOMA-IR and chromosome 12q24 has been reported (144). This is a region that shelters several candidate genes related to obesity and diabetes (144). In a study with Japanese youth, the mutation of genes residing in this location has been identified as a responsible factor for the onset of premature diabetes (145). There is a possibility that the chromosome 12q24 region could also possess an importance in relation to diabetes and other important CVD risk related phenotypes in Mexican Americans. Gene environment interactions have been believed to be one of the important factors for determining CVD risk (140). Genes produce their effects via proteins in an indirect way and the ultimate outcome of gene action may vary for different environments (140). Although genes do not change over the life progression, their characteristics can be modified in response to the change in the environment (140). A Twin study done with 157 adult monozygotic White twins, 52
64 reared apart or together, confirmed that plasma lipid and lipoprotein concentrations were found to be highly heritable, whereas waist-circumference, insulin resistance, plasma glucose, insulin and blood pressure were found to be moderately heritable (146). When the data was analyzed for metabolic syndrome components, waist-circumference and plasma glucose were primarily influenced by both genetic factors and environmental factors (such as parents, siblings, home, and economic factors). This indicates that these two CVD components may be affected by a variety of influences in addition to insulin resistance. Together the results proposed that genes play a dominant role in the development of CVD risk and that there are common genetic and environmental influences that affect certain CVD components, leading to the development of metabolic syndrome. In the Mexican American population, genetic influence on phenotypes such as BMI, waist circumference, percent body fat, WHR, fasting glucose, fasting insulin, blood pressure, etc. has been documented (147). A study with 42 extended family members of Mexican Americans confirmed the contribution of both genetic and environmental influences to a large panel of CVD risk factors, such as serum lipids, lipoproteins, glucose, hormones, adiposity, and blood pressure (147). In this study, for the lipid and lipoprotein phenotypes, environmental covariates such as age, gender, etc. accounted for <15% of the total phenotypic variation, whereas genes accounted for 30% to 45%. Similarly, genes also accounted for 15% to 30% of the phenotypic variation of glucose, hormones, adiposity, and blood pressure. This raises the question whether Mexican Americans have certain non-modifiable genetic predisposition that in combination 53
65 with environmental influences could lead to CVD and other chronic diseases. Therefore, a future advancement in CVD genetics has to rely on the ability to understand multiple SNPs that have similar allele frequencies and the geneenvironment interaction rather than on single gene-focused research. Figure 1: Lipoprotein Metabolism Abbreviations: A, apoprotein A; B, apoprotein B; C apoprotein C; CE, cholestryl ester; CETP, cholestryl ester transfer protein; Chol, cholesterol; E, apoprotein E; HDL, high-density lipoprotein; IDL, intermediate-density lipoprotein; LCAT, lecithin-cholesterol acyltransferase; LPL, lipoprotein lipase; LDL-R, low density lipoprotein receptor; LDL, low density lipoprotein; TG, triglyceride; VLDL, verylow-density lipoprotein.. 54
66 CHAPTER 3 MATERIALS AND METHODS The present study was conducted in a sub-sample of Maricopa County Insulin Resistance Initiative participants to evaluate CVD risk factors among Mexican Americans residing in the Phoenix metropolitan area. Participants had already been recruited as a part of the Health Research Alliance Arizona / Arizona Insulin Resistance Registry, and their blood samples had been collected. The present study used one of the aliquots of archived serum for the measurement of a complete lipid panel (TC, LDL-C, HDL-C and TG), hscrp (as a biomarker of inflammation), and the distribution of cholesterol in LDL and HDL particles. In this section the Maricopa County Insulin Resistance Initiative will be described first, followed by the protocol for the proposed sub-study. Maricopa County Insulin Resistance Initiative Protocol The Health Research Alliance Arizona / Arizona Insulin Resistance Registry was developed with the purpose of creating a HIPAA compliant, biomedical informatics driven database of individuals who could participate in clinical research in the area of the metabolic syndrome. The goal is to develop a database of more than 1000 individuals who are representative of the service base of the Health Research Alliance Arizona / Arizona Insulin Resistance Registry and the surrounding communities. Participants were screened for components of the metabolic syndrome, and they donated additional serum, RNA, and DNA samples for a specimen bank. The study was been approved by the Institutional Review Board at Arizona State University [Appendix A]. 55
67 Subjects: Participants recruited for the Health Research Alliance Arizona / Arizona Insulin Resistance Registry include individuals self-identified as Latino or Mexican-American, 12 to 65 years old, who have never been diagnosed with insulin resistance or diabetes i.e. participants self-reported being free of diabetes and those who were found to meet the criteria for diabetes diagnosis were unaware of having it. Also, at the time of recruitment none of the participants in the study were taking medications for diabetes. Whenever a participant was identified to meet the diagnostic criteria for diabetes at the time of participation they were suggested to contact a physician to follow up and confirm the diagnosis. Recruitment: Participants were recruited through the Health Research Alliance Arizona / Arizona Insulin Resistance Registry clinics as well as community clinics and other organizations providing services to the Hispanic community, and through advertisements in Spanish language media. Informed Consent: After receiving a thorough explanation of the study purpose and procedures and allowing time to answer questions, all participants gave written consent to participate. Participants were given the option to consent to donate an additional blood sample for the creation of a serum, DNA and RNA bank. Consent forms were available in English and Spanish [Appendices B and C]. Study Protocol: Participants, who had been fasting at least eight hours overnight, completed a short medical history questionnaire, after which height and weight, waist and hip circumferences, blood pressure and body composition were 56
68 measured. Body composition was measured using a bioelectrical impedance analyzer (BIA- 310e; Biodynamics, Seattle, WA). A urine sample was collected from each participant for the analysis of microalbumin. An intravenous line was then placed in the arm for blood drawing purposes and a fasting blood sample was obtained (20 ml) for measurement of glucose, insulin, serum lipids, HbA1c, blood chemistry and a complete blood count. An extra 21 ml of blood were collected from the participants who consented for sample archiving for the creation of a serum, DNA and RNA bank. An oral glucose tolerance test was then performed using a standard 75g glucose solution, with blood collected at times -30, -15, -5, 0, 30, 60, 90 and 120 minutes (2 ml each). Samples were sent to a Clinical Laboratory Improvement Amendments (CLIA) certified laboratory (Sonora Quest, Phoenix, AZ) for the measurement of glucose, lipids, blood chemistry, blood count and HbA1c. A study physician interpreted the blood parameter values, and the participants were reported with their results. Participants who had abnormal blood glucose profile and/or other metabolic abnormality were suggested to contact a physician for appropriate care. Serum insulin concentrations were determined using an enzyme immunoassay (ALPCO Diagnostics, Salem, NH). Serum glucose was measured using a YSI 2300 Stat Plus glucose and lactate analyzer (YSI Incorporated Life Sciences, Yellow Springs, OH). DNA and RNA were isolated and purified using PAXgene blood DNA and RNA systems, respectively (PreAnalytiX, Franklin Lakes, NJ). 57
69 Present Study Protocol Materials: Reagents for measuring TC, LDL-C, HDL-C, TG and hscrp as well as deionized water were purchased from Roche Diagnostics (Indianapolis, IN). The LDL and HDL electrophoresis kits containing LDL and HDL gel tubes, loading gels, and buffer salts (tris aminomethane 66.1 g/100 g, boric acid 33.9 g/100 g, ph ) were purchased from Quantrimetrix Corporation (Redondo Beach, CA). Samples: Analyses for the present study were done using one aliquot (500 l) of archived serum from eighty overweight/ obese participants selected from the Health Research Alliance Arizona / Arizona Insulin Resistance Registry. Selected samples were from participants who were 30 to 65 years old, who selfreported being free of insulin resistance or diabetes and had self-identified as Latino or Mexican American. Participants who met the criteria of hyperglycemia or diabetes diagnosis were unaware of having it. The age criteria was used for the participants in order to meet the requirements of using the Framingham risk score to calculate 10-year CVD risk. Sample selection was conducted systematically using SPSS 17.0 for Windows (SPSS Inc., Chicago, IL) as follows. Of the 399 participants in the Maricopa Insulin Resistance Registry, only participants who were 30 years and older and were overweight and obese (BMI>25kg/m 2 ) considered for the present study. Participants who met those inclusion criteria were stratified in the database according to their TG, HDL-C and glucose concentrations and were further divided into four different sub-groups depending upon their diabetic dyslipidemia 58
70 (low HDL-C and high TG) status as well as varying degree of hyperglycemia. For example: first group had healthy participants with normal lipid and glycemic profiles (NC); second group had normodyslipidemic-normoglygemic participants (DN) defined by high TG (>150 mg/dl) and low HDL (<40 mg/dl for men and <50 mg/dl for female) but normal glycemic profile; third group had dyslipidemic-prediabetic participants (DPD) defined by high TG and low HDL accompanied by IGT and/or IFG; and fourth group had dyslipidemic-diabetic participants (DD) defined by high TG and low HDL accompanied by type 2 diabetes. After separating the participants in four different groups, we randomly selected one aliquot of archived serum samples of 20 participants from each groups i.e. 20 from NC group; 20 from DN group; 20 from DPD group; and 20 from DD group, for a total sample size of 80. No additional blood was drawn from study participants for purposes of this study. The samples were transported from the Clinical Research Unit (Tempe Campus, ASU) to the Nutrition laboratory (Polytechnic East Campus, ASU) following a protocol approved by the Institutional Biosafety Committee at Arizona State University [Appendix D]. Methods: A complete lipid panel (TC, LDL-C, HDL-C and TG) was measured in serum with colorimetric enzymatic assays using an automated chemistry analyzer (Cobas C111; Roche Diagnostics, Indianapolis, IN). Serum hscrp was measured using a turbidimetric assay using an automated chemistry analyzer (Cobas C111; Roche Diagnostics, Indianapolis, IN). The automated chemistry analyzer was calibrated and tested for quality control for each analysis. For the reliability of the process, quality control tests were run for each assay 59
71 before the samples were analyzed. For the validity, the serum samples were analyzed in triplicates; for a given sample if the concentrations of parameter(s) analyzed were out of range or the concentrations achieved in triplicates differ drastically then the sample(s) was reanalyzed for that parameter(s). LDL and HDL particles were separated by polyacrylamide tube gel electrophoresis using the Lipoprint system (Quantimetrix Co., Redondo Beach, CA) followed by densitometric quantification of cholesterol in each of the lipoprotein subfractions as described below. Density of the bands containing lipoproteins of different sizes was quantified after densitometry scanning using Lipoware software (Quantimetrix Co., Redondo Beach, CA). Quantimetrix Lipoprint LDL System. Briefly, 25 L of sample and 200 L of loading liquid gel were loaded onto precast linear polyacrylamide gel (stacking gel and separating gel) tubes. After mixing, the acrylamide loading gel was photopolymerized for 30 minutes in the presence of fluorescent light, at room temperature. Samples were electrophoresed for 60 minutes using a current of 3mA/ tube, in a chamber containing the running buffer solution (tris aminomethane 66.1 g/100 g, boric acid 33.9 g/100 g, ph ). Tubes were scanned for computer assisted data analysis using Lipoware LDL Research Use software (Quantimetrix Co., Redondo Beach, CA). Quantimetrix Lipoprint HDL System. Briefly, 25 L of sample and 300 L of loading liquid gel were loaded onto precast linear polyacrylamide gel (stacking gel and separating gel) tubes. After mixing, the acrylamide loading gel was photopolymerized for minutes in the presence of fluorescent light, at room 60
72 temperature. Samples were electrophoresed for 50 minutes using a current of 3mA/ tube, in a chamber containing the running buffer solution (tris aminomethane 66.1 g/100 g, boric acid 33.9 g/100 g, ph ). Tubes were scanned for computer assisted data analysis using Lipoware HDL Research Use software (Quantimetrix Co., Redondo Beach, CA). While analyzing both LDL and HDL subfractions, the analyses conducted were tested for reliability and validity. Quality controls were run before analyzing the serum samples to check reliability. Similarly, if the analyses showed an abnormal result then that sample was reanalyzed for the validity. Insulin was measured in serum samples with a chemiluminescence solid-phase immunometric assay using an automated immunoassay analyzer (Immulite; Siemens Healthcare Diagnostics Inc., Deerfield, IL). The automated immunoassay analyzer was calibrated and was tested for quality control. The working principle of this analyzer is that the sample and reagent are incubated together with the coated beads for 60 minutes. During this time, insulin in the sample forms the antibody sandwich complex. Unbound patient sample and enzyme conjugate are then removed by centrifugal washes. Lastly, a chemiluminescent substrate is added to the test unit containing the bead and the signal is generated in proportion to the bound enzyme. For the reliability of this test, quality controls were run before analyzing the serum samples. And for the validity, if the analyses showed an abnormal result then that sample was reanalyzed. 61
73 Calculation of Framingham and HOMA Score: Cardiovascular disease risk was calculated using the Framingham score (148). This simplified coronary heart disease prediction algorithm was built using blood pressure and cholesterol categories defined by the Joint National Committee on Blood Pressure and the National Cholesterol Education Program, and was designed in a community-based cohort setting (Framingham Heart Study) that included more than 5,000 people followed for 12 years (148). The algorithm uses age, TC or LDL-C, HDL-C, blood pressure, diabetes and smoking for the prediction of coronary heart disease risk. A gender-specific algorithm with LDL-C categories was used to calculate the individual 10-year probability of developing coronary heart disease. Insulin sensitivity was assessed by calculating the homeostatic model assessment (HOMA) score (149, 150). HOMA was calculated according to the following formula: HOMA = glucose (mm) x insulin (μu/ml)/22.5. Glucose values measured in the Maricopa County Insulin Resistance Initiative Study were used for the assessment. Statistical Analysis: Statistical analyses were conducted using SPSS 17.0 for Windows (SPSS Inc., Chicago, IL). Data were summarized using descriptive statistics (mean and standard deviation). Descriptive data are provided in tables. Data were explored for normality and if needed were log/inverse transformed to achieve normality and so indicated in the tables. A correlation analysis was used to explore the relationship between the independent CVD risk factors including LDL-C, TG, HDL-C, hscrp and cholesterol in sdldl particles, with CVD Framingham risk score. A correlation analysis was used to explore the association 62
74 between total cholesterol in sdldl particles and insulin resistance assessed using the HOMA score. A one-way analysis of variance (ANOVA) was used to test the differences in LDL-C, HDL-C, hscrp, cholesterol in LDL and HDL particles, and cholesterol and HDL-C in HDL subfractions among participants classified as normolipidemic-normoglycemic-controls, dyslipidemic-normoglycemic, dyslipidemic-prediabetic, and dyslipidemic-diabetic. Dunnett s T3 post-hoc test was used for the parameters that were not homogenous (fasting glucose, 2-hr glucose, HDL, TG, hscrp and diastolic blood pressure) and Tukey s post-hoc test was used for rest of the parameters to find differences between means in pairwise comparisons. Fasting glucose, HbA1c, TG, % 10-yr CVD risk, mean LDL size, mean LDL size, and % cholesterol in intermediate HDL particles, HDL cholesterol, hscrp, % of cholesterol in the sdldl particles, insulin and HOMAscore were non-normally distributed. The one-way ANOVA assumes normality; therefore it was necessary to use a natural log/inverse transformation for the data prior to using the statistical analyses. When normality was not achieved even after transformations (fasting glucose, HbA1c, TG, % 10-yr CVD risk, mean LDL size, mean LDL size and mean LDL peak, and % cholesterol in intermediate HDL particles), variables were analyzed using a non-parametric Kruskal-Wallis test for the differences. Further Mann-Whitney, non-parametric t-test, was used to find the differences between means in each pair-wise comparison. Analyses were conducted at the 0.05 alpha level. 63
75 The bivariate Pearson correlation also assumes normality; therefore it was necessary to use a natural log/inverse transformation for the data prior to using the statistical analyses. When normality was not achieved after transformation (fasting glucose, TG, mean LDL size, mean LDL peak, % of cholesterol in the larger LDL particles, % of cholesterol in intermediate HDL particles and the 10- year CVD risk) variables were analyzed using non-parametric Spearman s correlation. Sample Size Calculation: A preliminary cross-sectional study in adults with normal controls and diabetics provided data for sample size calculation (151). They reported that controls had 11.8% ( 10.1) of LDL and diabetics had 23.4% ( 14.4) cholesterol in sdldl particles. This represents 98% higher amount of cholesterol in sdldl particles in participants with diabetes. We anticipated the difference would be smaller in people with prediabetes. Therefore, we estimated to detect the difference as large as 30% we would need 20 participants per group. The alpha level was set at 0.05 and beta error level at 0.2 (i.e. a power of 80% to detect a difference as large as 30%). 64
76 CHAPTER 4 RESULTS Descriptive Characteristics Table 1 shows the descriptive characteristics of study participants divided into the four different groups: normolipidemic/normoglycemic controls (NC), dyslipidemic/normoglycemic (DN), dyslipidemic/prediabetic (DPD), and dyslipidemic/diabetic (DD). Mean age was 41.6±7.8 years. Participants in the DD group were the oldest (45.1±8.6 years), and were significantly older than participants in the DN group (38.7±8.1 years; p=0.035). Per study inclusion criteria, all participants were either overweight or obese to minimize confounding due to adiposity. Mean BMI was 32.2±7.1 kg/m 2, and no significant differences were observed for BMI among the groups (p=0.664). Out of 80 participants, 65% were females and 35% were males. There were significantly more female participants in the NC and the DD groups (70%) than in the DN and DPD groups (60%; p=0.007). Regarding smoking, a large majority of the study participants self-identified as non-smokers, with significantly fewer smokers in the DPD group (15%) than in the other groups (20% for all other groups; p<0.0001). The prediabetes or diabetes was defined based on fasting glucose values and/or oral glucose tolerance test results. Prediabetes was defined as a) impaired fasting glucose (IFG; fasting glucose >100 mg/dl but <126 mg/dl), b) impaired glucose tolerance (IGT; 2-hr glucose >140 mg/dl but <199 mg/dl), or c) both. In the DPD group (Figure 2A), 15% of participants had IFG, 10% had IGT and 75% had both. Diabetes was defined as hyperglycemia after a 2-hr glucose 65
77 tolerance test (2-hr glucose > 200 mg/dl) regardless of fasting glucose concentrations. Participants with diabetes were also stratified based on fasting glucose concentrations as follows: a) fasting normoglycemia (NG; fasting glucose < 100 mg/dl), b) impaired fasting glucose (IFG; fasting glucose >100 mg/dl but <126 mg/dl), or c) fasting hyperglycemia (FHG; fasting glucose >126 mg/dl). In the DD group (Figure 2B), in addition to hyperglycemia after a 2-hr glucose tolerance test, 20% of participants had fasting normoglycemia, 35% had impaired fasting glucose, and 45% had fasting hyperglycemia. Cardiometabolic Disease Risk Factors The cardiometabolic disease risk factors of study participants are displayed in Table 2. As expected, participants in the DD group had the highest and the NC group had the lowest fasting glucose concentration ( mg/dl and , respectively); fasting glucose was significantly higher in DD participants relative to the other groups (p<0.0001). Fasting glucose was 69% greater in DD, 12% greater in DPD, and 7% greater in DN participants than those in the NC group. For 2-hr glucose, participants in DD group had 168% and 136% higher fasting glucose ( mg/dl) than participants in the NC ( mg/dl) and DN ( mg/dl) groups, respectively (p<0.0001). Relative to NC and DN participants, DPD participants ( mg/dl) had 70% and 42% higher concentrations of 2-hr glucose, respectively (p<0.0001). This explains the insufficiency and/or insensitivity of insulin to clear glucose from the bloodstream in the presence of increasing insulin resistance. For HbA1c, DD participants had 36%, 29% 33% higher HbA1c values than NC, DN and DPD 66
78 participants ( vs , , ), and DPD participants had 5.5% higher HbA1c values than NC participants with no differences between NC and DN participants. The differences were statistically significant (p<0.0001). No significant differences in insulin concentrations were observed among the groups. However, as predicted, the DD ( mg/dl) and DPD groups ( mg/dl) had higher concentrations of insulin compared to the NC ( mg/dl) and DN groups ( mg/dl). As shown in Figure 3, HOMA score was 133%, 88% and 75% higher in the DD group ( ) compared to the NC, DN and DPD groups ( , and , respectively; p=0.001). Blood pressures, systolic and diastolic, were significantly different among the groups (systolic p=0.036; diastolic p=0.044; Table 2). Systolic blood pressure was 12% higher in DD group ( mm Hg) than the NC group ( mm Hg), with no difference between DN ( mm Hg) and DPD ( mm Hg) groups. Similarly, diastolic pressure was 10% higher in the DD group ( mm Hg) than in the NC group ( mm Hg), with no differences in the DN ( mm Hg) and DPD groups ( mm Hg). HDL-C was negatively correlated with FG and 2-hr glucose (r= -0.38, p= 0.001; r= -0.29, p=0.013; respectively), and LDL-C was positively correlated with FG and 2-hr glucose (r= 0.26, p= 0.02; r= 0.37, p=0.001, respectively), as shown in Table 3. Fasting serum lipids and hscrp concentrations are shown in Table 2. Individuals in the NC group ( mg/dl) had the lowest and individuals in DD group ( mg/dl) had the highest TC concentration (p<0.0001); 67
79 individuals in the DD group had 30% more TC than those in the NC group. There was a gradual increase in TC concentrations among individuals with increasing degree of hyperglycemia (NC, DN, DPD and DD had mg/dl, mg/dl, mg/dl, and mg/dl, respectively; p<0.0001). LDL-C concentration was 27% and 12% higher in the DPD ( mg/dl) compared to the NC ( mg/dl), and DN groups ( mg/dl), respectively (p=0.013). Similarly, DD ( mg/dl) had 29% and 13% higher LDL-C concentrations than the NC ( mg/dl) and DN groups ( mg/dl), respectively (p=0.013). As per study design, HDL-C ( mg/dl; p<0.01) was the highest and TG ( mg/dl; p<0.01) was the lowest in the NC group compared to the other three groups. Interestingly, the DD group ( mg/dl) had the lowest concentration of hscrp relative to the other groups. However, concentrations of hscrp were not significantly different among groups (p=0.683). There was a significant increase in % 10-year CVD risk with increasing degree of hyperglycemia (p<0.0001), as shown in Figure 4. Percent 10-year CVD risk in DD participants ( %) was roughly three times greater than risk in NC and DN participants ( % and %, respectively; p<0.0001). Percent 10-year CVD risk in DD participants was 1.8 times greater than risk in DPD participants ( %; p<0.0001). Similarly, DPD participants had two times greater 10-year CVD risk than NC participants, which was statistically significant. 68
80 LDL and HDL Phenotypes As illustrated in Table 4 and Figure 5, NC participants had significantly less TC in the sdldl particles (0.6±1.2% of TC; p<0.0001) than all dyslipidemic individuals, regardless of their hyperglycemic status (4.0±3.2%, 6.0±6.0%, and 4.9±3.3%, respectively for DN, DPD and DD participants). Accordingly, as shown in Table 4, NC individuals had significantly larger LDL particles (mean diameter = 272.7±3.0 Å; p<0.0001), than dyslipidemic individuals (mean diameter = 266.1±4.0 Å, 265.1±6.0 Å, and 264.2±6.3 Å, respectively for DN, DPD and DD participants). LDL particles were 2.5% larger, 3% larger and 3.4% larger in NC group than those in DN, DPD and DD groups. In-depth illustrations of HDL subfractions are provided in Table 5 and Figure 6. Dyslipidemic participants, irrespective of their prediabetes or diabetes status, had a lower proportion of HDL-C in the larger HDL particles than their NC counterparts (28.7±9.1% vs. 19.4±7.1%, 18.4±6.2% and 16.8±6.1%, for NC vs. DN, DPD and DD, respectively; p<0.0001). NC participants had significantly more HDL-C in the larger HDL particles than the other groups, whereas those with prediabetes had significantly more HDL-C in the shdl particles (15.9±5.2% vs. 22.5±10% and 26.8±9.1%, respectively for NC, DPD and DD; p=0.001). Further, like HDL-C, the TC was also distributed differently in HDL subfractions. NC participants had significantly more TC in larger and intermediate HDL particles than participants in other groups ( % vs %, %, %, and % vs %, %, %), respectively. However, NC participants ( %) had significantly more TC and DN 69
81 participants ( %) had significantly less cholesterol in shdl particles with no differences in DN and DPD participants ( %, %; p=0.023). Relationship between CVD Risk Factors and 10-year CVD Estimates Although the 10-year CVD risk was either positively or negatively correlated with all the lipid parameters, the results of statistical analyses of HDL- C and LDL-C with the 10-year CVD estimates were not determined because the 10-year CVD risk estimation was based on these variables. The relationship between CVD risk factors and % 10-year CVD risk, as determined by correlation analysis, is provided in Table 3 and Table 4. Serum concentrations of TG and TC were positively correlated with the 10-year CVD risk (r=0.384, p< and r=0.340, p<0.05, respectively). The distribution of cholesterol in sdldl particles was positively correlated with % 10-year CVD risk (r=0.247; p<0.05) and the distribution of cholesterol in intermediate and larger HDL-C was negatively correlated with % 10-year CVD risk (r=-0.38, p=0.001; r=0.34, p=0.002, respectively). However, no significant correlation between hscrp and % 10-year CVD risk was found (r=0.08; p=0.478). Further, the ratio of TC and HDL-C (TC/HDL) was positively correlated with % 10-year CVD risk, TC in sdldl particles and HDL-C in shdl particles (r=0.404, p<0.0001; r=0.698, p<0.0001; r=0.602, p<0.0001) respectively. A negative association was also obtained between the TC/HDL and percentage of the cholesterol in shdl, intermediate and large HDL particles (r=-0.35, p=0.002; r=-0.91, p<0.0001; r=-0.84, p<0.0001), respectively. Similarly, a negative association was obtained between 70
82 the TC/HDL a percentage of HDL-C in the larger HDL particles, (r=-0.562, p<0.0001). Table 1. Characteristics of Participants 1 Variables All (N=80) NC (n=20) Groups 2,3 P- DN DPD DD Value (n=20) (n=20) (n=20) Age (Years) ab +8.1 b +6.1 ab +8.6 a BMI (kg/m 2 ) Gender 5 Female% (n) 65(52) 70(14) 60(12) 60(12) 70(14) Smoking % (n) 5 19(15) 20(4) 20(4) 15(3) 20(4) Data shown as mean ± SD or %; values with different superscripts are significantly different 2 NC: Normoglycemic normolipidemic Controls; DN: Dyslipidemic Normoglycemic; DPD: Dyslipidemic Prediabetic; DD: Dyslipidemic Diabetic 3 Criteria for defining Dyslipidemia = HDL and TG; Criteria for defining Prediabetic = IFG (fasting glucose > mg/dl) and/or IGT (2-hr glucose level >140-<200 mg/dl after 75g oral glucose tolerance test); Criteria for defining Diabetic = 2-hr glucose level >200 mg/dl, after 75g oral glucose tolerance test 4 One-way ANOVA was used to test the differences, and Tukey s posthoc was used to find differences between means in pair-wise comparisons 5 CHI non-parametric was used to test the differences in the variable 71
 of participants in DIR group Impaired fasting glucose (IFG): >100 - <126 mg/dl Impaired glucose tolerance")
83 Prevelance Figure 2A. Criteria for Defining Insulin Resistance in Particiants in DIR Group 1 1 Data shown as % (n) of participants in DIR group Impaired fasting glucose (IFG): >100 - <126 mg/dl Impaired glucose tolerance (IGT): >140 - <199 mg/dl Figure 2B. Distribution of Fasting Glucose Concentrations among Diabetic Participants (DD Group) (9) (7) (4) Fasting Glucose < Fasting Glucose < 126 Fasting Glucose Diabetic: Glucose level >200mg/dL after 2-hr oral glucose (75g) tolerance test; data shown as % (n) of participants in DD group 72
84 Table 2. Cardiometabolic Disease Risk Factors among Study Participants 1 Groups 2,3 Variables NC DN DPD DD (n=20) (n=20) (n=20) (n=20) P- Value Fasting Glucose (mg/dl) d +6.2 c 6.91 b a 2-hr Glucose (mg/dl) 5, c c b a HbA1c c bc +0.3 b +2.2 a Fasting Insulin (μiu/ml;n=73) HOMA (n=73) b +1.8 b +1.8 b +2.8 a Fasting TC (mg/dl) c bc ab a Fasting LDL (mg/dl) b ab a a Fasting HDL 5, (mg/dl) a b +6.9 b b FastingTG (mg/dl) 32.3 b a a a hscrp (mg/l) % 10 yr CVD risk c bc b a Systolic BP (mmhg) 6, b ab ab a Diastolic BP (mmhg) b ab ab a Data shown as mean±sd; values with different superscripts are significantly different. 2 NC: Normoglycemic Normolipidemic Controls; DN: Dyslipidemic Normoglycemic; DPD: Dyslipidemic Prediabetic; DD: Dyslipidemic Diabetic. 3 Defining criteria: Dyslipidemia = HDL and TG; Prediabetic = IFG (fasting glucose > mg/dl) and/or IGT (2-hr glucose >140-<200 mg/dl, after 75g oral glucose tolerance test); Diabetes = 2-hr glucose >200 mg/dl, after 75g oral glucose tolerance test. 4 Not normally distributed after log, square root and inverse transformations; analyzed using Kruskal-Wallis test with Mann-Whitney post-hoc test for pair-wise comparisons. 5 Analyzed using one-way ANOVA with Dunette T3 s post-hoc test for pair-wise comparisons. 6 Inverse transformed to achieve normality; 7 Analyzed using one-way ANOVA with Tukey s posthoc test for pair-wise comparisons; 8 Log transformed to achieve normality 73
85 Figure 3: HOMA-Score in-between The Groups b b Note: HOMA-IR was calculated according to the following formula: HOMA = glucose (mm) x insulin (μu/ml)/22.5 Table 3: Pairwise Correlations among CVD Risk Factors Relationship between r P-Value Fasting glucose and HDL cholesterol hr glucose and HDL cholesterol * Fasting glucose and LDL cholesterol hr glucose and LDL cholesterol 0.37 * % 10-yr CVD risk and triglyceride < % 10-yr CVD risk and total cholesterol % 10-year CVD risk and hscrp TC/HDL and % 10-year CVD risk < Correlation coefficient by Spearman s correlation analysis *Correlation coefficient by Pearson s correlation analysis 74
86 Table 4: Pairwise Correlations among CVD Risk Factors and Distribution of TC and HDL-C in LDL and HDL Subfractions, Respectively. Relationship between r P-Value % 10-yr CVD risk and distribution of the total cholesterol in the small, dense LDL particles. % 10-yr CVD risk and distribution of total cholesterol in intermediate HDL particles. % 10-yr CVD risk and distribution of total cholesterol in larger HDL particles. TC/HDL and distribution of the total 0.67* < cholesterol in the small, dense LDL particles. TC/HDL and distribution of the total -0.35* cholesterol in the smaller HDL particles. TC/HDL and distribution of the total < cholesterol in the intermediate HDL particles. TC/HDL and distribution of the total -0.84* < cholesterol in the larger HDL particles. TC/HDL and distribution of the HDL 0.60* < cholesterol in the smaller HDL particles. TC/HDL and distribution of the HDL cholesterol in the larger HDL particles * < *Correlation coefficient by Pearson s correlation analysis + Correlation coefficient by Spearman s correlation analysis Figure 4: Percent 10-Yr CVD Risk among Participants with Increasing Degree of Hyperglycemia Note: Percent 10-yr CVD risk was calculated using gender specific algorithm that uses age, LDL-C, HDL-C, blood pressure, diabetes and smoking for the prediction of coronary heart disease event) 75
87 Table 5. Cholesterol Distribution in LDL Subfractions 1 P- Variable Groups 2,3 NC (n=20) DN (n=20) DPD (n=20) DD (n=20) Value Mean LDL size a +4.0 b +6.0 b +6.3 b Mean LDLpeak a +7.1 b b +5.9 b %LDL a +4.2 b +4.7 b +4.1 b %LDL b +3.2 a +3.8 a +4.0 a %LDL b +2.6 a +3.3 a +2.5 a %LDL % Larger LDL % Smaller LDL 6,7, a b b b Data shown as mean ± SD; values with different superscripts are significantly different. 2 NC: Normoglycemic normolipidemic Controls; DN: Dyslipidemic Normoglycemic; DPD: Dyslipidemic Prediabetic; DD: Dyslipidemic Diabetic 3 Defining criteria: Dyslipidemia = HDL and TG; Prediabetic = IFG (fasting glucose > mg/dl) and/or IGT (2-hr glucose level >140-<200 mg/dl, after 75g oral glucose tolerance test); Diabetes = 2-hr glucose level >200 mg/dl, after 75g oral glucose tolerance test 4 Not normally distributed after log, square root and inverse transformations; analyzed using Kruskal-Wallis test with Mann- Whitney post-hoc test for pair-wise comparisons 5 Sum of (%LDL-1, %LDL-2) 6 Sum of (%LDL-3, %LDL-4) 7 Log transformed to achieve normality 8 One-way ANOVA was used to test the differences, and Tukey s post-hoc was used to find differences between means in pair-wise comparisons 76
 Groups 2,3 DPD DD P- (n=20) (n=20) DN (n=20) 77 Valu e 0.000 +6.1 b % Larger 28.7 19.4 18.4 16.8 HDL 4 +9.1 a +7.1 b +6.")

88 Figure 5: Total Cholesterol Distribution in LDL Subfractions (P<0.0001) Table 6. HDL Cholesterol Distribution in HDL Subfractions 1 Variables NC (n=20) Groups 2,3 DPD DD P- (n=20) (n=20) DN (n=20) 77 Valu e b % Larger HDL a +7.1 b +6.2 b % Intermediate HDL % Smaller HDL b +6.8 ab +9.6 a +9.1 a 1 Data shown as mean ± SD; values with different superscripts are significantly different. 2 NC: Normoglycemic normolipidemic Controls; DN: Dyslipidemic Normoglycemic; DPD: Dyslipidemic Prediabetic; DD: Dyslipidemic Diabetic 3 Defining criteria: Dyslipidemia = HDL and TG; Prediabetic = IFG (fasting glucose > mg/dl) and/or IGT (2-hr glucose level >140-<200 mg/dl, after 75g oral glucose tolerance test); Diabeties = 2-hr glucose level >200 mg/dl, after 75g oral glucose tolerance test 4 One-way ANOVA was used to test the differences, and Tukey s post-hoc was used to find differences between means in pair-wise comparisons

89 Figure 6: Total Cholesterol Distribution in HDL Subfractions Note: TC in Larger HDL particles P< TC in Intermediate HDL particles P< TC in Smaller HDL particles P=
90 CHAPTER 5 DISCUSSION The importance of achieving and maintaining healthy, normal serum lipoprotein and inflammatory biomarker profiles to reduce the risk of developing CVD in healthy and at risk populations cannot be overstated. Some racial/ethnic groups, such as Mexican Americans, suffer from higher rates of CVD (24). Moreover, important disparities exist in CVD risk among this minority group compared to Whites including higher rates of overweight/obesity, insulin resistance and diabetes, physical inactivity, and higher prevalence of abnormal lipid concentrations (24). Furthermore, genetics in combination with these lifestyle related/environmental factors may also explain the higher prevalence of CVD in this population (147). In order to minimize the risk and prevent CVD among Mexican Americans, it is important to assess the factors that contribute to CVD development, and design and implement interdisciplinary interventions to lower risk before or as soon as the abnormal risk factors are observed. This study was conducted to evaluate CVD risk among Mexican Americans by measuring concentrations of TC, LDL-C, HDL-C, TG and hscrp, as well as cholesterol distribution in LDL and HDL subfractions. Furthermore, because of the higher risk to develop diabetes in this population, associations between glucose concentrations and the prevalence of a pattern B LDL phenotype, characterized by a greater proportion of LDL-C in sdldl particles, were also evaluated. 79
91 Insulin Resistance and CVD Risk The prevalence of diabetes among Mexican Americans is of special concern because diabetes has been identified as a major cause of CVD related mortality and morbidity among Mexican Americans (118, 119). Flegal et al. (33) found that the prevalence of diabetes among Mexican Americans (13.9%) was significantly higher than among Whites (6.8%). They postulated that the difference could be due to socioeconomic, behavioral/environmental, or genetic factors. Mexican Americans were more likely to be less educated, have a larger family size, lower income to poverty threshold, and have higher leisure-time physical inactivity than Whites (33). In our study individuals in the DPD group had 107% higher CVD risk and those in the DD group had 270% higher CVD risk than the NC group, as assessed by the Framingham risk score algorithm. Moreover, among the participants in the DPD group, 15% had IFG, 10% had IGT and 75% were found to have both IFG and IGT. Therefore, the individuals with prediabetes who also exhibit dyslipidemia (low HDL-C and high TG) are more likely to have IFG and IGT, rather than one or the other. Among the participants in DD group, along with 2-hr hyperglycemia, 20% of participants had fasting normoglycemia, 35% had IFG, and 45% had fasting hyperglycemia. The increased CVD risk among individuals with diabetes has already been established (152). For example, the investigators from the Diabetes Epidemiology Collaborative analysis Of Diagnostic criteria in Europe (DECODE) study (153) observed that diabetic individuals had 50% higher risk for CVD mortality compared to the healthy controls. In the DECODE study 80
92 (153) the addition of 2-hr glucose to fasting glucose significantly improved the prediction of CVD death among their diabetic population compared to fasting glucose or 2-hr glucose alone (p<0.005). Therefore 2-hr post prandial glucose may be a better indicator of assessing risk for developing CVD than just fasting glucose among diabetic individuals who also exhibit diabetic dyslipidemia. Much less is known about potential genetic factors that affect CVD risk among Mexican Americans. To elucidate more about the genetic factors, Voruganti et al. (144) in their Mexican-American population residing in San Antonio found that a specific region in the 12q gene was associated with HOMA values. In addition Voruganti et al. (144) also observed that this common set of genes regulated the variation in insulin resistance, BMI, waist circumference, HDL-C, and blood pressure, all of which are important components of CVD. In our study, individuals with the highest HOMA-IR had the worst CVD risk profile compared to the participants with the lowest HOMA-IR values. For example: the DD group had 31% more cholesterol, 29% more LDL-C, 33% less HDL-C, 209% more TG, 716% more cholesterol in sdldl particles and 69% more HDL-C in shdl particles compared to the group with the lowest HOMA-IR value (NC). We also found a positive correlation between LDL-C and fasting and 2-hr glucose, as well as a negative correlation between HDL-C and fasting and 2- hr glucose. These findings are comparable to those reported in studies with non- Hispanic White participants. Bonora et al. (154) found HOMA-IR to be significantly correlated with most of the CVD risk factors such as BMI, HbA1c, HDL-C, TG, blood pressure, hscrp, fibrinogen, sdldl, vascular cell adhesion 81
93 molecule-1 (VCAM-1) and adiponectin. Bonora et al. (154) also observed that the individuals with insulin resistance had an increased cardiovascular events compared to those without insulin-resistance. Although in our study we did not look at the actual cardiovascular events, we found that the estimated 10-year CVD risk was 1.8 times more among individuals with insulin resistance (DPD) and 3.2 times more among individuals with diabetes (DD) compared to those withoutinsulin resistance (DN). Jointly, results from both studies suggest that insulin resistance or prediabetes not only results in alterations in glucose metabolism, but also an increased risk of CVD. Dyslipidemia Although per study design our participants in the three dyslipidemic groups (i.e. DN, DPD and DD) had low HDL-C and high TG, participants with insulin resistance and diabetes (i.e. DPD and DD groups) also had significantly higher concentrations of TC and LDL-C than participants in the NC group (p<0.0001; p=0.013, respectively). Among the three dyslipidemic groups, TC and LDL-C were significantly greater among individuals with insulin resistance/prediabetes (DPD) and diabetes (DD) than with just dyslipidemia (DN). Similarly, using the baseline data from the San Antonio Heart study, Mitchell et al. (152) observed that diabetic Mexican Americans had greater concentration of TC and LDL-C than their non-diabetic counterparts. We observed that participants with diabetes (DD) had 223% increased CVD risk as compared to non-diabetic individuals (DN) with similar lipid profiles (i.e. low HDL-C and high TG). In a prospective study with a large sample size 82
94 (n=x), Liu et al. (155) observed that diabetic participants had >200% higher predicted CVD risk than individuals without diabetes but similar lipid profiles. In contrast to our study, Liu et al. (155) selected their dyslipidemic participants based on high concentrations of non-hdl-c (LDL-C, TC, and TG), whereas in our study design we selected our dyslipidemic participants based on diabetic dyslipidemia i.e. low HDL and high TG. Furthermore they had individuals from diverse race/ethnic groups in their study, whereas our study was limited to Mexican-American adults. In our study, TC and TG were positively correlated with 10-year CVD risk. Because LDL-C and HDL-C are components of the algorithm used to estimate 10-year CVD risk, we did not calculate those associations. Laakso et al. (156) also reported that high LDL-C, low HDL-C and high TG were associated with a three-fold increase risk of cardiovascular events among diabetic participants. However, the participants in this study were identified during the hospital stay and likely represent more severe cases of diabetes than the free living, previously undiagnosed individuals who took part in our study. In a longitudinal study of dyslipidemic British men (45-69 years), Yarnell et al. (157) found that serum TG, TC and HDL-C were predictive of CVD risk. After a 10-year follow-up, the incidence of CVD was 22.6% higher in the group that had the highest concentrations of TC and TG and the lowest concentrations of HDL-C, than the group that had the most desirable concentrations of these three major lipids (p<0.01) (157). However, although TC, HDL-C and TG were 83
95 independently associated with CVD risk, no evidence of interaction was found between the three lipids (TC, HDL-C and TG) and 10-year CVD risk (157). Estimated results obtained from our study may add-on to the results from other studies that the combination of low HDL with raised TG concentrations along with other risk factors substantially increases CVD risk. Further, studies have shown that among Mexican Americans the lipid profile is altered in a similar fashion to the diabetic dyslipidemia, even when insulin resistance is present in the absence of diabetes (pre-diabetes) (152, 158). Therefore, more evidence is needed to better understand whether modifying these risk factors will reduce CVD in Mexican Americans with diabetes/insulin resistance. LDL Subfractions In our study, the cholesterol distribution in sdldl particles, LDL mean particle size, and peak particle size were significantly different in healthy controls (NC) than the individuals with dyslipidemia (DN, DPD, DD) irrespective of their degree of hyperglycemia. Moreover, we found that participants with diabetes (DD group) had 4.3% more cholesterol in sdldl and 9 Å 3% larger LDL particles size than healthy control individuals (NC group). In a biethnic population (Mexican Americans and non-hispanic Whites), Haffner et al. (159) also observed that Mexican Americans had significantly smaller LDL size compared to non- Hispanic Whites (p=0.04) (159). Moreover, they observed that higher TG, insulin, and glucose concentrations; lower HDL-C concentrations, and male gender were independent correlates of sdldl. Similarly, Lee et al. (151) reported that individuals with type 2 diabetes had 11.6% greater cholesterol in sdldl 84
96 (p<0.05) compared to the healthy controls. In contrast to our study, the diabetic participants in the study conducted by Lee et al. (151) did not have significantly different LDL-C concentrations compared to the healthy controls. Although Lee et al. (151) did not mention whether or not the diabetic participants were controlled for lipid lowering drug therapy, it is possible that hypolipidemic drug use could have influenced their results and could explain the lack of difference in LDL-C between the two groups. Koba et al. (160) found that individuals with CVD had a significantly higher amount of cholesterol in sdldl and a lower amount of cholesterol in large LDL compared to the healthy middle-age controls regardless of having normal LDL-C concentrations achieved by lipid lowering drug therapy. Moreover participants with CVD had significantly smaller LDL size than controls regardless of the lipid lowering drug therapy (160). This suggests that sdldl is a more important risk factor for CVD among dyslipidemic individuals with and without diabetes regardless of low LDL-C concentration. In our study, the distribution of cholesterol among LDL subfractions was analyzed by gel electrophoresis. The number of LDL particles cannot be assessed using this method. Using NMR, Kathiresan et al. (91), found a relationship between the increase in number of sdldl particles and cardiovascular events in individuals with metabolic syndrome. Kathiresan et al. (91) further observed that the total number of sdldl was elevated even with the normal concentrations of LDL-C among these individuals. However, Kathiresan et al. (91) evaluated the assessment of number of sdldl particles only in a subset of high-risk individuals 85
97 with metabolic syndrome. It is possible that the number of sdldl particles will better predict CVD risk across a broader spectrum of participants. Several investigators have found a direct association between insulin resistance and an increased number of sdldl particles, LDL particle size and concentrations of cholesterol within sdldl. Goff et al. (161) reported that insulin resistance was positively correlated with the number of sdldl particles as determined by Nuclear Magnetic Resonance (NMR) analysis. Very similar results were observed by Garvey et al. (162), who found that when compared with insulin-sensitive subjects, those with insulin resistance and diabetes had more particles of both, LDL and sdldl particles. In addition, they observed that among both groups (insulin resistance and diabetic), the concentration of cholesterol in sdldl particles was increased whereas concentration of cholesterol in larger LDL particles was decreased (162). This indicates that having more cholesterol within sdldl, decreased LDL size and increase in the number of LDL particles could hold importance in predicting CVD risk and/or metabolic syndrome even in the absence of traditional CVD risk factors such as increased LDL-C. Because of the atherogenic potential of sdldl (96, 114, 114, 161, 162), having a greater proportion of cholesterol in this LDL subfraction has been associated with increased CVD risk. In our study, the concentration of cholesterol in sdldl particles was positively correlated with 10-year CVD risk and TC/HDL-C. Similarly, results from prospective studies have indicated that individuals with more cholesterol in sdldl are more likely to develop CVD. In a 86
98 seven-year follow-up study that included 1035 cases (who developed CVD) and 1920 controls (who did not develop CVD) between the age of years old, Arsenault et al. (96) observed that cases had significantly greater amount of cholesterol in sdldl particles and significantly lower cholesterol in large LDL particles than controls. In our study we did not find any significant difference in the distribution of cholesterol in larger LDL among participants in all four groups (i.e. NC, DN, DPD and DD). Unlike the study by Arsennault et al. (96), our study was not designed to look at actual CVD events; therefore, we were only able to estimate the risk of having CVD in next 10-year period. Results from ours and other studies indicate that LDL phenotype may be an important risk factor for CVD, especially in minorities like Mexican Americans. Further, Mexican Americans are at greater risk of having insulin resistance/diabetes which increases the likelihood of having a pattern B LDL phenotype and therefore exacerbate CVD risk. HDL Subfractions The dyslipidemic individuals in our study (participants in DN, DPD and DD groups), irrespective of their prediabetes or diabetes status, had a lower proportion of HDL-C in the larger HDL particles than the healthy controls (NC group). The healthy controls (NC) had significantly more HDL-C in the larger HDL particles than the other groups, whereas those with prediabetes (DPD) had significantly more HDL-C in the shdl particles. In a study that compared participants with insulin resistance and diabetes with individuals free of these conditions (controls), Garvey et al. (162) found that participants in both insulin 87
99 resistance and diabetes groups had shdl particles than controls. In addition, they observed that among both groups (insulin resistance and diabetic), the concentration of cholesterol in shdl particles increased whereas the concentration of cholesterol in larger HDL-C decreased such that there was no net significant difference in HDL-C. Further, Asztalos et al. (163) used data from 169 men with CHD (cases), 1277 without CHD (controls) and 358 HDL cholesterolmatched men without CHD (HDL-C matched controls). In this study, they (163) found that the cases had significantly lower concentrations of cholesterol in larger HDL subfractions compared to HDL-C matched controls; the amount of cholesterol in shdl subfractions was significantly higher among cases compared to the controls and HDL-C matched controls. Moreover, with each 1 mg/dl increase in HDL-C the amount of cholesterol in larger HDL particles increased by a mean 0.31 mg/dl among CVD participants and by a mean 0.55 mg/dl increase in both controls. Moreover, results from the Framingham Offspring study (163, 164) further indicate that the presence of insulin resistance/prediabetes decrease the size of cardioprotective large HDL particles, and increase the shdl subfractions such that there is no significant difference in total HDL-C. This shows that CVD participants have a significantly different HDL subpopulation profile than those without CVD, and that specific HDL subfraction, particularly having the larger subfractions decrease the risk whereas having smaller increase the risk. Our study found a positive association between the distribution of HDL-C in HDL subfractions and 10-year CVD risk, and a negative association between 88
100 the distributions of HDL-C in HDL subfractions. In a genetic research study, Watanabe et al. (164) observed that HDL particles were significantly smaller in individuals with low HDL-C concentrations that had a family history of low HDL-C (affected group) as compared to either individuals with low HDL-C but without family history of low HDL-C (unaffected group) or healthy individuals without any CVD risk factors (control group). Furthermore, among individuals in the affected group, the amount of cholesterol was significantly higher in shdl subfractions and significantly lower in larger HDL particles than in the other two groups. Watanabe et al. (164) also found that the concentration of cholesterol in larger HDL subfractions was lower in hypertriglyceridemic participants. However, the affected participants had only moderately elevated concentrations of TG predicting that HDL subfractions may not be explained by elevation of TG. This was further supported when the researchers found that the unaffected group also had lesser concentration of cholesterol in larger HDL subfrations despite a comparable TG concentration to controls. This evidence suggests that observed changes of concentration of cholesterol in HDL subfractions may be due to an exposure to genetic components, which may regulate cholesterol in different HDL subfractions. Therefore, HDL subfractions may provide better phenotypes than HDL-C alone for estimating CVD risk. In a study with 486 Chinese individuals categorized by TC concentrations into those with desirable, borderline high, and high concentrations, Tian et al. (165) observed that as TC concentrations increased, individuals had shdl particles. In addition, for each 19 mg/dl increase in TC there was 1.7mg/dL 89
101 decrease in the amount of cholesterol in large HDL subfractions. These findings suggested that elevated TC concentration impairs the maturation of the HDL subclasses metabolism and potentially the efficiency of reverse cholesterol transport (RCT). Furthermore, Tian et al. (165) found that even with desirable TC concentrations, participants with elevated TG had a reduced amount of cholesterol in larger HDL subfractions and increased content of shdl particles, which in turn puts them at greater CVD risk. Grandjean et al. (166) studied HDL metabolism in hypercholesterolemic individuals and reported low LCAT activity and high CETP activity associated with the increased plasma TC concentration among hypercholesterolemic individuals. The activity of LCAT is required for normal plasma lipoprotein structure and is important in HDL remodeling. LCAT may catalyze unesterified cholesterol to cholesterol esters (CE) and promote the conversion of shdl particles to larger ones. CETP is a hydrophobic glycoprotein made by the liver and adipose that circulates in the plasma bound to lipoproteins. It mediates exchange of core lipids between VLDL-TG, LDL-TG and HDL- cholesteryl esters. The net effect of CETP action on HDL is depletion of CE and enrichment with TG, with an overall net reduction in the size of HDL particles. Therefore, if LCAT activity being low in hypercholesterolemic individuals then the shdl particles cannot be converted into large HDL particles that possess more antiatherogenic properties; moreover, the increased action of CETP during hypercholesterolemia decreases the size of HDL particles which possess less antiatherogenic properties. 90
102 As discussed before TC, VLDL, LDL and TG are important components of RCT that forms HDL subfractions whereas insulin and glucose are mediators that shift cholesterol distribution from larger to smaller. It is important to look at these lipids as well as glucose parameters when assessing CVD risk by HDL subfractions analysis. And the measurement of HDL subfractions may provide useful information about CVD risk beyond that obtained from traditional CVD risk factors, especially in individuals with normal LDL-C. High-sensitivity C-reactive Protein A concentration of hscrp, a marker of systemic inflammation, less than 1 mg/l is considered to be low risk for CVD, mg/l is considered to be moderate risk for CVD and greater than 3 mg/l is considered to be at high risk for CVD (21). In our study, hscrp concentration was elevated in all groups of overweight/obese Mexican Americans regardless of the presence of other traditional CVD risk factors. The mean value of hscrp concentration was mg/l (ranging from 0.16 to 23 mg/l), which is 330% higher than the upper limit of normal concentration and 43% higher than the upper limit for CVD risk. Using NHANES data ( ; n= 2205 women and 1940 men), Ford et al. (167) reported a mean hscrp concentration of mg/l among US adults, ranging from 0.1 to 296 mg/l. Mexican Americans had significantly greater hscrp concentrations (3.5 mg/l) followed by Blacks (3.1 mg/l) and Whites (2.3 mg/l) (167). Using the Multi-Ethnic Study of Atherosclerosis (MESA) data set, Miller et al. (137) found that among adults who are free from CVD risk factors, the 91
103 hscrp concentration varies by gender i.e. women had 2.5 times higher concentration of hscrp (10.3%) than men (4.4%). Further, in a study that included Mexican-American and non-hispanic White men and women, Wee et al. (168) found that mean hscrp concentrations were significantly different by race and ethnicity in women but not in men. Among women, hscrp concentrations were the lowest in Whites (2.77 mg/l) and the highest in Mexican Americans (3.09 mg/l). After adjustment for age, race/ethnicity and education, body mass index (BMI) and waist circumference (WC) were associated with higher hscrp concentrations (p < 0.001). Similarly, in a cross-sectional study that included 3,154 women, Kelley-Hedgepeth et al. (136) found that hscrp concentration was 53% higher in Mexican Americans than in Whites. In Kelly-Hedgepeth s study, a strong joint positive association was observed between BMI and Waist to hip ratio (WHR) with CRP concentrations independent of age, SES, and ethnicity. Therefore, from the results assessed in this study other studies, high CRP concentrations may be prevalent among Mexican-American women who are overweight/obese. In our study, hscrp was not correlated with the estimated 10-year CVD risk or with traditional (serum lipids, serum glucose) and non-traditional risk factors (cholesterol distribution in LDL and HDL subfractions) for CVD. Similar to our study, Bowden et al. (169) found no evidence of an incremental association of hscrp concentrations with CVD in diabetics as well as non-diabetics, despite participants being at risk for subclinical CVD (assessed measuring intima media thickness [IMT] and coronary artery calcification [CAC]). However, this study 92
104 was limited to participants from White and African American ethnic backgrounds. Results as such observed in our study have not been previously reported in Mexican Americans/Hispanics. But as supported by NHANES data (167) and the studies by Miller et al.(137) and Wee et al. (168) this population (overweight/obese Mexican Americans, especially females), in general, have elevated CRP, which could contribute to not being able to find a relationship between CRP and CVD risk. In contrast Mandell et al. (170) and Ridker et al. (171) and found that CRP predicts development of incident of CVD events including myocardial infarction, stroke, peripheral arterial disease, and sudden cardiac death. Madell et al. (170) found that among men CRP concentrations were raised in association with a variety of established cardiovascular risk factors such as high BMI (p<0.0001), smoking (p<0.0001), low socioeconomic status (p=0.014) and age (p=0.036). However after adjustment for these traditional CVD risk factors, the association between CRP and CVD risk became non-significant; predicting that neither CRP nor the systemic inflammation it represents appears to play a direct role in the development of CVD. Ridker et al. (171) also found that the addition of CRP measurement to screening based on lipid concentrations may provide an improved method of identifying women at risk for cardiovascular events. Ridker et al. (171) observed that CRP was the strongest predictor of the cardiovascular events compared to other inflammatory markers such as amyloid A, interleukin-6, and soluble intercellular adhesion molecule type 1 (slcam-1), with the relative risk of 93
105 the events for women in the highest quartile as compared to lowest for hscrp being 4.4. There is scant information available regarding concentration of hscrp in Mexican Americans. Its applicability to screen Mexican Americans who are at risk for CVD is currently debated because few studies have been published regarding hscrp concentrations as a predictor for CVD in this population. Therefore, more research regarding hscrp as a screening tool for CVD risk among this population is needed. Using The Framingham Risk Algorithm to Predict 10-Year CVD Risk We used the Framingham Risk Score algorithm (148) to estimate risk of developing CVD in next 10-year period in our study participants. The mean estimated 10-year risk for developing CVD for all participants was %, which was derived after using the total points obtained from LDL-C based algorithm. Participants in the DD group had highest CVD risk compared to the other three groups i.e. NC, DN and DPD (p<0.0001). As expected, we found a significant positive correlation between 10-year CVD risk measured by using Framingham risk score and TC, TG, TC/ HDL-C, cholesterol distribution in sdldl particles. Furthermore, 10-year CVD risk was negatively correlated with the distribution of cholesterol in intermediate and large HDL particles. However, a significant correlation between 10-year CVD risk and hscrp could not be established in this study. The Framingham risk score algorithm was derived from a predominantly White population from Framingham, Massachusetts (171). Likewise, most studies looking at the association between independent CVD risk 94
106 factors and 10-year CVD risk derived from the Framingham risk algorithm have been assessed in cohorts of White individuals (148, 172). There is limited research using this algorithm in other ethnic and racial cohorts, including Mexican Americans (172). D Agnostino et al. (172) tested the validity of the Framingham risk score algorithm to accurately predict the CHD risk in six different ethnically diverse cohorts (n=23,424) including Whites, Blacks, Native Americans, Japanese American men, and Hispanic men: the Atherosclerosis Risk in Communities Study ( ), Physicians Health Study (1982), Honolulu Heart Program ( ), Puerto Rico Heart Health Program ( ), Strong Heart Study ( ), and Cardiovascular Health Study ( ). They found that among White and Black men and women the Framingham algorithm performed reasonably well for prediction of CHD events within 5-year follow-up period. However, among Japanese American and Hispanic men and Native American women, the Framingham algorithm overestimated the risk of 5-year CHD events. After recalibration (i.e. taking into account the prevalence of risk factors and underlying rates of developing CHD), the Framingham functions worked well in these populations. To our knowledge, there are only two studies published to date (170, 173) that have used the Framingham Risk Score among Mexican Americans. One to report CVD related deaths (173), and another that assessed CVD risk (167). Hurley et al. (173) used the Framingham risk algorithm to report CVD related deaths (but not to estimate the CVD risk) among individuals from several race/ethnic groups who died from cardiovascular events. They found that older 95
107 age was more strongly associated with CVD mortality in Whites (Hazard ratio=3.37) than Blacks (Hazard ratio=2.29) and Mexican Americans (Hazard ratio=2.46); when all other risk factors (sex, smoking, diabetes, elevated total cholesterol, low concentrations of HDL-C, and systolic blood pressure) were held constant, Blacks (9%) and Mexican Americans (7%) were at a higher risk for cardiovascular death at younger ages compared to White participants (5%). However, their definition of cardiovascular mortality relies on death certificate diagnoses, which are subject to error in the certification of the underlying causes of death. Also, Hurley et al. (173) were not able to measure nonfatal events, and by excluding these events, they may have underestimated associations between other risk factors and CVD among different ethnic groups. Aside from the Framingham Risk Score (148), there are other proposed algorithms (such as the UK prospective diabetes study [UKPDS] risk engine, and the Atherosclerosis Risk in Communities [ARIC] study risk equation) to estimate CVD risk (174, 175). The UKPDS Risk Engine incorporates the following variables: age at diagnosis of diabetes, gender, race/ethnicity, smoking status, concentration of HbA1c, systolic blood pressure, and TC/HDL-C (174). The ARIC study risk equations incorporate age, race, categories of concentrations of TC, categories of concentrations of HDL-C, systolic blood pressure, use of antihypertensive medications, and current smoking status (175). Ford et al. (158) observed that the 10-year risk for CVD among diabetic individuals from three different race/ethnic groups (Whites, African Americans and Mexican Americans) declined significantly between and , whether using the 96
108 UKPDS Risk Engine (from 21.1% to 16.4%) or risk equations from the ARIC study (from 18.7% to 15.9%), or the Framingham Heart Study (from 18.6% to 14.6%). Ford et al. (158) attributed CVD risk reduction to improved treatment for hypercholesterolemia and hypertension; whether this improvement was due to use of pharmacological agents or due to lifestyle changes is unclear. In our study the 10-yr CVD risk significantly increased two fold with the presence of prediabetes along with dyslipidemia, and three fold with the presence of diabetes along with dyslipidemia, as compared to the healthy controls. However, the comparison of our study with that of Ford et al. (158) is limited because the latter study had a 10- years prospective follow-up study design, in contrast to our comparison of four different groups with the cross-sectional study design. Using the different estimates of CVD risk resulted in some discrepancies in changes observed over time. In addition, when stratified by race/ethnicity, the analyses failed to demonstrate significant reductions in several risk factors such as smoking, HbA1c, and blood pressure among Whites; smoking among African Americans; and blood pressure and TC among Mexican Americans. This indicates that predicting CVD risk may require different considerations among race/ethnic groups based on the individual risk factors critical to these groups. Limitations Several potential limitations of our analysis deserve mention. The crosssectional design of the study prevents us from drawing causal inferences about the relationship between the CVD risk factors and risk of developing CVD in a 10- year period. In addition, the sample size is relatively small, which may limit the 97
109 statistical power to detect certain significant associations between variables such as hscrp and 10-year CVD risk, and cholesterol distribution in larger LDL particles and 10-year CVD risk. All the individuals recruited in the study were 30 years and self-identified as Mexican American. The study did not control for country of birth, acculturation or other non-biological factors that may affect CVD risk. Individuals who were previously diagnosed with diabetes and/or were taking diabetic medication were excluded from the study. However, we did not control for the presence of other chronic diseases (known or unknown) or for medication usage that may influence the individual results. The study did not control for smoking, stress level and other acute illness, which may influence hscrp concentrations. Although we attempted to minimize the confounding effect of adiposity by excluding normal, underweight and pregnant individuals from our study, controlling for obesity could have decreased our power of finding significant correlations between hscrp and 10-year CVD risk because overweight/obesity has been documented to increase inflammatory response even in healthy individuals without other pertinent CVD risk factors (136, 168, 171). Regarding the assessment of cholesterol distribution among different lipoprotein subfractions, instead of NMR, we used polyacrylamide gel tube electrophoresis because it is a method that can be used in semiautomatic mode and takes only three hour with high reproducibility at a relatively low cost. NMR is the gold standard technique with which both particle size and total number of heterogeneous lipoprotein particles can be calculated. However it is expensive, labor intensive, and requires experienced personnel to run the analyses. 98
110 Our study participants were predominantly adults with mean age of years. Therefore, the results derived may not be entirely applicable to other populations including younger Mexican-American adults. In addition, we have used the Framingham risk score to calculate CVD risk. This measure has not been frequently used for Mexican Americans and may affect our study results. To further evaluate CVD risk among Mexican Americans, a longitudinal study that includes an analysis of place of origin, age, gender and other genetic as well as behavioral influences is needed. More research should be conducted by using the Framingham risk score to predict 10-year CVD risk among Mexican Americans in order to check the sensitivity of the risk score in this population. Also, adiposity may confer a more detrimental impact on inflammation in Mexican Americans, and therefore future research should clarify CRP s role in predicting cardiovascular risk in this ethnic minority groups. 99
111 CHAPTER 6 CONCLUSION Even though the prevalence of CVD has decreased over the time, CVD is still responsible for more deaths in the US than other diseases. CVD is the major cause of mortality among Mexican-American adults as it is for other racial/ethnic groups. In our study, along with the greater concentrations of traditional CVD risk factors (such as TC, LDL-C) among the dyslipidemic individuals with varying degree of hyperglycemia (DN, DPD, DD) than in the controls (NC), %10-year CVD risk increased significantly with increasing degree of hyperglycemia. In addition, the controls had significantly less cholesterol in sdldl than the dyslipidemics, regardless of their hyperglycemic status. In addition when hyperglycemia was a phenotype, the greater proportion of cholesterol as well as HDL-C in shdl particles was observed among dyslipidemics as compared to the controls. Given that there are few studies that had looked at lipoprotein subfractions and the concentrations of hscrp in Mexican Americans, our study is an important contribution to the literature that have looked at hscrp and LDL and HDL subfractions as the risk factors for CVD in various subset samples of Mexican Americans. With this cross-sectional study we were able to show the positive associations between %10-year CVD risk and TG, TC, TC/HDL and cholesterol distribution in sdldl particles. Percent 10-year CVD risk further was negatively correlated with cholesterol distribution in intermediate and larger HDL-C. In addition, we found the TC/HDL was positively correlated with cholesterol 100
112 distribution in sdldl particles and HDL-C distribution in shdl particles; TC/HDL was negatively correlated with the cholesterol distribution in shdl, intermediate and large HDL particles, and HDL-C distribution in the larger HDL particles. However, no significant association was found between %10-year CVD risk and hscrp, which raises the question about the importance of measuring hscrp in overweight dyslipidemic Mexican Americans with varying degree of hyperglycemia to predict CVD risk. The full association between 10-year CVD risk and other novel risk factors, in the presence of hyperglycemia as a phenotype, are incompletely understood. Therefore it is important to conduct more research to find out whether lipoprotein subfractions, lipoprotein size and hscrp can be used to manage CVD risk more effectively and prevent future cardiovascular events in Mexican Americans with the varying degree of hyperglycemia before the results of this study can be generalized to the population. 101
113 REFERENCES 1. Roger VL, Go AS, Lloyd-Jones DM, Adams RJ, Berry JD, Brown TM, Carnethon MR, Dai S, de Simone G, Ford ES, Fox CS, Fullerton HJ, Gillespie C, Greenlund KJ, Hailpern SM, Heit JA, Ho PM, Howard VJ, Kissela BM, Kittner SJ, Lackland DT, Lichtman JH, Lisabeth LD, Makuc DM, Marcus GM, Marelli A, Matchar DB, McDermott MM, Meigs JB, Moy CS, Mozaffarian D, Mussolino ME, Nichol G, Paynter NP, Rosamond WD, Sorlie PD, Stafford RS, Turan TN, Turner MB, Wong ND, Wylie-Rosett J, American Heart Association Statistics Committee and Stroke Statistics Subcommittee. Heart disease and stroke statistics update: A report from the american heart association. Circulation. 2011;123(4):e18-e Jacobs AK. Coronary intervention in 2009: Are women no different than men? Circ Cardiovasc Interv. 2009;2(1): Adams PF, Martinez ME, Vickerie JL. Summary health statistics for the U.S. population: National health interview survey, Vital Health Stat ;(248)(248): Sundquist J, Winkleby MA. Cardiovascular risk factors in mexican american adults: A transcultural analysis of NHANES III, Am J Public Health. 1999;89(5): Durazo-Arvizu RA, Barquera S, Lazo-Elizondo M, Franco M, Cooper RS. Cardiovascular disease surveillance in mexicans and mexican americans: A tale of two countries. Rev Panam Salud Publica. 2008;23(2): Adolphe A, Cook LS, Huang X. A cross-sectional study of intima-media thickness, ethnicity, metabolic syndrome, and cardiovascular risk in 2268 study participants. Mayo Clin Proc. 2009;84(3): Kullo IJ, Ballantyne CM. Conditional risk factors for atherosclerosis. Mayo Clin Proc. 2005;80(2): Newnham HH, Silberberg J. Coronary heart disease. women's hearts are hard to break. Lancet. 1997;349 Suppl 1:sI Expert Panel on Detection, Evaluation, and Treatment of High Blood Cholesterol in Adults. Executive summary of the third report of the national cholesterol education program (NCEP) expert panel on detection, evaluation, and treatment of high blood cholesterol in adults (adult treatment panel III). JAMA. 2001;285(19):
114 10. Grundy SM. Small LDL, atherogenic dyslipidemia, and the metabolic syndrome. Circulation. 1997;95(1): Morgan J, Carey C, Lincoff A, Capuzzi D. High-density lipoprotein subfractions and risk of coronary artery disease. Curr Atheroscler Rep. 2004;6(5): Yu S, Yarnell JW, Sweetnam P, Bolton CH. High density lipoprotein subfractions and the risk of coronary heart disease: 9-years follow-up in the caerphilly study. Atherosclerosis. 2003;166(2): Refsum M,H. H. HOMOCYSTEINE AND CARDIOVASCULAR DISEASE. Annu Rev Med. 1998;49(1): Gillum R. Distribution of serum total homocysteine and its association with diabetes and cardiovascular risk factors of the insulin resistance syndrome in mexican american men: The third national health and nutrition examination survey. Nutr J. 2003;2: Grundy SM, Cleeman JI, Daniels SR, Donato KA, Eckel RH, Franklin BA, Gordon DJ, Krauss RM, Savage PJ, Smith SC,Jr, Spertus JA, Costa F, American Heart Association, National Heart, Lung, and Blood Institute. Diagnosis and management of the metabolic syndrome: An american heart Association/National heart, lung, and blood institute scientific statement. Circulation. 2005;112(17): de Simone GG. Prognostic impact of metabolic syndrome by different definitions in a population with high prevalence of obesity and diabetes: The strong heart study. Diabetes Care. 2007;30(7): Han TS, Williams K, Sattar N, Hunt KJ, Lean ME, Haffner SM. Analysis of obesity and hyperinsulinemia in the development of metabolic syndrome: San antonio heart study. Obes Res. 2002;10(9): Reaven G, Abbasi F, McLaughlin T. Obesity, insulin resistance, and cardiovascular disease. Recent Prog Horm Res. 2004;59: Fox CS, Massaro JM, Hoffmann U, Pou KM, Maurovich-Horvat P, Liu CY, Vasan RS, Murabito JM, Meigs JB, Cupples LA, D'Agostino RB S, O'Donnell CJ. Abdominal visceral and subcutaneous adipose tissue compartments: Association with metabolic risk factors in the framingham heart study. Circulation. 2007;116(1):
115 20. Ford ES, Giles WH, Dietz WH. Prevalence of the metabolic syndrome among US adults: Findings from the third national health and nutrition examination survey. JAMA. 2002;287(3): Mahan KL, Escott-Stump S. Krause's Food Nutrition and Therapy. St. Louis, Missouri: Saunders Elsevier; Hamman RF, Wing RR, Edelstein SL, Lachin JM, Bray GA, Delahanty L, Hoskin M, Kriska AM, Mayer-Davis EJ, Pi-Sunyer X, Regensteiner J, Venditti B, Wylie-Rosett J. Effect of weight loss with lifestyle intervention on risk of diabetes. Diabetes Care. 2006;29(9): NCHS. Table 210F: Deaths from ischemic heart disease by five-year age group, race, and sex Wei M, Mitchell BD, Haffner SM, Stern MP. Effects of cigarette smoking, diabetes, high cholesterol, and hypertension on all-cause mortality and cardiovascular disease mortality in mexican americans. the san antonio heart study. Am J Epidemiol. 1996;144(11): Centers for Disease Control and Prevention, National Center for Injury Prevention and Control. Web-based Injury Statistics Query and Reporting System (WISQARS). Analysis of National Vital Statistics System 2007 data. Available at: Accessed 06/17, Pandey DK, Labarthe DR, Goff DC, Chan W, Nichaman MZ. Communitywide coronary heart disease mortality in mexican americans equals or exceeds that in non-hispanic whites: The corpus christi heart project. Am J Med. 2001;110(2): Hamer M. Physical activity and cardiovascular disease: Directions for future research. The open sports sciences journal. 2008;1: Mora S, Szklo M, Otvos JD, Greenland P, Psaty BM, Goff DC,Jr, O'Leary DH, Saad MF, Tsai MY, Sharrett AR. LDL particle subclasses, LDL particle size, and carotid atherosclerosis in the multi-ethnic study of atherosclerosis (MESA). Atherosclerosis. 2007;192(1): Rankovic G, Milicic B, Savic T, Dindic B, Mancev Z, Pesic G. Effects of physical exercise on inflammatory parameters and risk for repeated acute coronary syndrome in patients with ischemic heart disease. Vojnosanit Pregl. 2009;66(1): Flegal KM, Carroll MD, Ogden CL, Curtin LR. Prevalence and trends in obesity among US adults, JAMA. 2010;303(3):
116 31. Pischon T, Boeing H, Hoffmann K, Bergmann M, Schulze MB, Overvad K, van der Schouw YT, Spencer E, Moons KG, Tjonneland A, Halkjaer J, Jensen MK, Stegger J, Clavel-Chapelon F, Boutron-Ruault MC, Chajes V, Linseisen J, Kaaks R, Trichopoulou A, Trichopoulos D, Bamia C, Sieri S, Palli D, Tumino R, Vineis P, Panico S, Peeters PH, May AM, Bueno-de-Mesquita HB, van Duijnhoven FJ, Hallmans G, Weinehall L, Manjer J, Hedblad B, Lund E, Agudo A, Arriola L, Barricarte A, Navarro C, Martinez C, Quiros JR, Key T, Bingham S, Khaw KT, Boffetta P, Jenab M, Ferrari P, Riboli E. General and abdominal adiposity and risk of death in europe. N Engl J Med. 2008;359(20): Cowie CC, Rust KF, Ford ES, Eberhardt MS, Byrd-Holt DD, Li C, Williams DE, Gregg EW, Bainbridge KE, Saydah SH, Geiss LS. Full accounting of diabetes and pre-diabetes in the U.S. population in and Diabetes Care. 2009;32(2): Flegal KM, Ezzati TM, Harris MI, Haynes SG, Juarez RZ, Knowler WC, Perez-Stable EJ, Stern MP. Prevalence of diabetes in mexican americans, cubans, and puerto ricans from the hispanic health and nutrition examination survey, Diabetes Care. 1991;14(7): Steinberger J, Daniels SR, Eckel RH, Hayman L, Lustig RH, McCrindle B, Mietus-Snyder ML, American Heart Association Atherosclerosis, Hypertension, and Obesity in the Young Committee of the Council on Cardiovascular Disease in the Young, Council on Cardiovascular Nursing, and Council on Nutrition, Physical Activity, and Metabolism. Progress and challenges in metabolic syndrome in children and adolescents: A scientific statement from the american heart association atherosclerosis, hypertension, and obesity in the young committee of the council on cardiovascular disease in the young; council on cardiovascular nursing; and council on nutrition, physical activity, and metabolism. Circulation. 2009;119(4): Ostchega Y, Yoon SS, Hughes J, Louis T. Hypertension awareness, treatment, and control--continued disparities in adults: United states, NCHS Data Brief. 2008;(3)(3): Centers for Disease Control and Prevention (CDC). Cigarette smoking among adults and trends in smoking cessation - united states, MMWR Morb Mortal Wkly Rep. 2009;58(44): Alberti KG, Eckel RH, Grundy SM, Zimmet PZ, Cleeman JI, Donato KA, Fruchart JC, James WP, Loria CM, Smith SC,Jr, International Diabetes Federation Task Force on Epidemiology and Prevention, Hational Heart, Lung, and Blood Institute, American Heart Association, World Heart Federation, International Atherosclerosis Society, International Association for the Study of Obesity. Harmonizing the metabolic syndrome: A joint interim statement of the 105
117 international diabetes federation task force on epidemiology and prevention; national heart, lung, and blood institute; american heart association; world heart federation; international atherosclerosis society; and international association for the study of obesity. Circulation. 2009;120(16): Franco OH, Massaro JM, Civil J, Cobain MR, O'Malley B, D'Agostino RB S. Trajectories of entering the metabolic syndrome: The framingham heart study. Circulation. 2009;120(20): Ervin RB. Prevalence of metabolic syndrome among adults 20 years of age and over, by sex, age, race and ethnicity, and body mass index: United states, Natl Health Stat Report. 2009;(13)(13): McNeill AM, Rosamond WD, Girman CJ, Golden SH, Schmidt MI, East HE, Ballantyne CM, Heiss G. The metabolic syndrome and 11-year risk of incident cardiovascular disease in the atherosclerosis risk in communities study. Diabetes Care. 2005;28(2): Pleis JR, Ward BW, Lucas JW. Summary health statistics for U.S. adults: National health interview survey. 2009;10(249):06/26/ Centers for Disease Control and Prevention (CDC). Smoking-attributable mortality, years of potential life lost, and productivity losses--united states, MMWR Morb Mortal Wkly Rep. 2008;57(45): Haynes SG, Harvey C, Montes H, Nickens H, Cohen BH. Patterns of cigarette smoking among hispanics in the united states: Results from HHANES Am J Public Health. 1990;80 Suppl: Bakhru A, Erlinger TP. Smoking cessation and cardiovascular disease risk factors: Results from the third national health and nutrition examination survey. PLoS Med. 2005;2(6):e Bazzano LA, He J, Muntner P, Vupputuri S, Whelton PK. Relationship between cigarette smoking and novel risk factors for cardiovascular disease in the united states. Ann Intern Med. 2003;138(11): Benowitz NL. Cigarette smoking and cardiovascular disease: Pathophysiology and implications for treatment. Prog Cardiovasc Dis. 2003;46(1): Burke A, Fitzgerald GA. Oxidative stress and smoking-induced vascular injury. Prog Cardiovasc Dis. 2003;46(1):
118 48. U.S. Department of Health & Human Services Physical activity guidelines for Americans. Available at: Accessed 10/02, Haskell WL, Lee IM, Pate RR, Powell KE, Blair SN, Franklin BA, Macera CA, Heath GW, Thompson PD, Bauman A, American College of Sports Medicine, American Heart Association. Physical activity and public health: Updated recommendation for adults from the american college of sports medicine and the american heart association. Circulation. 2007;116(9): He XZ, Baker DW. Differences in leisure-time, household, and work-related physical activity by race, ethnicity, and education. J Gen Intern Med. 2005;20(3): Lee IM, Paffenbarger RS,Jr, Hennekens CH. Physical activity, physical fitness and longevity. Aging (Milano). 1997;9(1-2): Blair SN, Jackson AS. Physical fitness and activity as separate heart disease risk factors: A meta-analysis. Med Sci Sports Exerc. 2001;33(5): Crespo CJ, Smit E, Andersen RE, Carter-Pokras O, Ainsworth BE. Race/ethnicity, social class and their relation to physical inactivity during leisure time: Results from the third national health and nutrition examination survey, Am J Prev Med. 2000;18(1): Parra-Medina D, Hilfinger Messias DK. Promotion of physical activity among mexican-origin women in texas and south carolina: An examination of social, cultural, economic, and environmental factors. Quest. 2011;63(1): Kraus WE, Houmard JA, Duscha BD, Knetzger KJ, Wharton MB, McCartney JS, Bales CW, Henes S, Samsa GP, Otvos JD, Kulkarni KR, Slentz CA. Effects of the amount and intensity of exercise on plasma lipoproteins. N Engl J Med. 2002;347(19): Jakicic JM, Marcus BH, Gallagher KI, Napolitano M, Lang W. Effect of exercise duration and intensity on weight loss in overweight, sedentary women: A randomized trial. JAMA. 2003;290(10): Porter R.S., Kaplan J.L. Merck s Manual for Health Professionals. Whitehouse station, NJ: Merck Sharp & Dohme Corp; Brown MS, Goldstein JL. Familial hypercholesterolemia: Defective binding of lipoproteins to cultured fibroblasts associated with impaired regulation of 3- hydroxy-3-methylglutaryl coenzyme A reductase activity. Proc Natl Acad Sci U S A. 1974;71(3):
119 59. Leon AAS. Dyslipidemia and risk of coronary heart disease: Role of lifestyle approaches for its management. American journal of lifestyle medicine. 2009;3(4): Fryar CD, Hirsch R, Eberhardt MS, Yoon SS, Wright JD. Hypertension, high serum total cholesterol, and diabetes: Racial and ethnic prevalence differences in U.S. adults, NCHS Data Brief. 2010;(36)(36): Hyre AD, Muntner P, Menke A, Raggi P, He J. Trends in ATP-III-defined high blood cholesterol prevalence, awareness, treatment and control among U.S. adults. Ann Epidemiol. 2007;17(7): Stamler J, Wentworth D, Neaton JD. Is relationship between serum cholesterol and risk of premature death from coronary heart disease continuous and graded? findings in 356,222 primary screenees of the multiple risk factor intervention trial (MRFIT). JAMA. 1986;256(20): Mudd JO, Borlaug BA, Johnston PV, Kral BG, Rouf R, Blumenthal RS, Kwiterovich PO,Jr. Beyond low-density lipoprotein cholesterol: Defining the role of low-density lipoprotein heterogeneity in coronary artery disease. J Am Coll Cardiol. 2007;50(18): Barter PJ, Ballantyne CM, Carmena R, Castro Cabezas M, Chapman MJ, Couture P, de Graaf J, Durrington PN, Faergeman O, Frohlich J, Furberg CD, Gagne C, Haffner SM, Humphries SE, Jungner I, Krauss RM, Kwiterovich P, Marcovina S, Packard CJ, Pearson TA, Reddy KS, Rosenson R, Sarrafzadegan N, Sniderman AD, Stalenhoef AF, Stein E, Talmud PJ, Tonkin AM, Walldius G, Williams KM. Apo B versus cholesterol in estimating cardiovascular risk and in guiding therapy: Report of the thirty-person/ten-country panel. J Intern Med. 2006;259(3): Gordon DJ, Probstfield JL, Garrison RJ, Neaton JD, Castelli WP, Knoke JD, Jacobs DR,Jr, Bangdiwala S, Tyroler HA. High-density lipoprotein cholesterol and cardiovascular disease. four prospective american studies. Circulation. 1989;79(1): Francis MC. Coronary artery disease in patients at low risk--apolipoprotein AI as an independent risk factor. Atherosclerosis. 2001;155(1): Assmann GG. Atheroprotective effects of high-density lipoproteins. Annu Rev Med. 2003;54(1): Gotto AM. Contemporary Diagnosis and Management of Lipid Disorders. 3rd ed. Newton, PA: Handbooks in Health Care;
120 69. Sarwar N, Danesh J, Eiriksdottir G, Sigurdsson G, Wareham N, Bingham S, Boekholdt SM, Khaw KT, Gudnason V. Triglycerides and the risk of coronary heart disease: 10,158 incident cases among 262,525 participants in 29 western prospective studies. Circulation. 2007;115(4): Hokanson JE, Austin MA. Plasma triglyceride level is a risk factor for cardiovascular disease independent of high-density lipoprotein cholesterol level: A meta-analysis of population-based prospective studies. J Cardiovasc Risk. 1996;3(2): Hertz RP, Unger AN, Ferrario CM. Diabetes, hypertension, and dyslipidemia in mexican americans and non-hispanic whites. Am J Prev Med. 2006;30(2): O'Meara JG, Kardia SL, Armon JJ, Brown CA, Boerwinkle E, Turner ST. Ethnic and sex differences in the prevalence, treatment, and control of dyslipidemia among hypertensive adults in the GENOA study. Arch Intern Med. 2004;164(12): Goff DC,Jr, Bertoni AG, Kramer H, Bonds D, Blumenthal RS, Tsai MY, Psaty BM. Dyslipidemia prevalence, treatment, and control in the multi-ethnic study of atherosclerosis (MESA): Gender, ethnicity, and coronary artery calcium. Circulation. 2006;113(5): Gropper S.S., Smith J.L., & Groff J.L. Advanced Nutrition and Human Metabolism. 5th ed. Belmont, CA: Wadsworth, Cengage Learning; Brinton EA, Nanjee MN, Hopkins PN. Triglyceride-rich lipoprotein remnant levels and metabolism: Time to adopt these orphan risk factors? J Am Coll Cardiol. 2004;43(12): Robins SJ, Collins D, Wittes JT, Papademetriou V, Deedwania PC, Schaefer EJ, McNamara JR, Kashyap ML, Hershman JM, Wexler LF, Rubins HB, VA-HIT Study Group. Veterans Affairs High-Density Lipoprotein Intervention Trial. Relation of gemfibrozil treatment and lipid levels with major coronary events: VA-HIT: A randomized controlled trial. JAMA. 2001;285(12): Krauss RM. Heterogeneity of plasma low-density lipoproteins and atherosclerosis risk. Curr Opin Lipidol. 1994;5(5): Barter PPJ. Antiinflammatory properties of HDL. Circ Res. 2004;95(8): Ohashi R, Mu H, Wang X, Yao Q, Chen C. Reverse cholesterol transport and cholesterol efflux in atherosclerosis. QJM. 2005;98(12):
121 80. Gotto AM,Jr, Brinton EA. Assessing low levels of high-density lipoprotein cholesterol as a risk factor in coronary heart disease: A working group report and update. J Am Coll Cardiol. 2004;43(5): Kwiterovich PO,Jr. Clinical relevance of the biochemical, metabolic, and genetic factors that influence low-density lipoprotein heterogeneity. Am J Cardiol. 2002;90(8A):30i-47i. 82. Borensztajn J, Getz GS, Kotlar TJ. Uptake of chylomicron remnants by the liver: Further evidence for the modulating role of phospholipids. J Lipid Res. 1988;29(8): Glass CK, Witztum JL. Atherosclerosis. the road ahead. Cell. 2001;104(4): Shibata N, Glass CK. Regulation of macrophage function in inflammation and atherosclerosis. J Lipid Res. 2009;50 Suppl:S Chapman MJ, Guerin M, Bruckert E. Atherogenic, dense low-density lipoproteins. pathophysiology and new therapeutic approaches. Eur Heart J. 1998;19 Suppl A:A Austin MA, Hokanson JE, Brunzell JD. Characterization of low-density lipoprotein subclasses: Methodologic approaches and clinical relevance. Curr Opin Lipidol. 1994;5(6): Griffin BA, Freeman DJ, Tait GW, Thomson J, Caslake MJ, Packard CJ, Shepherd J. Role of plasma triglyceride in the regulation of plasma low density lipoprotein (LDL) subfractions: Relative contribution of small, dense LDL to coronary heart disease risk. Atherosclerosis. 1994;106(2): Gardner CD, Fortmann SP, Krauss RM. Association of small low-density lipoprotein particles with the incidence of coronary artery disease in men and women. JAMA. 1996;276(11): Lamarche B, Tchernof A, Moorjani S, Cantin B, Dagenais GR, Lupien PJ, Despres JP. Small, dense low-density lipoprotein particles as a predictor of the risk of ischemic heart disease in men. prospective results from the quebec cardiovascular study. Circulation. 1997;95(1): Packard CJ. LDL subfractions and atherogenicity: An hypothesis from the university of glasgow. Curr Med Res Opin. 1996;13(7): Kathiresan S, Otvos JD, Sullivan LM, Keyes MJ, Schaefer EJ, Wilson PW, D'Agostino RB, Vasan RS, Robins SJ. Increased small low-density lipoprotein 110
122 particle number: A prominent feature of the metabolic syndrome in the framingham heart study. Circulation. 2006;113(1): Kolovou GGD. Pathophysiology of dyslipidaemia in the metabolic syndrome. Postgrad Med J. 2005;81(956): de Graaf J, Hak-Lemmers HL, Hectors MP, Demacker PN, Hendriks JC, Stalenhoef AF. Enhanced susceptibility to in vitro oxidation of the dense low density lipoprotein subfraction in healthy subjects. Arterioscler Thromb. 1991;11(2): Nordestgaard BG, Nielsen LB. Atherosclerosis and arterial influx of lipoproteins. Curr Opin Lipidol. 1994;5(4): St-Pierre AC, Cantin B, Dagenais GR, Mauriege P, Bernard PM, Despres JP, Lamarche B. Low-density lipoprotein subfractions and the long-term risk of ischemic heart disease in men: 13-year follow-up data from the quebec cardiovascular study. Arterioscler Thromb Vasc Biol. 2005;25(3): Arsenault BJ, Lemieux I, Despres JP, Wareham NJ, Luben R, Kastelein JJ, Khaw KT, Boekholdt SM. Cholesterol levels in small LDL particles predict the risk of coronary heart disease in the EPIC-norfolk prospective population study. Eur Heart J. 2007;28(22): Haffner SM, Mykkanen L, Festa A, Burke JP, Stern MP. Insulin-resistant prediabetic subjects have more atherogenic risk factors than insulin-sensitive prediabetic subjects: Implications for preventing coronary heart disease during the prediabetic state. Circulation. 2000;101(9): Haffner SM, D'Agostino R,Jr, Goff D, Howard B, Festa A, Saad MF, Mykkanen L. LDL size in african americans, hispanics, and non-hispanic whites : The insulin resistance atherosclerosis study. Arterioscler Thromb Vasc Biol. 1999;19(9): Otvos JD. Measurement of lipoprotein subclass profiles by nuclear magnetic resonance spectroscopy. Clin Lab. 2002;48(3-4): Drexel H, Amann FW, Rentsch K, Neuenschwander C, Luethy A, Khan SI, Follath F. Relation of the level of high-density lipoprotein subfractions to the presence and extent of coronary artery disease. Am J Cardiol. 1992;70(4): Salonen JT, Salonen R, Seppanen K, Rauramaa R, Tuomilehto J. HDL, HDL2, and HDL3 subfractions, and the risk of acute myocardial infarction. A 111
123 prospective population study in eastern finnish men. Circulation. 1991;84(1): Rosenson RS, Otvos JD, Freedman DS. Relations of lipoprotein subclass levels and low-density lipoprotein size to progression of coronary artery disease in the pravastatin limitation of atherosclerosis in the coronary arteries (PLAC-I) trial. Am J Cardiol. 2002;90(2): Wang Y, Beydoun MA, Liang L, Caballero B, Kumanyika SK. Will all americans become overweight or obese? estimating the progression and cost of the US obesity epidemic. Obesity (Silver Spring). 2008;16(10): Burke GL, Bertoni AG, Shea S, Tracy R, Watson KE, Blumenthal RS, Chung H, Carnethon MR. The impact of obesity on cardiovascular disease risk factors and subclinical vascular disease: The multi-ethnic study of atherosclerosis. Arch Intern Med. 2008;168(9): Sundquist J, Winkleby M. Country of birth, acculturation status and abdominal obesity in a national sample of mexican-american women and men. Int J Epidemiol. 2000;29(3): Kaplan MS, Huguet N, Newsom JT, McFarland BH. The association between length of residence and obesity among hispanic immigrants. Am J Prev Med. 2004;27(4): Litwin SE. Which measures of obesity best predict cardiovascular risk? J Am Coll Cardiol. 2008;52(8): Rothman KJ. BMI-related errors in the measurement of obesity. Int J Obes (Lond). 2008;32 Suppl 3:S Flegal KM, Graubard BI, Williamson DF, Gail MH. Excess deaths associated with underweight, overweight, and obesity. JAMA. 2005;293(15): Lavie CJ, Milani RV, Ventura HO. Obesity and cardiovascular disease: Risk factor, paradox, and impact of weight loss. J Am Coll Cardiol. 2009;53(21): Klein S, Burke LE, Bray GA, Blair S, Allison DB, Pi-Sunyer X, Hong Y, Eckel RH, American Heart Association Council on Nutrition, Physical Activity, and Metabolism. Clinical implications of obesity with specific focus on cardiovascular disease: A statement for professionals from the american heart association council on nutrition, physical activity, and metabolism: Endorsed by 112
124 the american college of cardiology foundation. Circulation. 2004;110(18): Bjorntorp P. Visceral obesity: A "civilization syndrome". Obes Res. 1993;1(3): Nieves DJ, Cnop M, Retzlaff B, Walden CE, Brunzell JD, Knopp RH, Kahn SE. The atherogenic lipoprotein profile associated with obesity and insulin resistance is largely attributable to intra-abdominal fat. Diabetes. 2003;52(1): Reaven GM. Role of insulin resistance in human disease (syndrome X): An expanded definition. Annu Rev Med. 1993;44: Kissebah AH. Regional adiposity and morbidity. Physiol Rev. 1994;74(4): Gray RS, Fabsitz RR, Cowan LD, Lee ET, Howard BV, Savage PJ. Risk factor clustering in the insulin resistance syndrome. the strong heart study. Am J Epidemiol. 1998;148(9): Diagnosis of diabetes. Available at: Accessed 06/30, Narayan KM, Boyle JP, Geiss LS, Saaddine JB, Thompson TJ. Impact of recent increase in incidence on future diabetes burden: U.S., Diabetes Care. 2006;29(9): Norhammar A, Tenerz A, Nilsson G, Hamsten A, Efendic S, Ryden L, Malmberg K. Glucose metabolism in patients with acute myocardial infarction and no previous diagnosis of diabetes mellitus: A prospective study. Lancet. 2002;359(9324): Teno S, Uto Y, Nagashima H, Endoh Y, Iwamoto Y, Omori Y, Takizawa T. Association of postprandial hypertriglyceridemia and carotid intima-media thickness in patients with type 2 diabetes. Diabetes Care. 2000;23(9): Bucala R, Makita Z, Vega G, Grundy S, Koschinsky T, Cerami A, Vlassara H. Modification of low density lipoprotein by advanced glycation end products contributes to the dyslipidemia of diabetes and renal insufficiency. Proc Natl Acad Sci U S A. 1994;91(20): Eckel RH, Wassef M, Chait A, Sobel B, Barrett E, King G, Lopes-Virella M, Reusch J, Ruderman N, Steiner G, Vlassara H. Prevention conference VI: Diabetes and cardiovascular disease: Writing group II: Pathogenesis of atherosclerosis in diabetes. Circulation. 2002;105(18):e
125 123. Nishikawa T, Edelstein D, Du XL, Yamagishi S, Matsumura T, Kaneda Y, Yorek MA, Beebe D, Oates PJ, Hammes HP, Giardino I, Brownlee M. Normalizing mitochondrial superoxide production blocks three pathways of hyperglycaemic damage. Nature. 2000;404(6779): Pennathur S, Wagner JD, Leeuwenburgh C, Litwak KN, Heinecke JW. A hydroxyl radical-like species oxidizes cynomolgus monkey artery wall proteins in early diabetic vascular disease. J Clin Invest. 2001;107(7): Endemann DDH. Endothelial dysfunction. Journal of the American Society of Nephrology. 2004;15(8): Balletshofer BM, Rittig K, Enderle MD, Volk A, Maerker E, Jacob S, Matthaei S, Rett K, Haring HU. Endothelial dysfunction is detectable in young normotensive first-degree relatives of subjects with type 2 diabetes in association with insulin resistance. Circulation. 2000;101(15): Medzhitov R. Inflammation 2010: New adventures of an old flame. Cell. 2010;140(6): Calles-Escandon J, Cipolla M. Diabetes and endothelial dysfunction: A clinical perspective. Endocr Rev. 2001;22(1): Festa A, D'Agostino R,Jr, Howard G, Mykkanen L, Tracy RP, Haffner SM. Chronic subclinical inflammation as part of the insulin resistance syndrome: The insulin resistance atherosclerosis study (IRAS). Circulation. 2000;102(1): Libby P, Ridker PM. Novel inflammatory markers of coronary risk: Theory versus practice. Circulation. 1999;100(11): Lemieux I, Pascot A, Prud'homme D, Almeras N, Bogaty P, Nadeau A, Bergeron J, Despres JP. Elevated C-reactive protein: Another component of the atherothrombotic profile of abdominal obesity. Arterioscler Thromb Vasc Biol. 2001;21(6): Pearson TA, Mensah GA, Alexander RW, Anderson JL, Cannon RO,3rd, Criqui M, Fadl YY, Fortmann SP, Hong Y, Myers GL, Rifai N, Smith SC,Jr, Taubert K, Tracy RP, Vinicor F, Centers for Disease Control and Prevention, American Heart Association. Markers of inflammation and cardiovascular disease: Application to clinical and public health practice: A statement for healthcare professionals from the centers for disease control and prevention and the american heart association. Circulation. 2003;107(3): Nakou ES, Liberopoulos EN, Milionis HJ, Elisaf MS. The role of C-reactive protein in atherosclerotic cardiovascular disease: An overview. Curr Vasc Pharmacol. 2008;6(4):
126 134. Ho KM,. C-reactive protein as a prognostic indicator in clinical medicine :August, Anand SS. C-reactive protein as a screening test for cardiovascular risk in a multiethnic population. Arterioscler Thromb Vasc Biol. 2004;24(8): Kelley-Hedgepeth A, Lloyd-Jones DM, Colvin A, Matthews KA, Johnston J, Sowers MR, Sternfeld B, Pasternak RC, Chae CU, SWAN Investigators. Ethnic differences in C-reactive protein concentrations. Clin Chem. 2008;54(6): Miller M, Zhan M, Havas S. High attributable risk of elevated C-reactive protein level to conventional coronary heart disease risk factors: The third national health and nutrition examination survey. Arch Intern Med. 2005;165(18): Martin GM, Bergman A, Barzilai N. Genetic determinants of human health span and life span: Progress and new opportunities. PLoS Genet. 2007;3(7):e Ryff CD, Singer BH. Social environments and the genetics of aging: Advancing knowledge of protective health mechanisms. J Gerontol B Psychol Sci Soc Sci. 2005;60 Spec No 1: Shea S. Family history as an independent risk factor for coronary artery disease. J Am Coll Cardiol. 1984;4(4): Delles C. The genetics of cardiovascular disease. Trends in endocrinology and metabolism. 2008;19(9): Paynter NP, Chasman DI, Buring JE, Shiffman D, Cook NR, Ridker PM. Cardiovascular disease risk prediction with and without knowledge of genetic variation at chromosome 9p21.3. Ann Intern Med. 2009;150(2): Talmud PJ, Cooper JA, Palmen J, Lovering R, Drenos F, Hingorani AD, Humphries SE. Chromosome 9p21.3 coronary heart disease locus genotype and prospective risk of CHD in healthy middle-aged men. Clin Chem. 2008;54(3): Voruganti VS, Lopez-Alvarenga JC, Nath SD, Rainwater DL, Bauer R, Cole SA, Maccluer JW, Blangero J, Comuzzie AG. Genetics of variation in HOMA-IR and cardiovascular risk factors in mexican-americans. J Mol Med (Berl). 2008;86(3): Tonooka N, Tomura H, Takahashi Y, Onigata K, Kikuchi N, Horikawa Y, Mori M, Takeda J. High frequency of mutations in the HNF-1alpha gene in non- 115
127 obese patients with diabetes of youth in japanese and identification of a case of digenic inheritance. Diabetologia. 2002;45(12): Gerich JE. The genetic basis of type 2 diabetes mellitus: Impaired insulin secretion versus impaired insulin sensitivity. Endocr Rev. 1998;19(4): Mitchell BD, Kammerer CM, Blangero J, Mahaney MC, Rainwater DL, Dyke B, Hixson JE, Henkel RD, Sharp RM, Comuzzie AG, VandeBerg JL, Stern MP, MacCluer JW. Genetic and environmental contributions to cardiovascular risk factors in mexican americans. the san antonio family heart study. Circulation. 1996;94(9): Wilson PW, D'Agostino RB, Levy D, Belanger AM, Silbershatz H, Kannel WB. Prediction of coronary heart disease using risk factor categories. Circulation. 1998;97(18): Matthews DR, Hosker JP, Rudenski AS, Naylor BA, Treacher DF, Turner RC. Homeostasis model assessment: Insulin resistance and beta-cell function from fasting plasma glucose and insulin concentrations in man. Diabetologia. 1985;28(7): Wallace TM, Matthews DR. The assessment of insulin resistance in man. Diabet Med. 2002;19(7): Lee W, Min WK, Chun S, Jang S, Kim JQ, Lee DH, Park JY, Park H, Son JE. Low-density lipoprotein subclass and its correlating factors in diabetics. Clin Biochem. 2003;36(8): Mitchell BD, Haffner SM, Hazuda HP, Patterson JK, Stern MP. Diabetes and coronary heart disease risk in mexican americans. Ann Epidemiol. 1992;2(1-2): DECODE Study Group, the European Diabetes Epidemiology Group. Glucose tolerance and cardiovascular mortality: Comparison of fasting and 2-hour diagnostic criteria. Arch Intern Med. 2001;161(3): Bonora E, Kiechl S, Willeit J, Oberhollenzer F, Egger G, Meigs JB, Bonadonna RC, Muggeo M. Insulin resistance as estimated by homeostasis model assessment predicts incident symptomatic cardiovascular disease in caucasian subjects from the general population: The bruneck study. Diabetes Care. 2007;30(2): Liu J, Sempos C, Donahue RP, Dorn J, Trevisan M, Grundy SM. Joint distribution of non-hdl and LDL cholesterol and coronary heart disease risk 116
128 prediction among individuals with and without diabetes. Diabetes Care. 2005;28(8): Laakso M, Lehto S, Penttila I, Pyorala K. Lipids and lipoproteins predicting coronary heart disease mortality and morbidity in patients with non-insulindependent diabetes. Circulation. 1993;88(4 Pt 1): Yarnell JW, Patterson CC, Sweetnam PM, Thomas HF, Bainton D, Elwood PC, Bolton CH, Miller NE. Do total and high density lipoprotein cholesterol and triglycerides act independently in the prediction of ischemic heart disease? tenyear follow-up of caerphilly and speedwell cohorts. Arterioscler Thromb Vasc Biol. 2001;21(8): Ford ES. Trends in the risk for coronary heart disease among adults with diagnosed diabetes in the U.S.: Findings from the national health and nutrition examination survey, Diabetes Care. 2011;34(6): Haffner SM, Mykkanen L, Valdez RA, Paidi M, Stern MP, Howard BV. LDL size and subclass pattern in a biethnic population. Arterioscler Thromb. 1993;13(11): Koba S, Yokota Y, Hirano T, Ito Y, Ban Y, Tsunoda F, Sato T, Shoji M, Suzuki H, Geshi E, Kobayashi Y, Katagiri T. Small LDL-cholesterol is superior to LDL-cholesterol for determining severe coronary atherosclerosis. J Atheroscler Thromb. 2008;15(5): Goff DC,Jr, D'Agostino RB,Jr, Haffner SM, Otvos JD. Insulin resistance and adiposity influence lipoprotein size and subclass concentrations. results from the insulin resistance atherosclerosis study. Metabolism. 2005;54(2): Garvey WT, Kwon S, Zheng D, Shaughnessy S, Wallace P, Hutto A, Pugh K, Jenkins AJ, Klein RL, Liao Y. Effects of insulin resistance and type 2 diabetes on lipoprotein subclass particle size and concentration determined by nuclear magnetic resonance. Diabetes. 2003;52(2): Asztalos BF, Cupples LA, Demissie S, Horvath KV, Cox CE, Batista MC, Schaefer EJ. High-density lipoprotein subpopulation profile and coronary heart disease prevalence in male participants of the framingham offspring study. Arterioscler Thromb Vasc Biol. 2004;24(11): Watanabe H, Soderlund S, Soro-Paavonen A, Hiukka A, Leinonen E, Alagona C, Salonen R, Tuomainen TP, Ehnholm C, Jauhiainen M, Taskinen MR. Decreased high-density lipoprotein (HDL) particle size, prebeta-, and large HDL subspecies concentration in finnish low-hdl families: Relationship with intimamedia thickness. Arterioscler Thromb Vasc Biol. 2006;26(4):
129 165. Tian L, Long S, Fu M, Liu Y, Xu Y, Jia L. Characteristics of high-density lipoprotein subclasses distribution for subjects with desirable total cholesterol levels. Lipids Health Dis. 2011;10: Grandjean PW, Crouse SF, Rohack JJ. Influence of cholesterol status on blood lipid and lipoprotein enzyme responses to aerobic exercise. J Appl Physiol. 2000;89(2): Ford ES, Giles WH, Mokdad AH, Myers GL. Distribution and correlates of C-reactive protein concentrations among adult US women. Clin Chem. 2004;50(3): Wee CC, Mukamal KJ, Huang A, Davis RB, McCarthy EP, Mittleman MA. Obesity and C-reactive protein levels among white, black, and hispanic US adults. Obesity (Silver Spring). 2008;16(4): Bowden DW, Lange LA, Langefeld CD, Brosnihan KB, Freedman BI, Carr JJ, Wagenknecht LE, Herrington DM. The relationship between C-reactive protein and subclinical cardiovascular disease in the diabetes heart study (DHS). Am Heart J. 2005;150(5): Mendall MA, Strachan DP, Butland BK, Ballam L, Morris J, Sweetnam PM, Elwood PC. C-reactive protein: Relation to total mortality, cardiovascular mortality and cardiovascular risk factors in men. Eur Heart J. 2000;21(19): Ridker PM, Hennekens CH, Buring JE, Rifai N. C-reactive protein and other markers of inflammation in the prediction of cardiovascular disease in women. N Engl J Med. 2000;342(12): D'Agostino RB. Validation of the framingham coronary heart disease prediction scores: Results of a multiple ethnic groups investigation. JAMA : the journal of the American Medical Association. 2001;286(2): Hurley LP, Dickinson LM, Estacio RO, Steiner JF, Havranek EP. Prediction of cardiovascular death in racial/ethnic minorities using framingham risk factors. Circ Cardiovasc Qual Outcomes. 2010;3(2): Stevens RJ, Kothari V, Adler AI, Stratton IM, United Kingdom Prospective Diabetes Study (UKPDS) Group. The UKPDS risk engine: A model for the risk of coronary heart disease in type II diabetes (UKPDS 56). Clin Sci (Lond). 2001;101(6): Folsom AR, Chambless LE, Duncan BB, Gilbert AC, Pankow JS, Atherosclerosis Risk in Communities Study Investigators. Prediction of coronary 118
130 heart disease in middle-aged adults with diabetes. Diabetes Care. 2003;26(10):
131 APPENDIX A MARICOPA INSULIN RESISTANCE INITIAVE IRB APPROVAL FORM 120
132 121
133 APPENDIX B CONSENT FORM MARICOPA INSULIN RESISTANCE INITIAVE (ENGLISH) 122
134 123
135 APPENDIX C CONSENT FORM MARICOPA INSULIN RESISTANCE INITIAVE (SPANISH) 124
136 125
137 126
138 127
139 128
140 129
141 130
142 131
143 132
144 133
145 APPENDIX D BIOSAFETY DISCLOSURE REVIEW FORM OF PRESENT STUDY 134
146 135
147 APPENDIX E DATA SUMMARY SHEETS 136
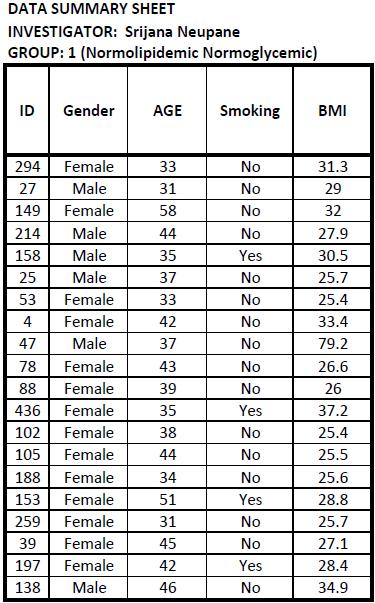
148 137
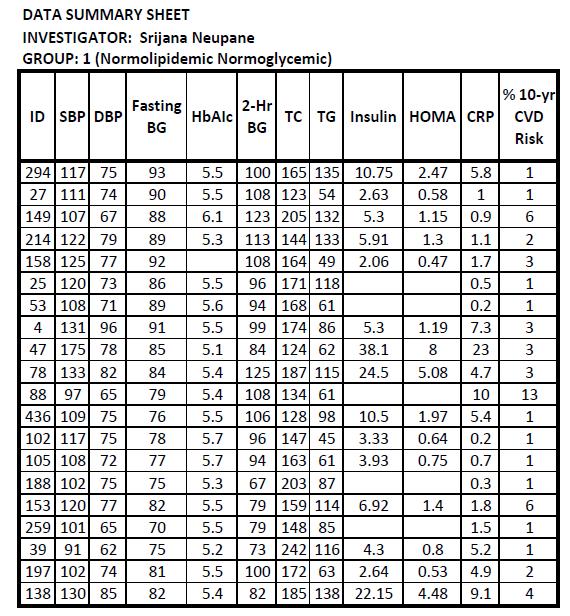
149 138
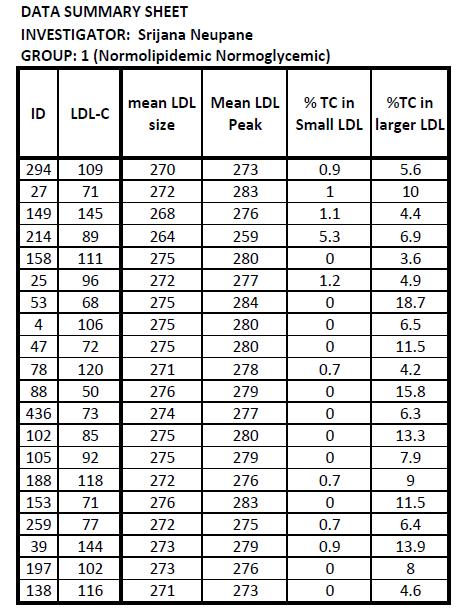
150 139
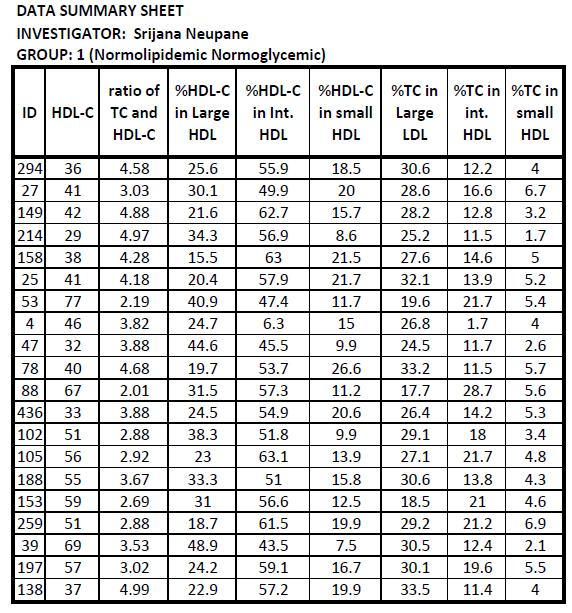
151 140
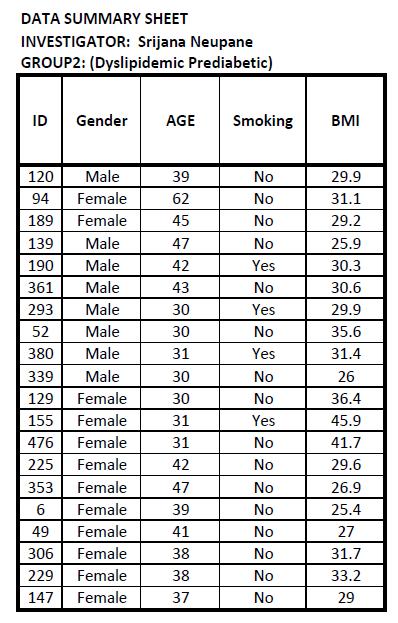
152 141
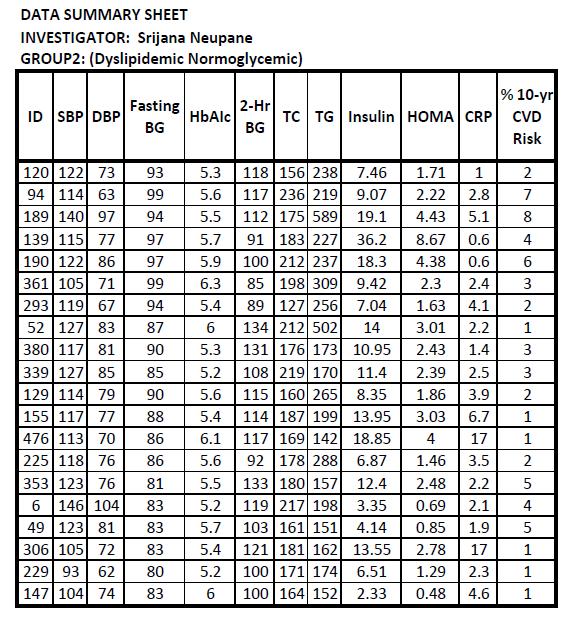
153 142
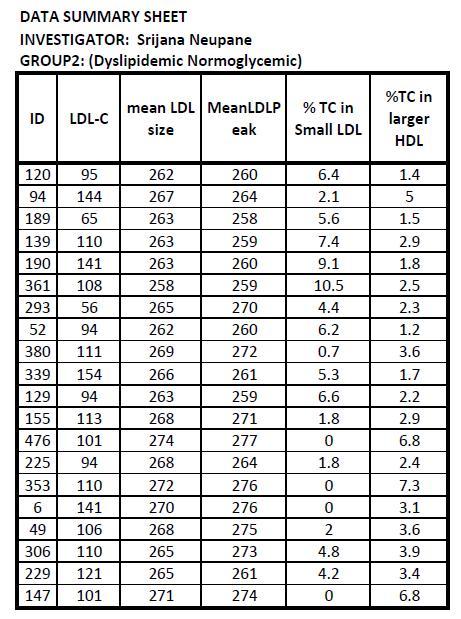
154 143
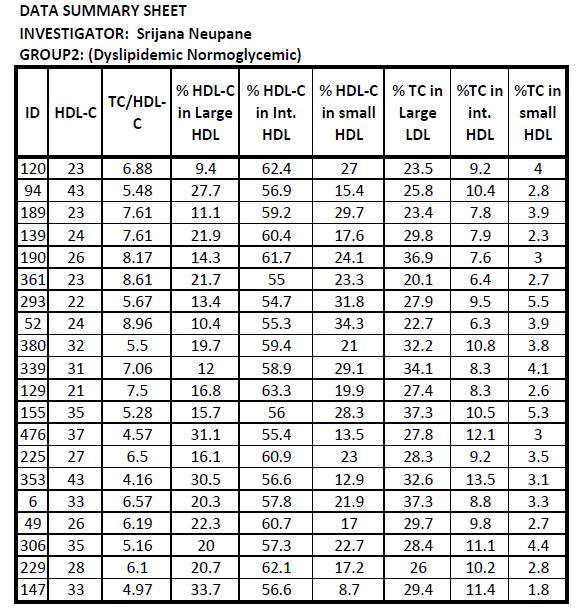
155 144
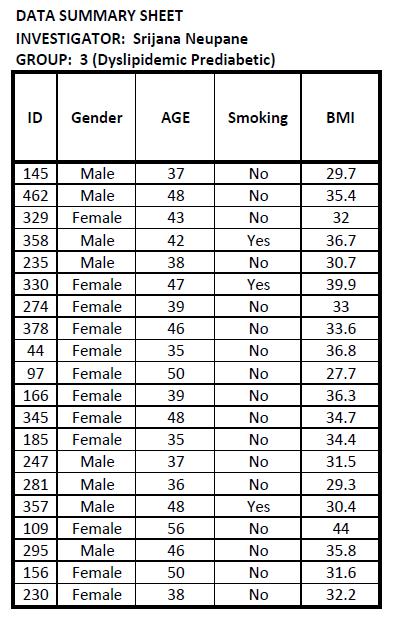
156 145
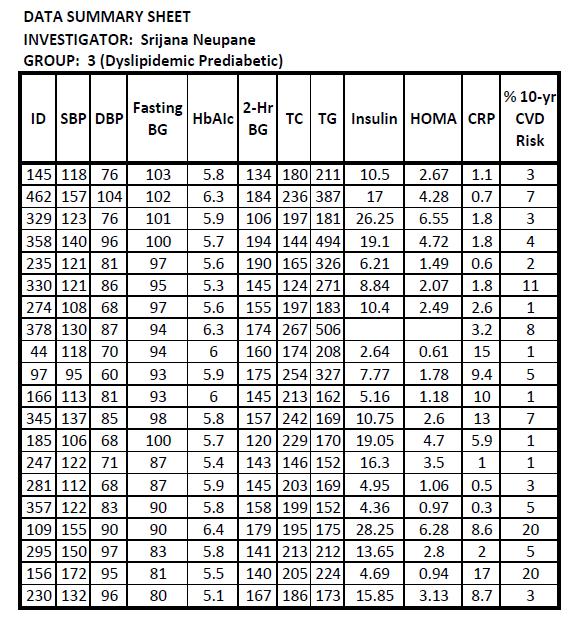
157 146
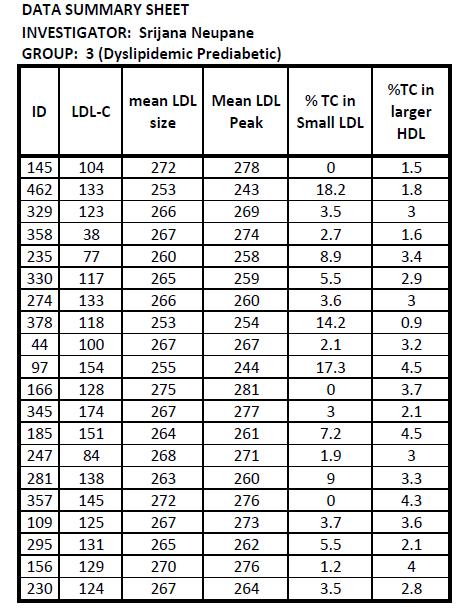
158 147
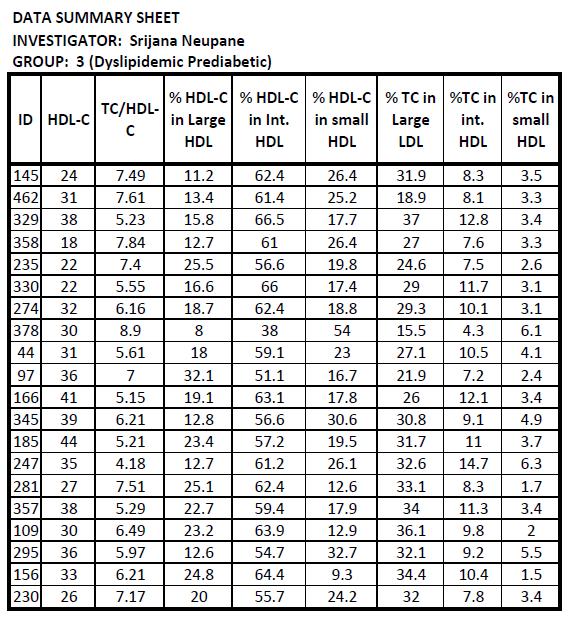
159 148
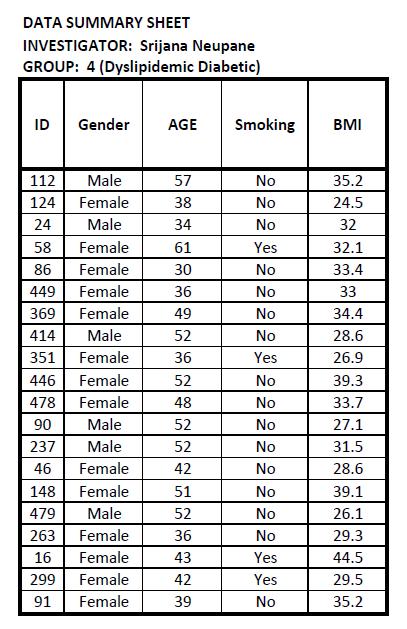
160 149
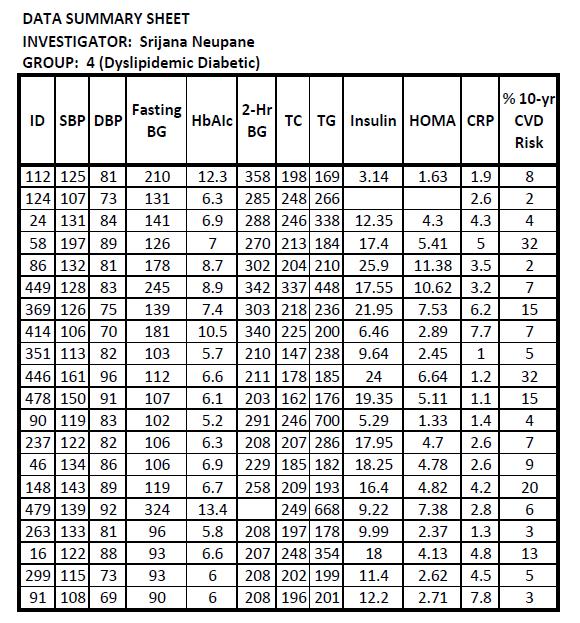
161 150
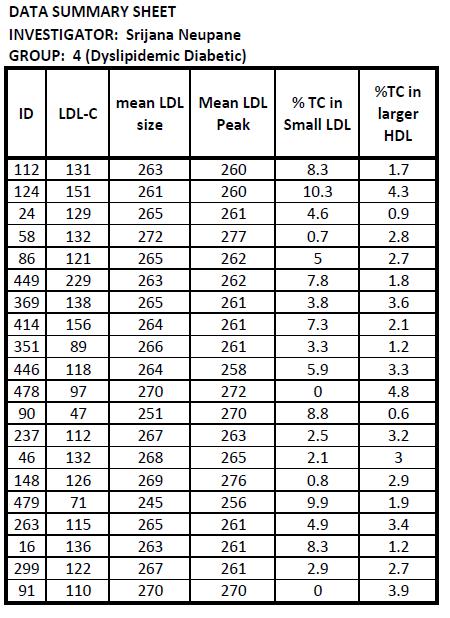
162 151
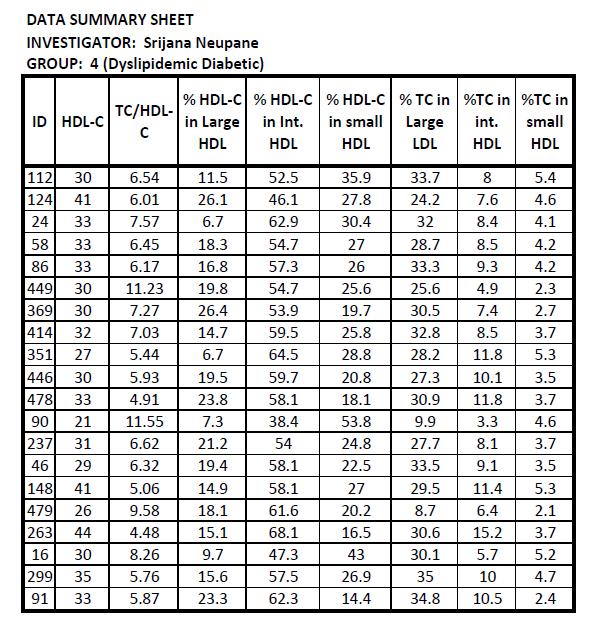
163 152
KEY COMPONENTS. Metabolic Risk Cardiovascular Risk Vascular Inflammation Markers
 CardioMetabolic Risk Poor blood sugar regulation and unhealthy triglyceride and lipoprotein levels often present long before the diagnosis of type 2 Diabetes. SpectraCell s CardioMetabolic and Pre-Diabetes
Pathophysiology of Lipid Disorders
 Pathophysiology of Lipid Disorders Henry Ginsberg, M.D. Division of Preventive Medicine and Nutrition CHD in the United States CHD is the single largest killer of men and women 12 million have history
ATP III (Adult Treatment Panel III) CLASSIFICATION C IN ADULTS
 CLASSIFICATION C IN ADULTS") LABORATORY AND RISK FACTORS OF ATHEROSCLEROSIS S R. Mohammadi Biochemist (Ph.D.) Faculty member of Medical Faculty RISK FACTORS FOR CHD Clinical Risk Factors Laboratory Risk Factors MAJOR CLINICAL RISK
LABORATORY AND RISK FACTORS OF ATHEROSCLEROSIS S R. Mohammadi Biochemist (Ph.D.) Faculty member of Medical Faculty RISK FACTORS FOR CHD Clinical Risk Factors Laboratory Risk Factors MAJOR CLINICAL RISK
Chapter (5) Etiology of Low HDL- Cholesterol
 Etiology of Low HDL- Cholesterol") Chapter (5) Etiology of Low HDL- Cholesterol The aim of this chapter is to summarize the different etiological factors mainly the role of life-style and different disease conditions contributing to the
Chapter (5) Etiology of Low HDL- Cholesterol The aim of this chapter is to summarize the different etiological factors mainly the role of life-style and different disease conditions contributing to the
The New Gold Standard for Lipoprotein Analysis. Advanced Testing for Cardiovascular Risk
 The New Gold Standard for Lipoprotein Analysis Advanced Testing for Cardiovascular Risk Evolution of Lipoprotein Testing The Lipid Panel Total Cholesterol = VLDL + LDL + HDL Evolution of Lipoprotein Testing
1Why lipids cannot be transported in blood alone? 2How we transport Fatty acids and steroid hormones?
 1Why lipids cannot be transported in blood alone? 2How we transport Fatty acids and steroid hormones? 3How are dietary lipids transported? 4How lipids synthesized in the liver are transported? 5 Lipoprotien
Part 1 Risk Factors and Atherosclerosis. LO1. Define the Different Forms of CVD
 Week 3: Cardiovascular Disease Learning Outcomes: 1. Define the difference forms of CVD 2. Describe the various risk factors of CVD 3. Describe atherosclerosis and its stages 4. Describe the role of oxidation,
Chapter VIII: Dr. Sameh Sarray Hlaoui
 Chapter VIII: Dr. Sameh Sarray Hlaoui Lipoproteins a Lipids are insoluble in plasma. In order to be transported they are combined with specific proteins to form lipoproteins: Clusters of proteins and lipids.
Chapter 18. Diet and Health
 Chapter 18 Diet and Health Risk Factors and Chronic Diseases Interrelationships among Chronic Diseases Chronic Disease Heart Disease and Stroke Hypertension Cancer Diabetes The Formation of Plaques in
Lipoproteins Metabolism Reference: Campbell Biochemistry and Lippincott s Biochemistry
 Lipoproteins Metabolism Reference: Campbell Biochemistry and Lippincott s Biochemistry Learning Objectives 1. Define lipoproteins and explain the rationale of their formation in blood. 2. List different
Statistical Fact Sheet Populations
 Statistical Fact Sheet Populations At-a-Glance Summary Tables Men and Cardiovascular Diseases Mexican- American Males Diseases and Risk Factors Total Population Total Males White Males Black Males Total
Dyslipidemia Endothelial dysfunction Free radicals Immunologic
 ATHEROSCLEROSIS Hossein Mehrani Professor of Clinical Biochemistry Definition Atherosclerosis: Is a chronic inflammatory process characterized by plaque formation within the vessel wall of arteries and
2.5% of all deaths globally each year. 7th leading cause of death by % of people with diabetes live in low and middle income countries
 Lipid Disorders in Diabetes (Diabetic Dyslipidemia) Khosrow Adeli PhD, FCACB, DABCC Head and Professor, Clinical Biochemistry, The Hospital for Sick Children, University it of Toronto Diabetes A Global
HSN301 REVISION NOTES TOPIC 1 METABOLIC SYNDROME
 HSN301 REVISION NOTES TOPIC 1 METABOLIC SYNDROME What does the term Metabolic Syndrome describe? Metabolic syndrome describes a cluster of cardio-metabolic conditions that increase one's risk of developing
Plasma lipoproteins & atherosclerosis by. Prof.Dr. Maha M. Sallam
 Biochemistry Department Plasma lipoproteins & atherosclerosis by Prof.Dr. Maha M. Sallam 1 1. Recognize structures,types and role of lipoproteins in blood (Chylomicrons, VLDL, LDL and HDL). 2. Explain
Plasma fibrinogen level, BMI and lipid profile in type 2 diabetes mellitus with hypertension
 World Journal of Pharmaceutical Sciences ISSN (Print): 2321-3310; ISSN (Online): 2321-3086 Published by Atom and Cell Publishers All Rights Reserved Available online at: http://www.wjpsonline.org/ Original
Lipoproteins Metabolism
 Lipoproteins Metabolism LEARNING OBJECTIVES By the end of this Lecture, the student should be able to describe: What are Lipoproteins? Describe Lipoprotein Particles. Composition of Lipoproteins. The chemical
Arteriosclerosis & Atherosclerosis
 Arteriosclerosis & Atherosclerosis Arteriosclerosis = hardening of arteries = arterial wall thickening + loss of elasticity 3 types: -Arteriolosclerosis -Monckeberg medial sclerosis -Atherosclerosis Arteriosclerosis,
Term-End Examination December, 2009 MCC-006 : CARDIOVASCULAR EPIDEMIOLOGY
 MCC-006 POST GRADUATE DIPLOMA IN CLINICAL CARDIOLOGY (PGDCC) 00269 Term-End Examination December, 2009 MCC-006 : CARDIOVASCULAR EPIDEMIOLOGY Time : 2 hours Maximum Marks : 60 Note : There will be multiple
Clinical Recommendations: Patients with Periodontitis
 The American Journal of Cardiology and Journal of Periodontology Editors' Consensus: Periodontitis and Atherosclerotic Cardiovascular Disease. Friedewald VE, Kornman KS, Beck JD, et al. J Periodontol 2009;
13/09/2012. Dietary fatty acids. Triglyceride. Phospholipids:
 CARDIOVASCULAR DISEASES (CVD) and NUTRITION Major cause of morbidity & mortality in Canada & other developed countries e.g., majority of approved health claims on food labels relate to lowering CVD Relation
Lipid/Lipoprotein Structure and Metabolism (Overview)
") Lipid/Lipoprotein Structure and Metabolism (Overview) Philip Barter President, International Atherosclerosis Society Centre for Vascular Research University of New South Wales Sydney, Australia Disclosures
Lipid/Lipoprotein Structure and Metabolism (Overview) Philip Barter President, International Atherosclerosis Society Centre for Vascular Research University of New South Wales Sydney, Australia Disclosures
Hypertriglyceridemia. Ara Metjian, M.D. Resident s Report 20 December 2002
 Hypertriglyceridemia Ara Metjian, M.D. Resident s Report 20 December 2002 Review of Lipids Chylomicrons (CM): Dietary lipids absorbed through the GI tract are assembled intracellularly into CM. Very Low
Update On Diabetic Dyslipidemia: Who Should Be Treated With A Fibrate After ACCORD-LIPID?
 Update On Diabetic Dyslipidemia: Who Should Be Treated With A Fibrate After ACCORD-LIPID? Karen Aspry, MD, MS, ABCL, FACC Assistant Clinical Professor of Medicine Warren Alpert Medical School of Brown
Lipids digestion and absorption, Biochemistry II
 Lipids digestion and absorption, blood plasma lipids, lipoproteins Biochemistry II Lecture 1 2008 (J.S.) Triacylglycerols (as well as free fatty acids and both free and esterified cholesterol) are very
Myths, Heart Disease and the Latino Population. Maria T. Vivaldi MD MGH Women s Heart Health Program. Hispanics constitute 16.3 % of US population!
 Myths, Heart Disease and the Latino Population Maria T. Vivaldi MD MGH Women s Heart Health Program Hispanics constitute 16.3 % of US population! 1 LEADING CAUSES OF DEATH IN LATINOS Heart disease is the
Behind LDL: The Metabolism of ApoB, the Essential Apolipoprotein in LDL and VLDL
 Behind LDL: The Metabolism of ApoB, the Essential Apolipoprotein in LDL and VLDL Sung-Joon Lee, PhD Division of Food Science Institute of Biomedical Science and Safety Korea University Composition of Lipoproteins:
Lipoprotein Particle Profile
 Lipoprotein Particle Profile 50% of people at risk for HEART DISEASE are not identified by routine testing. Why is LPP Testing The Most Comprehensive Risk Assessment? u Provides much more accurate cardiovascular
Roadmap. Diabetes and the Metabolic Syndrome in the Asian Population. Asian. subgroups 8.9. in U.S. (% of total
 Diabetes and the Metabolic Syndrome in the Asian Population Alka Kanaya, MD Associate Professor of Medicine, UCSF Feb 26, 2010 Roadmap 1. Diabetes in Asian Americans Prevalence in the U.S. Risk factors
Metabolic Syndrome.
 www.bmiweightloss.com.au What is the metabolic syndrome? The was first described in 1988 by Gerald Reavson It was originally described as the clustering of four conditions These conditions when present
The Metabolic Syndrome Update The Metabolic Syndrome Update. Global Cardiometabolic Risk
 The Metabolic Syndrome Update 2018 Marc Cornier, M.D. Professor of Medicine Division of Endocrinology, Metabolism & Diabetes Anschutz Health and Wellness Center University of Colorado School of Medicine
CHAPTER FORTY FIVE ENDOGENOUS LIPID TRANSPORT PATHWAY: VLDL AND IDL
 CHAPTER FORTY FIVE ENDOGENOUS LIPID TRANSPORT PATHWAY: VLDL AND IDL You will notice that the endogenous pathway is very similar to the exogenous pathway What is the average daily amount of triacylglycerol
EXECUTIVE SUMMARY OF THE MINOR RESEARCH PROJECT Submitted to UNIVERSITY GRANTS COMMISSION
 1 A STUDY ON THE EFFECT OF DIET & LIFE STYLE ON THE INCIDENCE OF CORONARY ARTERY DISEASE IN MODERATELY DRINKING EX MILITARY MEN IN PATHANAMTHITTA DISTRICT. EXECUTIVE SUMMARY OF THE MINOR RESEARCH PROJECT
ANSC/NUTR 618 LIPIDS & LIPID METABOLISM Lipoprotein Metabolism
 ANSC/NUTR 618 LIPIDS & LIPID METABOLISM Lipoprotein Metabolism I. Chylomicrons (exogenous pathway) A. 83% triacylglycerol, 2% protein, 8% cholesterol plus cholesterol esters, 7% phospholipid (esp. phosphatidylcholine)
POST GRADUATE DIPLOMA IN CLINICAL CARDIOLOGY (PGDCC) Term-End Examination June, 2015
 Term-End Examination June, 2015") No. of Printed Pages : 20 MCC-006 POST GRADUATE DIPLOMA IN CLINICAL 0 CARDIOLOGY (PGDCC) Term-End Examination June, 2015 MCC-006 : CARDIO VASCULAR EPIDEMIOLOGY Time : 2 hours Maximum Marks : 60 Note :
No. of Printed Pages : 20 MCC-006 POST GRADUATE DIPLOMA IN CLINICAL 0 CARDIOLOGY (PGDCC) Term-End Examination June, 2015 MCC-006 : CARDIO VASCULAR EPIDEMIOLOGY Time : 2 hours Maximum Marks : 60 Note :
Andrew Cohen, MD and Neil S. Skolnik, MD INTRODUCTION
 2 Hyperlipidemia Andrew Cohen, MD and Neil S. Skolnik, MD CONTENTS INTRODUCTION RISK CATEGORIES AND TARGET LDL-CHOLESTEROL TREATMENT OF LDL-CHOLESTEROL SPECIAL CONSIDERATIONS OLDER AND YOUNGER ADULTS ADDITIONAL
 Glossary For TheFatNurse s For All Ages Series Adipocytes, also known as lipocytes and fat cells, are the cells that primarily compose adipose tissue, specialized in storing energy as fat. Apolipoprotein
THE CLINICAL BIOCHEMISTRY OF LIPID DISORDERS
 THE CLINICAL BIOCHEMISTRY OF LIPID DISORDERS Hormonal regulation INSULIN lipid synthesis, lipolysis CORTISOL lipolysis GLUCAGON lipolysis GROWTH HORMONE lipolysis CATECHOLAMINES lipolysis LEPTIN catabolism
Objectives. Objectives. Alejandro J. de la Torre, MD Cook Children s Hospital May 30, 2015
 Alejandro J. de la Torre, MD Cook Children s Hospital May 30, 2015 Presentation downloaded from http://ce.unthsc.edu Objectives Understand that the obesity epidemic is also affecting children and adolescents
Cardiovascular Complications of Diabetes
 VBWG Cardiovascular Complications of Diabetes Nicola Abate, M.D., F.N.L.A. Professor and Chief Division of Endocrinology and Metabolism The University of Texas Medical Branch Galveston, Texas Coronary
High density lipoprotein metabolism
 High density lipoprotein metabolism Lipoprotein classes and atherosclerosis Chylomicrons, VLDL, and their catabolic remnants Pro-atherogenic LDL HDL Anti-atherogenic Plasma lipid transport Liver VLDL FC
REAGENTS. RANDOX sdldl CHOLESTEROL (sdldl-c) SIZE MATTERS: THE TRUE WEIGHT OF RISK IN LIPID PROFILING
 SIZE MATTERS: THE TRUE WEIGHT OF RISK IN LIPID PROFILING") REAGENTS RANDOX sdldl CHOLESTEROL (sdldl-c) SIZE MATTERS: THE TRUE WEIGHT OF RISK IN LIPID PROFILING Randox sdldl Cholesterol (sdldl-c) Size Matters: The True Wight of Risk in Lipid Profiling 1. BACKGROUND
REAGENTS RANDOX sdldl CHOLESTEROL (sdldl-c) SIZE MATTERS: THE TRUE WEIGHT OF RISK IN LIPID PROFILING Randox sdldl Cholesterol (sdldl-c) Size Matters: The True Wight of Risk in Lipid Profiling 1. BACKGROUND
 Acetyl CoA HMG CoA Mevalonate (C6) Dimethylallyl Pyrophosphate isopentenyl Pyrophosphate (C5) Geranyl Pyrophosphate (C10) FarnesylPyrophosphate (C15) Squalene (C30) Lanosterol (C30) 7 Dehydrocholesterol
Marshall Tulloch-Reid, MD, MPhil, DSc, FACE Epidemiology Research Unit Tropical Medicine Research Institute The University of the West Indies, Mona,
 Marshall Tulloch-Reid, MD, MPhil, DSc, FACE Epidemiology Research Unit Tropical Medicine Research Institute The University of the West Indies, Mona, Jamaica At the end of this presentation the participant
Role of apolipoprotein B-containing lipoproteins in the development of atherosclerosis Jan Borén MD, PhD
 Role of apolipoprotein B-containing lipoproteins in the development of atherosclerosis Jan Borén MD, PhD Our laboratory focuses on the role of apolipoprotein (apo) B- containing lipoproteins in normal
METABOLIC SYNDROME IN REPRODUCTIVE FEMALES
 METABOLIC SYNDROME IN REPRODUCTIVE FEMALES John J. Orris, D.O., M.B.A Division Head, Reproductive Endocrinology & Infertility, Main Line Health System Associate Professor, Drexel University College of
Rick Fox M.A Health and Wellness Specialist
 Metabolic Diseases Rick Fox M.A Health and Wellness Specialist Metabolic Diseases Metabolism is the process your body uses to get or make energy from the food you eat. Food is made up of proteins, carbohydrates
Cardiovascular Disease Risk Factors:
 Cardiovascular Disease Risk Factors: Risk factors are traits or habits that increase a person's chances of having cardiovascular disease. Some risk factors can be changed. These risk factors are high blood
The Metabolic Syndrome Update The Metabolic Syndrome: Overview. Global Cardiometabolic Risk
 Update 2013 Marc Cornier, M.D. Associate Professor of Medicine Division of Endocrinology, Metabolism & Diabetes Anschutz Health and Wellness Center University of Colorado School of Medicine Denver Health
3/20/2011. Body Mass Index (kg/[m 2 ]) Age at Issue (*BMI > 30, or ~ 30 lbs overweight for 5 4 woman) Mokdad A.H.
![3/20/2011. Body Mass Index (kg/[m 2 ]) Age at Issue (*BMI > 30, or ~ 30 lbs overweight for 5 4 woman) Mokdad A.H.](/thumbs/82/84935173.jpg "3/20/2011. Body Mass Index (kg/[m 2 ]) Age at Issue (*BMI > 30, or ~ 30 lbs overweight for 5 4 woman) Mokdad A.H.") U.S. Adults: 1988 Nineteen states with 10-14% 14% Prevalence of Obesity (*BMI > 30, or ~ 30 lbs overweight for 5 4 woman) Metabolic John P. Cello, MD Professor of Medicine and Surgery, University of California,
U.S. Adults: 1988 Nineteen states with 10-14% 14% Prevalence of Obesity (*BMI > 30, or ~ 30 lbs overweight for 5 4 woman) Metabolic John P. Cello, MD Professor of Medicine and Surgery, University of California,
Cardiovascular Disease
 Cardiovascular Disease Controlling your risk factors WE RECOMMEND THAT YOU Monitor your blood pressure on a regular basis If you have high blood pressure, reduce your intake of salt, tea and coffee Drink
Unit IV Problem 3 Biochemistry: Cholesterol Metabolism and Lipoproteins
 Unit IV Problem 3 Biochemistry: Cholesterol Metabolism and Lipoproteins - Cholesterol: It is a sterol which is found in all eukaryotic cells and contains an oxygen (as a hydroxyl group OH) on Carbon number
Metabolic Syndrome Update The Metabolic Syndrome: Overview. Global Cardiometabolic Risk
 Metabolic Syndrome Update 21 Marc Cornier, M.D. Associate Professor of Medicine Division of Endocrinology, Metabolism & Diabetes University of Colorado Denver Denver Health Medical Center The Metabolic
Total risk management of Cardiovascular diseases Nobuhiro Yamada
 Nobuhiro Yamada The worldwide burden of cardiovascular diseases (WHO) To prevent cardiovascular diseases Beyond LDL Multiple risk factors With common molecular basis The Current Burden of CVD CVD is responsible
Metabolic Syndrome: An overview. Kevin Niswender MD, PhD Vanderbilt University School of Medicine
 Metabolic Syndrome: An overview. Kevin Niswender MD, PhD Vanderbilt University School of Medicine Setting the scene GB, 43 yo AA man followed for hypothyroidism returns on LT4 125 mcg/d and has a TSH=1.1
Diabetic Dyslipidemia
 Diabetic Dyslipidemia Dr R V S N Sarma, M.D., (Internal Medicine), M.Sc., (Canada), Consultant Physician Cardiovascular disease (CVD) is a significant cause of illness, disability, and death among individuals
Obesity and the Metabolic Syndrome in Developing Countries: Focus on South Asians
 Obesity and the Metabolic Syndrome in Developing Countries: Focus on South Asians Anoop Misra Developing countries, particularly South Asian countries, are witnessing a rapid increase in type 2 diabetes
Disclosures. Background 1 What is Known MENOPAUSE, ESTROGENS, AND LIPOPROTEIN PARTICLES. Background 2 What is Not Known 10/2/2017
 Disclosures MENOPAUSE, ESTROGENS, AND LIPOPROTEIN PARTICLES Grants: NIH, Quest Diagnostics Consultant: Quest Diagnostics Merck Global Atherosclerosis Advisory Board Ronald M. Krauss, Children s Hospital
Cardiovascular System and Health. Chapter 15
 Cardiovascular System and Health Chapter 15 Cardiovascular Disease Leading cause of death in U.S. Claims 1 life every 43 seconds Often, the first sign is a fatal heart attack Death Rates #1 CVD #2 Cancer
DYSLIPIDEMIA PHARMACOLOGY. University of Hawai i Hilo Pre- Nursing Program NURS 203 General Pharmacology Danita Narciso Pharm D
 DYSLIPIDEMIA PHARMACOLOGY University of Hawai i Hilo Pre- Nursing Program NURS 203 General Pharmacology Danita Narciso Pharm D 1 LEARNING OBJECTIVES Know normal cholesterol levels Understand what the role
ABSTRACT. Dr. Jiuzhou Song, Department of Avian and Animal Sciences. Blacks in the country suffer from higher prevalences of obesity, diabetes,
 ABSTRACT Title of Document: IS THE CURRENT DEFINITION OF THE METABOLIC SYNDROME A USEFUL TOOL FOR THE DETECTION OF CARDIOVASCULAR DISEASE IN NON- HISPANIC BLACKS? Omayra I. Rodriguez, Masters in Science,
!!! Aggregate Report Fasting Biometric Screening CLIENT!XXXX. May 2, ,000 participants
 Aggregate Report Fasting Biometric Screening CLIENTXXXX May 2, 2014 21,000 participants Contact:404.636.9437~Website:www.atlantahealthsys.com RISK FACTOR QUESTIONNAIRE Participants Percent Do not exercise
Review of guidelines for management of dyslipidemia in diabetic patients
 2012 international Conference on Diabetes and metabolism (ICDM) Review of guidelines for management of dyslipidemia in diabetic patients Nan Hee Kim, MD, PhD Department of Internal Medicine, Korea University
Chapter 2 The Metabolic Syndrome
 Chapter 2 The Metabolic Syndrome Matthew J. Sorrentino Keywords Waist circumference Abdominal obesity Impaired fasting glucose HDL-cholesterol Triglycerides Metabolic syndrome is the designation given
Metabolic Syndrome. Bill Roberts, M.D., Ph.D. Professor of Pathology University of Utah
 Metabolic Syndrome Bill Roberts, M.D., Ph.D. Professor of Pathology University of Utah Objectives Be able to outline the pathophysiology of the metabolic syndrome Be able to list diagnostic criteria for
Wellness: Concepts and Applications 8 th Edition Anspaugh, Hamrick, Rosato
 Wellness: Concepts and Applications 8 th Edition Anspaugh, Hamrick, Rosato Preventing Cardiovascular Disease Chapter 2 Cardiovascular Disease the leading cause of death in the U.S. 35.3% of all deaths
Cholesterol metabolism. Function Biosynthesis Transport in the organism Hypercholesterolemia
 Cholesterol metabolism Function Biosynthesis Transport in the organism Hypercholesterolemia - component of all cell membranes - precursor of bile acids steroid hormones vitamin D Cholesterol Sources: dietary
Hyperlipidemia. Prepared by : Muhannad Mohammed Supervisor professor : Dr. Ahmed Yahya Dallalbashi
 Hyperlipidemia Prepared by : Muhannad Mohammed Supervisor professor : Dr. Ahmed Yahya Dallalbashi Outline The story of lipids Definition of hyperlipidemia Classification of hyperlipidemia Causes of hyperlipidemia
Risk Factors for Heart Disease
 Risk Factors for Heart Disease Risk Factors we cannot change (Age, Gender, Family History) Risk Factors we can change (modifiable) Smoking Blood pressure Cholesterol Diabetes Inactivity Overweight Stress
Cho et al., 2009 Journal of Cardiology (2009), 54:
, 54:") Endothelial Dysfunction, Increased Carotid Artery Intima-media Thickness and Pulse Wave Velocity, and Increased Level of Inflammatory Markers are Associated with Variant Angina Cho et al., 2009 Journal
Endothelial Dysfunction, Increased Carotid Artery Intima-media Thickness and Pulse Wave Velocity, and Increased Level of Inflammatory Markers are Associated with Variant Angina Cho et al., 2009 Journal
Hypertension with Comorbidities Treatment of Metabolic Risk Factors in Children and Adolescents
 Hypertension with Comorbidities Treatment of Metabolic Risk Factors in Children and Adolescents Stella Stabouli Ass. Professor Pediatrics 1 st Department of Pediatrics Hippocratio Hospital Evaluation of
PIEDMONT ACCESS TO HEALTH SERVICES, INC. Guidelines for Screening and Management of Dyslipidemia
 PIEDMONT ACCESS TO HEALTH SERVICES, INC. Policy Number: 01-09-021 SUBJECT: Guidelines for Screening and Management of Dyslipidemia EFFECTIVE DATE: 04/2008 REVIEWED/REVISED: 04/12/10, 03/17/2011, 4/10/2012,
2013 ACC/AHA Guidelines on the Assessment of Atherosclerotic Cardiovascular Risk: Overview and Commentary
 2013 ACC/AHA Guidelines on the Assessment of Atherosclerotic Cardiovascular Risk: Overview and Commentary The Johns Hopkins Ciccarone Center for the Prevention of Heart Disease Becky McKibben, MPH; Seth
Established Risk Factors for Coronary Heart Disease (CHD)
") Getting Patients to Make Small Lifestyle Changes That Result in SIGNIFICANT Improvements in Health - Prevention of Diabetes and Obesity for Better Health Maureen E. Mays, MD, MS, FACC Director ~ Portland
Getting Patients to Make Small Lifestyle Changes That Result in SIGNIFICANT Improvements in Health - Prevention of Diabetes and Obesity for Better Health Maureen E. Mays, MD, MS, FACC Director ~ Portland
The Metabolic Syndrome: Is It A Valid Concept? YES
 The Metabolic Syndrome: Is It A Valid Concept? YES Congress on Diabetes and Cardiometabolic Health Boston, MA April 23, 2013 Edward S Horton, MD Joslin Diabetes Center Harvard Medical School Boston, MA
Topic 11. Coronary Artery Disease
 Topic 11 Coronary Artery Disease Lipid metabolism http://news.bbc.co.uk/2/hi/health/7372495.stm Sterol Metabolism and Coronary Artery Disease Big Picture: Exogenous Cholesterol and Fat Metabolism Fats-Triglycerides
Latest Guidelines for Lipid Management
 Latest Guidelines for Lipid Management Goals Recognize the differences between different guidelines Understand the effective strategies to tailor lipid lowering therapies based on evidence and guideline
Lipid metabolism in familial hypercholesterolemia
 Lipid metabolism in familial hypercholesterolemia Khalid Al-Rasadi, BSc, MD, FRCPC Head of Biochemistry Department, SQU Head of Lipid and LDL-Apheresis Unit, SQUH President of Oman society of Lipid & Atherosclerosis
Nature Genetics: doi: /ng.3561
 Supplementary Figure 1 Pedigrees of families with APOB p.gln725* mutation and APOB p.gly1829glufs8 mutation (a,b) Pedigrees of families with APOB p.gln725* mutation. (c) Pedigree of family with APOB p.gly1829glufs8
 Glossary For TheFatNurse s For All Ages Series Apolipoprotein B (APOB or ApoB) are the primary apolipoproteins of chylomicrons and low-density lipoproteins (LDL - known commonly by the misnomer "bad cholesterol"
PATIENTS AND METHODS:
 BACKGROUND: Rheumatoid arthritis (RA) is a chronic systemic inflammatory disease characterized by erosive synovitis that involves peripheral joints and implicates an important influence in the quality
MOLINA HEALTHCARE OF CALIFORNIA
 MOLINA HEALTHCARE OF CALIFORNIA HIGH BLOOD CHOLESTEROL IN ADULTS GUIDELINE Molina Healthcare of California has adopted the Third Report of the National Cholesterol Education Program (NCEP) Expert Panel
Changes in Cardiotrophin-1 and Fibroblast Growth Factor-21 with Weight Loss. Robert Lawrence Bowers
 Changes in Cardiotrophin-1 and Fibroblast Growth Factor-21 with Weight Loss by Robert Lawrence Bowers A dissertation submitted to the Graduate Faculty of Auburn University in partial fulfillment of the
Metabolic Syndrome in Asians
 Metabolic Syndrome in Asians Alka Kanaya, MD Asst. Professor of Medicine, UCSF Asian CV Symposium, November 17, 2007 The Metabolic Syndrome Also known as: Syndrome X Insulin Resistance Syndrome The Deadly
Metabolic defects underlying dyslipidemia in abdominal obesity
 Metabolic defects underlying dyslipidemia in abdominal obesity Professor Marja-Riitta Taskinen Department of Medicine, Division of Cardiology Helsinki University Hospital, Finland Disclosures: Honorariums/
METABOLISM of ADIPOSE TISSUE
 METABOLISM of ADIPOSE TISSUE 2. LF UK Prof. Rudolf Poledne, PhD. TYPES OF ADIPOSE TISSUE brown adipose tissue subcutaneous adipose tissue visceral adipose tissue ADIPOSE TISSUE FUNCTIONS: thermal isolation
Hypertriglyceridemia: Why, When, and How to Treat. Gregory Cohn, MD, FNLA, FASPC
 Hypertriglyceridemia: Why, When, and How to Treat Gregory Cohn, MD, FNLA, FASPC DISCLOSURES Consultant to Akcea Therapeutics (in the past 12 months). OUTLINE I. Lipoproteins II. Non-HDL-C III. Causes and
SUMMARY. Introduction. Study design. Summary
 SUMMARY Introduction The global prevalence of type 2 diabetes is increasing rapidly and nowadays affects almost 250 million people. Cardiovascular disease is the most prevalent complication of type 2 diabetes,
THE INFLUENCE OF EXERCISE DOSE, EXERCISE INTENSITY, AND WEIGHT LOSS AND CHANGE IN C-REACTIVE PROTEIN IN SEDENTARY OVERWEIGHT WOMEN. Patricia K.
 THE INFLUENCE OF EXERCISE DOSE, EXERCISE INTENSITY, AND WEIGHT LOSS AND CHANGE IN C-REACTIVE PROTEIN IN SEDENTARY OVERWEIGHT WOMEN by Patricia K. Tuite BSN University of Pittsburgh, 1985 MSN University
 http://noodlemaz.wordpress.com/category/science/cancer/ Outline Introduction Serious nature of Cardiovascular Disease (CVD) How to prevent CVD? The disease process Damage and plaque development Current
Learning Objectives. Cholesterol and Lipids in Kids: It s a Matter of the Heart. Is Atherosclerosis a Pediatric Disease?
 Scott J. Soifer, MD Professor and Vice Chair Department of Pediatrics University of California, San Francisco UCSF Benioff Children s Hospital Cholesterol and Lipids in Kids: It s a Matter of the Heart
Metabolic Syndrome. DOPE amines COGS 163
 Metabolic Syndrome DOPE amines COGS 163 Overview - M etabolic Syndrome - General definition and criteria - Importance of diagnosis - Glucose Homeostasis - Type 2 Diabetes Mellitus - Insulin Resistance
JUSTUS WARREN TASK FORCE MEETING DECEMBER 05, 2012
 SAMUEL TCHWENKO, MD, MPH Epidemiologist, Heart Disease & Stroke Prevention Branch Chronic Disease & Injury Section; Division of Public Health NC Department of Health & Human Services JUSTUS WARREN TASK
HIGH LDL CHOLESTEROL IS NOT AN INDEPENDENT RISK FACTOR FOR HEART ATTACKS AND STROKES
 HIGH LDL CHOLESTEROL IS NOT AN INDEPENDENT RISK FACTOR FOR HEART ATTACKS AND STROKES A study published in the British Medical Journal shows that not only is high LDL cholesterol not a risk factor for all-caused
1. Most of your blood cholesterol is produced by: a. your kidneys b. your liver c. your pancreas d. food consumption (Your liver)
") I. TEST YOUR KNOWLEDGE OF CHOLESTEROL Choose the correct answer. 1. Most of your blood cholesterol is produced by: a. your kidneys b. your liver c. your pancreas d. food consumption (Your liver) 2. Only
I. TEST YOUR KNOWLEDGE OF CHOLESTEROL Choose the correct answer. 1. Most of your blood cholesterol is produced by: a. your kidneys b. your liver c. your pancreas d. food consumption (Your liver) 2. Only
Prof. John Chapman, MD, PhD, DSc
 Prof. John Chapman, MD, PhD, DSc Director of the Dyslipidemia and Atherosclerosis Research Unit of the National Institute for Health and Medical Research (INSERM) at the Pitié-Salpétrière Hospital in Paris
Heart Health. Team Member Workbook Session 1 LEARN IDENTIFY ACT. Learn about HTHU Level 3 and the point system
 LEARN Learn about HTHU Level 3 and the point system 01 IDENTIFY Identify the major risk factors for cardiovascular disease and how to improve our cardiovascular health 03 02 ACT Begin our Session 1 Goal
10/1/2008. Therapy? Disclosure Statement
 What s New in Lipid Therapy? Brooke Hudspeth, PharmD Diabetes Care Kroger Pharmacy Disclosure Statement In accordance with policies set forth by the Accreditation Council for Continuing Medical Education
CLINICAL OUTCOME Vs SURROGATE MARKER
 CLINICAL OUTCOME Vs SURROGATE MARKER Statin Real Experience Dr. Mostafa Sherif Senior Medical Manager Pfizer Egypt & Sudan Objective Difference between Clinical outcome and surrogate marker Proper Clinical
Complications of Diabetes mellitus. Dr Bill Young 16 March 2015
 Complications of Diabetes mellitus Dr Bill Young 16 March 2015 Complications of diabetes Multi-organ involvement 2 The extent of diabetes complications At diagnosis as many as 50% of patients may have