Boucher et al NCOMMS B
|
|
|
- Meryl Barnett
- 5 years ago
- Views:
Transcription
1 1
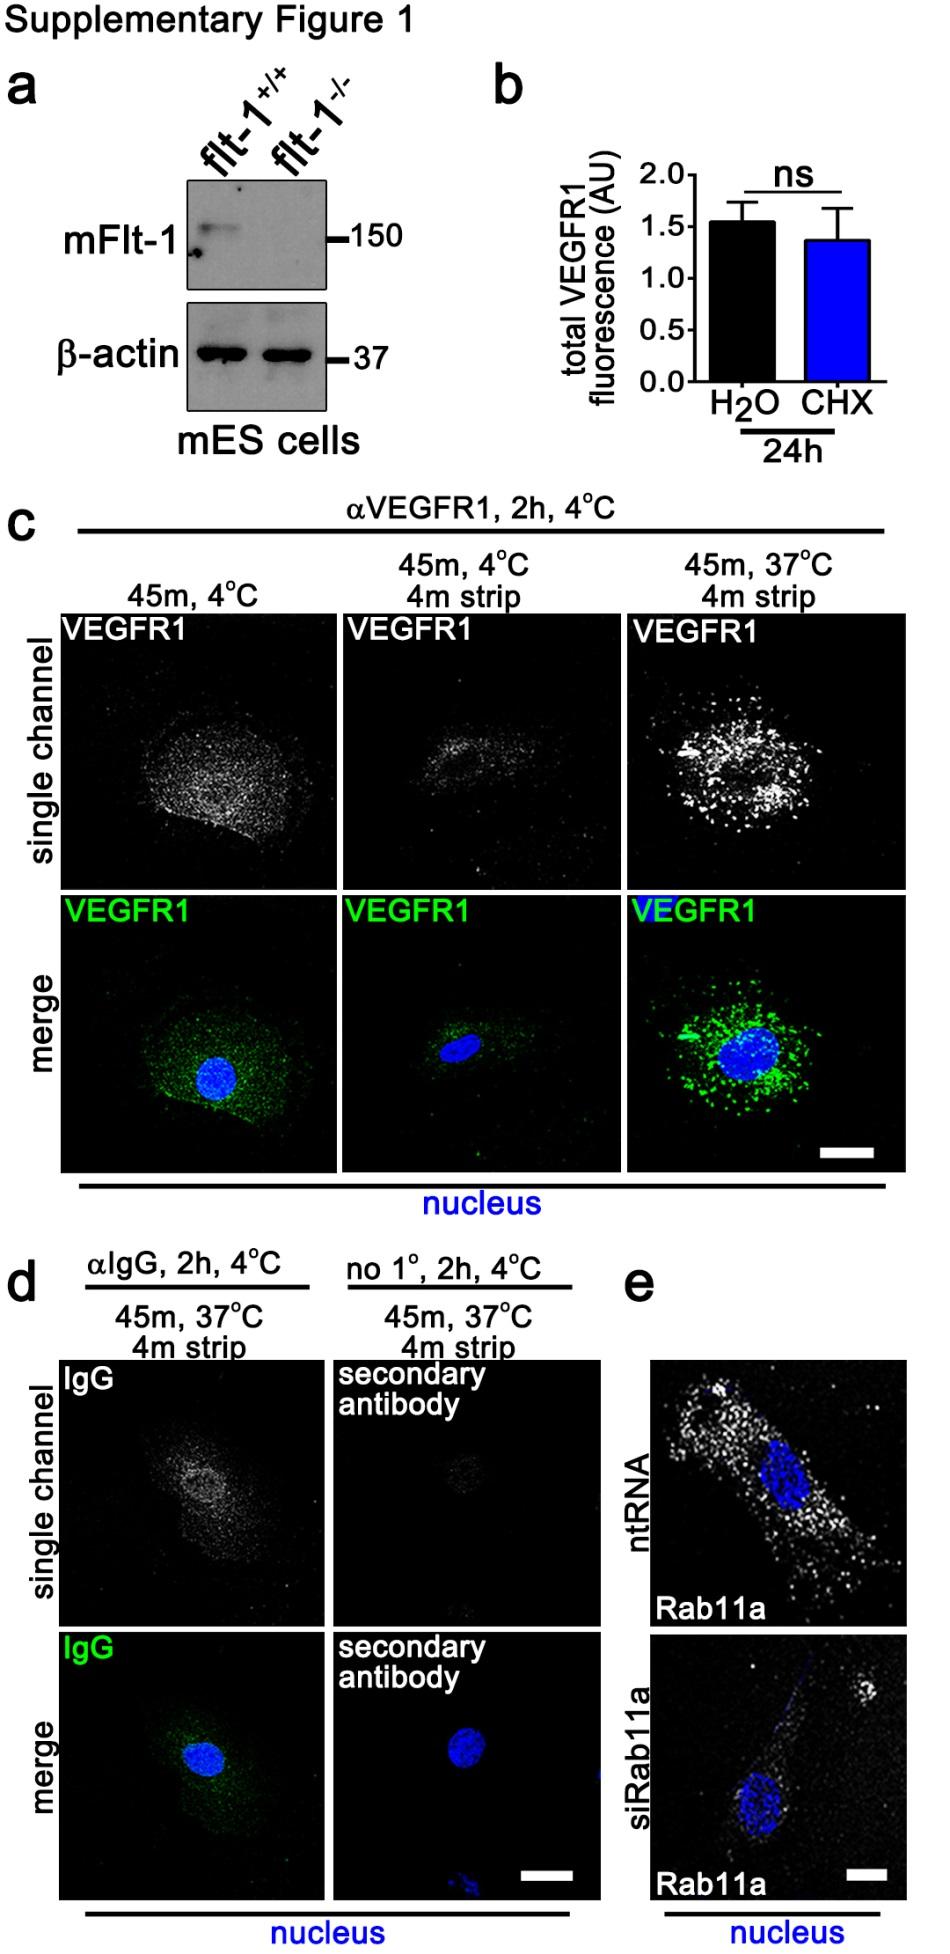
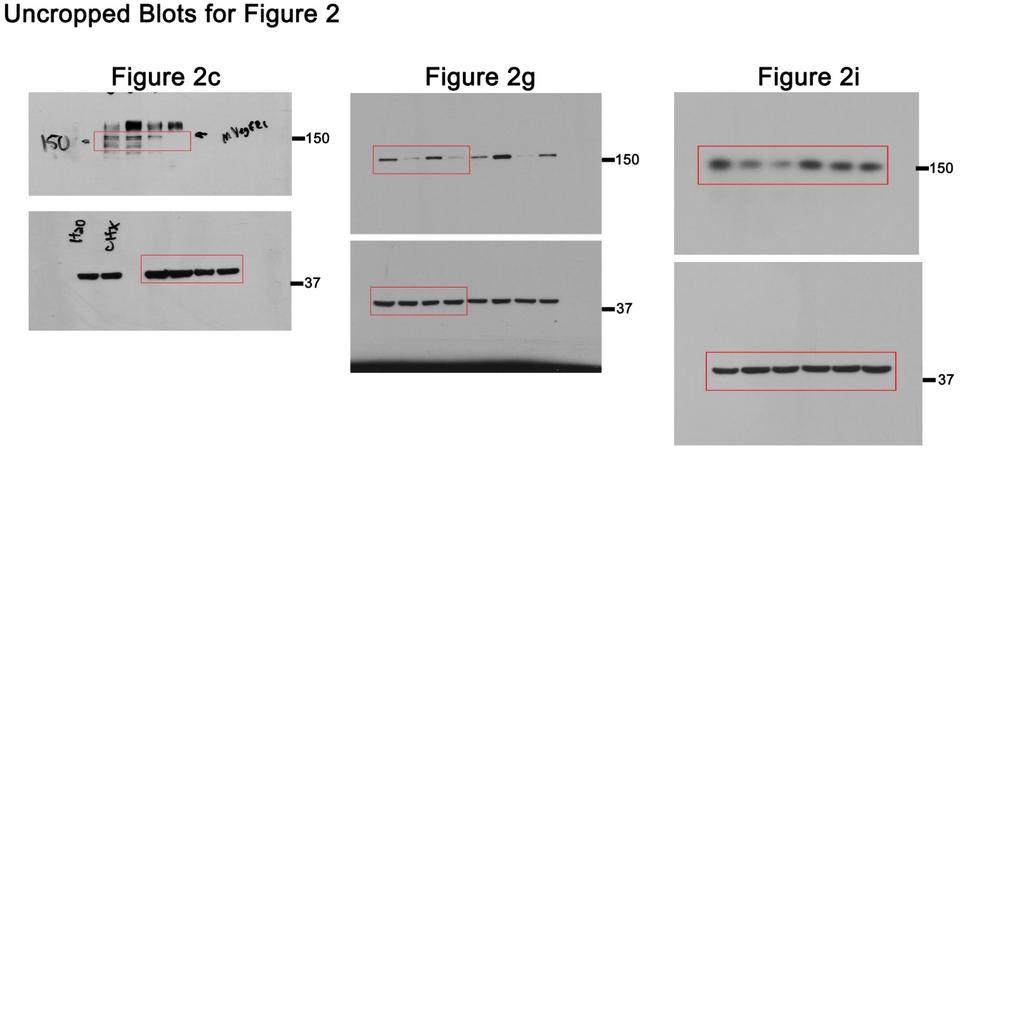
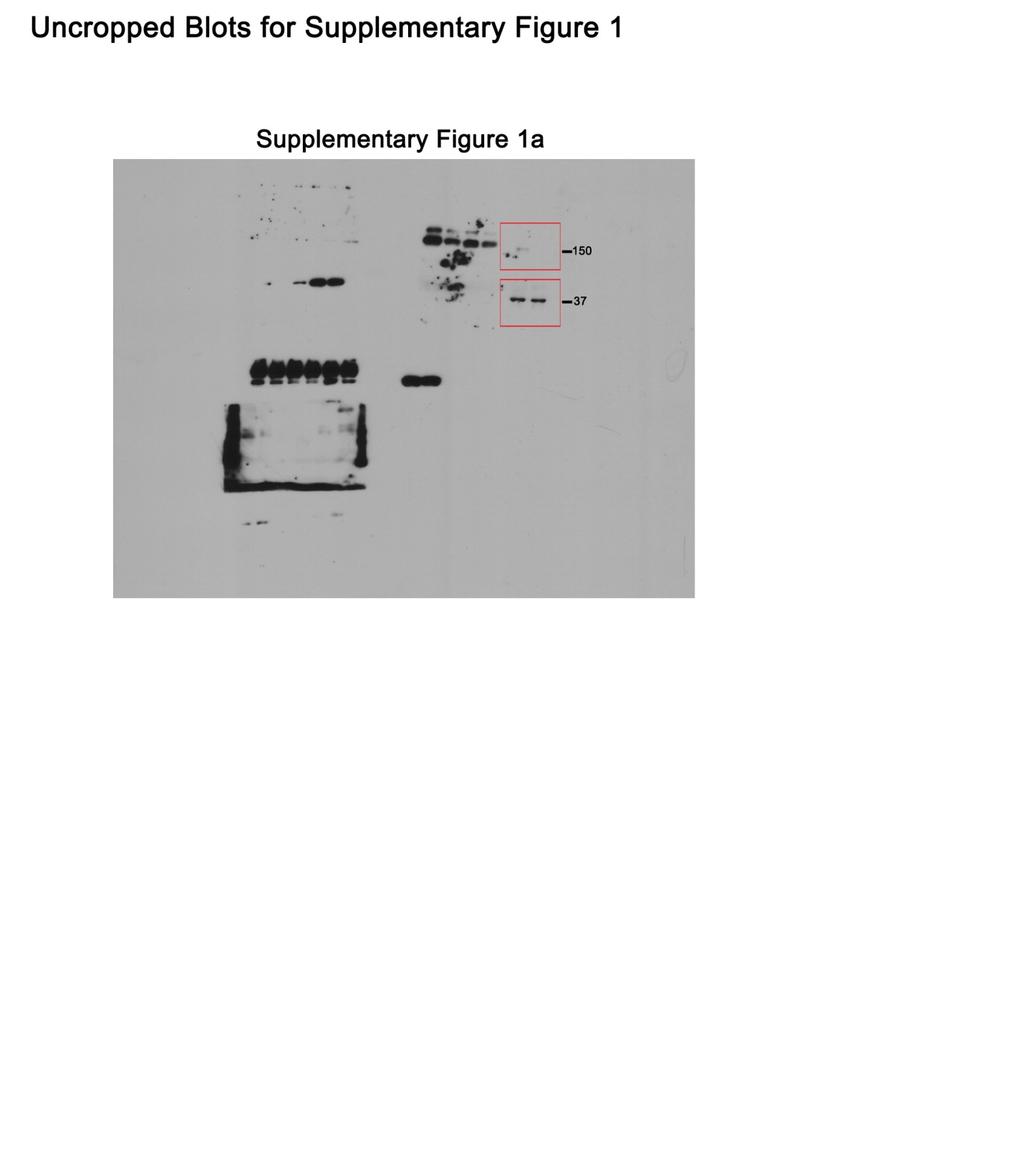
2 Supplementary Figure 1 (linked to Figure 1). mvegfr1 constitutively internalizes in endothelial cells. (a) Immunoblot of mflt1 from undifferentiated mouse embryonic stem (ES) cells with indicated genotypes; 2 replicates. (b) Quantification of VEGFR1 fluorescence intensity of HUVEC with indicated treatments via integrated density. (n=44/control; n=42/chx). CHX, cycloheximide; 2 replicates. Statistics: Shown are means + 95% CI, student s t-test with Tukey s post-hoc range test; ns, not significant. (c-d) Immunofluorescence of VEGFR1 from HUVEC internalization assay with indicated treatments. Strip: 0.2M acetic acid, 4min; 3 replicates. (e) Rab11a immunofluorescence in HUVEC with indicated treatments. DRAQ7 (nuclei); 2 replicates. All scale bars: 20µm. 2
 (a) VEGFR1 immunofluorescence of d5 HUVEC angiogenic sprouts treated with 2-BH for 12h prior to CHQ for 5h, scale bar: 25µm. (b) Quantification of VEGFR1 fluorescence via integrated density.")
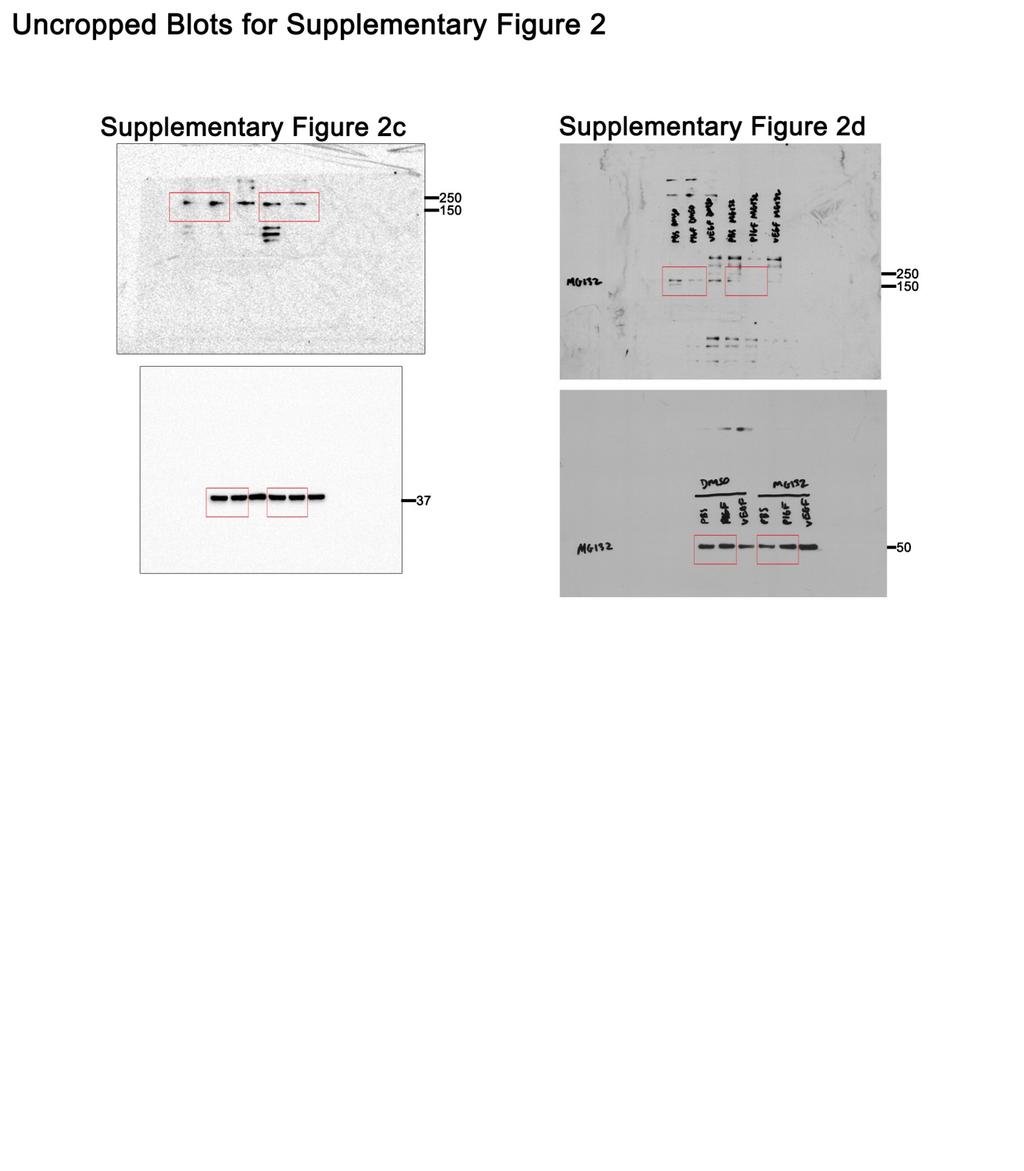
3 Supplementary Figure 2 (linked to Figure 2). Destabilized mvegfr1 degrades via the lysosome. (a-b) (a) VEGFR1 immunofluorescence of d5 HUVEC angiogenic sprouts treated with 2-BH for 12h prior to CHQ for 5h, scale bar: 25µm. (b) Quantification of VEGFR1 fluorescence via integrated density. Shown are means + 95% CI (#sprouts; EtOH/H 2 O, n=6; EtOH/CHQ, n=6; 2-BH/H 2 O, n=8; 2-BH/CHQ, n=5); 2-BH, 2-bromohexadecadnoic acid; CHQ, chloroquine; 2 replicates. Statistics: one-way ANOVA and pairwise comparison with post-hoc Tukey s range test. **, p 0.01; ns, not significant. (c-d) Immunoblot of HUVEC with indicated treatments, 3 replicates. 3
 (a) VEGFR1 and LAMP-1 (lysosome marker) immunofluorescence of HUVEC with indicated treatments and (b) Mander s Correlation Coefficient quantification of VEGFR1 overlap with LAMP-1.")
4 Supplementary Figure 3 (linked to Figure 3). Palmitoylation regulates mvegfr1 localization with lysosomes. (a-b) (a) VEGFR1 and LAMP-1 (lysosome marker) immunofluorescence of HUVEC with indicated treatments and (b) Mander s Correlation Coefficient quantification of VEGFR1 overlap with LAMP-1. (#cells: EtOH, n=38; 2-BH, n=36); 3 replicates, scale bar: 10µm. Statistics: Shown are means +95% CI. Pairwise comparison with post-hoc Tukey s range test. **, p

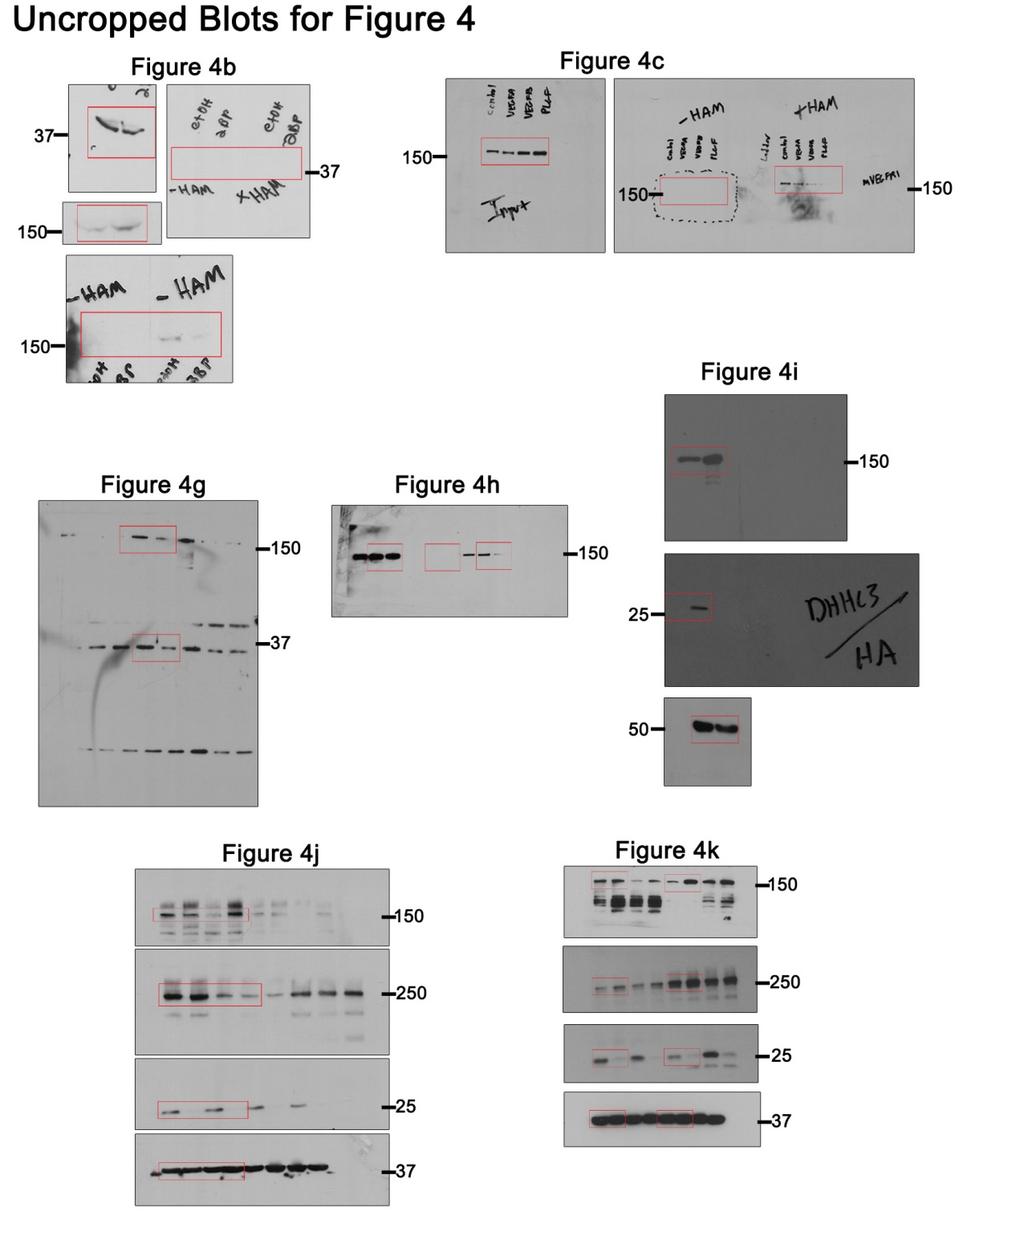
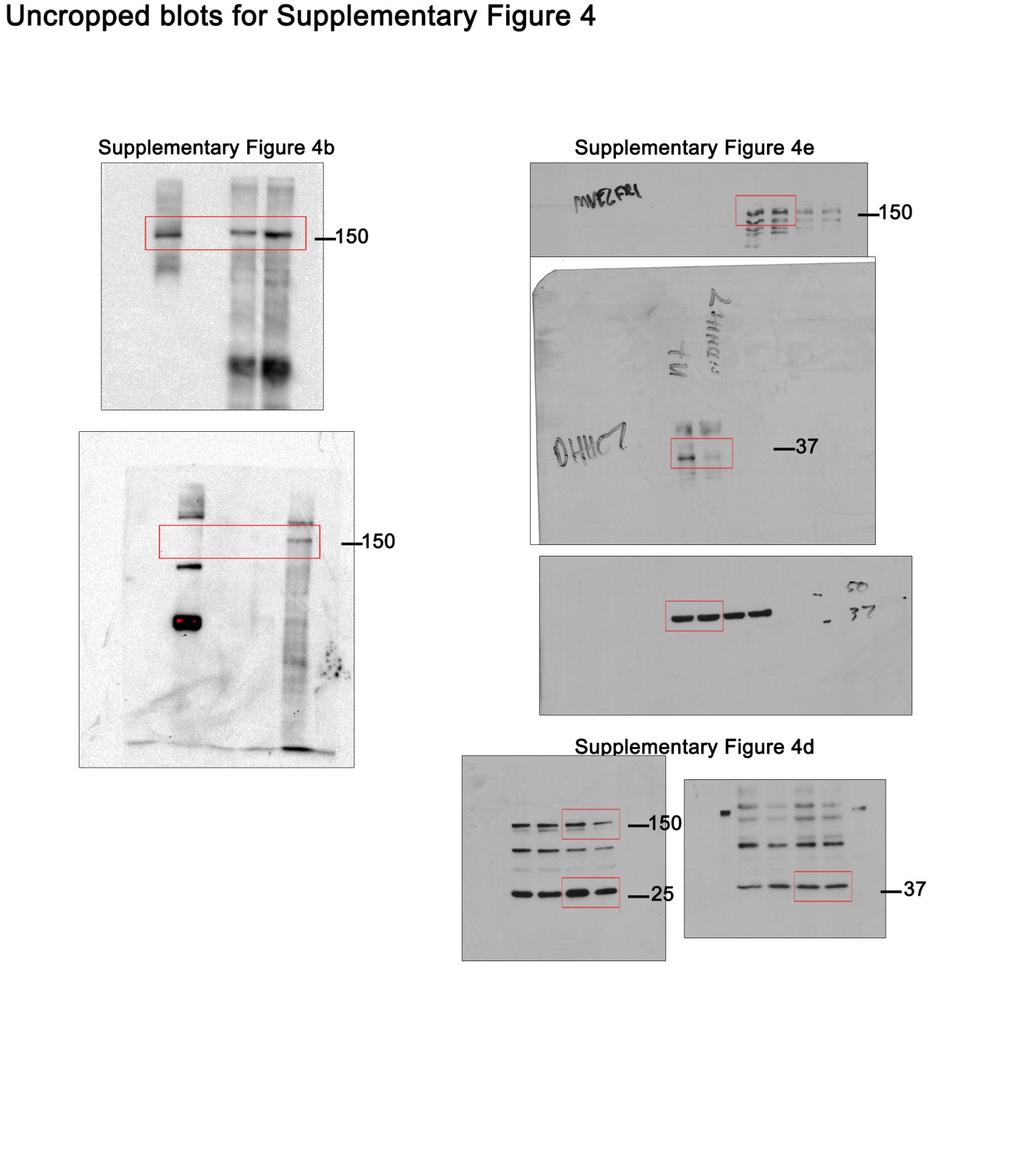
5 Supplementary Figure 4 (linked to Figure 4). Knockdown of the palmitoyl acetyl transferase DHHC3 reduces mvegfr1 levels in endothelial cells. (a) Acyl-biotin exchange workflow. B, biotin; PA, palmitic acid; NEM, N-ethylmaleimide; HAM, hydroxylamine. (b) Acyl-biotin exchange on immunoprecipitated VEGFR1 from HUVEC with indicated treatments, then immunoblot for biotin, stripped and reprobed for VEGFR1. HAM, hydroxylamine; 2 replicates. (c) DHHC3 immunofluorescence of HUVEC with indicated treatments for 24h; 2 replicates, scale bar: 20µm. (d-e) Immunoblot for mvegfr1 in HUVEC with 24h knockdown of DHHC3 (d) or DHHC7 (e); 3 replicates. 5
6 6
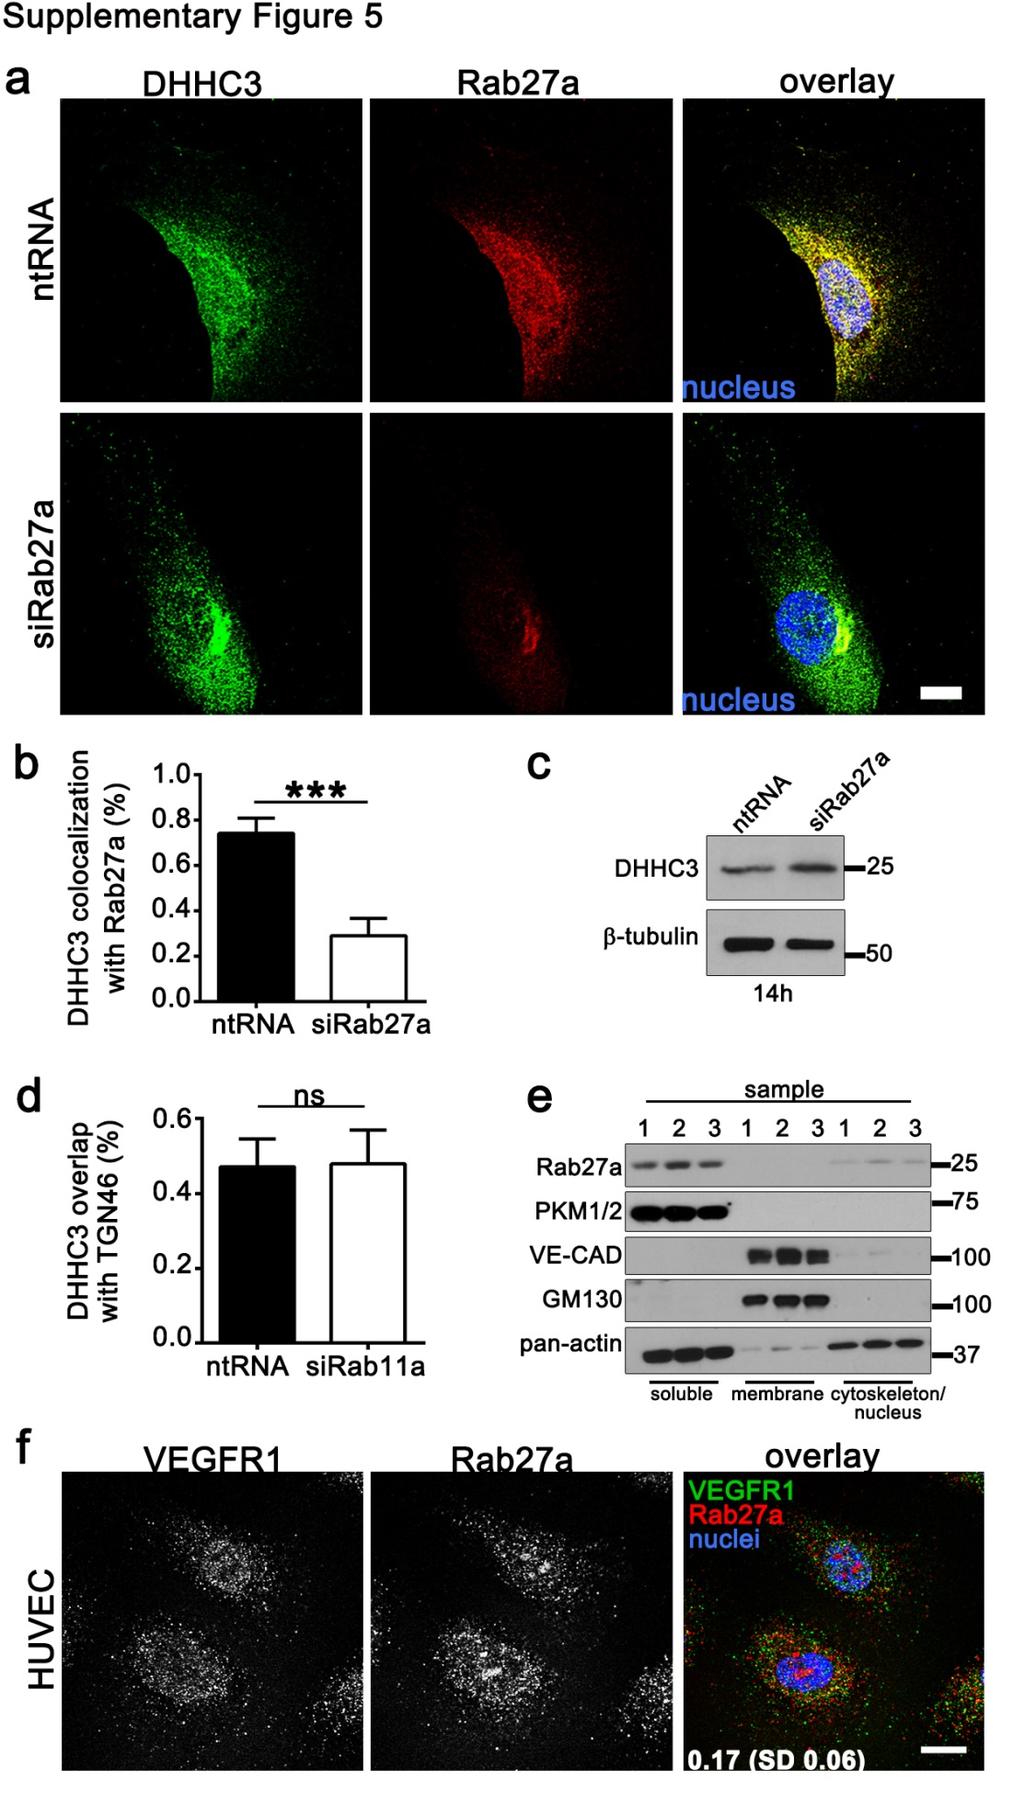
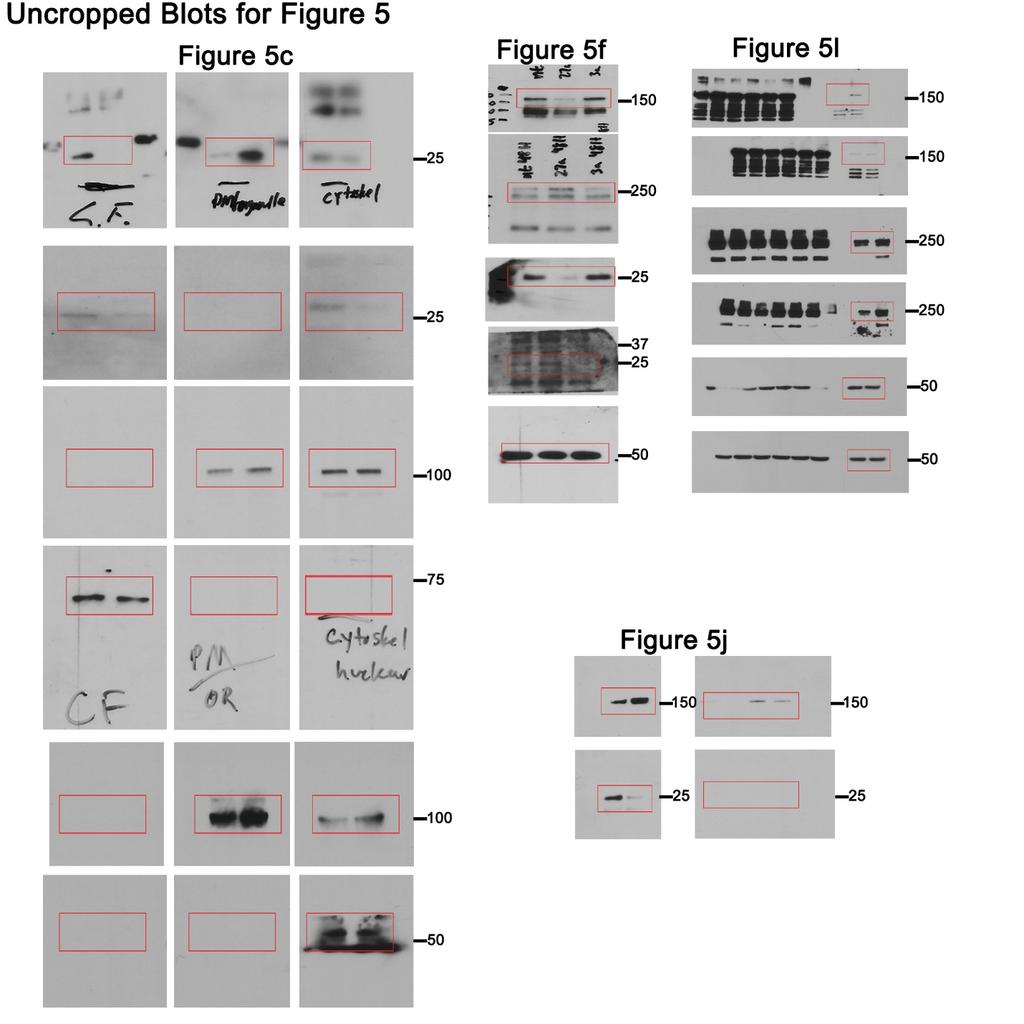
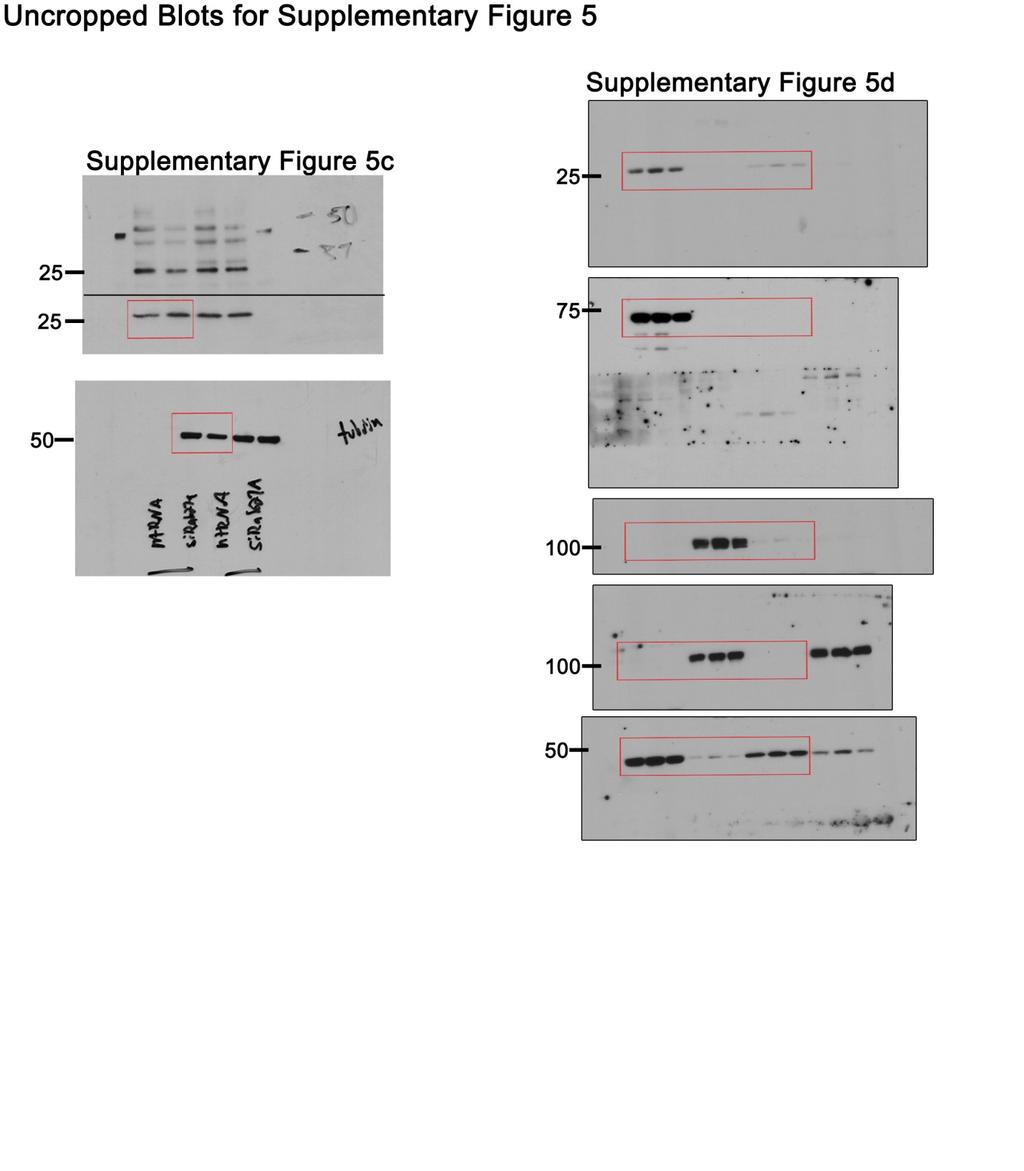
7 Supplementary Figure 5 (linked to Figure 5). Rab27a and DHHC3 but not VEGFR1 colocalize in endothelial cells. (a-b) (a) Immunofluorescence of DHHC3 and Rab27a in HUVEC with indicated treatments 24h post-knockdown, scale bar: 10µm. (b) Mander s Colocalization Coeffcient quantification of overlap. Shown are means +95% CI. (#cells: ntrna, n=31; sirab27a, n=20); 2 replicates. (c) Immunoblot of DHHC3 in HUVEC with indicated treatments. (d) Mander s Colocalization Coefficient quantification of DHHC3 and TGN46 (Golgi) overlap in HUVEC with indicated treatments. Shown are means + 95% CI. (#cells: ntrna, n=19; sirab11a, n=27); 2 replicates. (e) Subcellular fractionation and immunoblot of HUVEC from 3 different lots. Pyruvate kinase1/2 (PKM1/2), soluble marker; vascular-endothelial cadherin (VE-CAD), membrane and cytoskeletal marker; cis-golgi Marker 130 (GM130), membrane marker; pan actin, soluble (G-actin) and cytoskeletal (F-actin) marker. 2 replicates. (f) Immunofluorescence of VEGFR1 and Rab27a overlap quantified with Mander s Correlation Coefficient, +/- SD, scale bar 15µm. Statistics: Student s t-test with post-hoc Tukey s range test. ***, p 0.001; ns, not significant. 7
8 8
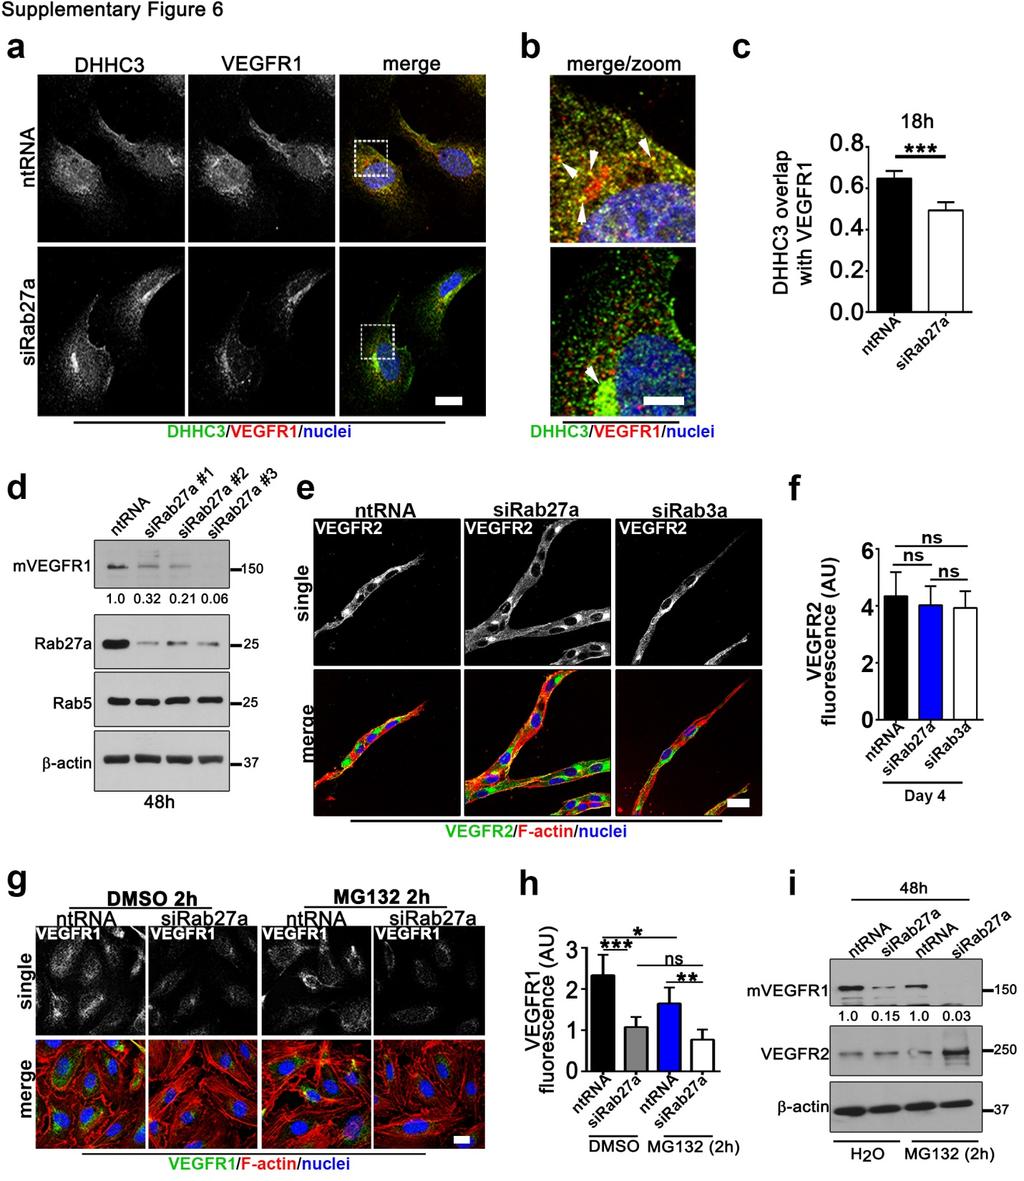
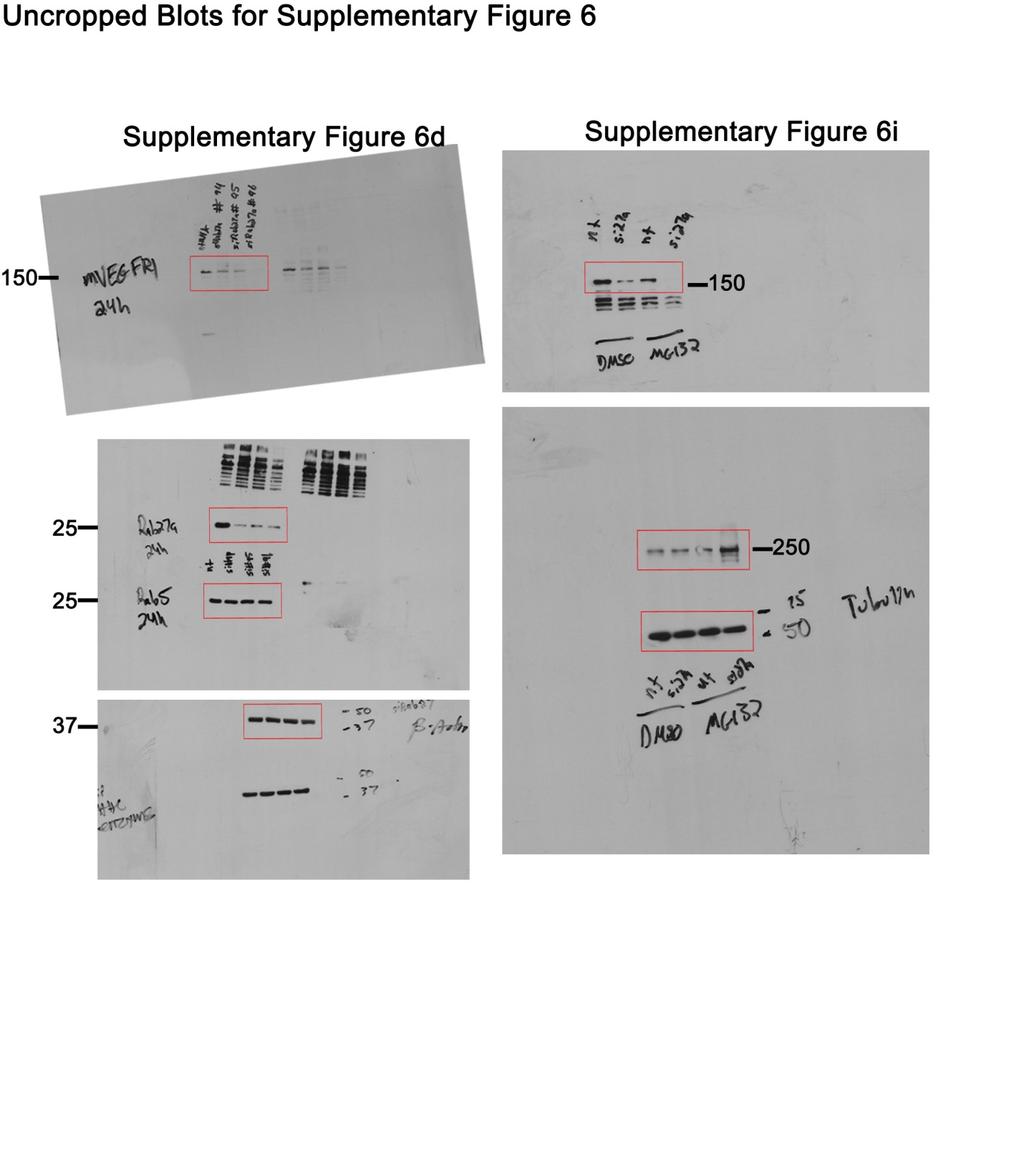
9 Supplementary Figure 6 (linked to Figure 5). Rab27a regulates steady-state mvegfr1 levels. (a-c) (a-b) Immunofluorescence of DHHC3 and VEGFR1 in HUVEC with indicated treatments, scale bars: 10µm (a) and 5µm (b). (c) Mander s Colocalization Coefficient quantification of fluorescence. (#cells: ntrna, n=33, sirab27a, n=40); 3 replicates. (d) Immunoblot of HUVEC with indicated treatments. Values are relative mvegr1 levels. (e-f) (e) VEGFR2 immunofluorescence and (f) quantification of fluorescence via integrated density of d4 HUVEC angiogenic sprouts with indicated treatments. Scale bar: 20µm, (#sprouts: ntrna, n=10; sirab27a, n=12; sirab3a, n=7); 3 replicates. (g-h) (g) VEGFR1 immunofluorescence of HUVEC 48h post KD and (h) quantification of fluorescence via integrated density, scale bar 15µm. (# cells: DMSO/ntRNA, n=14; MG132/ntRNA, n=18; DMSO/siRab27a, n=14; MG132/siRab27a, n=16); 2 replicates. (i) Immunoblot of HUVEC with indicated treatments. Values are relative mvegr1 levels; 2 replicates. Statistics: Shown are means +95% CI. One-way ANOVA and pairwise comparison with post-hoc Tukey s range test. *, p 0.05; **, p 0.01; ***, p 0.001; ns, not significant. 9
 Quantification of sprouting from HUVEC with indicated treatments on indicated days. (n=10 beads/condition/time point); 3 replicates.")
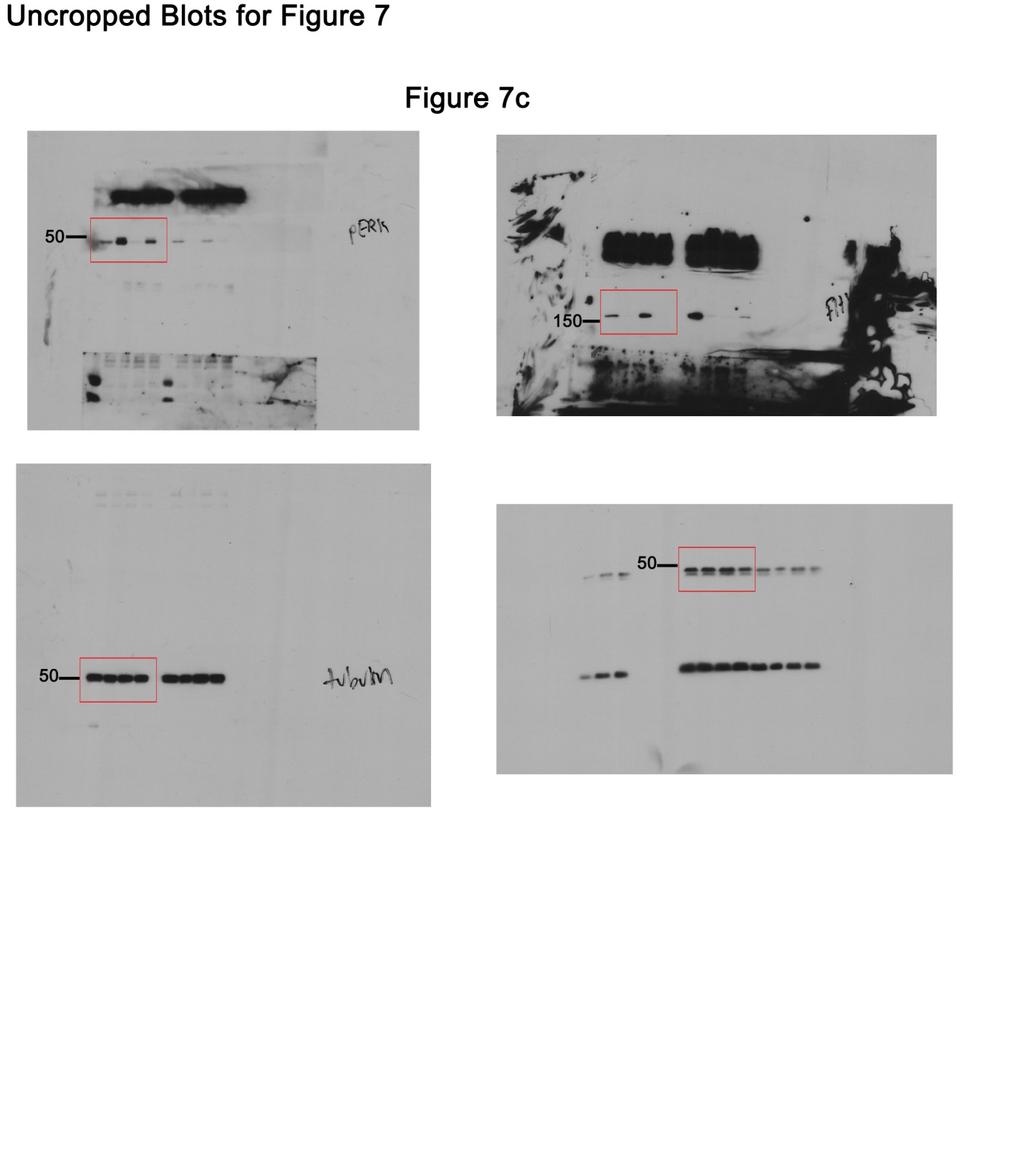
10 Supplementary Figure 7 (linked to Figures 6 and 7). Rab27a negatively regulates angiogenesis and increases HUVEC proliferation. (a-d) Quantification of sprouting from HUVEC with indicated treatments on indicated days. (n=10 beads/condition/time point); 3 replicates. (e) Immunoblot of HUVEC with indicated treatments and times; 2 replicates. (f) Immunoblot of HUVEC with indicated treatments and times; 3 replicates. (g) Quantification of phish3 (mitotic) nuclei of HUVEC 48h post-knockdown (#nuclei: ntrna, n=682; sirab27a, n=549); 2 replicates. Statistics: (a-d) Shown are means +95% CI. One-way ANOVA and pairwise comparison with post-hoc Tukey s range test. (g) Shown are means +SEM, Student s t- test. **, p 0.01; ns, not significant. 10
11 11
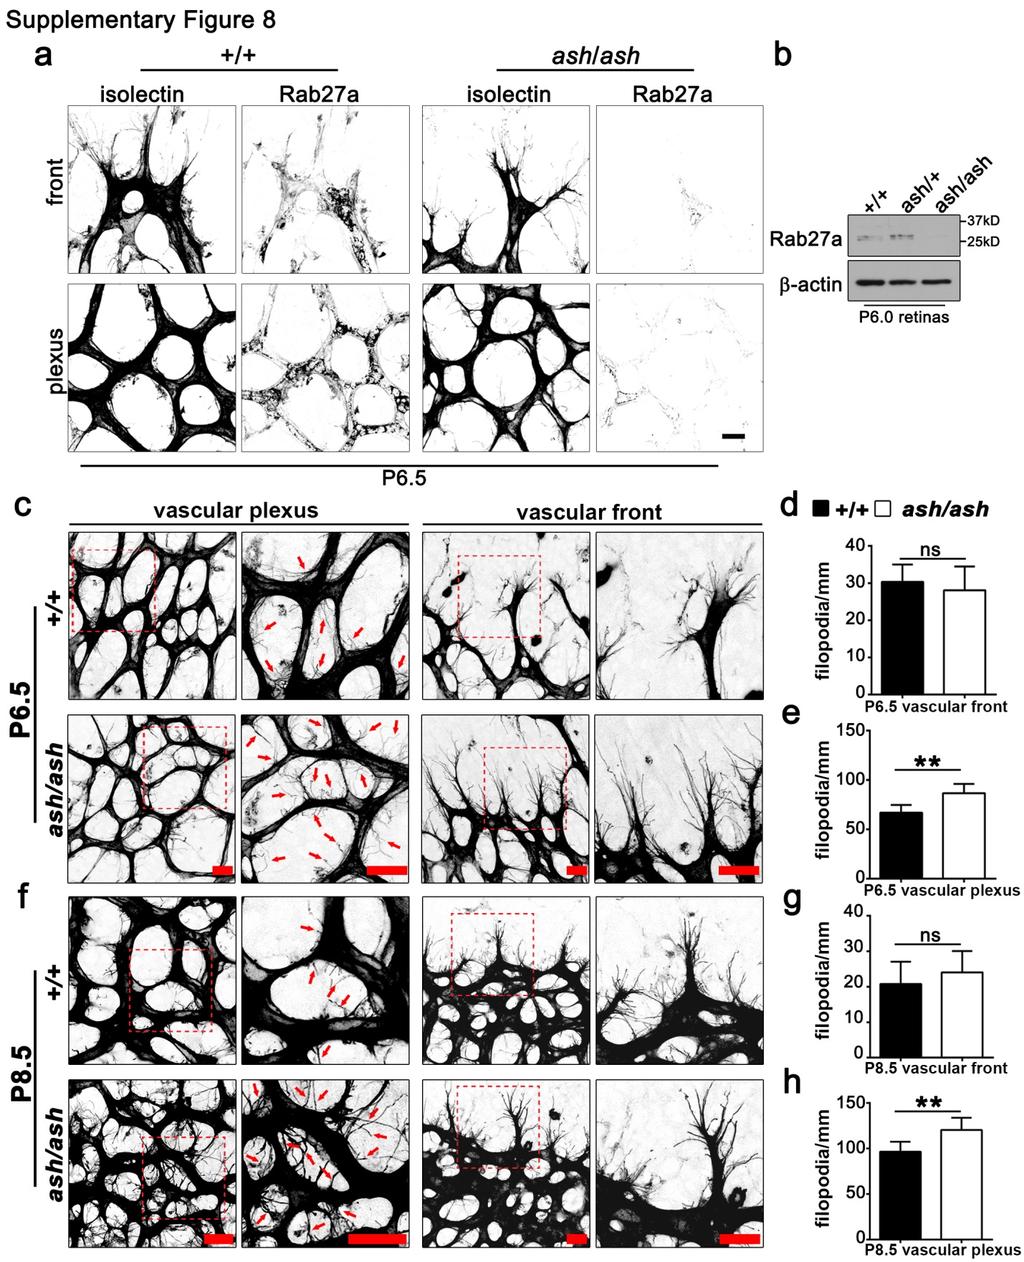
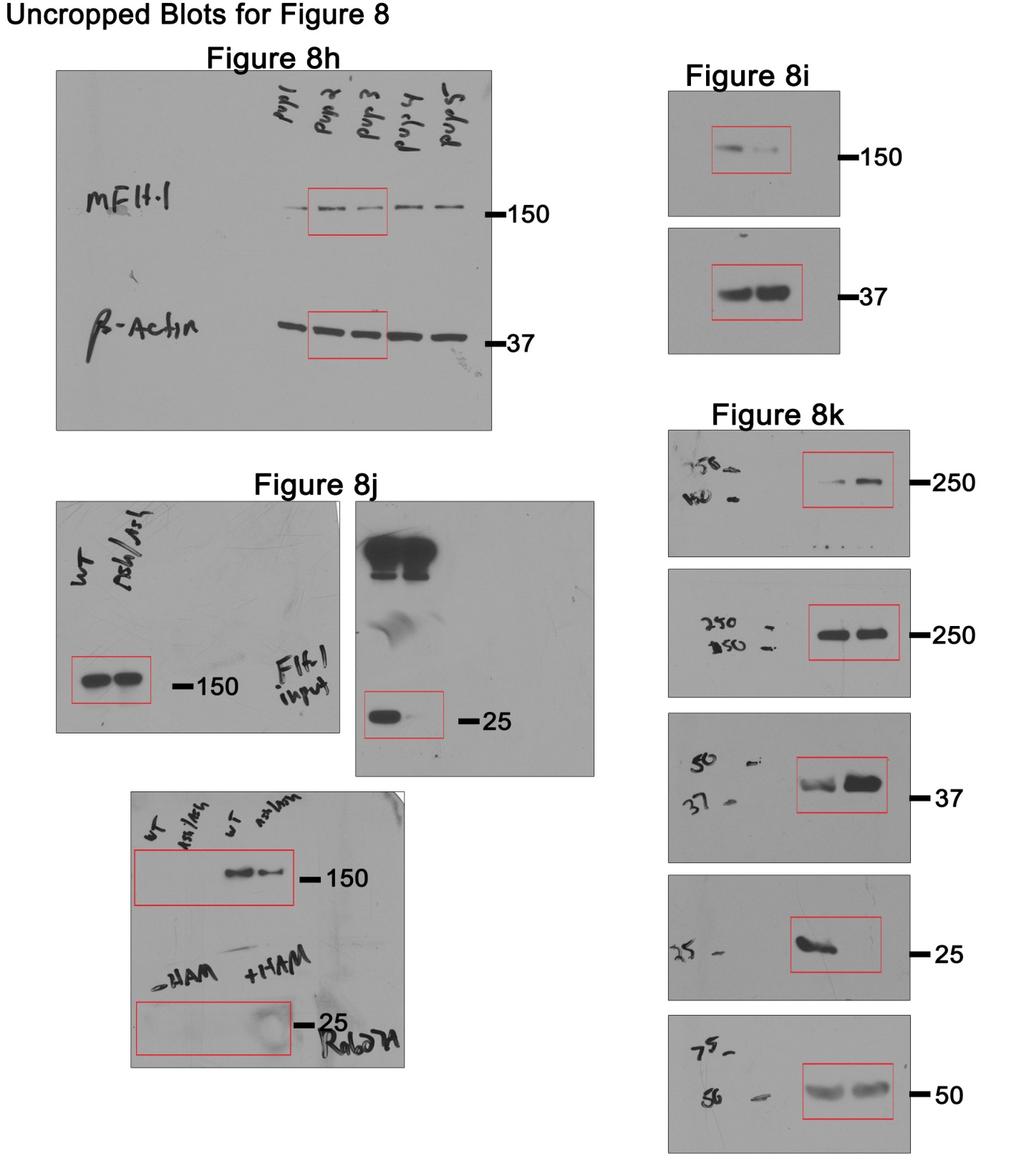
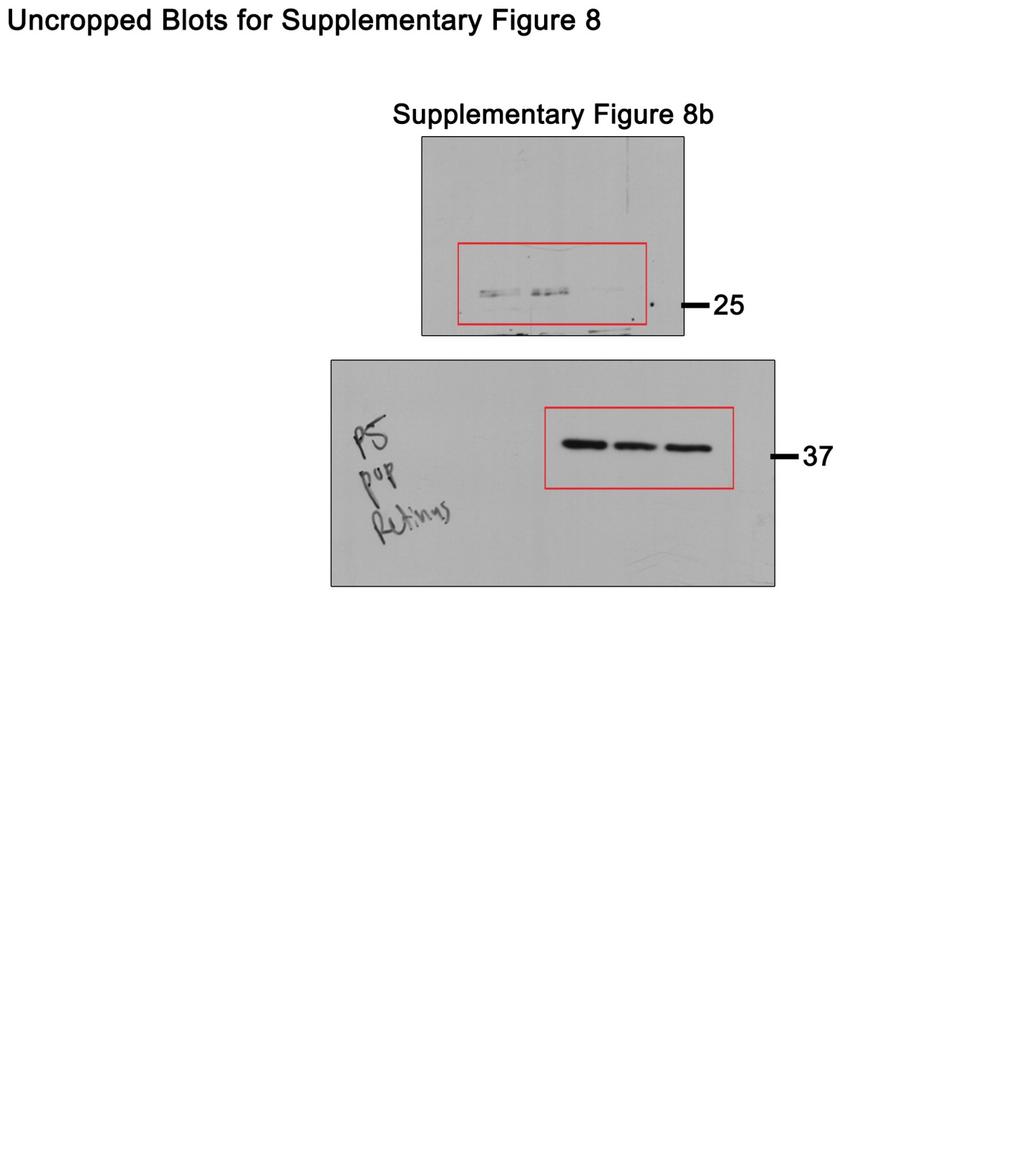
12 Supplementary Figure 8 (linked to Figure 8). Loss of Rab27a protein in ash/ash mice leads to hyperactive retinal blood vessels. (a) Immunofluorescence of P6.5 mouse retinas for vessels (isolectin) and Rab27a of indicated genotypes; 3 replicates, scale bar: 15µm. (b) Immunoblot of Rab27a from P6.0 retinal lysates of indicated genotypes; 4 replicates. (c-e) (c) Immunofluorescence of P6.5 retinal vessels with indicated genotypes. Filopodia were quantified at the vascular front (d) and within the plexus (e). Red boxes, higher magnification to right. Arrows, filopodia. (#retinas: 2 independent litters: +/+, n=7; ash/ash, n=6). (f-h) (f) Immunofluorescence of P8.5 retinal vessels with indicated genotypes. Filopodia were quantified at the vascular front (g) and within the plexus (h). Red boxes, higher magnification to right. Arrows, filopodia. (#retinas: 2 independent litters: +/+, n=6; ash/ash, n=4). Statistics: Shown are means +95% CI. Students t-test. *, p 0.05; **, p 0.01; ***, p 0.001; ns, not significant. Scale bars, 25µm. 12
 (a) Immunofluorescence of filopodia in P8.")
13 Supplementary Figure 9 (linked to Figure 8). Retinal vessels from ash/ash mice have longer plexus filopodia and model for regulation of mvegfr1 stability. (a-c) (a) Immunofluorescence of filopodia in P8.5 retinal vessels of indicated genotypes (left, low magnification plexus, scale bar, 25µm left column; middle, high magnification plexus; right, high magnification tip cells, scale bars 10µm, middle and right columns). (b-c) Quantification of filopodia length from vascular plexus (b) and vascular front (c). (#filopodia: plexus: +/+, n=396; ash/ash, n=827; front: +/+, n=175; ash/ash, n=220); 2 independent replicates. Statistics: Shown are means +95% CI. One-way ANOVA and pairwise comparison with post-hoc Tukey s range test. **, p 0.01; ns, not significant. 13
. Uncropped Western blots.")
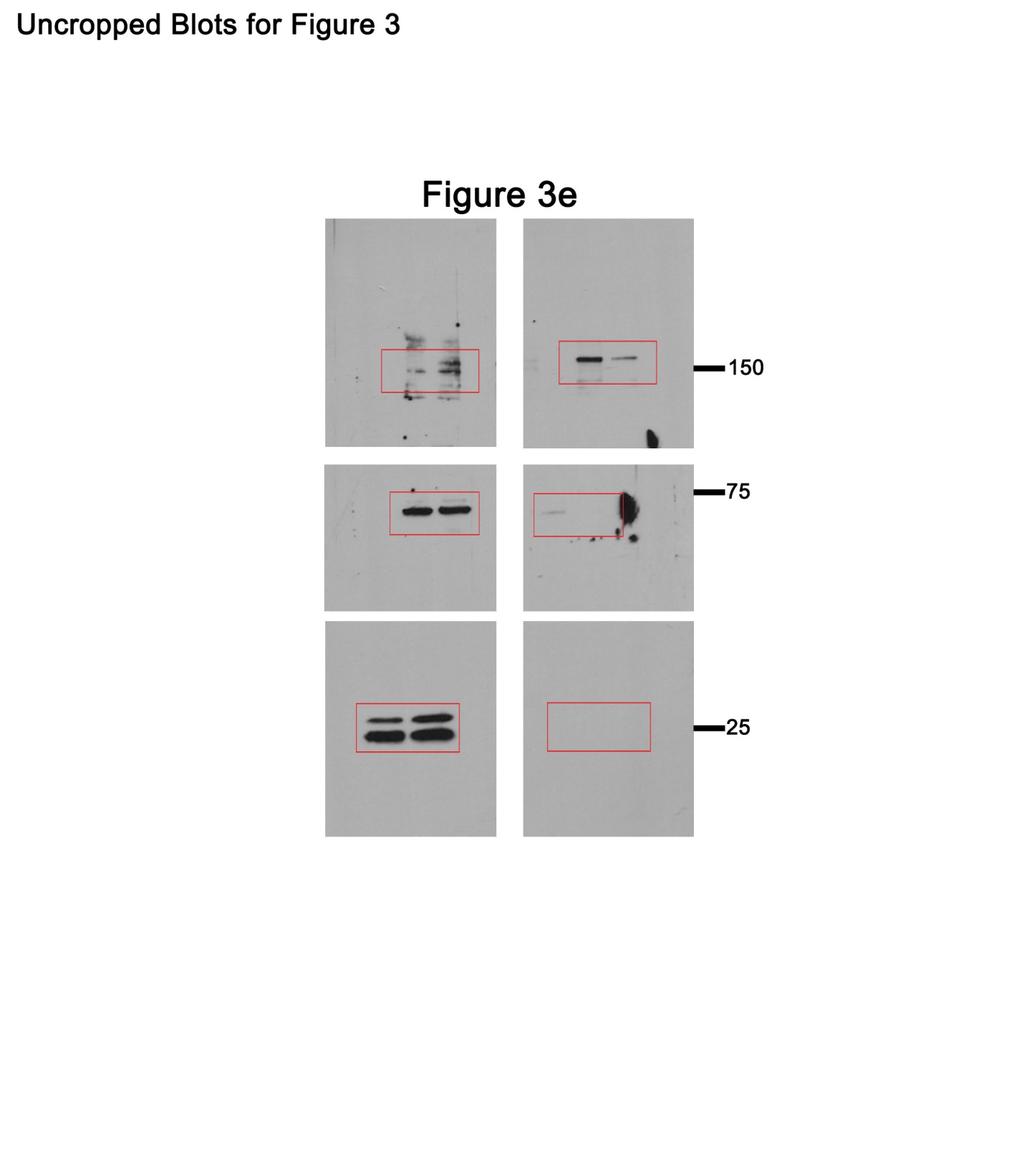
14 Supplementary Figure 10 (linked to all Figures). Uncropped Western blots. 14
15 15
16 16
17 17
18 18
19 19
20 20
21 21
22 22
23 23
24 24
25 25
26 26
27 27
28 Supplementary Table 1. List of antibodies used for this study. Antibody Company IB Titer IF Titer PRIMARY α-tubulin Sigma 1: β-actin CST 1: DHHC3 Abcam 1: DHHC3 SCBT 1:2000 1:750 Erk1/2 (4695) CST 1: p-erk1/2 (4370) CST 1:1000 1:500 GM130 (ab-52649) Abcam 1: HA CST 1: P-Histone H3 (9701) CST 1:1000 1:1000 LAMP1 Abcam - 1:2000 LYPLA1 (APT1) Abcam 1: PKM1/2 (3186S) CST 1: P-VEGFR2 Y1175 (2478) CST 1:500 - PECAM Abcam - 1:500 Rab3a (MN1250) Thermo Scientific 1:750 - Rab4/14 (sc ) SCBT 1: Rab5 SCBT 1:500 - Rab11 (sc ) SCBT 1:2000 1:750 Rab27a (sc-81914) SCBT 1:1000 1:500 Streptavidin HRP (N100) Life Technologies 1: TGN46 Abcam - 1:2000 VE-Cadherin (sc-28644) SCBT 1: VEGFR1 (ab-32152) Abcam 1:2000 1:500* Alexa-fluor 488-VEGFR1 (ab ) Abcam - 1:50 VEGFR2 (2479) CST 1:5000 1:1000 ZDHHC21 (ab ) Abcam 1:750 - SECONDARY Anti-mouse IgG, HRP-linked (secondary) CST 1: Anti-rabbit IgG, HRP-linked (secondary) CST 1: Goat anti-mouse 488 Life Technologies - 1:1000 Goat anti-mouse 594 Life Technologies - 1:1000 Goat anti-rabbit 488 Life Technologies - 1:1000 Goat anti-rabbit 594 Life Technologies - 1:1000 *A titer of 1:200 was used for Flt-1 staining in the retina Abbreviations: CST= Cell Signaling Technologies SCBT= Santa Cruz Biotechnology 28
29 Supplementary Table 2. List of Inhibitors used for this study. Inhibitors Concentration Company Target 2-Bromohexadecanoic Acid (2-BH) 20 µm in EtOH Sigma Palmitoyl-acetyl transferases Chloroquine (CHQ) 10 µg/ml in H2O Sigma Lysosome Cycloheximide (CHX) 500 µg/ml in H2O Sigma Ribosome Dynasore 1µM in DMSO Santa Cruz Dynamin MG132 5µM in DMSO Calbiochem Proteasome Palmostatin B (Pal-B) 10 µm in DMSO Calbiochem Acyl-protein thioesterases 29
30 Supplementary Table 3. List of small interfering RNA knockdown probes used for this study. sirnas Catalogue # Company Pmol/10 6 Target species cells APT1 S20410 ThermoFisher 100 Human DHHC3 S27899 ThermoFisher 125 Human DHHC3 #2 S27900 ThermoFisher 125 Human DHHC7 S31109 ThermoFisher 125 Human Flt-1 SI Qiagen 75 Human Non-targeting SI Qiagen varies none Rab4a S11677 ThermoFisher 100 Human Rab11a S16702 ThermoFisher 100 Human Rab27a#1* SI Qiagen 100 Human Rab27a#2** S11695 ThermoFisher - Human/mouse Rab27a # 3 S11494 ThermoFisher 100 Human/mouse *Used for all human cell work in 2D and 3D. **Used for mouse aortic ring assay (200pmol) and to validate effects of Rab27a-1 probe. Used at 100pmol/10 6 cell for Rab27a knockdown validation in Supplementary Figure 6d. 30
Supplementary Figure 1. Spatial distribution of LRP5 and β-catenin in intact cardiomyocytes. (a) and (b) Immunofluorescence staining of endogenous
 and (b) Immunofluorescence staining of endogenous") Supplementary Figure 1. Spatial distribution of LRP5 and β-catenin in intact cardiomyocytes. (a) and (b) Immunofluorescence staining of endogenous LRP5 in intact adult mouse ventricular myocytes (AMVMs)
Supplementary Figure 1. Spatial distribution of LRP5 and β-catenin in intact cardiomyocytes. (a) and (b) Immunofluorescence staining of endogenous LRP5 in intact adult mouse ventricular myocytes (AMVMs)
Supplementary Figure 1: si-craf but not si-braf sensitizes tumor cells to radiation.
 Supplementary Figure 1: si-craf but not si-braf sensitizes tumor cells to radiation. (a) Embryonic fibroblasts isolated from wildtype (WT), BRAF -/-, or CRAF -/- mice were irradiated (6 Gy) and DNA damage
Supplementary Materials for
 www.sciencesignaling.org/cgi/content/full/8/385/ra70/dc1 Supplementary Materials for The interaction of heparan sulfate proteoglycans with endothelial transglutaminase-2 limits VEGF 165 -induced angiogenesis
(a) Significant biological processes (upper panel) and disease biomarkers (lower panel)
 Significant biological processes (upper panel) and disease biomarkers (lower panel)") Supplementary Figure 1. Functional enrichment analyses of secretomic proteins. (a) Significant biological processes (upper panel) and disease biomarkers (lower panel) 2 involved by hrab37-mediated secretory
Supplementary Figure 1. Functional enrichment analyses of secretomic proteins. (a) Significant biological processes (upper panel) and disease biomarkers (lower panel) 2 involved by hrab37-mediated secretory
Supplemental Materials. STK16 regulates actin dynamics to control Golgi organization and cell cycle
 Supplemental Materials STK16 regulates actin dynamics to control Golgi organization and cell cycle Juanjuan Liu 1,2,3, Xingxing Yang 1,3, Binhua Li 1, Junjun Wang 1,2, Wenchao Wang 1, Jing Liu 1, Qingsong
Supplementary Figure 1: Hsp60 / IEC mice are embryonically lethal (A) Light microscopic pictures show mouse embryos at developmental stage E12.
 Light microscopic pictures show mouse embryos at developmental stage E12.") Supplementary Figure 1: Hsp60 / IEC mice are embryonically lethal (A) Light microscopic pictures show mouse embryos at developmental stage E12.5 and E13.5 prepared from uteri of dams and subsequently genotyped.
Supplementary Figure 1: Hsp60 / IEC mice are embryonically lethal (A) Light microscopic pictures show mouse embryos at developmental stage E12.5 and E13.5 prepared from uteri of dams and subsequently genotyped.
Tumor suppressor Spred2 interaction with LC3 promotes autophagosome maturation and induces autophagy-dependent cell death
 www.impactjournals.com/oncotarget/ Oncotarget, Supplementary Materials 2016 Tumor suppressor Spred2 interaction with LC3 promotes autophagosome maturation and induces autophagy-dependent cell death Supplementary
Supplementary Materials for
 www.sciencesignaling.org/cgi/content/full/6/283/ra57/dc1 Supplementary Materials for JNK3 Couples the Neuronal Stress Response to Inhibition of Secretory Trafficking Guang Yang,* Xun Zhou, Jingyan Zhu,
Supplementary Figure 1. EC-specific Deletion of Snail1 Does Not Affect EC Apoptosis. (a,b) Cryo-sections of WT (a) and Snail1 LOF (b) embryos at
 Cryo-sections of WT (a) and Snail1 LOF (b) embryos at") Supplementary Figure 1. EC-specific Deletion of Snail1 Does Not Affect EC Apoptosis. (a,b) Cryo-sections of WT (a) and Snail1 LOF (b) embryos at E10.5 were double-stained for TUNEL (red) and PECAM-1 (green).
Supplementary Figure 1. EC-specific Deletion of Snail1 Does Not Affect EC Apoptosis. (a,b) Cryo-sections of WT (a) and Snail1 LOF (b) embryos at E10.5 were double-stained for TUNEL (red) and PECAM-1 (green).
Supplemental Information
 Supplemental Information Tobacco-specific Carcinogen Induces DNA Methyltransferases 1 Accumulation through AKT/GSK3β/βTrCP/hnRNP-U in Mice and Lung Cancer patients Ruo-Kai Lin, 1 Yi-Shuan Hsieh, 2 Pinpin
Supplementary Table 1. Characterization of HNSCC PDX models established at MSKCC
 Supplementary Table 1. Characterization of HNSCC PDX models established at MSKCC Supplementary Table 2. Drug content and loading efficiency estimated with F-NMR and UV- Vis Supplementary Table 3. Complete
Supplemental Figure 1. Western blot analysis indicated that MIF was detected in the fractions of
 Supplemental Figure Legends Supplemental Figure 1. Western blot analysis indicated that was detected in the fractions of plasma membrane and cytosol but not in nuclear fraction isolated from Pkd1 null
Name Animal source Vendor Cat # Dilutions
 Supplementary data Table S1. Primary and Secondary antibody sources Devi et al, TXNIP in mitophagy A. Primary Antibodies Name Animal source Vendor Cat # Dilutions 1. TXNIP mouse MBL KO205-2 1:2000 (WB)
Supplementary Fig. 1. GPRC5A post-transcriptionally down-regulates EGFR expression. (a) Plot of the changes in steady state mrna levels versus
 Plot of the changes in steady state mrna levels versus") Supplementary Fig. 1. GPRC5A post-transcriptionally down-regulates EGFR expression. (a) Plot of the changes in steady state mrna levels versus changes in corresponding proteins between wild type and Gprc5a-/-
Supplementary Fig. 1. GPRC5A post-transcriptionally down-regulates EGFR expression. (a) Plot of the changes in steady state mrna levels versus changes in corresponding proteins between wild type and Gprc5a-/-
Supplementary Figure 1.TRIM33 binds β-catenin in the nucleus. a & b, Co-IP of endogenous TRIM33 with β-catenin in HT-29 cells (a) and HEK 293T cells
 and HEK 293T cells") Supplementary Figure 1.TRIM33 binds β-catenin in the nucleus. a & b, Co-IP of endogenous TRIM33 with β-catenin in HT-29 cells (a) and HEK 293T cells (b). TRIM33 was immunoprecipitated, and the amount of
Supplementary Figure 1.TRIM33 binds β-catenin in the nucleus. a & b, Co-IP of endogenous TRIM33 with β-catenin in HT-29 cells (a) and HEK 293T cells (b). TRIM33 was immunoprecipitated, and the amount of
p = formed with HCI-001 p = Relative # of blood vessels that formed with HCI-002 Control Bevacizumab + 17AAG Bevacizumab 17AAG
 A.. Relative # of ECs associated with HCI-001 1.4 1.2 1.0 0.8 0.6 0.4 0.2 0.0 ol b p < 0.001 Relative # of blood vessels that formed with HCI-001 1.4 1.2 1.0 0.8 0.6 0.4 0.2 0.0 l b p = 0.002 Control IHC:
Supplementary Figure 1. Rab27a-KD inhibits speed and persistence of HEp3 cells migrating in the chick CAM. (a) Western blot analysis of Rab27a
 Western blot analysis of Rab27a") Supplementary Figure 1. Rab27a-KD inhibits speed and persistence of HEp3 cells migrating in the chick CAM. (a) Western blot analysis of Rab27a expression in GFP-expressing HEp3 cells. (b) Representative
Supplementary Figure 1. Rab27a-KD inhibits speed and persistence of HEp3 cells migrating in the chick CAM. (a) Western blot analysis of Rab27a expression in GFP-expressing HEp3 cells. (b) Representative
Supplementary Figure 1: Uncropped western blots for Figure 1B. Uncropped blots shown in Figure 1B, showing that NOTCH intracellular domain (NICD) is
 is") Supplementary Figure 1: Uncropped western blots for Figure 1B. Uncropped blots shown in Figure 1B, showing that NOTCH intracellular domain (NICD) is increased with exposure of HUVEC to 1h FSS, and that
Supplementary Figure 1: Uncropped western blots for Figure 1B. Uncropped blots shown in Figure 1B, showing that NOTCH intracellular domain (NICD) is increased with exposure of HUVEC to 1h FSS, and that
Supplementary Figure 1. HOPX is hypermethylated in NPC. (a) Methylation levels of HOPX in Normal (n = 24) and NPC (n = 24) tissues from the
 Methylation levels of HOPX in Normal (n = 24) and NPC (n = 24) tissues from the") Supplementary Figure 1. HOPX is hypermethylated in NPC. (a) Methylation levels of HOPX in Normal (n = 24) and NPC (n = 24) tissues from the genome-wide methylation microarray data. Mean ± s.d.; Student
Supplementary Figure 1. HOPX is hypermethylated in NPC. (a) Methylation levels of HOPX in Normal (n = 24) and NPC (n = 24) tissues from the genome-wide methylation microarray data. Mean ± s.d.; Student
Supplementary Information Supplementary Fig. 1. Elevated Usp9x in melanoma and NRAS mutant melanoma cells are dependent on NRAS for 3D growth.
 Supplementary Information Supplementary Fig. 1. Elevated Usp9x in melanoma and NRAS mutant melanoma cells are dependent on NRAS for 3D growth. a. Immunoblot for Usp9x protein in NRAS mutant melanoma cells
SUPPLEMENTARY FIGURES
 SUPPLEMENTARY FIGURES Supplementary Figure 1. (A) Left, western blot analysis of ISGylated proteins in Jurkat T cells treated with 1000U ml -1 IFN for 16h (IFN) or left untreated (CONT); right, western
Disrupting GluA2-GAPDH Interaction Affects Axon and Dendrite Development
 Disrupting GluA2-GAPDH Interaction Affects Axon and Dendrite Development 1 Frankie Hang Fung Lee, 1 Ping Su, 1 Yu Feng Xie, 1 Kyle Ethan Wang, 2 Qi Wan and 1,3 Fang Liu 1 Campbell Research Institute, Centre
Figure S1. Western blot analysis of clathrin RNA interference in human DCs Human immature DCs were transfected with 100 nm Clathrin SMARTpool or
 Figure S1. Western blot analysis of clathrin RNA interference in human DCs Human immature DCs were transfected with 100 nm Clathrin SMARTpool or control nontargeting sirnas. At 90 hr after transfection,
WT MSD MPS-IIIA. Lysosomal ph
 7 6 Lysosomal ph 5 4 3 2 1 Supplementary figure S1. Lysosomal ph was measure in, and MPSIIIA MEFs using a Lysosensor yellow/blue-dextran (Molecular Probes) as a lysosomal ph indicator (see methods). P
Supplementary Materials for. c-abl Activation Plays a Role in α-synucleinopathy Induced Neurodegeneration
 Supplementary Materials for c-abl Activation Plays a Role in α-synucleinopathy Induced Neurodegeneration Saurav Brahmachari, Preston Ge, Su Hyun Lee, Donghoon Kim, Senthilkumar S. Karuppagounder, Manoj
TRAF6 ubiquitinates TGFβ type I receptor to promote its cleavage and nuclear translocation in cancer
 Supplementary Information TRAF6 ubiquitinates TGFβ type I receptor to promote its cleavage and nuclear translocation in cancer Yabing Mu, Reshma Sundar, Noopur Thakur, Maria Ekman, Shyam Kumar Gudey, Mariya
Supplementary fig. 1. Crystals induce necroptosis does not involve caspases, TNF receptor or NLRP3. A. Mouse tubular epithelial cells were pretreated
 Supplementary fig. 1. Crystals induce necroptosis does not involve caspases, TNF receptor or NLRP3. A. Mouse tubular epithelial cells were pretreated with zvad-fmk (10µM) and exposed to calcium oxalate
Supplementary. limb. bars
 Figure 1. CD163 -/- mice exhibit a similar phenotype ass WT mice in the absence of ischemic injury. a, Laser Doppler analysiss with perfusion quantitation at baseline (n= =10 per group). b, Immunostaining
Project report October 2012 March 2013 CRF fellow: Principal Investigator: Project title:
 Project report October 2012 March 2013 CRF fellow: Gennaro Napolitano Principal Investigator: Sergio Daniel Catz Project title: Small molecule regulators of vesicular trafficking to enhance lysosomal exocytosis
MTC-TT and TPC-1 cell lines were cultured in RPMI medium (Gibco, Breda, The Netherlands)
") Supplemental data Materials and Methods Cell culture MTC-TT and TPC-1 cell lines were cultured in RPMI medium (Gibco, Breda, The Netherlands) supplemented with 15% or 10% (for TPC-1) fetal bovine serum
Supplemental data Materials and Methods Cell culture MTC-TT and TPC-1 cell lines were cultured in RPMI medium (Gibco, Breda, The Netherlands) supplemented with 15% or 10% (for TPC-1) fetal bovine serum
Supplementary Figure S1: Defective heterochromatin repair in HGPS progeroid cells
 Supplementary Figure S1: Defective heterochromatin repair in HGPS progeroid cells Immunofluorescence staining of H3K9me3 and 53BP1 in PH and HGADFN003 (HG003) cells at 24 h after γ-irradiation. Scale bar,
Supplemental Figures:
 Supplemental Figures: Figure 1: Intracellular distribution of VWF by electron microscopy in human endothelial cells. a) Immunogold labeling of LC3 demonstrating an LC3-positive autophagosome (white arrow)
Loss of RhoA promotes skin tumor formation. Supplementary Figure 1. Loss of RhoA does not impair F-actin organization.
 Supplementary Figure Legends Supplementary Figure 1. Loss of RhoA does not impair F-actin organization. a. Representative IF images of F-actin staining of big and small control (left) and RhoA ko tumors
Supplementary Figure 1. Characterization of NMuMG-ErbB2 and NIC breast cancer cells expressing shrnas targeting LPP. NMuMG-ErbB2 cells (a) and NIC
 and NIC") Supplementary Figure 1. Characterization of NMuMG-ErbB2 and NIC breast cancer cells expressing shrnas targeting LPP. NMuMG-ErbB2 cells (a) and NIC cells (b) were engineered to stably express either a LucA-shRNA
Supplementary Figure 1. Characterization of NMuMG-ErbB2 and NIC breast cancer cells expressing shrnas targeting LPP. NMuMG-ErbB2 cells (a) and NIC cells (b) were engineered to stably express either a LucA-shRNA
Supplementary Figure 1. Confocal immunofluorescence showing mitochondrial translocation of Drp1. Cardiomyocytes treated with H 2 O 2 were prestained
 Supplementary Figure 1. Confocal immunofluorescence showing mitochondrial translocation of Drp1. Cardiomyocytes treated with H 2 O 2 were prestained with MitoTracker (red), then were immunostained with
SUPPLEMENTARY INFORMATION
 DOI: 10.1038/ncb2988 Supplementary Figure 1 Kif7 L130P encodes a stable protein that does not localize to cilia tips. (a) Immunoblot with KIF7 antibody in cell lysates of wild-type, Kif7 L130P and Kif7
Downregulation of the small GTPase SAR1A: a key event underlying alcohol-induced Golgi fragmentation in hepatocytes
 Downregulation of the small GTPase SAR1A: a key event underlying alcohol-induced Golgi fragmentation in hepatocytes Armen Petrosyan 1*, Pi-Wan Cheng 1,3, Dahn L. Clemens 2,3 & Carol A. Casey 2,3 1 Department
Supplementary Figures
 Supplementary Figures Supplementary Figure 1 DOT1L regulates the expression of epithelial and mesenchymal markers. (a) The expression levels and cellular localizations of EMT markers were confirmed by
Supplementary Figure 1. Characterization of human carotid plaques. (a) Flash-frozen human plaques were separated into vulnerable (V) and stable (S),
 Flash-frozen human plaques were separated into vulnerable (V) and stable (S),") Supplementary Figure 1. Characterization of human carotid plaques. (a) Flash-frozen human plaques were separated into vulnerable (V) and stable (S), regions which were then quantified for mean fluorescence
Supplementary Figure 1. Characterization of human carotid plaques. (a) Flash-frozen human plaques were separated into vulnerable (V) and stable (S), regions which were then quantified for mean fluorescence
Type of file: PDF Title of file for HTML: Supplementary Information Description: Supplementary Figures and Supplementary Table.
 Type of file: PDF Title of file for HTML: Supplementary Information Description: Supplementary Figures and Supplementary Tale. Type of file: VI Title of file for HTML: Supplementary Movie 1 Description:
IP: anti-gfp VPS29-GFP. IP: anti-vps26. IP: anti-gfp - + +
 FAM21 Strump. WASH1 IP: anti- 1 2 3 4 5 6 FAM21 Strump. FKBP IP: anti-gfp VPS29- GFP GFP-FAM21 tail H H/P P H H/P P c FAM21 FKBP Strump. VPS29-GFP IP: anti-gfp 1 2 3 FKBP VPS VPS VPS VPS29 1 = VPS29-GFP
SUPPLEMENTARY INFORMATION
 doi:10.1038/nature12652 Supplementary Figure 1. PRDM16 interacts with endogenous EHMT1 in brown adipocytes. Immunoprecipitation of PRDM16 complex by flag antibody (M2) followed by Western blot analysis
(A) RT-PCR for components of the Shh/Gli pathway in normal fetus cell (MRC-5) and a
 RT-PCR for components of the Shh/Gli pathway in normal fetus cell (MRC-5) and a") Supplementary figure legends Supplementary Figure 1. Expression of Shh signaling components in a panel of gastric cancer. (A) RT-PCR for components of the Shh/Gli pathway in normal fetus cell (MRC-5) and
Supplementary figure legends Supplementary Figure 1. Expression of Shh signaling components in a panel of gastric cancer. (A) RT-PCR for components of the Shh/Gli pathway in normal fetus cell (MRC-5) and
Nature Neuroscience: doi: /nn Supplementary Figure 1. PICALM expression in brain capillary endothelium in human brain and in mouse brain.
 Supplementary Figure 1 PICALM expression in brain capillary endothelium in human brain and in mouse brain. a, Double immunostaining for PICALM (red, left) and lectin positive endothelial profiles (blue,
Supplementary Figure 1. Deletion of Smad3 prevents B16F10 melanoma invasion and metastasis in a mouse s.c. tumor model.
 A B16F1 s.c. Lung LN Distant lymph nodes Colon B B16F1 s.c. Supplementary Figure 1. Deletion of Smad3 prevents B16F1 melanoma invasion and metastasis in a mouse s.c. tumor model. Highly invasive growth
genome edited transient transfection, CMV promoter
 Supplementary Figure 1. In the absence of new protein translation, overexpressed caveolin-1-gfp is degraded faster than caveolin-1-gfp expressed from the endogenous caveolin 1 locus % loss of total caveolin-1-gfp
Supplementary Materials
 Supplementary Materials Figure S1. MTT Cell viability assay. To measure the cytotoxic potential of the oxidative treatment, the MTT [3-(4,5-dimethylthiazol- 2-yl)-2,5-diphenyl tetrazolium bromide] assay
hexahistidine tagged GRP78 devoid of the KDEL motif (GRP78-His) on SDS-PAGE. This
 on SDS-PAGE. This") SUPPLEMENTAL FIGURE LEGEND Fig. S1. Generation and characterization of. (A) Coomassie staining of soluble hexahistidine tagged GRP78 devoid of the KDEL motif (GRP78-His) on SDS-PAGE. This protein was expressed
SUPPLEMENTAL FIGURE LEGEND Fig. S1. Generation and characterization of. (A) Coomassie staining of soluble hexahistidine tagged GRP78 devoid of the KDEL motif (GRP78-His) on SDS-PAGE. This protein was expressed
Schwarz et al. Activity-Dependent Ubiquitination of GluA1 Mediates a Distinct AMPAR Endocytosis
 Schwarz et al Activity-Dependent Ubiquitination of GluA1 Mediates a Distinct AMPAR Endocytosis and Sorting Pathway Supplemental Data Supplemental Fie 1: AMPARs undergo activity-mediated ubiquitination
Supplementary Figure 1
 Supplementary Figure 1 Supplementary Figure 1. Neither the activation nor suppression of the MAPK pathway affects the ASK1/Vif interaction. (a, b) HEK293 cells were cotransfected with plasmids encoding
SUPPLEMENTARY FIGURES
 SUPPLEMENTARY FIGURES 1 Supplementary Figure 1, Adult hippocampal QNPs and TAPs uniformly express REST a-b) Confocal images of adult hippocampal mouse sections showing GFAP (green), Sox2 (red), and REST
CD31 5'-AGA GAC GGT CTT GTC GCA GT-3' 5 ' -TAC TGG GCT TCG AGA GCA GT-3'
 Table S1. The primer sets used for real-time RT-PCR analysis. Gene Forward Reverse VEGF PDGFB TGF-β MCP-1 5'-GTT GCA GCA TGA ATC TGA GG-3' 5'-GGA GAC TCT TCG AGG AGC ACT T-3' 5'-GAA TCA GGC ATC GAG AGA
Supplementary information
 Supplementary information Exosomes mediate the cell-to-cell transmission of interferon alpha-induced antiviral activity Jianhua Li, Kuancheng Liu, Yang Liu, Yan Xu, Fei Zhang, Huijuan Yang, Jiangxia Liu,
El Azzouzi et al., http ://www.jcb.org /cgi /content /full /jcb /DC1
 Supplemental material JCB El Azzouzi et al., http ://www.jcb.org /cgi /content /full /jcb.201510043 /DC1 THE JOURNAL OF CELL BIOLOGY Figure S1. Acquisition of -phluorin correlates negatively with podosome
Supplementary Materials. for Garmy-Susini, et al, Integrin 4 1 signaling is required for lymphangiogenesis and tumor metastasis
 Supplementary Materials for Garmy-Susini, et al, Integrin 4 1 signaling is required for lymphangiogenesis and tumor metastasis 1 Supplementary Figure Legends Supplementary Figure 1: Integrin expression
GPR120 *** * * Liver BAT iwat ewat mwat Ileum Colon. UCP1 mrna ***
 a GPR120 GPR120 mrna/ppia mrna Arbitrary Units 150 100 50 Liver BAT iwat ewat mwat Ileum Colon b UCP1 mrna Fold induction 20 15 10 5 - camp camp SB202190 - - - H89 - - - - - GW7647 Supplementary Figure
Supplementary Figure 1. Prevalence of U539C and G540A nucleotide and E172K amino acid substitutions among H9N2 viruses. Full-length H9N2 NS
 Supplementary Figure 1. Prevalence of U539C and G540A nucleotide and E172K amino acid substitutions among H9N2 viruses. Full-length H9N2 NS nucleotide sequences (a, b) or amino acid sequences (c) from
Supplementary Figure 1. Effect of cellular glycolysis on tumor cell exosome secretion. A549 cells were cultured in medium containing different
 Supplementary Figure 1. Effect of cellular glycolysis on tumor cell exosome secretion. A549 cells were cultured in medium containing different concentration of glucose (a) or treated the inhibitor of glycolysis
SUPPLEMENTARY INFORMATION
 DOI:.38/ncb3399 a b c d FSP DAPI 5mm mm 5mm 5mm e Correspond to melanoma in-situ Figure a DCT FSP- f MITF mm mm MlanaA melanoma in-situ DCT 5mm FSP- mm mm mm mm mm g melanoma in-situ MITF MlanaA mm mm
Supplementary Figure 1. PAQR3 knockdown inhibits SREBP-2 processing in CHO-7 cells CHO-7 cells were transfected with control sirna or a sirna
 Supplementary Figure 1. PAQR3 knockdown inhibits SREBP-2 processing in CHO-7 cells CHO-7 cells were transfected with control sirna or a sirna targeted for hamster PAQR3. At 24 h after the transfection,
293T cells were transfected with indicated expression vectors and the whole-cell extracts were subjected
 SUPPLEMENTARY INFORMATION Supplementary Figure 1. Formation of a complex between Slo1 and CRL4A CRBN E3 ligase. (a) HEK 293T cells were transfected with indicated expression vectors and the whole-cell
Supporting Information
 Supporting Information Palmisano et al. 10.1073/pnas.1202174109 Fig. S1. Expression of different transgenes, driven by either viral or human promoters, is up-regulated by amino acid starvation. (A) Quantification
a. b. c. d. e. f. g. h. i. j. k. l. m. n. o. p.
 a. b. c. d. e. f. g. h. i. j. k. l. 2.5 2 1.5 1.5 IL-1β 12 8 6 4 2 IL-1β 9 8 7 6 4 3 3 2.9 IL-1β m. n. o. p. 1.8 1.6 1.4 1.2 1.8.6.4.2 6h LPS 2 15 1 5 6h LPS 2 6h LPS 6 4 3 6h LPS Supplementary Figure
MANUSCRIPT TITLE: Protein kinase C δ signaling is required for dietary prebiotic-induced strengthening of intestinal epithelial barrier function
 MANUSCRIPT TITLE: Protein kinase C δ signaling is required for dietary prebiotic-induced strengthening of intestinal epithelial barrier function Authors: Richard Y. Wu 1,2, Majd Abdullah 1, Pekka Määttänen
Nature Medicine: doi: /nm.4322
 1 2 3 4 5 6 7 8 9 10 11 Supplementary Figure 1. Predicted RNA structure of 3 UTR and sequence alignment of deleted nucleotides. (a) Predicted RNA secondary structure of ZIKV 3 UTR. The stem-loop structure
Supplementary Figure S1
 Supplementary Figure S1 Supplementary Figure S1. PARP localization patterns using GFP-PARP and PARP-specific antibody libraries GFP-PARP localization in non-fixed (A) and formaldehyde fixed (B) GFP-PARPx
Supplemental Information. Inhibition of the Proteasome b2 Site Sensitizes. Triple-Negative Breast Cancer Cells
 Cell Chemical Biology, Volume 24 Supplemental Information Inhibition of the Proteasome b2 Site Sensitizes Triple-Negative Breast Cancer Cells to b5 Inhibitors and Suppresses Nrf1 Activation Emily S. Weyburne,
p47 negatively regulates IKK activation by inducing the lysosomal degradation of polyubiquitinated NEMO
 Supplementary Information p47 negatively regulates IKK activation by inducing the lysosomal degradation of polyubiquitinated NEMO Yuri Shibata, Masaaki Oyama, Hiroko Kozuka-Hata, Xiao Han, Yuetsu Tanaka,
Exosomes function in antigen presentation during an in vivo Mycobacterium tuberculosis infection
 Exosomes function in antigen presentation during an in vivo Mycobacterium tuberculosis infection Victoria L. Smith, Yong Cheng, Barry R. Bryant and Jeffrey S. Schorey Supplementary Figure 1: Unprocessed
Supplementary Figure 1: Neuregulin 1 increases the growth of mammary organoids compared to EGF. (a) Mammary epithelial cells were freshly isolated,
 Mammary epithelial cells were freshly isolated,") 1 2 3 4 5 6 7 8 9 10 Supplementary Figure 1: Neuregulin 1 increases the growth of mammary organoids compared to EGF. (a) Mammary epithelial cells were freshly isolated, embedded in matrigel and exposed
1 2 3 4 5 6 7 8 9 10 Supplementary Figure 1: Neuregulin 1 increases the growth of mammary organoids compared to EGF. (a) Mammary epithelial cells were freshly isolated, embedded in matrigel and exposed
Supplementary Figure 1. Normal T lymphocyte populations in Dapk -/- mice. (a) Normal thymic development in Dapk -/- mice. Thymocytes from WT and Dapk
 Normal thymic development in Dapk -/- mice. Thymocytes from WT and Dapk") Supplementary Figure 1. Normal T lymphocyte populations in Dapk -/- mice. (a) Normal thymic development in Dapk -/- mice. Thymocytes from WT and Dapk -/- mice were stained for expression of CD4 and CD8.
Supplementary Figure 1. Normal T lymphocyte populations in Dapk -/- mice. (a) Normal thymic development in Dapk -/- mice. Thymocytes from WT and Dapk -/- mice were stained for expression of CD4 and CD8.
Programmed necrosis, not apoptosis, is a key mediator of cell loss and DAMP-mediated inflammation in dsrna-induced retinal degeneration
 Programmed necrosis, not apoptosis, is a key mediator of cell loss and DAMP-mediated inflammation in dsrna-induced retinal degeneration The Harvard community has made this article openly available. Please
Supplementary Figure 1 Induction of cellular senescence and isolation of exosome. a to c, Pre-senescent primary normal human diploid fibroblasts
 Supplementary Figure 1 Induction of cellular senescence and isolation of exosome. a to c, Pre-senescent primary normal human diploid fibroblasts (TIG-3 cells) were rendered senescent by either serial passage
Supplementary Materials for
 www.sciencesignaling.org/cgi/content/full/8/389/ra79/dc1 Supplementary Materials for HDL-bound sphingosine 1-phosphate acts as a biased agonist for the endothelial cell receptor S1P 1 to limit vascular
Supplementary Figure 1. Expression of CUGBP1 in non-parenchymal liver cells treated with TGF-β
 Supplementary Figures Supplementary Figure 1. Expression of CUGBP1 in non-parenchymal liver cells treated with TGF-β and LPS. Non-parenchymal liver cells were isolated and treated with or without TGF-β
Supplemental Information. Autophagy in Oncogenic K-Ras. Promotes Basal Extrusion. of Epithelial Cells by Degrading S1P. Current Biology, Volume 24
 Current Biology, Volume 24 Supplemental Information Autophagy in Oncogenic K-Ras Promotes Basal Extrusion of Epithelial Cells by Degrading S1P Gloria Slattum, Yapeng Gu, Roger Sabbadini, and Jody Rosenblatt
Figure S1: Effects on haptotaxis are independent of effects on cell velocity A)
") Supplemental Figures Figure S1: Effects on haptotaxis are independent of effects on cell velocity A) Velocity of MV D7 fibroblasts expressing different GFP-tagged Ena/VASP family proteins in the haptotaxis
Supplemental Figures Figure S1: Effects on haptotaxis are independent of effects on cell velocity A) Velocity of MV D7 fibroblasts expressing different GFP-tagged Ena/VASP family proteins in the haptotaxis
Supplementary Figure 1. The CagA-dependent wound healing or transwell migration of gastric cancer cell. AGS cells transfected with vector control or
 Supplementary Figure 1. The CagA-dependent wound healing or transwell migration of gastric cancer cell. AGS cells transfected with vector control or 3xflag-CagA expression vector were wounded using a pipette
Cesarini et al., http ://www.jcb.org /cgi /content /full /jcb /DC1
 Supplemental material JCB Cesarini et al., http ://www.jcb.org /cgi /content /full /jcb.201504035 /DC1 THE JOU RNAL OF CELL BIO LOGY Figure S1. Lamin A/C depletion generates two distinct phenotypes in
AAV-TBGp-Cre treatment resulted in hepatocyte-specific GH receptor gene recombination
 AAV-TBGp-Cre treatment resulted in hepatocyte-specific GH receptor gene recombination Supplementary Figure 1. Generation of the adult-onset, liver-specific GH receptor knock-down (alivghrkd, Kd) mouse
The subcortical maternal complex controls symmetric division of mouse zygotes by
 The subcortical maternal complex controls symmetric division of mouse zygotes by regulating F-actin dynamics Xing-Jiang Yu 1,2, Zhaohong Yi 1, Zheng Gao 1,2, Dan-dan Qin 1,2, Yanhua Zhai 1, Xue Chen 1,
Protein tyrosine phosphatase 1B targets PITX1/p120RasGAP. thus showing therapeutic potential in colorectal carcinoma
 Protein tyrosine phosphatase 1B targets PITX1/p120RasGAP thus showing therapeutic potential in colorectal carcinoma Hao-Wei Teng, Man-Hsin Hung, Li-Ju Chen, Mao-Ju Chang, Feng-Shu Hsieh, Ming-Hsien Tsai,
Supplementary Figure 1 Cell line TRIB2 status. Supplementary Figure 2 TRIB2 status has no impact on the cell cycle after PI3K inhibition. a. b.
 Supplementary Figure 1 Cell line TRIB2 status. TRIB2 protein expression to determine endogenous expression and to determine the effectiveness of each of our TRIB2 knockdown constructs. Supplementary Figure
Supplementary Figure 1 hlrrk2 promotes CAP dependent protein translation.
 ` Supplementary Figure 1 hlrrk2 promotes CAP dependent protein translation. (a) Overexpression of hlrrk2 in HeLa cells enhances total protein synthesis in [35S] methionine/cysteine incorporation assays.
SUPPLEMENTARY INFORMATION
 DOI: 10.1038/ncb3021 Supplementary figure 1 Characterisation of TIMPless fibroblasts. a) Relative gene expression of TIMPs1-4 by real time quantitative PCR (RT-qPCR) in WT or ΔTimp fibroblasts (mean ±
Supplementary information. The Light Intermediate Chain 2 Subpopulation of Dynein Regulates Mitotic. Spindle Orientation
 Supplementary information The Light Intermediate Chain 2 Subpopulation of Dynein Regulates Mitotic Spindle Orientation Running title: Dynein LICs distribute mitotic functions. Sagar Mahale a, d, *, Megha
Supplementary Materials for
 www.sciencesignaling.org/cgi/content/full/8/366/ra25/dc1 Supplementary Materials for Viral entry route determines how human plasmacytoid dendritic cells produce type I interferons Daniela Bruni, Maxime
Erzsebet Kokovay, Susan Goderie, Yue Wang, Steve Lotz, Gang Lin, Yu Sun, Badrinath Roysam, Qin Shen,
 Cell Stem Cell, Volume 7 Supplemental Information Adult SVZ Lineage Cells Home to and Leave the Vascular Niche via Differential Responses to SDF1/CXCR4 Signaling Erzsebet Kokovay, Susan Goderie, Yue Wang,
T H E J O U R N A L O F C E L L B I O L O G Y
 T H E J O U R N A L O F C E L L B I O L O G Y Supplemental material Krenn et al., http://www.jcb.org/cgi/content/full/jcb.201110013/dc1 Figure S1. Levels of expressed proteins and demonstration that C-terminal
Control GST GST-RAP. α2-mg. 170 kda. b-actin. 42 kda LRP-1
 % of max Supplementary Figure 1 Control GST GST-RP 17 kda α2-mg 42 kda b-actin Gate: CD11c+ (DCs) Gate: F4/8+ (Mfs) IgG Cd11cCre + Lrp1 fl/fl LRP-1 Supplementary figure 1. () MDCs were pretreated with
Supplementary Figure (OH) 22 nanoparticles did not affect cell viability and apoposis. MDA-MB-231, MCF-7, MCF-10A and BT549 cells were
 22 nanoparticles did not affect cell viability and apoposis. MDA-MB-231, MCF-7, MCF-10A and BT549 cells were") Supplementary Figure 1. Gd@C 82 (OH) 22 nanoparticles did not affect cell viability and apoposis. MDA-MB-231, MCF-7, MCF-10A and BT549 cells were treated with PBS, Gd@C 82 (OH) 22, C 60 (OH) 22 or GdCl
Supplementary Figure 1. Gd@C 82 (OH) 22 nanoparticles did not affect cell viability and apoposis. MDA-MB-231, MCF-7, MCF-10A and BT549 cells were treated with PBS, Gd@C 82 (OH) 22, C 60 (OH) 22 or GdCl
Santulli G. et al. A microrna-based strategy to suppress restenosis while preserving endothelial function
 ONLINE DATA SUPPLEMENTS Santulli G. et al. A microrna-based strategy to suppress restenosis while preserving endothelial function Supplementary Figures Figure S1 Effect of Ad-p27-126TS on the expression
SUPPLEMENTARY INFORMATION. Supplementary Figures S1-S9. Supplementary Methods
 SUPPLEMENTARY INFORMATION SUMO1 modification of PTEN regulates tumorigenesis by controlling its association with the plasma membrane Jian Huang 1,2#, Jie Yan 1,2#, Jian Zhang 3#, Shiguo Zhu 1, Yanli Wang
supplementary information
 DOI: 10.1038/ncb1875 Figure S1 (a) The 79 surgical specimens from NSCLC patients were analysed by immunohistochemistry with an anti-p53 antibody and control serum (data not shown). The normal bronchi served
(a-r) Whole mount X-gal staining on a developmental time-course of hearts from
 Whole mount X-gal staining on a developmental time-course of hearts from") 1 2 3 4 5 6 7 8 9 10 11 12 13 14 15 16 Supplementary Figure 1 (a-r) Whole mount X-gal staining on a developmental time-course of hearts from Sema3d +/- ;Ephb4 LacZ/+ and Sema3d -/- ;Ephb4 LacZ/+ embryos.
1 2 3 4 5 6 7 8 9 10 11 12 13 14 15 16 Supplementary Figure 1 (a-r) Whole mount X-gal staining on a developmental time-course of hearts from Sema3d +/- ;Ephb4 LacZ/+ and Sema3d -/- ;Ephb4 LacZ/+ embryos.
SUPPLEMENTARY DATA. Supplementary Table 2. Antibodies used for Immunofluoresence. Supplementary Table 3. Real-time PCR primer sequences.
 Supplementary Table 2. Antibodies used for Immunofluoresence. Antibody Dilution Source Goat anti-pdx1 1:100 R&D Systems Rabbit anti-hnf6 1:100 Santa Cruz Biotechnology Mouse anti-nkx6.1 1:200 Developmental
Supplementary Figure 1
 Supplementary Figure 1 The average sigmoid parametric curves of capillary dilation time courses and average time to 50% peak capillary diameter dilation computed from individual capillary responses averaged
Supplementary Figure S1. Effect of Glucose on Energy Balance in WT and KHK A/C KO
 Supplementary Figure S1. Effect of Glucose on Energy Balance in WT and KHK A/C KO Mice. WT mice and KHK-A/C KO mice were provided drinking water containing 10% glucose or tap water with normal chow ad
Supplementary Figure 1 IMQ-Induced Mouse Model of Psoriasis. IMQ cream was
 Supplementary Figure 1 IMQ-Induced Mouse Model of Psoriasis. IMQ cream was painted on the shaved back skin of CBL/J and BALB/c mice for consecutive days. (a, b) Phenotypic presentation of mouse back skin
Nature Immunology: doi: /ni eee Supplementary Figure 1
 eee Supplementary Figure 1 Hyphae induce NET release, but yeast do not. (a) NET release by human peripheral neutrophils stimulated with a hgc1 yeast-locked C. albicans mutant (yeast) or pre-formed WT C.