Supplementary Figure 1 ITGB1 and ITGA11 increase with evidence for heterodimers following HSC activation. (a) Time course of rat HSC activation
|
|
|
- Opal Hoover
- 5 years ago
- Views:
Transcription
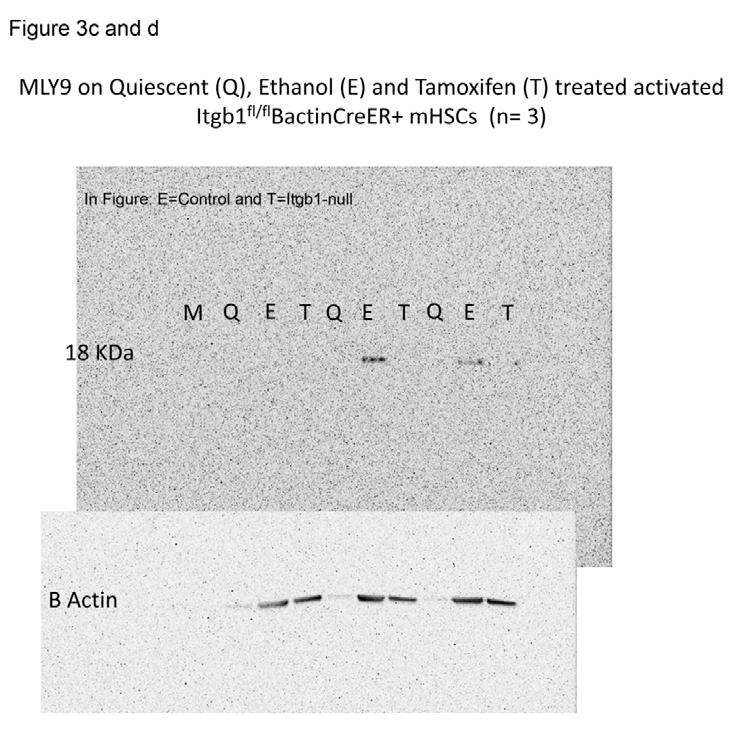
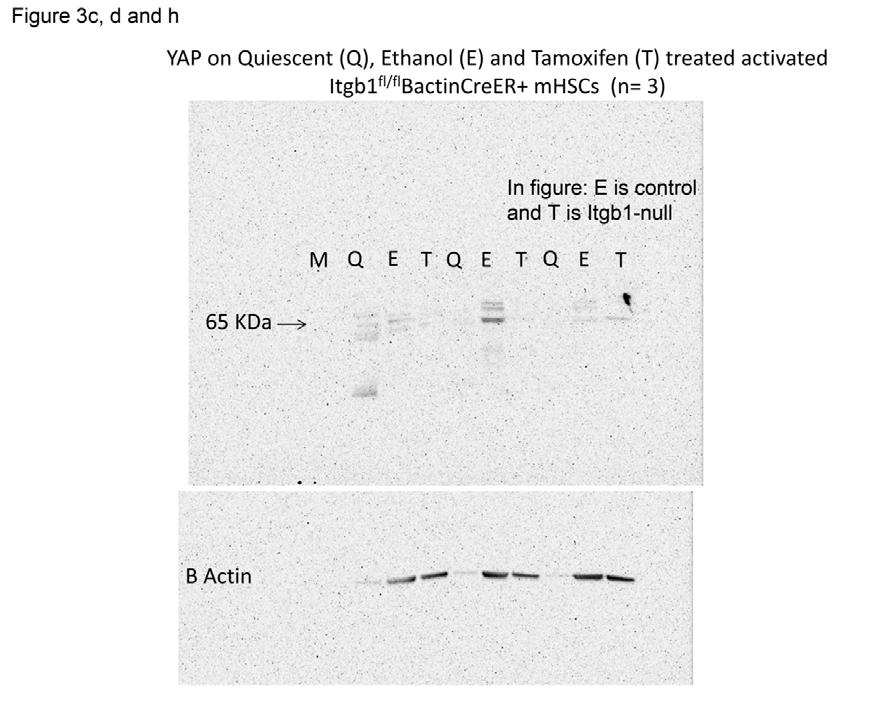
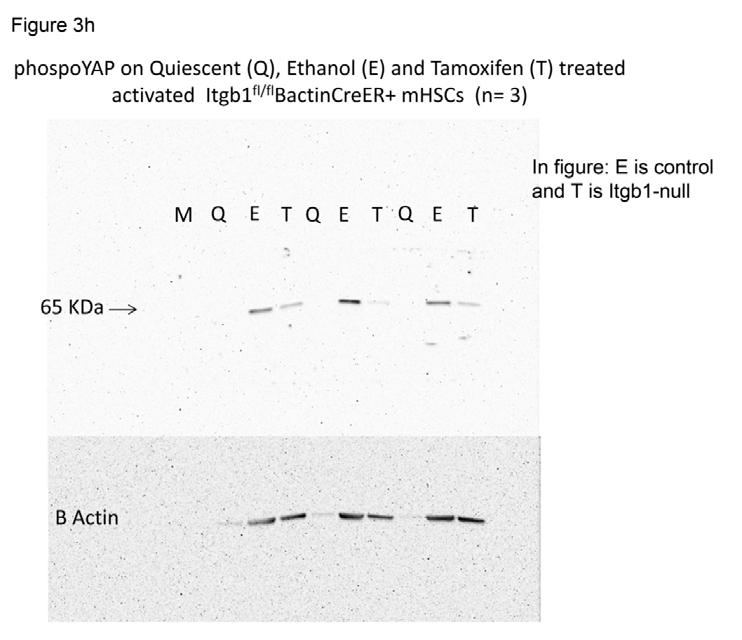
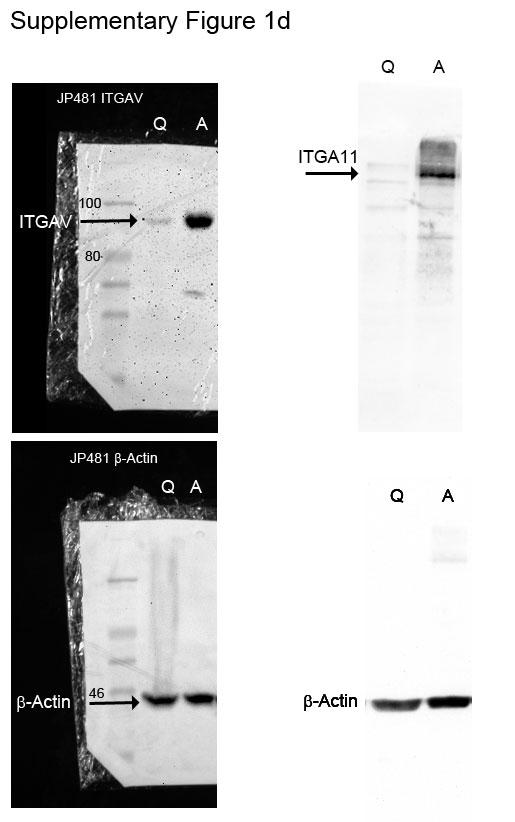
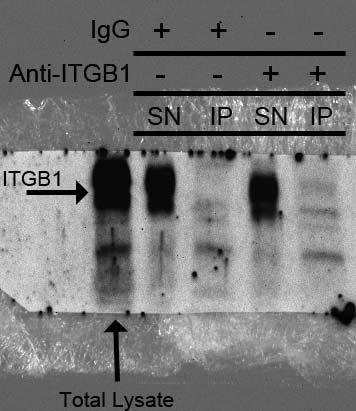
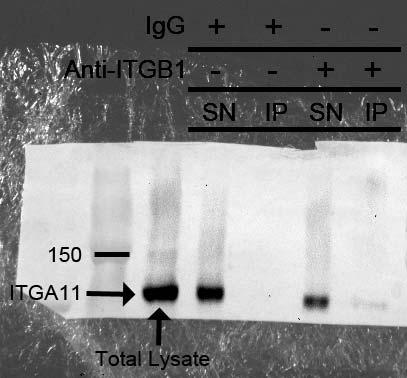
1 Supplementary Figure 1 ITGB1 and ITGA11 increase with evidence for heterodimers following HSC activation. (a) Time course of rat HSC activation indicated by the detection of -SMA and COL1 (log scale). (b) Representative immunoblot underlying (a). The double band for ITGB1 is consistent with detection of precursor 115 KDa and mature 130 KDa forms. (c) qrt-pcr analysis of integrin alpha subunits in activated rat HSCs (ArHSCs) relative to their quiescent counterparts (log scale). (d) Quantification and representative immunoblot (inset) of ITGA11 and ITGAV protein levels in ArHSCs compared to their quiescent (Q) counterparts. (e) Coimmunoprecipitation studies showing evidence for ITGA11B1 heterodimer complexes in activated rat HSCs. Representative immunoblot of two independent experiments is shown. SN = Supernatant and IP = Immunoprecipitation. (f) Immunofluorescence following Itgb1 loss ( Itgb1-null ) in activated mouse HSCs ( Control ) for F-actin (green; located along stress fibres) and G-actin (red; distributed in the nucleus and cytoplasm of control cells). Following loss of Itgb1 in activated mouse HSCs F-actin is diminished and cells are much more rounded. Scale bars 50 m. (g) MTT assay for cell viability following Itgb1 loss ( Itgb1-null ) in activated mouse HSCs ( Control ). (h) The detection of apoptosis by Caspase immunoblot is unaltered following Itgb1 inactivation (+Tamoxifen) in activated mouse HSCs (-Tamoxifen). The positive control (+ve Cntl) is lysate prepared from UV-treated activated rat HSCs. All experiments are
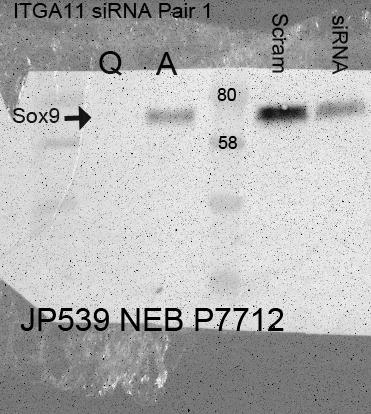
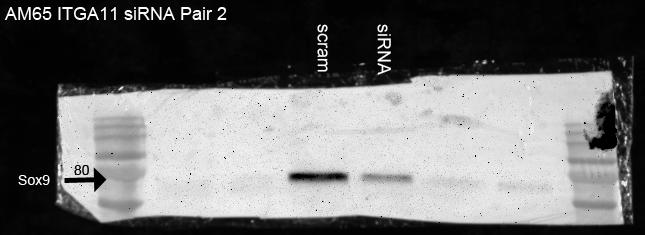
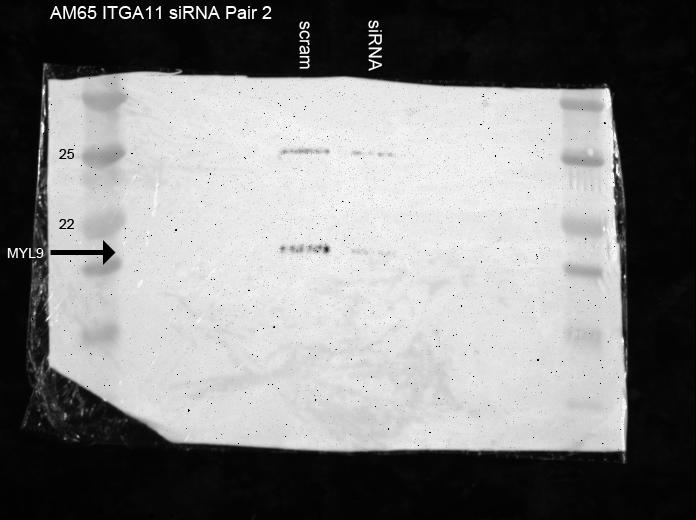
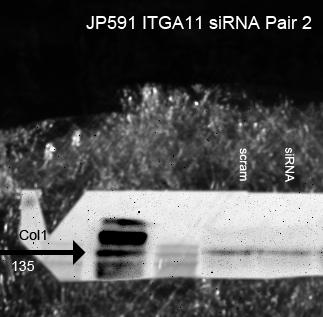
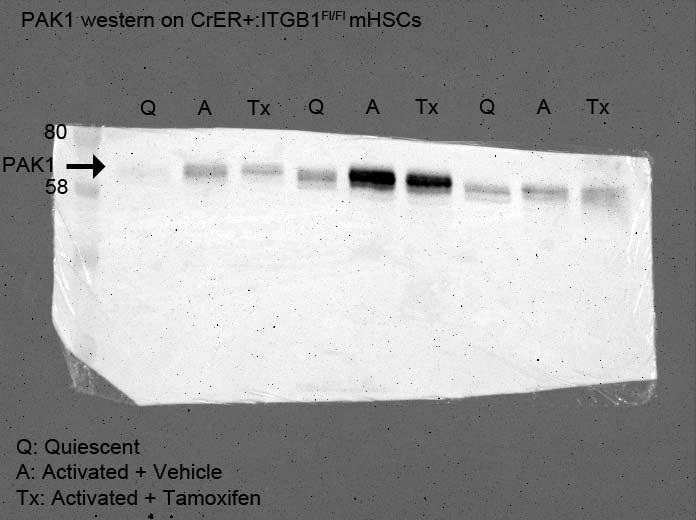
2 n=3 to 6 unless otherwise indicated. Two-tailed unpaired t-test was used for statistical analysis. Data are shown as means ± s.e.m.. *P<0.05, **P<0.01. Supplementary Figure 2 Abrogation of either ITGA11 or ITGB1 causes loss of activated HSC / myofibroblast characteristics. (a) Quantification of COL1 and SOX9 protein levels following moderate ITGA11 knockdown by sirna1 (n=8) or sirna2 (n=3) in activated mouse HSCs expressed relative to scrambled control (immunoblots for ITGA11 sirna knockdown are available in Supplementary Figure 8). (b, c) Quantification and example immunoblots following loss of Itgb1 ( Itgb1-null, n=4) in mouse HSCs already activated for 7 days showing decrease in protein levels for α-sma, COL1 and SOX9. (d-f) Migration of activated mouse HSCs ( Control ) over 24h versus migration of equivalent HSCs in which Itgb1 had been recombined only after full activation (track length, m; n=3 biological replicate experiments) (d). Individual tracks for a small subset of cells are shown in different colours for one experiment in (e) and (f). Two-tailed unpaired t-test was used for statistical analysis. Data are shown as means ± s.e.m.. *P<0.05, P<0.005.
, downregulated (blue) and intermediate (yellow) gene expression for activated (A) mouse HSCs (Cnt) and following the loss of Itgb1 (Null).")
3 Supplementary Figure 3 Hierarchical clustering and heatmap for Cluster 3 (Fig. 2a) with full gene list. Colour indicates upregulated (red), downregulated (blue) and intermediate (yellow) gene expression for activated (A) mouse HSCs (Cnt) and following the loss of Itgb1 (Null). The data here depict the mean signal of replicate microarrays with quiescent (Q) HSCs shown for comparison.
.")
4 Supplementary Figure 4 Functional annotation by gene ontology for enrichment in Cluster 7 from Fig. 2a. Proportions are shown in (a). Individual categories and the genes underlying them are shown in (b).
.")
5 Supplementary Figure 5 Functional annotation by gene ontology for enrichment in Cluster 2 from Fig. 2a. Proportions are shown in (a). Individual categories and the genes underlying them are shown in (b).

6 Supplementary Figure 6 Top 20 canonical pathways represented by genes listed in Cluster 3 (Fig. 2a-c) following Ingenuity Pathway Analysis. Pathways were ranked by the negative log of P-values calculated by Fisher s exact test for gene enrichment. Pathways highlighted in red contain either Myl9 and/or Pak as terms.
.")
7 Supplementary Figure 7 YAP binds to a TEAD motif in the MYL9 gene. (a) Alignment of MYL9 3 UTR shows the conserved TEAD-binding motif (core motif shown in black). Conservation is indicated by asterisks (*). (b) Representative ChIP assay (n=3) for TEAD-binding element from (a) showing enrichment for the TEAD co-factor, YAP, in chromatin prepared from activated rat HSCs. Negative control is immunoglobulin (IgG) and positive control is input (diluted 10-fold).
 and sirna2 (b).")
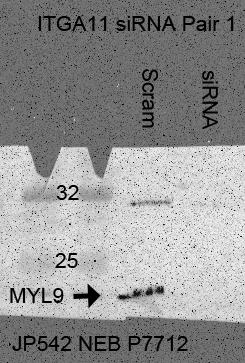
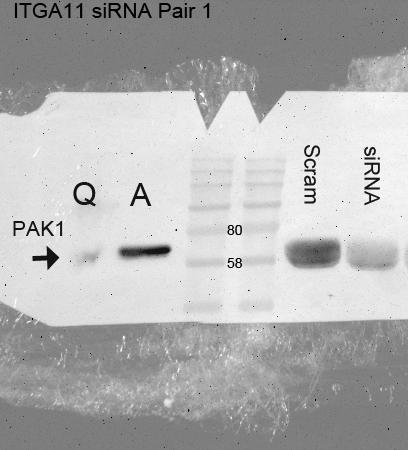
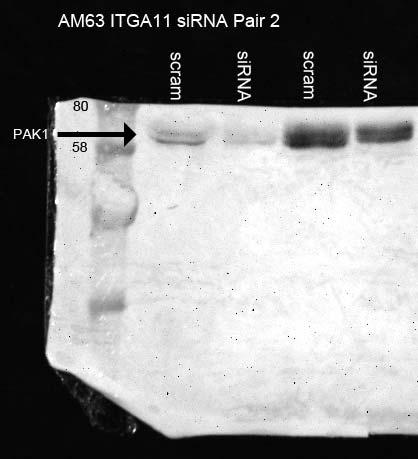
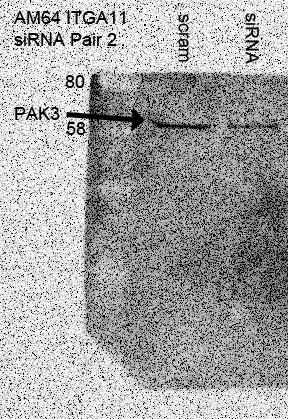
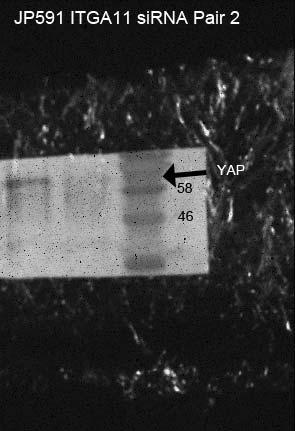
8 Supplementary Figure 8 Representative immunoblots for all ITGA11 sirna knockdown quantified in Figures 3 & 5 and Supplementary Figure 2. Abrogation of ITGA11 is by two independent sirnas, sirna1 (a) and sirna2 (b). Please see raw data files for full immunoblots containing molecular weight markers.
 VP treatment did not affect serum alanine aminotransferase (ALT) levels compared to the DMSO control group.")
9 Supplementary Figure 9 Characterisation of mouse livers following verteporfin (VP) treatment in CCl 4 - induced liver fibrosis. (a) VP treatment did not affect serum alanine aminotransferase (ALT) levels compared to the DMSO control group. (b) Hydroxyproline quantification seemed lessened in the VP-treated CCl 4 liver fibrosis group but did not reach statistical signficance. (c-f) VP treatment did not significantly alter myofibroblast cell numbers quantified by αsma staining (c-d) or inflammatory cells (predominantly macrophages), quantified by F4/80 staining (e-f) compared to DMSO control group. Two-tailed unpaired t- test was used for statistical analysis. Data are shown as means ± s.e.m..
 VP treatment in BDL improved liver function as indicated by lower serum alanine aminotransferase (ALT) and bilirubin (BIL) levels compared to the DMSO control group.")
10 Supplementary Figure 10 Characterisation of mouse livers following VP treatment in BDL-induced liver fibrosis. (a) VP treatment in BDL improved liver function as indicated by lower serum alanine aminotransferase (ALT) and bilirubin (BIL) levels compared to the DMSO control group. (b) Hydroxyproline quantification was not statistically lowered in VP-treated BDL liver fibrosis. (c-h) VP treatment did not significantly alter ductal hyperplasia as quantified by the surface area covered by CK19 positive ducts (c-d), although there was a trend to lower myofibroblast cell numbers, quantified by αsma staining, (e-f) and inflammatory cells (predominantly macrophages) quantified by F4/80 staining (g-h) compared to DMSO control group. Two-tailed unpaired t-test was used for statistical analysis. Data are shown as means ± s.e.m.. *P<0.05.
 and representative immunoblot (b) showing reduced levels of pro-fibrotic proteins / activated HSC markers following abrogation of PAK3 relative to control scrambled sirna.")
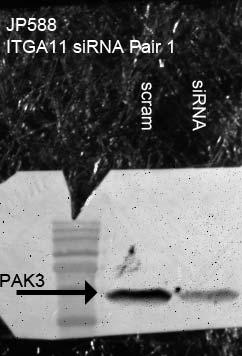
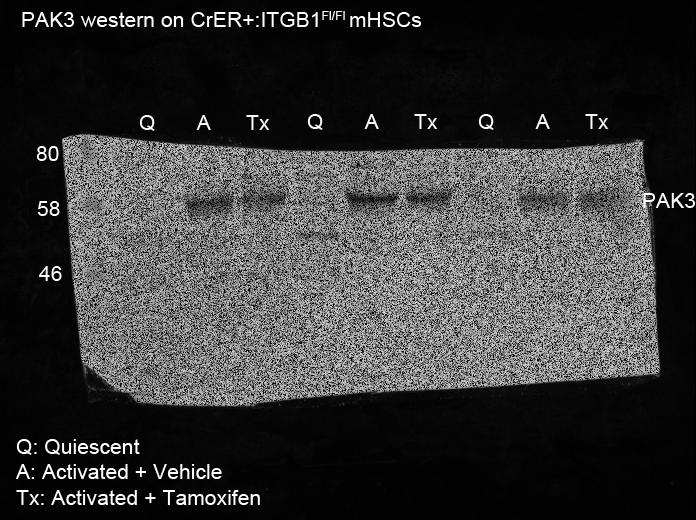
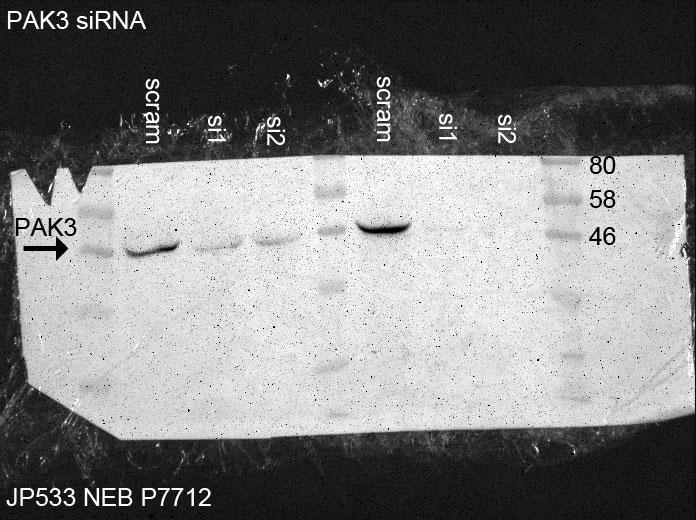
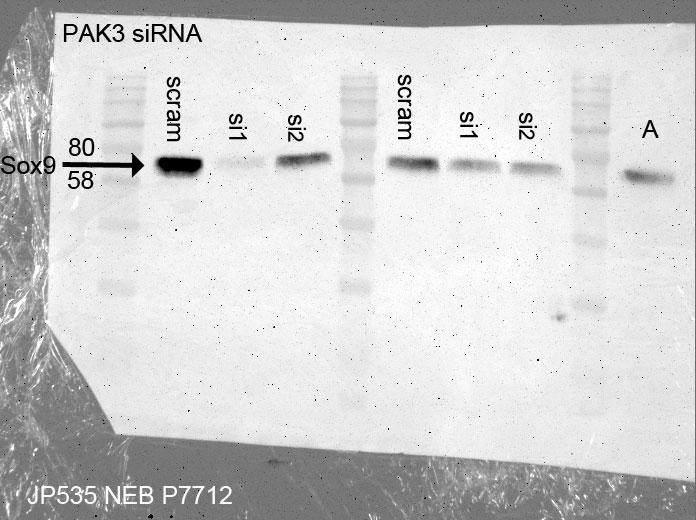
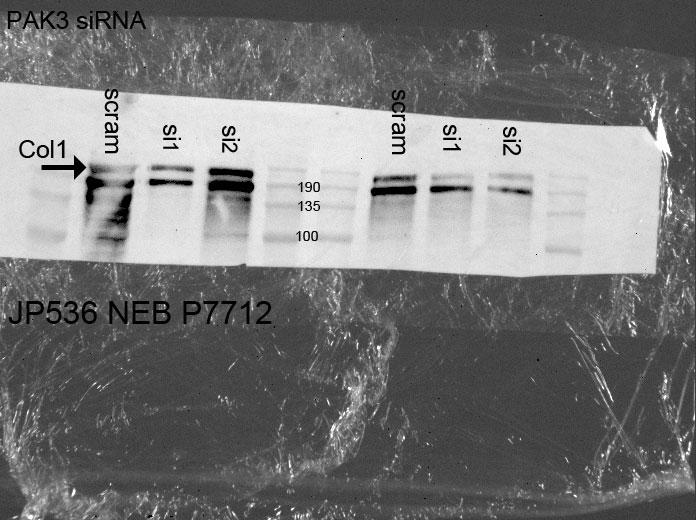
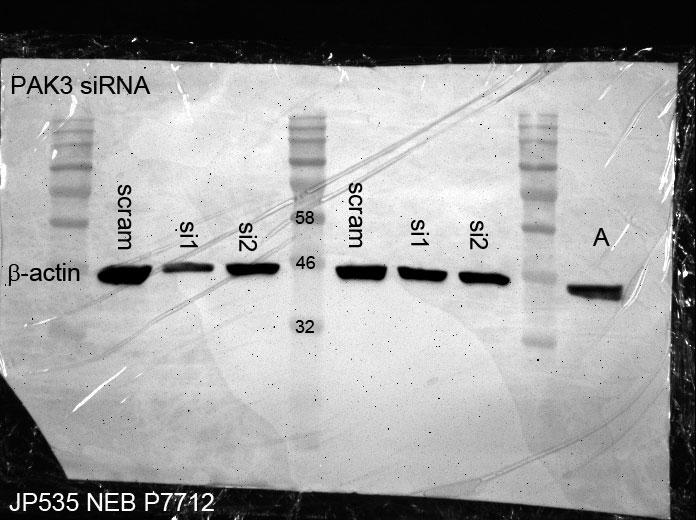
11 Supplementary Figure 11 Abrogation of PAK3 by two independent sirnas in activated mouse HSCs. Quantification (a) and representative immunoblot (b) showing reduced levels of pro-fibrotic proteins / activated HSC markers following abrogation of PAK3 relative to control scrambled sirna. Two-tailed unpaired t-test was used for statistical analysis. Data are shown as means ± s.e.m.. *P<0.05, **P<0.01, P<0.005, P<0.001; n=3.
 MTT assay for cell viability following IPA3 treatment in activated mouse HSCs. Control is DMSO treated cells.")
12 Supplementary Figure 12 IPA3 treatment does not affect cell viability of activated HSCs or alter fibrotic markers in Itgb1-null activated HSCs. (a) MTT assay for cell viability following IPA3 treatment in activated mouse HSCs. Control is DMSO treated cells. (b) IPA3 treatment does not alter levels of profibrotic markers, COL1 and SOX9, in Itgb1-null activated HSCs compared to DMSO treated cells. Two-tailed unpaired t-test was used for statistical analysis. Data are shown as means ± s.e.m..
13 Supplementary Figure 13 Characterisation of livers following IPA3 treatment in CCl 4 and BDL models of liver fibrosis. (a, b) IPA3 treatment did not alter the liver weight/body weight ratio compared to the DMSO control group in CCl 4 (a) or BDL (b) models of liver fibrosis. (c, d) Non-significant improvements seemed apparent in liver function following IPA3 treatment compared to DMSO control for serum ALT (CCl 4 model; c) and ALT & bilirubin (BDL; d). (e, f) Hydroxyproline levels were lowered in IPA3-treated CCl 4 liver fibrosis (a model of parenchymal liver disease) but not in the BDL model (a more restricted peribiliary model of fibrosis). Two-tailed unpaired t-test was used for statistical analysis. Data are shown as means ± s.e.m. **P<0.01.
14 Supplementary Figure 14. Raw immunoblotting data files
15
16

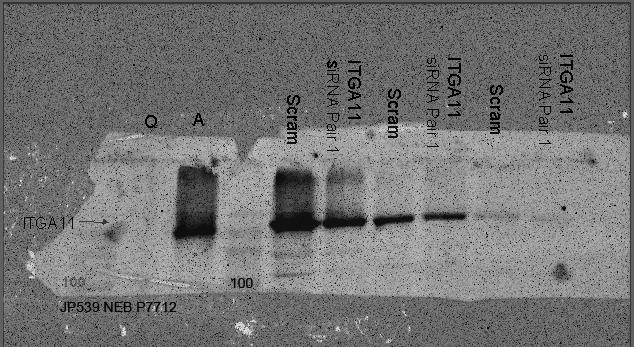
17 Figures 3g, 5c and Supplementary Figures 2a and 8: ITGA11 sirna1

18


19 Figures 3g, 5c and Supplementary Figures 2a and 8: ITGA11 sirna2
20
21
22


23 Figure 5b: Q: Quiescent HSCs A: Activated HSCs + vehicle = Control Tx: Activated HSCs + Tamoxifen = Itgb1-null
24
25


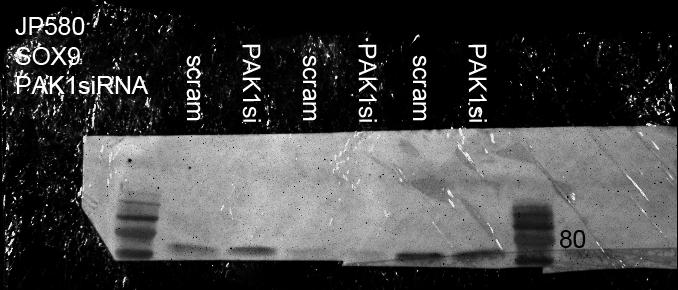
26 Figure 5d and e PAK1 sirna2
27
28
29
30 Supplemental Figure 1e
31 Supplemental Figure 11
32
33 sirna target gene Cat. No. Species Target sequence Itga11 (sirna1) SI mouse CACGCCCTATCTGGACCTATA SI mouse TACGACCTTTACTGTCAGAAA Itga11 (sirna2) SI mouse CCGCCCTGTAGTTCAAATCAA SI mouse CAGCTTCTACCTGGTGGGAAA Pak1(siRNA1) SI mouse CTGGGCATTATGGCAATTGAA Pak1(siRNA2) S mouse CTCGCTTGCTTCAAACATCAA Pak3 (sirna2) SI mouse CCCACTGAGGATGAACAGTAA Pak3 (sirna1) SI mouse TAGCAGCACATCAGTCGAATA Supplementary Table 1 sirna target sequences.
34 Target Species Forward Reverse Application Acta2 Mouse GTCCCAGACATCAGGGAGTAA TCGGATACTTCAGCGTCAGGA qpcr ActinB Mouse GCTGTATTCCCCTCCATCGTG CACGGTTGGCCTTAGGGTTCAG qpcr ActinB Rat CCCGCGAGTACAACCTTCT CGTCATCCATGGCGAACT qpcr Bambi Rat TGTGCTGCTCACCAAAGGCGA AGCAGGCACTAAGCTCGGACT qpcr ChIP ve Mouse CTGAGGCAGTCGAAGGAGAG ACACTGGCTGCCAAAATGTA ChIP Col1a1 Mouse TGTTGGCCCATCTGGTAAAGA CAGGGAATCCGATGTTGCC qpcr GusB Mouse GCAGTTGTGTGGGTGAATGG GGGTCAGTGTGTTGTTGATGG qpcr GusB Rat CTCTGGTGGCCTTACCTGAT AGGTGTTGTCATCGTCACCTC qpcr Hspa1a/b Rat TGTCCCTCAAGAGCCCAACCC TTGGCTCTCCACACAGGAACCC qpcr Itga1 Rat GCAACCGGAAGCGAGAGCTGG TAGCAGCAGTAGCCCCGCGA qpcr Itga10 Rat GGCCTGTGCCCCTCTCTGGT GGACAACGTTGGGCGGTCGG qpcr Itga11 Mouse GATACGCTGTGGCCGTTTTG AGAAGTGCTTGTCGTCAGGG qpcr Itga11 Rat ACCCGCACGGCATTTGGCAT TCGTGGGATTCCCCGTCCGT qpcr Itga2 Rat TGTGCGCACCCCCAAAAGCA CCGTCAATCTTGAGTGAGCAGTAGC qpcr Itga3 Rat AGTCCTGGTCTGTGCCCATCGG TCGTTGCCACGCACGTAGCA qpcr Itga4 Rat GGGTACCAACCGGGCACTCC AATGAGCCAGCGCTTCGTCCC qpcr Itga5 Rat TTTGGCAGTGCAGCAGGGCA CCACGCGGCCAGTCTTGGTG qpcr Itga6 Rat TGCGGGCACTCAGGTTCGAG AGGATGATCCACCACGCTATCCCT qpcr Itga7 Rat TCTGGGGAGCGCCTGACCTC AGGTCTGCCCAGCCATCACTGT qpcr Itga8 Rat GCGCGCACAGCCAGTGTCTT CCTCTCTGCAGGCCAGGGACA qpcr Itga9 Rat AGACGACGCCTACGACGCCAA ATGCCCATCTCCTCCTTCTGCCAC qpcr Itgb1 Mouse GCCAAGTGGGACACGGGTGAA AGCTTGGTGTTGCAAAATCCGCCT qpcr Myl9 Mouse CTCTGCAGCAGGGAAACCC CTTCTTGGTGGTCTTGGCCT qpcr Myl9 Mouse GACCCTACAAGGAGGGACCA CTTCCTTCCTCAGGCCAGC ChIP Pak1 Mouse TTAGCCGAATCCAGCCTGTC CAGCAGCTACTGGCGGTG qpcr Pdgfrb Mouse TCCAGGAGTGATACCAGCTTT CAGGAGCCATAACACGGACA qpcr Pparg Rat TCTCAGTGGAGACCGCCCAGG GGGAGGACTCCGGGTGGTTCAG qpcr Yap1 Mouse ATTTCGGCAGGCAATACGGA CATCCTGCTCCAGTGTAGGC qpcr Supplementary Table 2 PCR primer sequences and applications.
Supplementary Figure 1. Repression of hepcidin expression in the liver of mice treated with
 Supplementary Figure 1. Repression of hepcidin expression in the liver of mice treated with DMN Immunohistochemistry for hepcidin and H&E staining (left). qrt-pcr assays for hepcidin in the liver (right).
Supplementary Figure 1. Expression of CUGBP1 in non-parenchymal liver cells treated with TGF-β
 Supplementary Figures Supplementary Figure 1. Expression of CUGBP1 in non-parenchymal liver cells treated with TGF-β and LPS. Non-parenchymal liver cells were isolated and treated with or without TGF-β
Supplementary Figure 1: STAT3 suppresses Kras-induced lung tumorigenesis
 Supplementary Figure 1: STAT3 suppresses Kras-induced lung tumorigenesis (a) Immunohistochemical (IHC) analysis of tyrosine 705 phosphorylation status of STAT3 (P- STAT3) in tumors and stroma (all-time
(a) Significant biological processes (upper panel) and disease biomarkers (lower panel)
 Significant biological processes (upper panel) and disease biomarkers (lower panel)") Supplementary Figure 1. Functional enrichment analyses of secretomic proteins. (a) Significant biological processes (upper panel) and disease biomarkers (lower panel) 2 involved by hrab37-mediated secretory
Supplementary Figure 1. Functional enrichment analyses of secretomic proteins. (a) Significant biological processes (upper panel) and disease biomarkers (lower panel) 2 involved by hrab37-mediated secretory
SUPPLEMENTARY INFORMATION
 DOI:.38/ncb3399 a b c d FSP DAPI 5mm mm 5mm 5mm e Correspond to melanoma in-situ Figure a DCT FSP- f MITF mm mm MlanaA melanoma in-situ DCT 5mm FSP- mm mm mm mm mm g melanoma in-situ MITF MlanaA mm mm
Supplementary Materials
 Supplementary Materials Supplementary Figure S1 Regulation of Ubl4A stability by its assembly partner A, The translation rate of Ubl4A is not affected in the absence of Bag6. Control, Bag6 and Ubl4A CRISPR
TEB. Id4 p63 DAPI Merge. Id4 CK8 DAPI Merge
 a Duct TEB b Id4 p63 DAPI Merge Id4 CK8 DAPI Merge c d e Supplementary Figure 1. Identification of Id4-positive MECs and characterization of the Comma-D model. (a) IHC analysis of ID4 expression in the
Supplementary Materials for
 www.sciencesignaling.org/cgi/content/full/9/439/ra78/dc1 Supplementary Materials for Small heterodimer partner mediates liver X receptor (LXR) dependent suppression of inflammatory signaling by promoting
Tcf21 MCM ; R26 mtmg Sham GFP Col 1/3 TAC 8W TAC 2W. Postn MCM ; R26 mtmg Sham GFP Col 1/3 TAC 8W TAC 2W
 A Tcf21 MCM ; R26 mtmg Sham GFP Col 1/3 Tcf21 MCM ; R26 mtmg TAC 2W Tcf21 MCM ; R26 mtmg TAC 8W B Postn MCM ; R26 mtmg Sham GFP Col 1/3 Postn MCM ; R26 mtmg TAC 2W Postn MCM ; R26 mtmg TAC 8W Supplementary
hexahistidine tagged GRP78 devoid of the KDEL motif (GRP78-His) on SDS-PAGE. This
 on SDS-PAGE. This") SUPPLEMENTAL FIGURE LEGEND Fig. S1. Generation and characterization of. (A) Coomassie staining of soluble hexahistidine tagged GRP78 devoid of the KDEL motif (GRP78-His) on SDS-PAGE. This protein was expressed
SUPPLEMENTAL FIGURE LEGEND Fig. S1. Generation and characterization of. (A) Coomassie staining of soluble hexahistidine tagged GRP78 devoid of the KDEL motif (GRP78-His) on SDS-PAGE. This protein was expressed
Predictive PP1Ca binding region in BIG3 : 1,228 1,232aa (-KAVSF-) HEK293T cells *** *** *** KPL-3C cells - E E2 treatment time (h)
 HEK293T cells *** *** *** KPL-3C cells - E E2 treatment time (h)") Relative expression ERE-luciferase activity activity (pmole/min) activity (pmole/min) activity (pmole/min) activity (pmole/min) MCF-7 KPL-3C ZR--1 BT-474 T47D HCC15 KPL-1 HBC4 activity (pmole/min) a d
Relative expression ERE-luciferase activity activity (pmole/min) activity (pmole/min) activity (pmole/min) activity (pmole/min) MCF-7 KPL-3C ZR--1 BT-474 T47D HCC15 KPL-1 HBC4 activity (pmole/min) a d
Supplementary Materials and Methods
 Supplementary Materials and Methods Hepatocyte toxicity assay. Freshly isolated hepatocytes were incubated for overnight with varying concentrations (-25 µm) of sodium glycochenodeoxycholate (GCDC) or
Supplementary Table 1. The primers used for quantitative RT-PCR. Gene name Forward (5 > 3 ) Reverse (5 > 3 )
 Reverse (5 > 3 )") 770 771 Supplementary Table 1. The primers used for quantitative RT-PCR. Gene name Forward (5 > 3 ) Reverse (5 > 3 ) Human CXCL1 GCGCCCAAACCGAAGTCATA ATGGGGGATGCAGGATTGAG PF4 CCCCACTGCCCAACTGATAG TTCTTGTACAGCGGGGCTTG
770 771 Supplementary Table 1. The primers used for quantitative RT-PCR. Gene name Forward (5 > 3 ) Reverse (5 > 3 ) Human CXCL1 GCGCCCAAACCGAAGTCATA ATGGGGGATGCAGGATTGAG PF4 CCCCACTGCCCAACTGATAG TTCTTGTACAGCGGGGCTTG
SUPPLEMENTARY FIGURES
 SUPPLEMENTARY FIGURES Figure S1. Clinical significance of ZNF322A overexpression in Caucasian lung cancer patients. (A) Representative immunohistochemistry images of ZNF322A protein expression in tissue
Nature Immunology: doi: /ni Supplementary Figure 1. Transcriptional program of the TE and MP CD8 + T cell subsets.
 Supplementary Figure 1 Transcriptional program of the TE and MP CD8 + T cell subsets. (a) Comparison of gene expression of TE and MP CD8 + T cell subsets by microarray. Genes that are 1.5-fold upregulated
Supplemental Figure 1. Western blot analysis indicated that MIF was detected in the fractions of
 Supplemental Figure Legends Supplemental Figure 1. Western blot analysis indicated that was detected in the fractions of plasma membrane and cytosol but not in nuclear fraction isolated from Pkd1 null
HepaRG LX2. HepaRG HepaRG LX2 LX2
 C Supporting Figure 1. Experimental design of s between and cells. (A) -hepatocytes were isolated from a 30 days of -progenitors. Differentiation into mature hepatocytes was achieved following a 2-weeks
Supplementary Figure 1:
 Supplementary Figure 1: (A) Whole aortic cross-sections stained with Hematoxylin and Eosin (H&E), 7 days after porcine-pancreatic-elastase (PPE)-induced AAA compared to untreated, healthy control aortas
SUPPLEMENTARY FIGURES
 SUPPLEMENTARY FIGURES 1 Supplementary Figure 1, Adult hippocampal QNPs and TAPs uniformly express REST a-b) Confocal images of adult hippocampal mouse sections showing GFAP (green), Sox2 (red), and REST
Supplementary Figure 1. HOPX is hypermethylated in NPC. (a) Methylation levels of HOPX in Normal (n = 24) and NPC (n = 24) tissues from the
 Methylation levels of HOPX in Normal (n = 24) and NPC (n = 24) tissues from the") Supplementary Figure 1. HOPX is hypermethylated in NPC. (a) Methylation levels of HOPX in Normal (n = 24) and NPC (n = 24) tissues from the genome-wide methylation microarray data. Mean ± s.d.; Student
Supplementary Figure 1. HOPX is hypermethylated in NPC. (a) Methylation levels of HOPX in Normal (n = 24) and NPC (n = 24) tissues from the genome-wide methylation microarray data. Mean ± s.d.; Student
a. b. c. d. e. f. g. h. i. j. k. l. m. n. o. p.
 a. b. c. d. e. f. g. h. i. j. k. l. 2.5 2 1.5 1.5 IL-1β 12 8 6 4 2 IL-1β 9 8 7 6 4 3 3 2.9 IL-1β m. n. o. p. 1.8 1.6 1.4 1.2 1.8.6.4.2 6h LPS 2 15 1 5 6h LPS 2 6h LPS 6 4 3 6h LPS Supplementary Figure
SUPPLEMENTARY INFORMATION
 DOI: 10.1038/ncb3021 Supplementary figure 1 Characterisation of TIMPless fibroblasts. a) Relative gene expression of TIMPs1-4 by real time quantitative PCR (RT-qPCR) in WT or ΔTimp fibroblasts (mean ±
Supplementary Figure 1. Deletion of Smad3 prevents B16F10 melanoma invasion and metastasis in a mouse s.c. tumor model.
 A B16F1 s.c. Lung LN Distant lymph nodes Colon B B16F1 s.c. Supplementary Figure 1. Deletion of Smad3 prevents B16F1 melanoma invasion and metastasis in a mouse s.c. tumor model. Highly invasive growth
7SK ChIRP-seq is specifically RNA dependent and conserved between mice and humans.
 Supplementary Figure 1 7SK ChIRP-seq is specifically RNA dependent and conserved between mice and humans. Regions targeted by the Even and Odd ChIRP probes mapped to a secondary structure model 56 of the
Supplemental Figure 1
 Supplemental Figure 1 A S100A4: SFLGKRTDEAAFQKLMSNLDSNRDNEVDFQEYCVFLSCIAMMCNEFFEGFPDK Overlap: SF G DE KLM LD N D VDFQEY VFL I M N FF G PD S100A2: SFVGEKVDEEGLKKLMGSLDENSDQQVDFQEYAVFLALITVMCNDFFQGCPDR
Supplementary fig. 1. Crystals induce necroptosis does not involve caspases, TNF receptor or NLRP3. A. Mouse tubular epithelial cells were pretreated
 Supplementary fig. 1. Crystals induce necroptosis does not involve caspases, TNF receptor or NLRP3. A. Mouse tubular epithelial cells were pretreated with zvad-fmk (10µM) and exposed to calcium oxalate
Supplementary Figures
 Supplementary Figures Supplementary Figure 1 Correlation between LKB1 and YAP expression in human lung cancer samples. (a) Representative photos showing LKB1 and YAP immunohistochemical staining in human
ANGPTL2 increases bone metastasis of breast cancer cells through. Tetsuro Masuda, Motoyoshi Endo, Yutaka Yamamoto, Haruki Odagiri, Tsuyoshi
 Masuda et al. Supplementary information for ANGPTL2 increases bone metastasis of breast cancer cells through enhancing CXCR4 signaling Tetsuro Masuda, Motoyoshi Endo, Yutaka Yamamoto, Haruki Odagiri, Tsuyoshi
Supplementary Information
 Supplementary Information Supplementary Figure 1. EBV-gB 23-431 mainly exists as trimer in HEK 293FT cells. (a) Western blotting analysis for DSS crosslinked FLAG-gB 23-431. HEK 293FT cells transfected
Supporting Information
 Supporting Information Palmisano et al. 10.1073/pnas.1202174109 Fig. S1. Expression of different transgenes, driven by either viral or human promoters, is up-regulated by amino acid starvation. (A) Quantification
SUPPLEMENTARY INFORMATION
 DOI: 1.138/ncb222 / b. WB anti- WB anti- ulin Mitotic index (%) 14 1 6 2 T (h) 32 48-1 1 2 3 4 6-1 4 16 22 28 3 33 e. 6 4 2 Time (min) 1-6- 11-1 > 1 % cells Figure S1 depletion leads to mitotic defects
EPIGENETIC RE-EXPRESSION OF HIF-2α SUPPRESSES SOFT TISSUE SARCOMA GROWTH
 EPIGENETIC RE-EXPRESSION OF HIF-2α SUPPRESSES SOFT TISSUE SARCOMA GROWTH Supplementary Figure 1. Supplementary Figure 1. Characterization of KP and KPH2 autochthonous UPS tumors. a) Genotyping of KPH2
p = formed with HCI-001 p = Relative # of blood vessels that formed with HCI-002 Control Bevacizumab + 17AAG Bevacizumab 17AAG
 A.. Relative # of ECs associated with HCI-001 1.4 1.2 1.0 0.8 0.6 0.4 0.2 0.0 ol b p < 0.001 Relative # of blood vessels that formed with HCI-001 1.4 1.2 1.0 0.8 0.6 0.4 0.2 0.0 l b p = 0.002 Control IHC:
Nature Genetics: doi: /ng Supplementary Figure 1
 Supplementary Figure 1 MSI2 interactors are associated with the riboproteome and are functionally relevant. (a) Coomassie blue staining of FLAG-MSI2 immunoprecipitated complexes. (b) GO analysis of MSI2-interacting
TRAF6 ubiquitinates TGFβ type I receptor to promote its cleavage and nuclear translocation in cancer
 Supplementary Information TRAF6 ubiquitinates TGFβ type I receptor to promote its cleavage and nuclear translocation in cancer Yabing Mu, Reshma Sundar, Noopur Thakur, Maria Ekman, Shyam Kumar Gudey, Mariya
Supplemental Table S1. Primers used in qrt-pcr analyses. Supplemental Figure S1, related to Figure 4. Extracellular matrix proteins
 Supplemental Material PDGFRb regulates craniofacial development through homodimers and functional heterodimers with PDGFRa Katherine A. Fantauzzo and Philippe Soriano Supplemental materials provided: Supplemental
33VASTVNGATSANNHGEPPS51PADARPR58
 Pro-rich region Trans-membrane region 214 246 359 381 UL50 1 397 211SSRTAS216PPPPPR222 NLS CR1 CR2 CR3 CR4 UL53 1 376 11RERRS15ALRS19LLRKRRR25 33VASTVNGATSANNHGEPPS51PADARPR58 FIG S1. UL97 phosphorylation
RNA interference induced hepatotoxicity results from loss of the first synthesized isoform of microrna-122 in mice
 SUPPLEMENTARY INFORMATION RNA interference induced hepatotoxicity results from loss of the first synthesized isoform of microrna-122 in mice Paul N Valdmanis, Shuo Gu, Kirk Chu, Lan Jin, Feijie Zhang,
Supplementary Figure S1 Expression of mir-181b in EOC (A) Kaplan-Meier
 Kaplan-Meier") Supplementary Figure S1 Expression of mir-181b in EOC (A) Kaplan-Meier curves for progression-free survival (PFS) and overall survival (OS) in a cohort of patients (N=52) with stage III primary ovarian
Supplementary Figure S1 Expression of mir-181b in EOC (A) Kaplan-Meier curves for progression-free survival (PFS) and overall survival (OS) in a cohort of patients (N=52) with stage III primary ovarian
Bezzi et al., Supplementary Figure 1 *** Nature Medicine: doi: /nm Pten pc-/- ;Zbtb7a pc-/- Pten pc-/- ;Pml pc-/- Pten pc-/- ;Trp53 pc-/-
 Gr-1 Gr-1 Gr-1 Bezzi et al., Supplementary Figure 1 a Gr1-CD11b 3 months Spleen T cells 3 months Spleen B cells 3 months Spleen Macrophages 3 months Spleen 15 4 8 6 c CD11b+/Gr1+ cells [%] 1 5 b T cells
SUPPLEMENTARY INFORMATION
 DOI: 10.1038/ncb2607 Figure S1 Elf5 loss promotes EMT in mammary epithelium while Elf5 overexpression inhibits TGFβ induced EMT. (a, c) Different confocal slices through the Z stack image. (b, d) 3D rendering
SUPPLEMENTARY FIGURES AND TABLES
 SUPPLEMENTARY FIGURES AND TABLES Supplementary Figure S1: CaSR expression in neuroblastoma models. A. Proteins were isolated from three neuroblastoma cell lines and from the liver metastasis of a MYCN-non
Supplementary Table; Supplementary Figures and legends S1-S21; Supplementary Materials and Methods
 Silva et al. PTEN posttranslational inactivation and hyperactivation of the PI3K/Akt pathway sustain primary T cell leukemia viability Supplementary Table; Supplementary Figures and legends S1-S21; Supplementary
Nature Neuroscience: doi: /nn Supplementary Figure 1
 Supplementary Figure 1 EGFR inhibition activates signaling pathways (a-b) EGFR inhibition activates signaling pathways (a) U251EGFR cells were treated with erlotinib (1µM) for the indicated times followed
Supplementary Materials for
 www.sciencesignaling.org/cgi/content/full/8/375/ra41/dc1 Supplementary Materials for Actin cytoskeletal remodeling with protrusion formation is essential for heart regeneration in Hippo-deficient mice
Supplementary Figure 1
 Supplementary Figure 1 YAP negatively regulates IFN- signaling. (a) Immunoblot analysis of Yap knockdown efficiency with sh-yap (#1 to #4 independent constructs) in Raw264.7 cells. (b) IFN- -Luc and PRDs
4. Th1-related gene expression in infected versus mock-infected controls from Fig. 2 with gene annotation.
 List of supplemental information 1. Graph of mouse weight loss during course of infection- Line graphs showing mouse weight data during course of infection days 1 to 10 post-infections (p.i.). 2. Graph
Supplementary Figures
 Supplementary Figures Supplementary Figure 1 DOT1L regulates the expression of epithelial and mesenchymal markers. (a) The expression levels and cellular localizations of EMT markers were confirmed by
Postn MCM Smad2 fl/fl Postn MCM Smad3 fl/fl Postn MCM Smad2/3 fl/fl. Postn MCM. Tgfbr1/2 fl/fl TAC
 A Smad2 fl/fl Smad3 fl/fl Smad2/3 fl/fl Tgfbr1/2 fl/fl 1. mm B Tcf21 MCM Tcf21 MCM Smad3 fl/fl Tcf21 MCM Smad2/3 fl/fl Tcf21 MCM Tgfbr1/2 fl/fl αmhc MCM C 1. mm 1. mm D Smad2 fl/fl Smad3 fl/fl Smad2/3
Supplementary Figure S1: Defective heterochromatin repair in HGPS progeroid cells
 Supplementary Figure S1: Defective heterochromatin repair in HGPS progeroid cells Immunofluorescence staining of H3K9me3 and 53BP1 in PH and HGADFN003 (HG003) cells at 24 h after γ-irradiation. Scale bar,
Supplementary Materials:
 Supplementary Materials: Supplemental Figure 1: Profibrotic markers in wt/wt or ex/ex mouse kidneys 42 days post IRI. The levels of fibronectin and αsma were examined by immunostaining in ADAM17 wt/wt
SUPPLEMENTARY FIGURE LEGENDS
 SUPPLEMENTARY FIGURE LEGENDS Supplementary Figure 1. Hippocampal sections from new-born Pten+/+ and PtenFV/FV pups were stained with haematoxylin and eosin (H&E) and were imaged at (a) low and (b) high
Supplementary Information. Induction of human pancreatic beta cell replication by inhibitors of dual specificity tyrosine regulated kinase
 Journal: Nature Medicine Supplementary Information Induction of human pancreatic beta cell replication by inhibitors of dual specificity tyrosine regulated kinase 1,2 Peng Wang PhD, 1,2 Juan-Carlos Alvarez-Perez
Supplemental Figures
 Supplemental Figures Supplemental Figure 1. Fasting-dependent regulation of the SREBP ortholog SBP-1 and lipid homeostasis mediated by the SIRT1 ortholog SIR-2.1 in C. elegans. (A) Wild-type or sir-2.1(lof)
Figure S1. IRF5 mrna expression is not expressed modulated by steatosis grade in
 9-INS-RG-TR- SUPPLEMENTRY MTERILS B IRF mrn expression 1 Control Fatty liver NSH HCV αsm IRF 1 ERG IRF < -33 33- Steatosis (%) < Figure S1. IRF mrn expression is not expressed modulated by steatosis grade
Supplementary Figure 1
 Supplementary Figure 1 14 12 SEM4C PLXN2 8 SEM4C C 3 Cancer Cell Non Cancer Cell Expression 1 8 6 6 4 log2 ratio Expression 2 1 4 2 2 p value.1 D Supplementary Figure 1. Expression of Sema4C and Plexin2
Supporting Information
 Supporting Information M1 macrophage-derived nanovesicles potentiate the anticancer efficacy of immune checkpoint inhibitors Yeon Woong Choo, 1, Mikyung Kang, 2, Han Young Kim, 1 Jin Han, 1 Seokyung Kang,
Supplementary Figure 1
 Supplementary Figure 1 Asymmetrical function of 5p and 3p arms of mir-181 and mir-30 families and mir-142 and mir-154. (a) Control experiments using mirna sensor vector and empty pri-mirna overexpression
SUPPLEMENTARY INFORMATION
 doi:10.1038/nature12215 Supplementary Figure 1. The effects of full and dissociated GR agonists in supporting BFU-E self-renewal divisions. BFU-Es were cultured in self-renewal medium with indicated GR
Nature Genetics: doi: /ng Supplementary Figure 1. Assessment of sample purity and quality.
 Supplementary Figure 1 Assessment of sample purity and quality. (a) Hematoxylin and eosin staining of formaldehyde-fixed, paraffin-embedded sections from a human testis biopsy collected concurrently with
Supplementary Figure 1. DJ-1 modulates ROS concentration in mouse skeletal muscle.
 Supplementary Figure 1. DJ-1 modulates ROS concentration in mouse skeletal muscle. (a) mrna levels of Dj1 measured by quantitative RT-PCR in soleus, gastrocnemius (Gastroc.) and extensor digitorum longus
SUPPLEMENTARY INFORMATION
 doi:10.1038/nature12652 Supplementary Figure 1. PRDM16 interacts with endogenous EHMT1 in brown adipocytes. Immunoprecipitation of PRDM16 complex by flag antibody (M2) followed by Western blot analysis
Phosphoinositides Regulate Ciliary Protein Trafficking to Modulate Hedgehog Signaling
 Developmental Cell Supplemental Information Phosphoinositides Regulate Ciliary Protein Trafficking to Modulate Hedgehog Signaling Francesc R. Garcia-Gonzalo, Siew Cheng Phua, Elle C. Roberson, Galo Garcia
Supplementary Figures
 Supplementary Figures Supplementary Fig. 1. Galectin-3 is present within tumors. (A) mrna expression levels of Lgals3 (galectin-3) and Lgals8 (galectin-8) in the four classes of cell lines as determined
Supplementary Figure S1. Gene expression analysis of epidermal marker genes and TP63.
 Supplementary Figure Legends Supplementary Figure S1. Gene expression analysis of epidermal marker genes and TP63. A. Screenshot of the UCSC genome browser from normalized RNAPII and RNA-seq ChIP-seq data
Supplementary Figure 1. Confocal immunofluorescence showing mitochondrial translocation of Drp1. Cardiomyocytes treated with H 2 O 2 were prestained
 Supplementary Figure 1. Confocal immunofluorescence showing mitochondrial translocation of Drp1. Cardiomyocytes treated with H 2 O 2 were prestained with MitoTracker (red), then were immunostained with
Hsp90 regulation of fibroblast activation in pulmonary fibrosis
 Downloaded from http:// on January 22, 2018. Hsp90 regulation of fibroblast activation in pulmonary fibrosis Vishwaraj Sontake, 1,4 Yunguan Wang, 2 Rajesh K. Kasam, 1,4 Debora Sinner, 3 Geereddy B. Reddy,
S1a S1b S1c. S1d. S1f S1g S1h SUPPLEMENTARY FIGURE 1. - si sc Il17rd Il17ra bp. rig/s IL-17RD (ng) -100 IL-17RD
 -100 IL-17RD") SUPPLEMENTARY FIGURE 1 0 20 50 80 100 IL-17RD (ng) S1a S1b S1c IL-17RD β-actin kda S1d - si sc Il17rd Il17ra rig/s15-574 - 458-361 bp S1f S1g S1h S1i S1j Supplementary Figure 1. Knockdown of IL-17RD enhances
SUPPLEMENTARY FIGURE 1 0 20 50 80 100 IL-17RD (ng) S1a S1b S1c IL-17RD β-actin kda S1d - si sc Il17rd Il17ra rig/s15-574 - 458-361 bp S1f S1g S1h S1i S1j Supplementary Figure 1. Knockdown of IL-17RD enhances
Supplementary Fig. 1. GPRC5A post-transcriptionally down-regulates EGFR expression. (a) Plot of the changes in steady state mrna levels versus
 Plot of the changes in steady state mrna levels versus") Supplementary Fig. 1. GPRC5A post-transcriptionally down-regulates EGFR expression. (a) Plot of the changes in steady state mrna levels versus changes in corresponding proteins between wild type and Gprc5a-/-
Supplementary Fig. 1. GPRC5A post-transcriptionally down-regulates EGFR expression. (a) Plot of the changes in steady state mrna levels versus changes in corresponding proteins between wild type and Gprc5a-/-
Supplementary Figure 1
 VO (ml kg - min - ) VCO (ml kg - min - ) Respiratory exchange ratio Energy expenditure (cal kg - min - ) Locomotor activity (x count) Body temperature ( C) Relative mrna expression TA Sol EDL PT Heart
Nature Medicine: doi: /nm.4078
 Supplementary Figure 1. Cetuximab induces ER stress response in DiFi cells. (a) Scheme of SILAC proteome. (b) MS-base read out of SILAC experiment. The histogram of log 2 -transformed normalized H/L ratios
Supplementary Figure 1. a. b. Relative cell viability. Nature Genetics: doi: /ng SCR shyap1-1 shyap
 Supplementary Figure 1. a. b. p-value for depletion in vehicle (DMSO) 1e-05 1e-03 1e-01 1 0 1000 2000 3000 4000 5000 Genes log2 normalized shrna counts in T0 0 2 4 6 8 sh1 shluc 0 2 4 6 8 log2 normalized
Fang et al. NMuMG. PyVmT unstained Anti-CCR2-PE MDA-MB MCF MCF10A
 A NMuMG PyVmT 16.5+.5 47.+7.2 Fang et al. unstained Anti-CCR2-PE 4T1 Control 37.6+6.3 56.1+.65 MCF1A 16.1+3. MCF-7 3.1+5.4 MDA-M-231 42.1+5.5 unstained Secondary antibody only Anti-CCR2 SUPPLEMENTAL FIGURE
Supplementary Figure 1. DNA methylation of the adiponectin promoter R1, Pparg2, and Tnfa promoter in adipocytes is not affected by obesity.
 Supplementary Figure 1. DNA methylation of the adiponectin promoter R1, Pparg2, and Tnfa promoter in adipocytes is not affected by obesity. (a) Relative amounts of adiponectin, Ppar 2, C/ebp, and Tnf mrna
Supplementary information. The proton-sensing G protein-coupled receptor T-cell death-associated gene 8
 1 Supplementary information 2 3 The proton-sensing G protein-coupled receptor T-cell death-associated gene 8 4 (TDAG8) shows cardioprotective effects against myocardial infarction 5 Akiomi Nagasaka 1+,
Supplementary Material
 Supplementary Material accompanying the manuscript Interleukin 37 is a fundamental inhibitor of innate immunity Marcel F Nold, Claudia A Nold-Petry, Jarod A Zepp, Brent E Palmer, Philip Bufler & Charles
supplementary information
 DOI: 10.1038/ncb1875 Figure S1 (a) The 79 surgical specimens from NSCLC patients were analysed by immunohistochemistry with an anti-p53 antibody and control serum (data not shown). The normal bronchi served
Supplementary Figure 1 Induction of cellular senescence and isolation of exosome. a to c, Pre-senescent primary normal human diploid fibroblasts
 Supplementary Figure 1 Induction of cellular senescence and isolation of exosome. a to c, Pre-senescent primary normal human diploid fibroblasts (TIG-3 cells) were rendered senescent by either serial passage
Supplemental Table 1. Primer sequences for transcript analysis
 Supplemental Table 1. Primer sequences for transcript analysis Primer Sequence (5 3 ) Primer Sequence (5 3 ) Mmp2 Forward CCCGTGTGGCCCTC Mmp15 Forward CGGGGCTGGCT Reverse GCTCTCCCGGTTTC Reverse CCTGGTGTGCCTGCTC
T H E J O U R N A L O F C E L L B I O L O G Y
 T H E J O U R N A L O F C E L L B I O L O G Y Supplemental material Amelio et al., http://www.jcb.org/cgi/content/full/jcb.201203134/dc1 Figure S1. mir-24 regulates proliferation and by itself induces
SUPPLEMENTARY INFORMATION
 DOI: 1.138/ncb3355 a S1A8 + cells/ total.1.8.6.4.2 b S1A8/?-Actin c % T-cell proliferation 3 25 2 15 1 5 T cells Supplementary Figure 1 Inter-tumoral heterogeneity of MDSC accumulation in mammary tumor
Supplementary information. The Light Intermediate Chain 2 Subpopulation of Dynein Regulates Mitotic. Spindle Orientation
 Supplementary information The Light Intermediate Chain 2 Subpopulation of Dynein Regulates Mitotic Spindle Orientation Running title: Dynein LICs distribute mitotic functions. Sagar Mahale a, d, *, Megha
Gallic acid prevents isoproterenol-induced cardiac hypertrophy and fibrosis through regulation of JNK2 signaling and Smad3 binding activity
 Gallic acid prevents isoproterenol-induced cardiac hypertrophy and fibrosis through regulation of JNK2 signaling and Smad3 binding activity Yuhee Ryu 1,+, Li Jin 1,2+, Hae Jin Kee 1,, Zhe Hao Piao 3, Jae
m 6 A mrna methylation regulates AKT activity to promote the proliferation and tumorigenicity of endometrial cancer
 SUPPLEMENTARY INFORMATION Articles https://doi.org/10.1038/s41556-018-0174-4 In the format provided by the authors and unedited. m 6 A mrna methylation regulates AKT activity to promote the proliferation
Supplemental Figure S1. RANK expression on human lung cancer cells.
 Supplemental Figure S1. RANK expression on human lung cancer cells. (A) Incidence and H-Scores of RANK expression determined from IHC in the indicated primary lung cancer subgroups. The overall expression
fl/+ KRas;Atg5 fl/+ KRas;Atg5 fl/fl KRas;Atg5 fl/fl KRas;Atg5 Supplementary Figure 1. Gene set enrichment analyses. (a) (b)
 (b)") KRas;At KRas;At KRas;At KRas;At a b Supplementary Figure 1. Gene set enrichment analyses. (a) GO gene sets (MSigDB v3. c5) enriched in KRas;Atg5 fl/+ as compared to KRas;Atg5 fl/fl tumors using gene set
KRas;At KRas;At KRas;At KRas;At a b Supplementary Figure 1. Gene set enrichment analyses. (a) GO gene sets (MSigDB v3. c5) enriched in KRas;Atg5 fl/+ as compared to KRas;Atg5 fl/fl tumors using gene set
Title: Epigenetic mechanisms underlying maternal diabetes-associated risk of congenital heart disease
 1 Supplemental Materials 2 3 Title: Epigenetic mechanisms underlying maternal diabetes-associated risk of congenital heart disease 4 5 6 Authors: Madhumita Basu, 1 Jun-Yi Zhu, 2 Stephanie LaHaye 1,3, Uddalak
Supplementary information
 Supplementary information High fat diet-induced changes of mouse hepatic transcription and enhancer activity can be reversed by subsequent weight loss Majken Siersbæk, Lyuba Varticovski, Shutong Yang,
Lentiviral Delivery of Combinatorial mirna Expression Constructs Provides Efficient Target Gene Repression.
 Supplementary Figure 1 Lentiviral Delivery of Combinatorial mirna Expression Constructs Provides Efficient Target Gene Repression. a, Design for lentiviral combinatorial mirna expression and sensor constructs.
Table S1. Primer sequences used for qrt-pcr. CACCATTGGCAATGAGCGGTTC AGGTCTTTGCGGATGTCCACGT ACTB AAGTCCATGTGCTGGCAGCACT ATCACCACTCCGAAGTCCGTCT LCOR
 Table S1. Primer sequences used for qrt-pcr. ACTB LCOR KLF6 CTBP1 CDKN1A CDH1 ATF3 PLAU MMP9 TFPI2 CACCATTGGCAATGAGCGGTTC AGGTCTTTGCGGATGTCCACGT AAGTCCATGTGCTGGCAGCACT ATCACCACTCCGAAGTCCGTCT CGGCTGCAGGAAAGTTTACA
Supplementary Table 1.
 Supplementary Table 1. Expression of genes involved in brown fat differentiation in WAT of db/db mice treated with HDAC inhibitors. Data are expressed as fold change (FC) versus control. symbol FC SAHA
Nature Immunology: doi: /ni.3866
 Nature Immunology: doi:10.1038/ni.3866 Supplementary Figure 1 The effect of TIPE2 on chemotaxis. a, The expression of TIPE2 in dhl-60c, dhl-60t, TIPE2-expressing and 15/16Q-expressing dhl-60t neutrophils
Nature Structural & Molecular Biology: doi: /nsmb Supplementary Figure 1
 Supplementary Figure 1 Effect of HSP90 inhibition on expression of endogenous retroviruses. (a) Inducible shrna-mediated Hsp90 silencing in mouse ESCs. Immunoblots of total cell extract expressing the
Inhibition of DYRK1A stimulates human beta-cell proliferation
 Inhibition of DYRK1A stimulates human beta-cell proliferation Ercument Dirice 1,, Deepika Walpita 2,, Amedeo Vetere 2, Bennett C. Meier 2,5, Sevim Kahraman 1, Jiang Hu 1, Vlado Dančík 2, Sean M. Burns
Supplementary Information File
 Supplementary Information File Supplementary Table 1. List of synthesized sirna sequences for target genes sirna Species Sequence Ctrl sirna mouse sense 5 -UUCUCCGAACGUGUCACGUTT-3 Antisense 5 -ACGUGACACGUUCGGAGAATT-3
a) List of KMTs targeted in the shrna screen. The official symbol, KMT designation,
 List of KMTs targeted in the shrna screen. The official symbol, KMT designation,") Supplementary Information Supplementary Figures Supplementary Figure 1. a) List of KMTs targeted in the shrna screen. The official symbol, KMT designation, gene ID and specifities are provided. Those highlighted
Supplementary Information Supplementary Figures Supplementary Figure 1. a) List of KMTs targeted in the shrna screen. The official symbol, KMT designation, gene ID and specifities are provided. Those highlighted
MII. Supplement Figure 1. CapZ β2. Merge. 250ng. 500ng DIC. Merge. Journal of Cell Science Supplementary Material. GFP-CapZ β2 DNA
 A GV GVBD MI DNA CapZ β2 CapZ β2 Merge B DIC GFP-CapZ β2 Merge CapZ β2-gfp 250ng 500ng Supplement Figure 1. MII A early MI late MI Control RNAi CapZαβ DNA Actin Tubulin B Phalloidin Intensity(A.U.) n=10
Supplementary Figure 1
 Supplementary Figure 1 A B mir-141, human cell lines mir-2c, human cell lines mir-141, hepatocytes mir-2c, hepatocytes Relative RNA.1.8.6.4.2 Relative RNA.3.2.1 Relative RNA 1.5 1..5 Relative RNA 2. 1.5
SUPPLEMENTARY INFORMATION
 1. Supplementary Figures and Legends Supplementary Fig. 1. S1P-mediated transcriptional regulation of integrins expressed in OP/monocytoid cells. Real-time quantitative PCR analyses of mrna for two integrins,
Dynamic Interaction of Stress Granule, DDX3X and IKK-α Mediates Multiple Functions in
 Dynamic Interaction of Stress Granule, and Mediates Multiple Functions in Hepatitis C Virus Infection Véronique Pène, Qisheng Li#, Catherine Sodroski, Ching-Sheng Hsu, T. Jake Liang# Liver Diseases Branch,