Workflows in SIEVE and LipidSearch
|
|
|
- Hector Eaton
- 5 years ago
- Views:
Transcription
1 Workflows in SIEVE and LipidSearch I Orbi The world leader in serving science
2 SIEVE v2.1 S tatistical I terative E xploratory V isualization E nvironment 2 The world leader in serving science


 and normal cell, showing")


 Direct infusion of olive oil using DART, looking for impurities")
3 SIEVE Overview SIEVE is label-free differential software Aids in discovering molecular changes between states Provides semi-quantitative measurement of differentially expressed proteins, metabolites and other compounds correlating with a disease state, drug response or other perturbation Proteomics Biomarker discovery in plasma, tissue, cell culture, urine, saliva Disulfide bond validation in purified protein Quantify samples that contain their own precursor label, similar to SILAC Small Molecules Scanning electron microsope image of a cancerous (left) and normal cell, showing differences in cell brush. Image courtesy Igor Sokolov. Biomarker discovery in plasma, tissue, cell culture, urine, saliva Monitoring drug degradation due to environmental stresses Metabolomic and Lipidomic profiling Ingredient screening in Food and Safety Water purification monitoring Improving agriculture (tomatoes, whiskey, wine, corn) Direct infusion of olive oil using DART, looking for impurities Screening purified therapeutics for environmental and/or product modifications 3
4 Getting Started Minimal system requirements Microsoft Windows Windows 7 32/64 Professional SP1 Windows XP 32 Professional SP1 Microsoft.Net 4.0 (Extended) 2 GHz dual core processor 8 GB RAM or higher 500 GB hard drive Recommended system requirements 3.3 GHz processor 32 GB RAM 1TB RAID performance Installation requires administrator rights Free upgrade from v2.0 to v2.1 via the Thermo Omics Portal Not necessary to uninstall v2.0 4


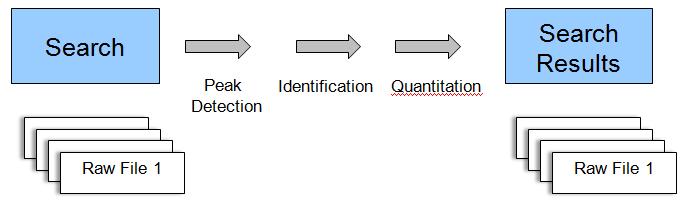
5 SIEVE Analysis Platform Statistically rigorous automated label-free LC/MS differential analysis platform State 1 Raw file Reports: State 2 Raw file State Raw file Workflow Align Detect Identify Components Relative Quantification Statistical Analysis Trend information Identification Applied to: any experiment that compares one group to another 5


6 Creating a SIEVE Experiment Initiate the wizard 6
7 Define Processing Method Select the domain: proteomics or small molecules 7
8 Define Processing Method and Experiment Type Select the detection algorithm: which one? 8
9 Two Signal Detection Algorithms Which One to Use? Application Instrumentation Classic Recursive Base Peak Framing All sample types: Proteomics Small molecules High resolution instrument Low resolution instrument Component Extraction Small molecules (charge state 2) High resolution instrument Experiment Type Trend analysis Control Treated ROC analysis Single class analysis Advanced Processing Limitations Perfect pairs Targeted detection Direct infusion NO background subtraction NO data reduction by isotope and adduct grouping Trend analysis Background subtraction Data reduction by isotope and adduct grouping Requires charge state 2 Requires high resolution data 9

10 SIEVE Workflow Component Extraction Automatically interpret spectra, reduce signal peaks into components [M+H]+ [M+Na]+ [M+K]+ A total of 9 different ions are observed for the same molecule as isotopes and adducts 10

11 Experiment Name Identify experiment name 11

12 Select Raw Files Drag and drop the raw files from the file explorer 12
13 Sort Raw Files Click on the file name to sort the files 13
14 Multiple Solvent Blanks If more than one solvent blank is present then blank files are averaged 14


15 Component Extraction Background Subtraction Sample - Solvent blank = Analyte signals Distinguish analyte signals from noise Background subtraction is automatically performed when solvent blanks are acquired. Irrelevant solvent peaks are removed from the data that eliminates a significant amount of low level noise. ~98% of lower intensity signals are eliminated A significant step in data reduction and a critical part of the new component detection algorithm. 15

16 Scan Raw Files for Data Quality Raw files show no errors 16
 The word blank will enable background subtraction Select alignment reference")
17 Define Analysis Groups Identify group names by separating groups with a space Ratio group is the control group (Fed/Fast) The word blank will enable background subtraction Select alignment reference file 17

18 Define Search Parameters Define retention time, mass range, and m/z width Define frame width for framing experiment Frame width is automatic for component extraction m/z width: 10 ppm is +/- 5 ppm 18

19 Select Scan Filter SIEVE automatically selects the full MS scan type Data with both positive and negative filters needs to be processed separately Used a lock mass? Need to modify the filter string to removing lock mass text Example: FTMS + p ESI Full MS Lock Mass 19

20 Define Main Component Extraction Parameters Review raw data in Qual Browser first Each data set is different requiring different settings Intensity threshold is initially set from the mean intensity of the reference file 20

21 Define Identification Parameters Three search types available: ChemSpider, Database Lookup or Defer 21
22 Identification Parameters ChemSpider Free chemical structure database Over 470 data sources i.e. KEGG, Human Metabolome Database, etc. More than one data source can be used in the identification search when separated by a comma DB Lookup Post peak detection lookup (different from seed file) DB Library Files in csv format Requirement: first column must have neutral exact mass All other columns are optional Defer Can defer this setting in the wizard Identification can be later enabled within the parameters table 22


23 Complete Wizard Setup Save file as.sdb 23

24 Review SIEVE Parameters Before Processing Reference File Check if reference file is displayed If not, enable through raw file collection Scan Filter Exclude lock mass in text string Update If modifications made in the parameters table, UPDATE Then run processing task Align Always align Even if bypassing align step SIEVE is reading in files Multiple instances of software allowed 24

25 Component Extraction - Use of Integration Parameters Peak Detection ICIS Genesis PPD (parameter-less) Peak Integration ICIS Genesis PPD None Peak areas generated Integration reflects entire window Why use? Time Peak Integration ICIS None 25


26 Set Integration Parameters Optimize parameters for chromatographic peaks 26
27 Unaligned Small Molecule Data 27

28 Aligned Small Molecule Data Zoom in by placing a box over area with cursor Zoom out by removing scroll bars 28

29 Frame Report View 29


30 Data Review Options XIC Trend Intensities Peaks 30


31 Frame Report Right click on any column title to access field chooser 31

32 Results Review Options Gel View CVs Displayed by group PCA 32
33 Frames Table Filter Use filter table to reduce the number of components Filter on column headings Filter follows Boolean logic (and, or, not) Example 1: CV_E <20 and CV_H <20 Example 2: Ratio_E < 0.5 or Ratio_E >1.5 Example 3: Pvalue_E <0.05 Example 4: Pick >0 33
34 Additional Tips Each dataset may be different Visually confirm alignment (may need to bypass alignment) Multiple iterations of peak detection may be necessary to optimize peak detection parameters Start with higher threshold and no peak integration for faster review Supplemental information provided Questions? Refer to the Thermo Omics Software Portal 34
35 Lipid Search v Quick Fix release 35 The world leader in serving science
36 LipidSearch Features Automated identification of lipids from biological samples Identification, relative quantitation, alignment Comprehensive database of >1.5 million lipid ions and predicted fragment ions Identification algorithms for product ion, precursor ion, and neutral loss scans Identification ranked by mass tolerance, then matched to predicted fragments and predicted retention time Suitable for multiple approaches for lipid analysis LC or nano-infusion (Shotgun) Untargeted and targeted profiling Compatible with data from various MS systems Thermo Q Exactive, hybrid Orbitrap, and TSQ instruments 36
37 Getting Started Recommended system requirements 64-bit operating system, Microsoft Windows 7/8 Quad- or multi-core CPU, 3 GHz or higher 16 GB RAM or higher 500 GB hard drive or larger (SSD optional) Required programs Thermo Scientific MSFileReader 64-bit (need to uninstall if currently installed) Java runtime environment (JRE 1.6+) Microsoft Visual C 2010 runtime Microsoft Internet Explorer or Google Chrome Web-based graphical interface Installation requires administrator rights 37
38 Getting Started Tomcat Server Adjustable maximum memory allocated to server Installation Edit after installation C:\lipidserach\lipidserach4.0\LipidSearchLauncher\LipidSearchLauncher.ini Documentation User manual, installation instructions, tutorial files (C drive) 38


39 Launcher Initiate the software via the desktop icon Tomcat server Stop and start server here Open to launch LipidSearch Minimize Tomcat server to the taskbar Re-open server by clicking on icon 39

40 License Must request license key to register software Send information to ThermoMSLicensing.com Register key to activate software 40

41 Configuration Modify configuration to improve performance Increase buffer size to 70 80% If using > 3 GHz processor, increase the number of processes for peak detection, identification, and quantification to 4 41
42 LipidSearch Workflow Step 1 Step 2 42

43 Batch Creation for Identification and Quantitation Select raw files to be processed 43

44 Identification Parameters - LC-MS/MS General: Triple Quadrupole Q Exactive: QE or Fusion (HCD) Orbitrap: Fusion (CID, MS 2 /MS 3 ) Recalc Isotope: ON for general search OFF for low abundant ions M-Score is based on the number of matches with product ion peaks in the spectrum 44

45 Quantitation Parameters 45
 FA priority: shows the most likely fatty acid chain combination if lipid isomers have the same score 4) ID Quality: A: lipid class & FA were completely identified B:")
46 Filter Criteria for Displaying Raw File Results 1) Toprank: displays lipids with top score among identified spectra 2) Main node: main isomer peak displays the largest isomer based on intensity, m-score and t-score ) FA priority: shows the most likely fatty acid chain combination if lipid isomers have the same score 4) ID Quality: A: lipid class & FA were completely identified B: lipid class & some FA were identified C: lipid class or FA were identified D: identification by other fragment ions (H 2 0 loss) 46

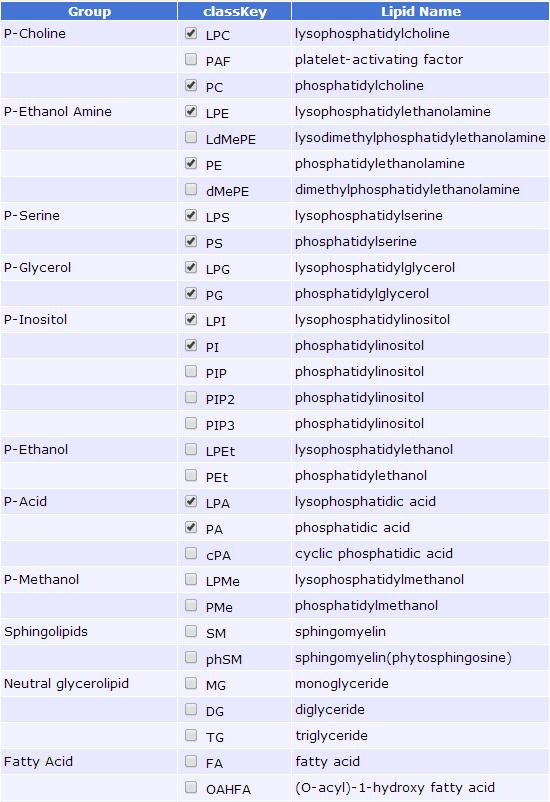
47 Select Lipid Class 47

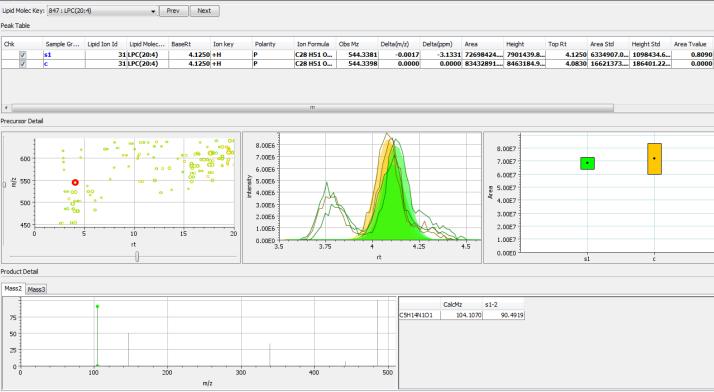
48 Select Adducts 48

49 Submit Batch Successful submission Unsuccessful submission 49
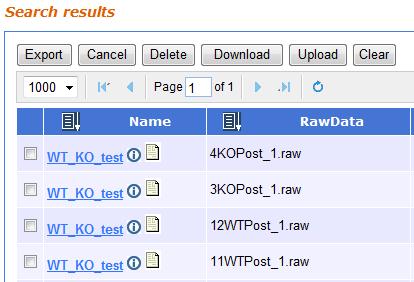
50 Data Processing Search Job List Window Export: Exacts the summary data in the results list Download: Exacts the entire results file 50
51 Data Processing Search Job List Window Identification Number of lipid parameters groups window Identification Number of lipid results ions window 51

52 Identification Results Summary The parameters applied in the filter can be modified then resubmitted with the change filter function This operation can be performed in the job list window or the in the identification results window 52
53 Data Processing Search Job List Window P Peak picking I Identification Q Quantitation 53
54 Data Processing Search Job List Window In queue Active Canceled Successful completion Ended in failure 54
 Number of lipid ions (isomers)")
55 Data Processing Search Job List Window Number of lipid groups (sum composition) Number of lipid ions (isomers) 55
56 Review Identification Results 56

57 Review Identification Results Data sorted by LipidGroup, CalcMz, TopPos 57

58 Review Identification Results t-score: the difference between the theoretical LC-MS retention time (RP) calculated from the lipid computational formula and the actual retention time [lower value increases reliability] m-score: based on the number of matches with product ion peaks in the MS2 spectrum [higher value] Occupancy rate: the ratio of MS2 spectrum peaks assigned to the lipid among all peaks [higher value] Grade: identification quality filter assigned A D based on lipid class or fatty acid identification 58
59 Review Identification Results Mass spectrum Chromatographic peak 59

60 Spectrum Details Screen Data ID Other spectra where this lipid is identified Precursor ion Black = unassigned ions Red = MS2 matched ions Green = MS3 matched ions 60

61 Chromatogram Chart De-noising Smoothing Separating partially overlapped peaks Area score: 0.96 Yellow = integrated area 61
62 Alignment Parameters Set alignment parameters Max peak area is the default Select Mean to obtain group average peak areas 62
 63")
63 Retention Time Tolerance LC Experiment Types: Retention time tolerance threshold for the peak tops of peaks deemed to be the same lipid during alignment r.t.1 r.t.2 > R.T. tolerance If the above is true then the peaks will not be aligned Instead they are two separate records in the results list Example results: LPC (18:1) 63
64 Select Raw Files for Alignment Click select to open the job list tab 64

65 Select Raw Files for Alignment Check box to include raw files to be aligned Click add 65

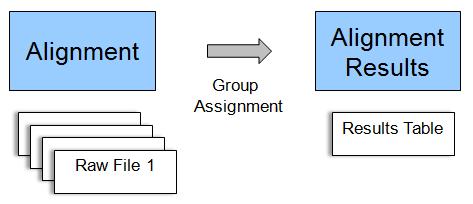
66 Group Allocation Selected files will appear in alignment setup Define control and sample groups In this example, wild type is control and knock out is sample group 1 66


67 Submit Alignment Successful submission 67
")
68 Alignment Jobs List M Merge (Alignment) 68

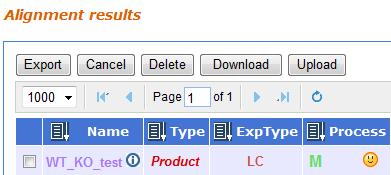
69 Alignment Results Alignment layout is formatted similarly to the identification results Group information can be expanded and collapsed 69

70 Normalization Option Normalization by either internal standard or by individual lipid class 70

71 Lipid Specific Alignment Results 71
72 Acknowledgements Thermo Fisher Scientific Jennifer Sutton David Peake Ralf Tautenhahn Josef Ruzicka 72
73 Supplemental Material for SIEVE 73 The world leader in serving science
74 Define Experiment Type Experiment Types: Two Sample Differential Analysis A simple comparison between two states such as healthy and diseased. A ratio and p-value are calculated. Control Compare Trend This experiment is used for time course analysis or trend type experiments. One of the groups is defined as the control group and the others are compared to this control group. For each trend point, a ratio and p-value are calculated against a control group. Differential Case Study with ROC Analysis This experiment type is used to measure candidate marker s capability of distinguishing between two classes. A large subject group ( 10) is recommended. Technical replicates are also recommended. Non-differential Single Class Analysis Allows for a quick assessment of the data to determine reproducibility and overall quality by using the CV processor. This analysis can also be used with SIEVE s Perfect Pairs tool to find precursor pairs in a single raw file. This algorithm tags pairs of frames that are consistent with a designated mass difference. Applications include PTMs, ion and ion + adduct combinations, SILAC, and other precursor labeling methods. 74
75 Parameter Settings Global Maximum number of threads for processing. Lowering this value on 32 bit computers can bypass memory issues. Change to force calculation if you want to see PCA plot for large experiments. Rawfile collection is where you can add/remove RAWs, change the alignment reference file, change groups, color. After completely the wizard, the user must check to see if the reference file parameter is populated. If a file is not assigned the user must click on the rawfiles (collection) tab and check the reference file in the box that appears, Then select OK and the reference file parameter should display the selected reference file. Retention start and stop can be used to eliminate un wanted data. Bold line parameters are the one that are changed most often Scanfilter is the Full scan type that is used for the analysis. If you have lock mass turned on and you see two full scans in the wizard you need to change this setting before running the analysis to include all of the full scans. Change it so that the string includes FTMS + p ESI Full, in this example. Remove all of the letters after the Full 75
76 Parameter Settings Alignment Check alignment to see if alignment is needed or not. You have the option to bypass alignment if needed. Minimum intensity threshold for alignment Alignment correlation bin size Max retention time shift for alignment step in mins The initial size of a title that correlates basepeak alignment. Bold line parameters are the one that are changed most often 76
77 Parameter Settings Basic Component Signal to background noise threshold for background correction (subtraction). Suppress components that do not meet the Background Signal to Noise criteria. Base peak minimum intensity required for a signal to be considered as a component. Minimum number of scans across a chromatographic peak to be considered. Mass window for XIC in ppm (NOTE: 10ppm = +/- 5 ppm, not +/-10ppm). Base peak minimum intensity requires for a signal to be considered as a component from a targetmzlist experiment. List of component MZ s to force find. Algorithm used to determine peaks ICIS because the parameters can be checked and optimized by looking at the raw data in Qual Browser. Time in mins from a peak apex to restrict seeking another peak. Bold line parameters are the one that are changed most often 77
78 Parameter Settings Frame The condition or trend point that was designated as the control. The control group serves as the denominator for ratio calculations (treatment/control). Algorithm used for second pass peak integration. Default is NONE but if ICIS is used for peak detection the ICIS should be used for peak integration. Parameters for the different integration methods can be found under the Workspace tab at the top of the software. It is recommend that the user look at their data in QualBroswer first and optimize the peak integration parameters (ICIS) and then apply these settings to SIEVE. These parameters are very sensitive to the chromatographic peak shape of the data. Bold line parameters are the one that are changed most often 78
79 Parameter Settings Advanced Component Minimum scans should always remain 2, do not change this setting it is not base peak minimum scans. Skirt minimum basepeak intensity, default should be set to 5 million but varies from instrument to into. 5 million for QE and 2 million for Exactive. Number of points for data smoothing. Bold line parameters are the one that are changed most often 79
80 Parameter Settings Global Identification The charge used for ChemSpider and DBLookup if a charge could not be determined. The maximum number of frames/components to identify. Multiple formulas may be assigned to each component. MinFormulaScore is the minimum number of formulas sent to ChemSpider for identification or sent for pathway analysis. Maximum number of formulas report per component is 10. Select the search type: ChemSpider, DBLookup, None Bold line parameters are the one that are changed most often 80
81 Parameter Settings Accurate Mass Identification ChemSpider identification only: Provide adduct for mass calculation (+nh, -nh +K +Na +NH4 ChemSpider databases used for search. More than one database can be search at a time and should be separated by commas. Browse for the accurate mass library file (csv). Use either COMPMW to find accurate mass ID s based upon component molecular weight, FRAMEMZ to find accurate mass ID s based upon frame MZ, or FORMUAL to id by formula. For COMPMW search type adduct is not necessary. Accurate mass MZ tolerance for DBLookup and ChemSpider searches (ppm). Bold line parameters are the one that are changed most often 81
82 Parameter Settings Optimized Background SN changed to 10 SkirtBPInty set to 5 million Smoothing set to Points 3 Max retention time shift for alignment step in mins. Default setting is 0.2 which is too large in this case to separate isomers. BPMinimumCounts changed to 1 million Time in mins from a peak apex to restrict seeking another peak. Default setting is 0.2 which is too large to separate isomers. Peak Integration is changed from NONE to ICIS. 82

83 Frame Target Wizard Seed File Incorporates a search for target ions of interest Identify.csv file in the setup wizard Alternatively identify.csv file in the parameters table as frame seed file 83

84 Frame Target Wizard Create the.csv file Minimally required columns include MZ, RTStart, and RTStop Additional information can be listed in columns, for example compound name The annotated column can be filtered using the frames table filter 84
85 Frame Target Wizard Assign columns within the.csv file Check the number of entries in the frame parameters table to confirm file is successfully identified 85


86 Normalization If normalizing to a selected frame, make sure the desired m/z frame is highlighted The desired frame is then displayed as the frame to normalize to in the normalize tab 86

87 Alignment and Framing Experiment Associate data by isotopic cluster Select PRElement, PRRoot, and PRSize from the field chooser Sort by PRRoot Tip: filter on PRSize PRElement 0 = 12 C 1 = 13 C 2 = 14 C PRRoot 12 C peak PRSize number of frames per cluster 87

88 Elemental Composition SIEVE can generate up to 10 possible elemental compositions for a given component Each composition is scored and ranked The top ranked composition is listed in the main frame report table Other possible compositions can be viewed in the Flex View tab 88
SIEVE 2.1 Proteomics Example
 SIEVE 2.1 Proteomics Example Software Overview What is SIEVE? SIEVE is Thermo Scientific s differential software solution. SIEVE will continue to enhance our current product for label-free differential
Thermo Scientific LipidSearch Software for Lipidomics Workflows. Automated Identification and Relative. Quantitation of Lipids by LC/MS
 Thermo Scientific LipidSearch Software for Lipidomics Workflows Automated Identification and Relative of Lipids by LC/MS The promise of lipidomics Lipidomics is a new field of study crucial for understanding
New Mass Spectrometry Tools to Transform Metabolomics and Lipidomics
 New Mass Spectrometry Tools to Transform Metabolomics and Lipidomics July.3.13 Ken Miller Vice President of Marketing, Life Sciences Mass Spectrometry 1 The world leader in serving science Omics & the
MS/MS Library Creation of Q-TOF LC/MS Data for MassHunter PCDL Manager
 MS/MS Library Creation of Q-TOF LC/MS Data for MassHunter PCDL Manager Quick Start Guide Step 1. Calibrate the Q-TOF LC/MS for low m/z ratios 2 Step 2. Set up a Flow Injection Analysis (FIA) method for
LC/MS/MS SOLUTIONS FOR LIPIDOMICS. Biomarker and Omics Solutions FOR DISCOVERY AND TARGETED LIPIDOMICS
 LC/MS/MS SOLUTIONS FOR LIPIDOMICS Biomarker and Omics Solutions FOR DISCOVERY AND TARGETED LIPIDOMICS Lipids play a key role in many biological processes, such as the formation of cell membranes and signaling
NON TARGETED SEARCHING FOR FOOD
 NON TARGETED SEARCHING FOR FOOD CONTAMINANTS USING ORBITRAP HIGH RESOLUTION MASS SPECTROMETRY Michal Godula 1, Adrian Charlton 2 and Klaus Mittendorf 1 1 Thermo Fisher Scientific, Dreieich, Germany 2 Food
SimLipid 3.5. Manual PREMIER. Biosoft International Corina Way, Palo Alto, CA Tel: (650) FAX: (650)
 FAX: (650)") SimLipid 3.5 Manual PREMIER Biosoft International 3786 Corina Way, Palo Alto, CA 94303-4504 Tel: (650) 856-2703 FAX: (650) 843-1250 E-mail: sales@premierbiosoft.com Copyright 2003 by PREMIER Biosoft International.
SimLipid 3.5 Manual PREMIER Biosoft International 3786 Corina Way, Palo Alto, CA 94303-4504 Tel: (650) 856-2703 FAX: (650) 843-1250 E-mail: sales@premierbiosoft.com Copyright 2003 by PREMIER Biosoft International.
Discovery Metabolomics - Quantitative Profiling of the Metabolome using TripleTOF Technology
 ANSWERS FOR SCIENCE. KNOWLEDGE FOR LIFE. Discovery Metabolomics - Quantitative Profiling of the Metabolome using TripleTOF Technology Baljit Ubhi Ph.D ASMS Baltimore, June 2014 What is Metabolomics? Also
Agilent Lipidomics. Workflow Guide. MS Data Qualitative Workflow. With MS/MS ID Confirmation. Find features in one file by MFE in MH Qual.
 Agilent Lipidomics Workflow Guide A MS Data Lipidomics Workflows B MS/MS Data Lipidomics Workflows MS Data Qualitative Workflow MS Data Profiling Workflow With MS/MS ID Confirmation MS/MS Data Qualitative
Metabolomic and Proteomics Solutions for Integrated Biology. Christine Miller Omics Market Manager ASMS 2015
 Metabolomic and Proteomics Solutions for Integrated Biology Christine Miller Omics Market Manager ASMS 2015 Integrating Biological Analysis Using Pathways Protein A R HO R Protein B Protein X Identifies
Michal Godula Thermo Fisher Scientific. The world leader in serving science
 Resolving the food authenticity challenges using advanced isotopic ratio and Thermo Scientific Orbitrap high resolution mass spectrometry tools in practice Michal Godula Thermo Fisher Scientific The world
The Agilent MassHunter Software. One Software for all Agilent Mass Spec Systems
 The Agilent MassHunter Software One Software for all Agilent Mass Spec Systems MassHunter The most innovative MS SW! MassHunter Workstation One software for all Agilent MS Systems Minimize learning (and
For personal use only. Please do not reuse or reproduce
 DATA ANALYSIS IN MASS SPECTROMETRY BASED METABOLOMICS Pavel Aronov Stanford Mass Spectrometry Users Meeting September 26, 2011 Presented at the 2011 Stanford Mass Spectrometry t Users Meeting For personal
Don t miss a thing on your peptide mapping journey How to get full coverage peptide maps using high resolution accurate mass spectrometry
 Don t miss a thing on your peptide mapping journey How to get full coverage peptide maps using high resolution accurate mass spectrometry Kai Scheffler, PhD BioPharma Support Expert,LSMS Europe The world
Databehandling. 3. Mark e.g. the first fraction (1: 0-45 min, 2: min, 3; min, 4: min, 5: min, 6: min).
.") Databehandling Data analysis 1. Choose Open in the Data analysis window. 2. Press the Open folder and choose the desired analysis. Click the + button, so that the Chromatograms line appears. Click the
Databehandling Data analysis 1. Choose Open in the Data analysis window. 2. Press the Open folder and choose the desired analysis. Click the + button, so that the Chromatograms line appears. Click the
Metabolite identification in metabolomics: Metlin Database and interpretation of MSMS spectra
 Metabolite identification in metabolomics: Metlin Database and interpretation of MSMS spectra Jeevan K. Prasain, PhD Department of Pharmacology and Toxicology, UAB jprasain@uab.edu Outline Introduction
LiteLink mini USB. Diatransfer 2
 THE ART OF MEDICAL DIAGNOSTICS LiteLink mini USB Wireless Data Download Device Diatransfer 2 Diabetes Data Management Software User manual Table of Contents 1 Introduction... 3 2 Overview of operating
CEU MASS MEDIATOR USER'S MANUAL Version 2.0, 31 st July 2017
 CEU MASS MEDIATOR USER'S MANUAL Version 2.0, 31 st July 2017 1. Introduction... 2 1.1. System Requirements... 2 2. Peak search... 3 2.1. Simple Search... 3 2.2. Advanced Search... 5 2.3. Batch Search...
Metabolite identification in metabolomics: Database and interpretation of MSMS spectra
 Metabolite identification in metabolomics: Database and interpretation of MSMS spectra Jeevan K. Prasain, PhD Department of Pharmacology and Toxicology, UAB jprasain@uab.edu utline Introduction Putative
LC-MS. Pre-processing (xcms) W4M Core Team. 29/05/2017 v 1.0.0
 W4M Core Team. 29/05/2017 v 1.0.0") LC-MS Pre-processing (xcms) W4M Core Team 29/05/2017 v 1.0.0 Acquisition files upload and pre-processing with xcms: extraction, alignment and retention time drift correction. SECTION 1 2 LC-MS Data What
LC-MS Pre-processing (xcms) W4M Core Team 29/05/2017 v 1.0.0 Acquisition files upload and pre-processing with xcms: extraction, alignment and retention time drift correction. SECTION 1 2 LC-MS Data What
SimGlycan. A high-throughput glycan and glycopeptide data analysis tool for LC-, MALDI-, ESI- Mass Spectrometry workflows.
 PREMIER Biosoft SimGlycan A high-throughput glycan and glycopeptide data analysis tool for LC-, MALDI-, ESI- Mass Spectrometry workflows SimGlycan software processes and interprets the MS/MS and higher
AbsoluteIDQ p150 Kit. Targeted Metabolite Identifi cation and Quantifi cation. Bringing our targeted metabolomics expertise to your lab.
 AbsoluteIDQ p150 Kit Targeted Metabolite Identifi cation and Quantifi cation Bringing our targeted metabolomics expertise to your lab. The Biocrates AbsoluteIDQ p150 mass spectrometry Assay Preparation
Quantification with Proteome Discoverer. Bernard Delanghe
 Quantification with Proteome Discoverer Bernard Delanghe Overview: Which approach to use? Proteome Discoverer Quantification Method What When to use Metabolic labeling SILAC Cell culture systems Small
Moving from targeted towards non-targeted approaches
 Gesundheitsdirektion Moving from targeted towards non-targeted approaches Anton Kaufmann Official Food Control Authority of the Canton of Zurich () Switzerland 2 Overview I From single residue to multi
Proteome Discoverer Version 1.3
 Xcalibur Proteome Discoverer Version 1.3 Installation Guide XCALI-97359 Revision A May 2011 2011 Thermo Fisher Scientific Inc. All rights reserved. Xcalibur is a registered trademark of Thermo Fisher Scientific
New Instruments and Services
 New Instruments and Services Liwen Zhang Mass Spectrometry and Proteomics Facility The Ohio State University Summer Workshop 2016 Thermo Orbitrap Fusion http://planetorbitrap.com/orbitrap fusion Thermo
Rapid Lipid Profiling of Serum by Reverse Phase UPLC-Tandem Quadrupole MS
 Rapid Lipid Profiling of Serum by Reverse Phase UPLC-Tandem Quadrupole MS Mark Ritchie and Evelyn Goh Waters Pacific Pte Ltd., Singapore A P P L I C AT ION B E N E F I T S Delivers a rapid 10-min MRM method
Amadeo R. Fernández-Alba
 % of compounds % of compounds % of compounds % of compounds Amadeo R. Fernández-Alba LC-Orbitrap QExactive Focus Instrumental LOQ 1% 9% 8% 7% 6% 5% 4% 3% 2% 1% %.1 mg/g.2 mg/g Tomato.5 mg/g ddms2 Target
Clay Tablet Connector for hybris. User Guide. Version 1.5.0
 Clay Tablet Connector for hybris User Guide Version 1.5.0 August 4, 2016 Copyright Copyright 2005-2016 Clay Tablet Technologies Inc. All rights reserved. All rights reserved. This document and its content
[ APPLICATION NOTE ] High Sensitivity Intact Monoclonal Antibody (mab) HRMS Quantification APPLICATION BENEFITS INTRODUCTION WATERS SOLUTIONS KEYWORDS
![[ APPLICATION NOTE ] High Sensitivity Intact Monoclonal Antibody (mab) HRMS Quantification APPLICATION BENEFITS INTRODUCTION WATERS SOLUTIONS KEYWORDS](/thumbs/79/80328542.jpg "[ APPLICATION NOTE ] High Sensitivity Intact Monoclonal Antibody (mab) HRMS Quantification APPLICATION BENEFITS INTRODUCTION WATERS SOLUTIONS KEYWORDS") Yun Wang Alelyunas, Henry Shion, Mark Wrona Waters Corporation, Milford, MA, USA APPLICATION BENEFITS mab LC-MS method which enables users to achieve highly sensitive bioanalysis of intact trastuzumab
Yun Wang Alelyunas, Henry Shion, Mark Wrona Waters Corporation, Milford, MA, USA APPLICATION BENEFITS mab LC-MS method which enables users to achieve highly sensitive bioanalysis of intact trastuzumab
Supplemental Information. LipiDex: An Integrated Software Package. for High-Confidence Lipid Identification
 Cell Systems, Volume 6 Supplemental Information LipiDex: An Integrated Software Package for High-Confidence Lipid Identification Paul D. Hutchins, Jason D. Russell, and Joshua J. Coon Figure S1. Omics
PedCath IMPACT User s Guide
 PedCath IMPACT User s Guide Contents Overview... 3 IMPACT Overview... 3 PedCath IMPACT Registry Module... 3 More on Work Flow... 4 Case Complete Checkoff... 4 PedCath Cath Report/IMPACT Shared Data...
Thermo Fisher Scientific Inc., San Jose, CA; Bristol Myers Squibb, Princeton, NJ. Vast Scientific, Boston, MA
 Metabolomic Profiling in Drug Discovery: Understanding the Factors that Influence a Metabolomics Study and Strategies to Reduce Biochemical and Chemical Noise Mark Sanders 1 ;Serhiy Hnatyshyn 2 ; Don Robertson
Impact of Chromatography on Lipid Profiling of Liver Tissue Extracts
 Impact of Chromatography on Lipid Profiling of Liver Tissue Extracts Application Note Clinical Research Authors Mark Sartain and Theodore Sana Agilent Technologies, Inc. Santa Clara, California, USA Introduction
Join the mass movement towards mass spectrometry
 Join the mass movement towards mass spectrometry Thermo Scientific ISQ EC single quadrupole mass spectrometer Embrace the power of mass spectrometry Achieving a comprehensive understanding of the samples
How to Use TOF and Q-TOF Mass Spectrometers
 How to Use TOF and Q-TOF Mass Spectrometers October 2011 What do TOF and Q-TOF offer? TOF Fast scanning of full spectrum High resolution full scan spectra Accurate mass measurements Q-TOF Fast scanning
AbsoluteIDQ p180 Kit. Targeted Metabolite Identifi cation and Quantifi cation
 AbsoluteIDQ p180 Kit Targeted Metabolite Identifi cation and Quantifi cation Bringing our targeted metabolomics expertise to your lab. The Biocrates AbsoluteIDQ p180 mass spectrometry Assay Preparation
Increased Identification Coverage and Throughput for Complex Lipidomes
 Increased Identification Coverage and Throughput for Complex Lipidomes Reiko Kiyonami, David Peake, Yingying Huang, Thermo Fisher Scientific, San Jose, CA USA Application Note 607 Key Words Q Exactive
Automating Mass Spectrometry-Based Quantitative Glycomics using Tandem Mass Tag (TMT) Reagents with SimGlycan
 Reagents with SimGlycan") PREMIER Biosoft Automating Mass Spectrometry-Based Quantitative Glycomics using Tandem Mass Tag (TMT) Reagents with SimGlycan Ne uaca2-3galb1-4glc NAcb1 6 Gal NAca -Thr 3 Ne uaca2-3galb1 Ningombam Sanjib
PREMIER Biosoft Automating Mass Spectrometry-Based Quantitative Glycomics using Tandem Mass Tag (TMT) Reagents with SimGlycan Ne uaca2-3galb1-4glc NAcb1 6 Gal NAca -Thr 3 Ne uaca2-3galb1 Ningombam Sanjib
MASS SPECTROMETRY BASED METABOLOMICS. Pavel Aronov. ABRF2010 Metabolomics Research Group March 21, 2010
 MASS SPECTROMETRY BASED METABOLOMICS Pavel Aronov ABRF2010 Metabolomics Research Group March 21, 2010 Types of Experiments in Metabolomics targeted non targeted Number of analyzed metabolites is limited
Targeted and untargeted metabolic profiling by incorporating scanning FAIMS into LC-MS. Kayleigh Arthur
 Targeted and untargeted metabolic profiling by incorporating scanning FAIMS into LC-MS Kayleigh Arthur K.Arthur@lboro.ac.uk Introduction LC-MS is a highly used technique for untargeted profiling analyses
Content Part 2 Users manual... 4
 Content Part 2 Users manual... 4 Introduction. What is Kleos... 4 Case management... 5 Identity management... 9 Document management... 11 Document generation... 15 e-mail management... 15 Installation
Unsupervised Identification of Isotope-Labeled Peptides
 Unsupervised Identification of Isotope-Labeled Peptides Joshua E Goldford 13 and Igor GL Libourel 124 1 Biotechnology institute, University of Minnesota, Saint Paul, MN 55108 2 Department of Plant Biology,
Dexcom CLARITY User Guide For Clinics
 Dexcom CLARITY User Guide For Clinics LBL-014292, Rev 02 To receive a printed version of this manual, contact your local Dexcom representative. 2016 Dexcom, Inc. Page 1 of 36 Table of Contents 1 Introduction
Characterization of an Unknown Compound Using the LTQ Orbitrap
 Characterization of an Unknown Compound Using the LTQ rbitrap Donald Daley, Russell Scammell, Argenta Discovery Limited, 8/9 Spire Green Centre, Flex Meadow, Harlow, Essex, CM19 5TR, UK bjectives unknown
AudioConsole. User Guide. Doc. No EN/01 Part No EN
 AudioConsole Doc. No. 7-50-2180-EN/01 Part No. 7-50-21800-EN Copyright notice [2003], 2018 Inmedico A/S. All rights reserved. Oscilla is aregistered trademark of Inmedico A/S in the U.S.A. and/or other
for new contaminants at ultra trace level by using high resolution mass spectrometry
 Non-targeted screening for new contaminants at ultra trace level by using high resolution mass spectrometry Dr Igor Fochi LSMS Product Specialist Thermo Fisher Scientific What is Environmental Analysis
OneTouch Reveal Web Application. User Manual for Healthcare Professionals Instructions for Use
 OneTouch Reveal Web Application User Manual for Healthcare Professionals Instructions for Use Contents 2 Contents Chapter 1: Introduction...4 Product Overview...4 Intended Use...4 System Requirements...
METABOSCAPE A METABOLITE PROFILING PIPELINE DRIVEN BY AUTOMATIC COMPOUND IDENTIFICATION
 METABOSCAPE A METABOLITE PROFILING PIPELINE DRIVEN BY AUTOMATIC COMPOUND IDENTIFICATION OR W TO LINK HRAM QTOF PLANT METABOLOMICS DATA TO BIOLOGY Aiko Barsch, Bruker Daltonics, Bremen, Germany 1 Outline
ATLANTIS WebOrder. ATLANTIS ISUS User guide
 ATLANTIS WebOrder ATLANTIS ISUS User guide Contents ATLANTIS WebOrder Entering an ATLANTIS ISUS order 3 ATLANTIS ISUS implant suprastructures 4 ATLANTIS ISUS Bar 5 ATLANTIS ISUS Bridge 7 ATLANTIS ISUS
Lipid annotation with MS2Analyzer. Yan Ma 10/24/2013
 Lipid annotation with MS2Analyzer Yan Ma 10/24/2013 Checklist before you start You need to have: 1.A computer with Java environment and Office(2003 or higher) 2.MS/MS spectra in MGF files 3.Latest version
The Comparison of High Resolution MS with Triple Quadrupole MS for the Analysis of Oligonucleotides
 The Comparison of High Resolution MS with Triple Quadrupole MS for the Analysis of Oligonucleotides Mohammed Abrar Unilabs York Bioanalytical Solutions Outline Introduction Why LC-MS/MS? Limitations of
Supporting Information. Lysine Propionylation to Boost Proteome Sequence. Coverage and Enable a Silent SILAC Strategy for
 Supporting Information Lysine Propionylation to Boost Proteome Sequence Coverage and Enable a Silent SILAC Strategy for Relative Protein Quantification Christoph U. Schräder 1, Shaun Moore 1,2, Aaron A.
Identification & Confirmation of Structurally Related Degradation Products of Simvastatin
 Identification & Confirmation of Structurally Related Degradation Products of Simvastatin Power of QTRAP Systems for Identification and Confirmation of Degradation Products Dilip Reddy 1, Chandra Sekar
Lionbridge Connector for Hybris. User Guide
 Lionbridge Connector for Hybris User Guide Version 2.1.0 November 24, 2017 Copyright Copyright 2017 Lionbridge Technologies, Inc. All rights reserved. Published in the USA. March, 2016. Lionbridge and
Application Note # LCMS-89 High quantification efficiency in plasma targeted proteomics with a full-capability discovery Q-TOF platform
 Application Note # LCMS-89 High quantification efficiency in plasma targeted proteomics with a full-capability discovery Q-TOF platform Abstract Targeted proteomics for biomarker verification/validation
Supporting information
 Supporting information A novel lipidomics workflow for improved human plasma identification and quantification using RPLC-MSn methods and isotope dilution strategies Evelyn Rampler 1,2,3, Angela Criscuolo
NIH Public Access Author Manuscript J Proteome Res. Author manuscript; available in PMC 2014 July 05.
 NIH Public Access Author Manuscript Published in final edited form as: J Proteome Res. 2013 July 5; 12(7): 3071 3086. doi:10.1021/pr3011588. Evaluation and Optimization of Mass Spectrometric Settings during
Mass Spectrometry based metabolomics
 Mass Spectrometry based metabolomics Metabolomics- A realm of small molecules (
Dexcom CLARITY User Guide For Clinics
 Dexcom CLARITY User Guide For Clinics LBL-013732, Rev 7 2016-2017 Dexcom, Inc. Page 1 of 41 Table of Contents 1 Introduction to Dexcom CLARITY... 5 1.1 Intended Use/Safety Statement... 5 1.2 Computer and
QSTAR Operation. May 3, Bob Seward
 QSTAR Operation May 3, 2005 Bob Seward Presentation CD Contents QSTAR Hardware QSTAR Schematic 10-7 torr QSTAR Schematic Chernushevich et al, JMS 2001, 36: 849-865 Curtain Plate ESI Source ESI Source Curtain
BlueBayCT - Warfarin User Guide
 BlueBayCT - Warfarin User Guide December 2012 Help Desk 0845 5211241 Contents Getting Started... 1 Before you start... 1 About this guide... 1 Conventions... 1 Notes... 1 Warfarin Management... 2 New INR/Warfarin
Go beyond. to realities unexplored. Comprehensive workflows, integrated solutions
 Go beyond to realities unexplored Comprehensive workflows, integrated solutions We re committed to helping researchers and scientists in academia and industry harness the power of metabolomics to gain
Impurity Identification using a Quadrupole - Time of Flight Mass Spectrometer QTOF
 Impurity Identification using a Quadrupole - Time of Flight Mass Spectrometer QTOF PUSHER TOF DETECTOR ZSPRAY TM Ion Source SAMPLING CONE SKIMMER RF HEXAPOLE RF HEXAPOLE QUADRUPOLE IN NARROW BANDPASS MODE
INTRODUCTION CH 3 CH CH 3 3. C 37 H 48 N 6 O 5 S 2, molecular weight Figure 1. The Xevo QTof MS System.
 Fast and Sensitive in vitro Metabolism Study of Rate and Routes of Clearance for Ritonavir using UPLC CUPLED with the Xevo QTof MS System Jose Castro-Perez, Kate Yu, John Shockcor, Henry Shion, Emma Marsden-Edwards,
Primary Structure Analysis. Automated Evaluation. LC-MS Data Sets
 Primary Structure Analysis by Automated Evaluation of LC-MS Data Sets Mass Spec 29 Dr. Wozny, MassMap GmbH & Co. KG 1 LC-MS Peptide Mapping Origin of Signals Peptides with and without post-translational
Automated Lipid Identification Using UPLC/HDMS E in Combination with SimLipid
 Automated Lipid Identification Using UPLC/HDMS E in Combination with SimLipid Giorgis Isaac, Stephen McDonald, Giuseppe Astarita Waters Corporation, Milford, MA, USA A P P L I C AT ION B E N E F I T S
Introduction to the Oligo HTCS Systems. Novatia, LLC
 Introduction to the Oligo HTCS Systems Novatia, LLC What is the Oligo HTCS and what can it do? Automated ESI/MS system that can analyze up to 14 oligonucleotide samples/day (>3/day with twin autosampler)
Research to Routine Workflows for Large and Small Molecules using the Q Exactive HR/MS
 Research to Routine Workflows for Large and Small Molecules using the Q Exactive HR/MS Sept. 22, 2011 Patrick Bennett Director Pharma Strategic Marketing Thermo Fisher Scientific Agenda Definitions Research
MassBank User s Manual
 MassBank User s Manual Version 2.4, 7 February 2012 Copyright 2006 MassBank Project CONTENTS 1. Introduction... 3 1.1 Overview of the Database Services... 3 1.2 System Requirements... 3 2. Searching for
Advancing your Forensic Toxicology Analyses; Adopting the Latest in Mass Spectrometry Innovations
 Advancing your Forensic Toxicology Analyses; Adopting the Latest in Mass Spectrometry Innovations For Research Use Only. Not for use in diagnostic procedures. 1 2015 AB Sciex RUO-MKT-11-1018-A For research
Data Management System (DMS) User Guide
 User Guide") Data Management System (DMS) User Guide Eversense and the Eversense logo are trademarks of Senseonics, Incorporated. Other brands and their products are trademarks or registered trademarks of their respective
Data Management System (DMS) User Guide Eversense and the Eversense logo are trademarks of Senseonics, Incorporated. Other brands and their products are trademarks or registered trademarks of their respective
USER GUIDE: NEW CIR APP. Technician User Guide
 USER GUIDE: NEW CIR APP. Technician User Guide 0 Table of Contents 1 A New CIR User Interface Why?... 3 2 How to get started?... 3 3 Navigating the new CIR app. user interface... 6 3.1 Introduction...
Ultra Performance Liquid Chromatography Coupled to Orthogonal Quadrupole TOF MS(MS) for Metabolite Identification
 for Metabolite Identification") 22 SEPARATION SCIENCE REDEFINED MAY 2005 Ultra Performance Liquid Chromatography Coupled to Orthogonal Quadrupole TOF MS(MS) for Metabolite Identification In the drug discovery process the detection and
22 SEPARATION SCIENCE REDEFINED MAY 2005 Ultra Performance Liquid Chromatography Coupled to Orthogonal Quadrupole TOF MS(MS) for Metabolite Identification In the drug discovery process the detection and
Latest Innovations in LC/MS/MS from Waters for Metabolism and Bioanalytical Applications
 Latest Innovations in LC/MS/MS from Waters for Metabolism and Bioanalytical Applications Ignatius J. Kass Senior Field Marketing Manager Pharmaceutical MS Challenges in Pharmaceutical Sample Analysis Quantitative
SYNAPT G2-S High Definition MS (HDMS) System
 System") SYNAPT G2-S High Definition MS (HDMS) System High performance, versatility, and workflow efficiency of your MS system all play a crucial role in your ability to successfully reach your scientific and business
SYNAPT G2-S High Definition MS (HDMS) System High performance, versatility, and workflow efficiency of your MS system all play a crucial role in your ability to successfully reach your scientific and business
AB Sciex QStar XL. AIMS Instrumentation & Sample Report Documentation. chemistry
 Mass Spectrometry Laboratory AIMS Instrumentation & Sample Report Documentation AB Sciex QStar XL chemistry UNIVERSITY OF TORONTO AIMS Mass Spectrometry Laboratory Department of Chemistry, University of
Rapid, Simple Impurity Characterization with the Xevo TQ Mass Spectrometer
 Robert Plumb, Michael D. Jones, and Marian Twohig Waters Corporation, Milford, MA, USA INTRODUCTION The detection and characterization of impurities and degradation products of an active pharmaceutical
Automated Purification and Analytical Reinjection of a Small Molecule Drug, Probenecid, on a Gilson LC/MS Dual Function System
 Automated Purification and Analytical Reinjection of a Small Molecule Drug, Probenecid, on a Gilson LC/MS Dual Function System Keywords Introduction Application Note PHA0413 High Pressure Liquid Chromatography
Supporting information
 Supporting information Figure legends Supplementary Table 1. Specific product ions obtained from fragmentation of lithium adducts in the positive ion mode comparing the different positional isomers of
Qualys PC/SCAP Auditor
 Qualys PC/SCAP Auditor Getting Started Guide November 15, 2017 COPYRIGHT 2011-2017 BY QUALYS, INC. ALL RIGHTS RESERVED. QUALYS AND THE QUALYS LOGO ARE REGISTERED TRADEMARKS OF QUALYS, INC. ALL OTHER TRADEMARKS
Agilent Solutions for Lipidomics. Greater Insight into
 Agilent Solutions for Lipidomics Greater Insight into Lipid Metabolism Understanding Lipidomics What is Lipidomics? The term "lipidome" refers to all the lipids that exist in an organism and their effects
Profiling Analysis of Polysulfide Silane Coupling Agent
 C146-E154 Profiling Analysis of Polysulfide lane Coupling Agent Technical Report vol.42 1. Introduction Recently, in line with the oil-conservation movement, silica, as a non-petroleum resource, is increasingly
More structural information with MS n
 PRODUCT SPECIFICATIONS The LTQ XL linear ion trap mass spectrometer More structural information with MS n The LTQ XL linear ion trap mass spectrometer delivers more structural information faster and with
Figure S6. A-J) Annotated UVPD mass spectra for top ten peptides found among the peptides identified by Byonic but not SEQUEST + Percolator.
 Annotated UVPD mass spectra for top ten peptides found among the peptides identified by Byonic but not SEQUEST + Percolator.") Extending Proteome Coverage by Combining MS/MS Methods and a Modified Bioinformatics Platform adapted for Database Searching of Positive and Negative Polarity 193 nm Ultraviolet Photodissociation Mass
Extending Proteome Coverage by Combining MS/MS Methods and a Modified Bioinformatics Platform adapted for Database Searching of Positive and Negative Polarity 193 nm Ultraviolet Photodissociation Mass
LC/QTOF Discovery of Previously Unreported Microcystins in Alberta Lake Waters
 LC/QTOF Discovery of Previously Unreported Microcystins in Alberta Lake Waters Ralph Hindle Vogon Laboratory Services Ltd. Cochrane, Alberta, Canada Xu Zhang David W. Kinniburgh Alberta Centre for Toxicology
Phospholipid characterization by a TQ-MS data based identification scheme
 P-CN1716E Phospholipid characterization by a TQ-MS data based identification scheme ASMS 2017 MP-406 Tsuyoshi Nakanishi 1, Masaki Yamada 1, Ningombam Sanjib Meitei 2, 3 1 Shimadzu Corporation, Kyoto, Japan,
Towards High Resolution MS in Regulated Bioanalysis
 Towards High Resolution MS in Regulated Bioanalysis Benno Ingelse MSD 3 rd EB focus meeting June 12 th 13 th Brussels, Belgium Contributors Gary Adamson Ken Anderson Kevin Bateman Cynthia Chavez-Eng Inhou
The use of mass spectrometry in lipidomics. Outlines
 The use of mass spectrometry in lipidomics Jeevan Prasain jprasain@uab.edu 6-2612 utlines Brief introduction to lipidomics Analytical methodology: MS/MS structure elucidation of phospholipids Phospholipid
Dexcom CLARITY User Guide For Clinics
 Dexcom CLARITY User Guide For Clinics LBL013732 Rev 13 2016-2019 Dexcom, Inc. Page 1 of 32 Table of Contents 1 Introduction to Dexcom CLARITY... 5 1.1 Intended Use/Safety Statement... 5 1.2 Computer and
IMPaLA tutorial.
 IMPaLA tutorial http://impala.molgen.mpg.de/ 1. Introduction IMPaLA is a web tool, developed for integrated pathway analysis of metabolomics data alongside gene expression or protein abundance data. It
Dexcom CLARITY User Guide
 Dexcom CLARITY User Guide LBL-012828, Rev 16 2016-2017 Dexcom, Inc. Page 1 of 35 Table of Contents 1 Introduction to Dexcom CLARITY... 4 1.1 Intended Use/Safety Statement... 4 1.2 Computer and Internet
OncoPPi Portal A Cancer Protein Interaction Network to Inform Therapeutic Strategies
 OncoPPi Portal A Cancer Protein Interaction Network to Inform Therapeutic Strategies 2017 Contents Datasets... 2 Protein-protein interaction dataset... 2 Set of known PPIs... 3 Domain-domain interactions...
Benefits and Characteristic Applications of High Resolution GC/MS and LC/MS. Frank David RIC and Ghent University
 Benefits and Characteristic Applications of High Resolution GC/MS and LC/MS. Frank David RIC and Ghent University Mass Spectrometry Structure Elucidation Selective and Sensitive Detection Identification
Chapter 1. Introduction
 Chapter 1 Introduction 1.1 Motivation and Goals The increasing availability and decreasing cost of high-throughput (HT) technologies coupled with the availability of computational tools and data form a
The Hospital Anxiety and Depression Scale Guidance and Information
 The Hospital Anxiety and Depression Scale Guidance and Information About Testwise Testwise is the powerful online testing platform developed by GL Assessment to host its digital tests. Many of GL Assessment
How Immunisations work in Best Practice?
 How Immunisations work in Best Practice? There are a number of areas in Best Practice related to Immunisations:- Recording and updating Immunisation records Searching and Printing Immunisations List Printing
Mass Spectrometry Infrastructure
 Mass Spectrometry Infrastructure Todd Williams, Ph.D. Director KU Mass Spectrometry and Analytical Proteomics Laboratory Mass Spectrometry Lab B025 Malott Hall Mission The Mass Spectrometry and analytical
User Guide. Protein Clpper. Statistical scoring of protease cleavage sites. 1. Introduction Protein Clpper Analysis Procedure...
 User Guide Protein Clpper Statistical scoring of protease cleavage sites Content 1. Introduction... 2 2. Protein Clpper Analysis Procedure... 3 3. Input and Output Files... 9 4. Contact Information...
Probability-Based Protein Identification for Post-Translational Modifications and Amino Acid Variants Using Peptide Mass Fingerprint Data
 Probability-Based Protein Identification for Post-Translational Modifications and Amino Acid Variants Using Peptide Mass Fingerprint Data Tong WW, McComb ME, Perlman DH, Huang H, O Connor PB, Costello