Simple Linear Regression
|
|
|
- Blanche Wiggins
- 5 years ago
- Views:
Transcription

1 Simple Linear Regression Assoc. Prof Dr Sarimah Abdullah Unit of Biostatistics & Research Methodology School of Medical Sciences, Health Campus Universiti Sains Malaysia
2 Regression Regression analysis is a statistical tool that utilizes the relationship between variables so that one variable can be predicted from the other, or others Uses a variable (x) to predict some outcome variable (y) values in y change as a function of changes in values of x
3 Simple Linear Regression SIMPLE (SLR) Only ONE independent variable vs ONE dependent variable Age Cholesterol Duration of Jogging BMI Amount salt intake Blood pressure Mothers weight Birthweight of babies
4 Simple Linear Regression To explore the nature of the relationship between two continuous variable To investigate the change in response How much the value Y (dependent variable) varies with one unit of change in value X (independent variable) Y = a+bx Y = ß 0 +ß 1 x 1 a: an intercept of the regression line b: a slope of the line - amount of change in Y for a unit change in X B (slope)
5 Regression coefficient (r) is the constant (a) that represents the rate of change of one variable (y) as a function of changes in the other (x) the slope of the regression line
6 Regression coefficient (r) r>0 r<0 r=0
7 Coefficient of determination (r 2 ) It provides a measure of how well future outcomes are likely to be predicted by the model how much the independent x is explained by dependent y = Correlation coefficient in SLR ranges from 0 to 1
8
9 Steps in analysis Simple Linear Regression 1. Data exploration - descriptive statistics 2. Fit least square line 3. Check fitness of the regression model (r 2 ) 4. slope of the regression line (b or slope) 5. Check residual diagnostic (LINE assumption) 6. Interpretation and Presentation 7. Prediction
10 Simple linear Regression Hands on Please open Cholesterol_SLR.sav RQ: What is the relationship between age and cholesterol level among patients with familial hyperlipidemia?

 Check")

11 Steps in analysis : Step 1. Data exploration (scatter plot) Check for: - Minimum - Maximum - Distribution - Relationship - outliers

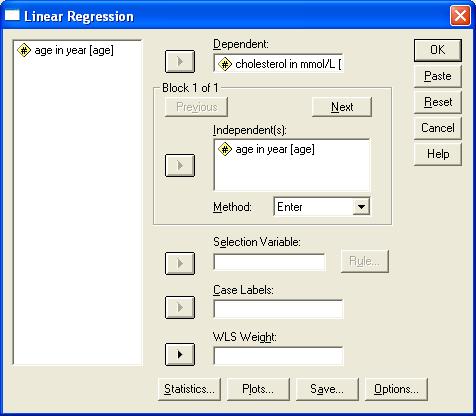
12 Step 2. Fit least square line Double clicks cholesterol in mmol/l age in year
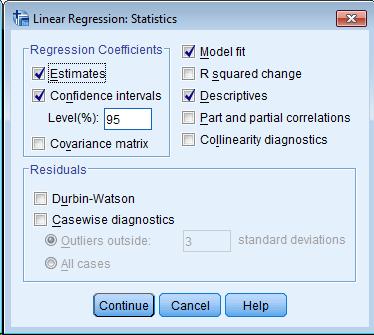
13 Step 3. Check fitness of the regression model (r 2 )
14 Step 3. Check fitness of the regression model (r 2 ) 10.9% of variability of cholesterol is explained by age

15 Step 4. slope of the regression line (b or slope)
16 Step 4. slope of the regression line (b or slope) Model 1 Model 1 Regression Residual Total ANOVA b Sum of Squares df Mean Square F Sig a a. Predictors: (Constant), age in year b. Dependent Variable: cholesterol in mmol/l (Constant) age in year Unstandardized Coefficients a. Dependent Variable: cholesterol in mmol/l Coefficients a Standardized Coefficients 95% Confidence Interval for B B Std. Error Beta t Sig. Lower Bound Upper Bound Regression equation: Y = ß 0 +ß 1 x 1 a: 5.90 b: 0.06 Cholesterol = (0.06*age)
17 Step 5: Check residual diagnostic (LINE assumption) ASSUMPTIONS CHECKING i. Linearity - overall fitness Scatter plot ii. Equal variance Residual Vs predicted iii. Normality of residuals Histogram iv. Linearity of each independent variable. Scatter plot Residual Vs each independent variable v Independent observation Design Other assumptions: *Random sample *Independent observation


18 i. Overall linearity and Equal variance Before checking overall linearity Need to create the predicted values and residuals from dataset 18


19 i. Overall linearity and Equal variance 19


20 ii. Normality or residuals 20


21 i. Linearity and Equal variance 21
22 Simple linear Regression - Interpretation and Presentation Independent variable SLR a b* (95% CI) P value Age (years) 0.06 (0.02, 0.09) r 2 =10.9 % a simple linear regression ( dependent variable: cholesterol mmol/l) *b = crude regression coefficient Increasing of one year of age will increase 0.06 mmol/l of serum cholesterol (0.02, 0.09, p=0.002)
23 Prediction Y = a+bx Y = ß 0 +ß 1 x 1 a: 5.90 b: 0.06 Cholesterol = (0.06*age) If age 60, the predicted cholesterol = 5.9+(0.06*30) = 7.7
24 Simple linear Regression PRACTICE Please open SLR2.sav
25 Simple Linear Regression Duration of exercise Regression equation: Y = ß 0 +ß 1 x 1 a: 10.8 b: Cholesterol = (-0.62*exercise) Increasing of one unit of exercise will reduce 0.62 mmol/l of serum cholesterol (-0.77, -0.46, p<0.001)
26 Simple Linear Regression Diet inventory score Regression equation: Y = ß 0 +ß 1 x 1 a: 6.0 b: 0.45 Cholesterol = (0.45*diet) Increasing of one unit of diet will increase 0.45 mmol/l of serum cholesterol (0.30, 0.60, p<0.001)
27 Simple Linear Regression Socio-economic index Regression equation: Y = ß 0 +ß 1 x 1 a: 5.8 b: 0.21 Cholesterol = (0.21*diet) Increasing of one unit of SE index will increase 0.21 mmol/l of serum cholesterol (0.17, 0.25, p<0.001)
28 Simple Linear Regression SIMPLE (SLR) Only ONE independent variable age Cholesterol diet Cholesterol Exercise Cholesterol Socio-economic Cholesterol
29 Simple linear Regression - Interpretation and Presentation Independent variable SLR a b* (95% CI) P value Age (years) 0.06 (0.02, 0.09) Duration of exercise (-0.79, -0.46) <0.001 (hrs/wk) Diet inventory score 0.45 (0.30, 0.61) <0.001 Socio-economic index 0.21 (0.17, 0.25) <0.001 a simple linear regression ( dependent variable: cholesterol mmol/l) *b = crude regression coefficient Y = ß 0 +ß 1 X 1
30 g{tç~ çéâ
MMI 409 Spring 2009 Final Examination Gordon Bleil. 1. Is there a difference in depression as a function of group and drug?
 MMI 409 Spring 2009 Final Examination Gordon Bleil Table of Contents Research Scenario and General Assumptions Questions for Dataset (Questions are hyperlinked to detailed answers) 1. Is there a difference
Regression Including the Interaction Between Quantitative Variables
 Regression Including the Interaction Between Quantitative Variables The purpose of the study was to examine the inter-relationships among social skills, the complexity of the social situation, and performance
Simple Linear Regression One Categorical Independent Variable with Several Categories
 Simple Linear Regression One Categorical Independent Variable with Several Categories Does ethnicity influence total GCSE score? We ve learned that variables with just two categories are called binary
NORTH SOUTH UNIVERSITY TUTORIAL 2
 NORTH SOUTH UNIVERSITY TUTORIAL 2 AHMED HOSSAIN,PhD Data Management and Analysis AHMED HOSSAIN,PhD - Data Management and Analysis 1 Correlation Analysis INTRODUCTION In correlation analysis, we estimate
CRITERIA FOR USE. A GRAPHICAL EXPLANATION OF BI-VARIATE (2 VARIABLE) REGRESSION ANALYSISSys
 REGRESSION ANALYSISSys") Multiple Regression Analysis 1 CRITERIA FOR USE Multiple regression analysis is used to test the effects of n independent (predictor) variables on a single dependent (criterion) variable. Regression tests
Multiple Regression Analysis 1 CRITERIA FOR USE Multiple regression analysis is used to test the effects of n independent (predictor) variables on a single dependent (criterion) variable. Regression tests
CHAPTER TWO REGRESSION
 CHAPTER TWO REGRESSION 2.0 Introduction The second chapter, Regression analysis is an extension of correlation. The aim of the discussion of exercises is to enhance students capability to assess the effect
Regression. Page 1. Variables Entered/Removed b Variables. Variables Removed. Enter. Method. Psycho_Dum
 Regression Model Variables Entered/Removed b Variables Entered Variables Removed Method Meds_Dum,. Enter Psycho_Dum a. All requested variables entered. b. Dependent Variable: Beck's Depression Score Model
Pitfalls in Linear Regression Analysis
 Pitfalls in Linear Regression Analysis Due to the widespread availability of spreadsheet and statistical software for disposal, many of us do not really have a good understanding of how to use regression
Daniel Boduszek University of Huddersfield
 Daniel Boduszek University of Huddersfield d.boduszek@hud.ac.uk Introduction to Multiple Regression (MR) Types of MR Assumptions of MR SPSS procedure of MR Example based on prison data Interpretation of
Simple Linear Regression the model, estimation and testing
 Simple Linear Regression the model, estimation and testing Lecture No. 05 Example 1 A production manager has compared the dexterity test scores of five assembly-line employees with their hourly productivity.
1.4 - Linear Regression and MS Excel
 1.4 - Linear Regression and MS Excel Regression is an analytic technique for determining the relationship between a dependent variable and an independent variable. When the two variables have a linear
Chapter 11 Multiple Regression
 Chapter 11 Multiple Regression PSY 295 Oswald Outline The problem An example Compensatory and Noncompensatory Models More examples Multiple correlation Chapter 11 Multiple Regression 2 Cont. Outline--cont.
Linear Regression in SAS
 1 Suppose we wish to examine factors that predict patient s hemoglobin levels. Simulated data for six patients is used throughout this tutorial. data hgb_data; input id age race $ bmi hgb; cards; 21 25
ANOVA in SPSS (Practical)
") ANOVA in SPSS (Practical) Analysis of Variance practical In this practical we will investigate how we model the influence of a categorical predictor on a continuous response. Centre for Multilevel Modelling
ANOVA in SPSS (Practical) Analysis of Variance practical In this practical we will investigate how we model the influence of a categorical predictor on a continuous response. Centre for Multilevel Modelling
SPSS output for 420 midterm study
 Ψ Psy Midterm Part In lab (5 points total) Your professor decides that he wants to find out how much impact amount of study time has on the first midterm. He randomly assigns students to study for hours,
Choosing a Significance Test. Student Resource Sheet
 Choosing a Significance Test Student Resource Sheet Choosing Your Test Choosing an appropriate type of significance test is a very important consideration in analyzing data. If an inappropriate test is
Study Guide #2: MULTIPLE REGRESSION in education
 Study Guide #2: MULTIPLE REGRESSION in education What is Multiple Regression? When using Multiple Regression in education, researchers use the term independent variables to identify those variables that
WELCOME! Lecture 11 Thommy Perlinger
 Quantitative Methods II WELCOME! Lecture 11 Thommy Perlinger Regression based on violated assumptions If any of the assumptions are violated, potential inaccuracies may be present in the estimated regression
SPSS output for 420 midterm study
 Ψ Psy Midterm Part In lab (5 points total) Your professor decides that he wants to find out how much impact amount of study time has on the first midterm. He randomly assigns students to study for hours,
Overview of Lecture. Survey Methods & Design in Psychology. Correlational statistics vs tests of differences between groups
 Survey Methods & Design in Psychology Lecture 10 ANOVA (2007) Lecturer: James Neill Overview of Lecture Testing mean differences ANOVA models Interactions Follow-up tests Effect sizes Parametric Tests
Simple Linear Regression: Prediction. Instructor: G. William Schwert
 APS 425 Fall 2015 Simple Linear Regression: Prediction Instructor: G. William Schwert 585-275-2470 schwert@schwert.ssb.rochester.edu Ciba-Geigy Ritalin Experiment Ritalin is tested to see if it helps with
Biology 345: Biometry Fall 2005 SONOMA STATE UNIVERSITY Lab Exercise 5 Residuals and multiple regression Introduction
 Biology 345: Biometry Fall 2005 SONOMA STATE UNIVERSITY Lab Exercise 5 Residuals and multiple regression Introduction In this exercise, we will gain experience assessing scatterplots in regression and
M15_BERE8380_12_SE_C15.6.qxd 2/21/11 8:21 PM Page Influence Analysis 1
 M15_BERE8380_12_SE_C15.6.qxd 2/21/11 8:21 PM Page 1 15.6 Influence Analysis FIGURE 15.16 Minitab worksheet containing computed values for the Studentized deleted residuals, the hat matrix elements, and
Daniel Boduszek University of Huddersfield
 Daniel Boduszek University of Huddersfield d.boduszek@hud.ac.uk Introduction to Correlation SPSS procedure for Pearson r Interpretation of SPSS output Presenting results Partial Correlation Correlation
Business Statistics Probability
 Business Statistics The following was provided by Dr. Suzanne Delaney, and is a comprehensive review of Business Statistics. The workshop instructor will provide relevant examples during the Skills Assessment
Preliminary Report on Simple Statistical Tests (t-tests and bivariate correlations)
") Preliminary Report on Simple Statistical Tests (t-tests and bivariate correlations) After receiving my comments on the preliminary reports of your datasets, the next step for the groups is to complete
Preliminary Report on Simple Statistical Tests (t-tests and bivariate correlations) After receiving my comments on the preliminary reports of your datasets, the next step for the groups is to complete
Multiple Linear Regression Analysis
 Revised July 2018 Multiple Linear Regression Analysis This set of notes shows how to use Stata in multiple regression analysis. It assumes that you have set Stata up on your computer (see the Getting Started
IAPT: Regression. Regression analyses
 Regression analyses IAPT: Regression Regression is the rather strange name given to a set of methods for predicting one variable from another. The data shown in Table 1 and come from a student project
bivariate analysis: The statistical analysis of the relationship between two variables.
 bivariate analysis: The statistical analysis of the relationship between two variables. cell frequency: The number of cases in a cell of a cross-tabulation (contingency table). chi-square (χ 2 ) test for
Correlation and regression
 PG Dip in High Intensity Psychological Interventions Correlation and regression Martin Bland Professor of Health Statistics University of York http://martinbland.co.uk/ Correlation Example: Muscle strength
10. LINEAR REGRESSION AND CORRELATION
 1 10. LINEAR REGRESSION AND CORRELATION The contingency table describes an association between two nominal (categorical) variables (e.g., use of supplemental oxygen and mountaineer survival ). We have
STATISTICS INFORMED DECISIONS USING DATA
 STATISTICS INFORMED DECISIONS USING DATA Fifth Edition Chapter 4 Describing the Relation between Two Variables 4.1 Scatter Diagrams and Correlation Learning Objectives 1. Draw and interpret scatter diagrams
Correlation and Regression
 Dublin Institute of Technology ARROW@DIT Books/Book Chapters School of Management 2012-10 Correlation and Regression Donal O'Brien Dublin Institute of Technology, donal.obrien@dit.ie Pamela Sharkey Scott
Chapter 3 CORRELATION AND REGRESSION
 CORRELATION AND REGRESSION TOPIC SLIDE Linear Regression Defined 2 Regression Equation 3 The Slope or b 4 The Y-Intercept or a 5 What Value of the Y-Variable Should be Predicted When r = 0? 7 The Regression
Item-Total Statistics
 64 Reliability Case Processing Summary N % Cases Valid 46 00.0 Excluded a 0.0 46 00.0 a. Listwise deletion based on all variables in the procedure. Reliability Statistics Cronbach's Alpha N of Items.869
Midterm STAT-UB.0003 Regression and Forecasting Models. I will not lie, cheat or steal to gain an academic advantage, or tolerate those who do.
 Midterm STAT-UB.0003 Regression and Forecasting Models The exam is closed book and notes, with the following exception: you are allowed to bring one letter-sized page of notes into the exam (front and
MULTIPLE OLS REGRESSION RESEARCH QUESTION ONE:
 1 MULTIPLE OLS REGRESSION RESEARCH QUESTION ONE: Predicting State Rates of Robbery per 100K We know that robbery rates vary significantly from state-to-state in the United States. In any given state, we
Example of Interpreting and Applying a Multiple Regression Model
 Example of Interpreting and Applying a Multiple Regression We'll use the same data set as for the bivariate correlation example -- the criterion is 1 st year graduate grade point average and the predictors
HZAU MULTIVARIATE HOMEWORK #2 MULTIPLE AND STEPWISE LINEAR REGRESSION
 HZAU MULTIVARIATE HOMEWORK #2 MULTIPLE AND STEPWISE LINEAR REGRESSION Using the malt quality dataset on the class s Web page: 1. Determine the simple linear correlation of extract with the remaining variables.
Multiple Regression. James H. Steiger. Department of Psychology and Human Development Vanderbilt University
 Multiple Regression James H. Steiger Department of Psychology and Human Development Vanderbilt University James H. Steiger (Vanderbilt University) Multiple Regression 1 / 19 Multiple Regression 1 The Multiple
Understandable Statistics
 Understandable Statistics correlated to the Advanced Placement Program Course Description for Statistics Prepared for Alabama CC2 6/2003 2003 Understandable Statistics 2003 correlated to the Advanced Placement
Business Research Methods. Introduction to Data Analysis
 Business Research Methods Introduction to Data Analysis Data Analysis Process STAGES OF DATA ANALYSIS EDITING CODING DATA ENTRY ERROR CHECKING AND VERIFICATION DATA ANALYSIS Introduction Preparation of
Appendix. I. Map of former Car Doctors site. Soil for the greenhouse study was collected in the area indicated by the arrow.
 Appendix I. Map of former Car Doctors site. Soil for the greenhouse study was collected in the area indicated by the arrow. 73 II. Photo of former Car Doctors site. Site, facing Burlington Drive, before
Problem #1 Neurological signs and symptoms of ciguatera poisoning as the start of treatment and 2.5 hours after treatment with mannitol.
 Ho (null hypothesis) Ha (alternative hypothesis) Problem #1 Neurological signs and symptoms of ciguatera poisoning as the start of treatment and 2.5 hours after treatment with mannitol. Hypothesis: Ho:
Chapter 10: Moderation, mediation and more regression
 Chapter 10: Moderation, mediation and more regression Smart Alex s Solutions Task 1 McNulty et al. (2008) found a relationship between a person s Attractiveness and how much Support they give their partner
THE UNIVERSITY OF SUSSEX. BSc Second Year Examination DISCOVERING STATISTICS SAMPLE PAPER INSTRUCTIONS
 C8552 THE UNIVERSITY OF SUSSEX BSc Second Year Examination DISCOVERING STATISTICS SAMPLE PAPER INSTRUCTIONS Do not, under any circumstances, remove the question paper, used or unused, from the examination
Content. Basic Statistics and Data Analysis for Health Researchers from Foreign Countries. Research question. Example Newly diagnosed Type 2 Diabetes
 Content Quantifying association between continuous variables. Basic Statistics and Data Analysis for Health Researchers from Foreign Countries Volkert Siersma siersma@sund.ku.dk The Research Unit for General
Daniel Boduszek University of Huddersfield
 Daniel Boduszek University of Huddersfield d.boduszek@hud.ac.uk Introduction to Logistic Regression SPSS procedure of LR Interpretation of SPSS output Presenting results from LR Logistic regression is
1. You want to find out what factors predict achievement in English. Develop a model that
 Questions and answers for Chapter 10 1. You want to find out what factors predict achievement in English. Develop a model that you think can explain this. As usual many alternative predictors are possible
0= Perempuan, 1= Laki-Laki
 Responden Menurut Umur Descriptive Statistics N Minimum Maximum Mean Std. Deviation Umur 34 21 56 28,12 6,763 Valid N (listwise) 34 Responden Menurut Jenis Kelamin 0= Perempuan, 1= Laki-Laki Jenis_Kelamin
5 To Invest or not to Invest? That is the Question.
 5 To Invest or not to Invest? That is the Question. Before starting this lab, you should be familiar with these terms: response y (or dependent) and explanatory x (or independent) variables; slope and
Midterm Exam MMI 409 Spring 2009 Gordon Bleil
 Midterm Exam MMI 409 Spring 2009 Gordon Bleil Table of contents: (Hyperlinked to problem sections) Problem 1 Hypothesis Tests Results Inferences Problem 2 Hypothesis Tests Results Inferences Problem 3
Multiple Linear Regression
 Multiple Linear Regression CSU Chico, Math 314 2018-12-05 Multiple Linear Regression 2018-12-05 1 / 41 outline Recap Multiple Linear Regression assumptions lite example interpretation adjusted R 2 simple
LAMPIRAN A KUISIONER
 LAMPIRAN A KUISIONER LAMPIRAN B UJI RELIABILITAS DAN UJI VALIDITAS A. Kecerdasan Emosional a. Putaran Pertama Case Processing Summary N % Cases Valid 60 100.0 Excluded a 0.0 60 100.0 a. Listwise deletion
Introduction to Quantitative Methods (SR8511) Project Report
 Project Report") Introduction to Quantitative Methods (SR8511) Project Report Exploring the variables related to and possibly affecting the consumption of alcohol by adults Student Registration number: 554561 Word counts
Introduction to Quantitative Methods (SR8511) Project Report Exploring the variables related to and possibly affecting the consumption of alcohol by adults Student Registration number: 554561 Word counts
MULTIPLE LINEAR REGRESSION 24.1 INTRODUCTION AND OBJECTIVES OBJECTIVES
 24 MULTIPLE LINEAR REGRESSION 24.1 INTRODUCTION AND OBJECTIVES In the previous chapter, simple linear regression was used when you have one independent variable and one dependent variable. This chapter
CHILD HEALTH AND DEVELOPMENT STUDY
 CHILD HEALTH AND DEVELOPMENT STUDY 9. Diagnostics In this section various diagnostic tools will be used to evaluate the adequacy of the regression model with the five independent variables developed in
2 Assumptions of simple linear regression
 Simple Linear Regression: Reliability of predictions Richard Buxton. 2008. 1 Introduction We often use regression models to make predictions. In Figure?? (a), we ve fitted a model relating a household
Multiple Regression Using SPSS/PASW
 MultipleRegressionUsingSPSS/PASW The following sections have been adapted from Field (2009) Chapter 7. These sections have been edited down considerablyandisuggest(especiallyifyou reconfused)thatyoureadthischapterinitsentirety.youwillalsoneed
Regression Equation. November 29, S10.3_3 Regression. Key Concept. Chapter 10 Correlation and Regression. Definitions
 MAT 155 Statistical Analysis Dr. Claude Moore Cape Fear Community College Chapter 10 Correlation and Regression 10 1 Review and Preview 10 2 Correlation 10 3 Regression 10 4 Variation and Prediction Intervals
Notes for laboratory session 2
 Notes for laboratory session 2 Preliminaries Consider the ordinary least-squares (OLS) regression of alcohol (alcohol) and plasma retinol (retplasm). We do this with STATA as follows:. reg retplasm alcohol
Class 7 Everything is Related
 Class 7 Everything is Related Correlational Designs l 1 Topics Types of Correlational Designs Understanding Correlation Reporting Correlational Statistics Quantitative Designs l 2 Types of Correlational
Statistical reports Regression, 2010
 Statistical reports Regression, 2010 Niels Richard Hansen June 10, 2010 This document gives some guidelines on how to write a report on a statistical analysis. The document is organized into sections that
Dr. Kelly Bradley Final Exam Summer {2 points} Name
 {2 points} Name You MUST work alone no tutors; no help from classmates. Email me or see me with questions. You will receive a score of 0 if this rule is violated. This exam is being scored out of 00 points.
Logistic Regression Predicting the Chances of Coronary Heart Disease. Multivariate Solutions
 Logistic Regression Predicting the Chances of Coronary Heart Disease Multivariate Solutions What is Logistic Regression? Logistic regression in a nutshell: Logistic regression is used for prediction of
Multiple Regression Analysis
 Multiple Regression Analysis Basic Concept: Extend the simple regression model to include additional explanatory variables: Y = β 0 + β1x1 + β2x2 +... + βp-1xp + ε p = (number of independent variables
SIGNIFICANCE OF HEART RATE AND BP IN PSYCHO-PHYSIOLOGICAL PREPAREDNESS IN CONTEXT OF SPORTS
 SIGNIFICANCE OF HEART RATE AND BP IN PSYCHO-PHYSIOLOGICAL PREPAREDNESS IN CONTEXT OF SPORTS Ms. Sujit Verma 1, Dr. Simrat Kaur 2 Research Scholar, Punjabi University, Patiala Principal, Prof Gursewak Singh
Conditional Distributions and the Bivariate Normal Distribution. James H. Steiger
 Conditional Distributions and the Bivariate Normal Distribution James H. Steiger Overview In this module, we have several goals: Introduce several technical terms Bivariate frequency distribution Marginal
Lecture 6B: more Chapter 5, Section 3 Relationships between Two Quantitative Variables; Regression
 Lecture 6B: more Chapter 5, Section 3 Relationships between Two Quantitative Variables; Regression! Equation of Regression Line; Residuals! Effect of Explanatory/Response Roles! Unusual Observations! Sample
REGRESSION MODELLING IN PREDICTING MILK PRODUCTION DEPENDING ON DAIRY BOVINE LIVESTOCK
 REGRESSION MODELLING IN PREDICTING MILK PRODUCTION DEPENDING ON DAIRY BOVINE LIVESTOCK Agatha POPESCU University of Agricultural Sciences and Veterinary Medicine Bucharest, 59 Marasti, District 1, 11464,
Statistics as a Tool. A set of tools for collecting, organizing, presenting and analyzing numerical facts or observations.
 Statistics as a Tool A set of tools for collecting, organizing, presenting and analyzing numerical facts or observations. Descriptive Statistics Numerical facts or observations that are organized describe
11/18/2013. Correlational Research. Correlational Designs. Why Use a Correlational Design? CORRELATIONAL RESEARCH STUDIES
 Correlational Research Correlational Designs Correlational research is used to describe the relationship between two or more naturally occurring variables. Is age related to political conservativism? Are
2.75: 84% 2.5: 80% 2.25: 78% 2: 74% 1.75: 70% 1.5: 66% 1.25: 64% 1.0: 60% 0.5: 50% 0.25: 25% 0: 0%
 Capstone Test (will consist of FOUR quizzes and the FINAL test grade will be an average of the four quizzes). Capstone #1: Review of Chapters 1-3 Capstone #2: Review of Chapter 4 Capstone #3: Review of
CLINICAL RESEARCH METHODS VISP356. MODULE LEADER: PROF A TOMLINSON B.Sc./B.Sc.(HONS) OPTOMETRY
 OPTOMETRY") DIVISION OF VISION SCIENCES SESSION: 2005/2006 DIET: 1ST CLINICAL RESEARCH METHODS VISP356 LEVEL: MODULE LEADER: PROF A TOMLINSON B.Sc./B.Sc.(HONS) OPTOMETRY MAY 2006 DURATION: 2 HRS CANDIDATES SHOULD
DIVISION OF VISION SCIENCES SESSION: 2005/2006 DIET: 1ST CLINICAL RESEARCH METHODS VISP356 LEVEL: MODULE LEADER: PROF A TOMLINSON B.Sc./B.Sc.(HONS) OPTOMETRY MAY 2006 DURATION: 2 HRS CANDIDATES SHOULD
RESPONSE SURFACE MODELING AND OPTIMIZATION TO ELUCIDATE THE DIFFERENTIAL EFFECTS OF DEMOGRAPHIC CHARACTERISTICS ON HIV PREVALENCE IN SOUTH AFRICA
 RESPONSE SURFACE MODELING AND OPTIMIZATION TO ELUCIDATE THE DIFFERENTIAL EFFECTS OF DEMOGRAPHIC CHARACTERISTICS ON HIV PREVALENCE IN SOUTH AFRICA W. Sibanda 1* and P. Pretorius 2 1 DST/NWU Pre-clinical
SUMMER 2011 RE-EXAM PSYF11STAT - STATISTIK
 SUMMER 011 RE-EXAM PSYF11STAT - STATISTIK Full Name: Årskortnummer: Date: This exam is made up of three parts: Part 1 includes 30 multiple choice questions; Part includes 10 matching questions; and Part
Statistics: A Brief Overview Part I. Katherine Shaver, M.S. Biostatistician Carilion Clinic
 Statistics: A Brief Overview Part I Katherine Shaver, M.S. Biostatistician Carilion Clinic Statistics: A Brief Overview Course Objectives Upon completion of the course, you will be able to: Distinguish
Describe what is meant by a placebo Contrast the double-blind procedure with the single-blind procedure Review the structure for organizing a memo
 Business Statistics The following was provided by Dr. Suzanne Delaney, and is a comprehensive review of Business Statistics. The workshop instructor will provide relevant examples during the Skills Assessment
Dan Byrd UC Office of the President
 Dan Byrd UC Office of the President 1. OLS regression assumes that residuals (observed value- predicted value) are normally distributed and that each observation is independent from others and that the
1. Below is the output of a 2 (gender) x 3(music type) completely between subjects factorial ANOVA on stress ratings
 x 3(music type) completely between subjects factorial ANOVA on stress ratings") SPSS 3 Practice Interpretation questions A researcher is interested in the effects of music on stress levels, and how stress levels might be related to anxiety and life satisfaction. 1. Below is the output
SPSS 3 Practice Interpretation questions A researcher is interested in the effects of music on stress levels, and how stress levels might be related to anxiety and life satisfaction. 1. Below is the output
Analysis of Variance: repeated measures
 Analysis of Variance: repeated measures Tests for comparing three or more groups or conditions: (a) Nonparametric tests: Independent measures: Kruskal-Wallis. Repeated measures: Friedman s. (b) Parametric
Technical appendix Strengthening accountability through media in Bangladesh: final evaluation
 Technical appendix Strengthening accountability through media in Bangladesh: final evaluation July 2017 Research and Learning Contents Introduction... 3 1. Survey sampling methodology... 4 2. Regression
Math 215, Lab 7: 5/23/2007
 Math 215, Lab 7: 5/23/2007 (1) Parametric versus Nonparamteric Bootstrap. Parametric Bootstrap: (Davison and Hinkley, 1997) The data below are 12 times between failures of airconditioning equipment in
Intro to SPSS. Using SPSS through WebFAS
 Intro to SPSS Using SPSS through WebFAS http://www.yorku.ca/computing/students/labs/webfas/ Try it early (make sure it works from your computer) If you need help contact UIT Client Services Voice: 416-736-5800
SCATTER PLOTS AND TREND LINES
 1 SCATTER PLOTS AND TREND LINES LEARNING MAP INFORMATION STANDARDS 8.SP.1 Construct and interpret scatter s for measurement to investigate patterns of between two quantities. Describe patterns such as
Prediction of sheep milk chemical composition using ph, electrical conductivity and refractive index
 Prediction of sheep milk chemical composition using ph, electrical conductivity and refractive index A.I. Gelasakis *, R. Giannakou *, A. Kominakis, G. Antonakos, G. Arsenos * * Department of Animal Production,
SELF EFFICACY AS A PREDICTOR OF NEGATIVE AUTOMATIC THOUGHTS AND DEPRESSION
 SELF EFFICACY AS A PREDICTOR OF NEGATIVE AUTOMATIC THOUGHTS AND DEPRESSION Dr. Komal Rai 1, Samreen Naz 2 1 Assistant Professor, Department of Psychology, Lovely Professional University, Punjab, India
Global Perspective Inventory (GPI) Report
 Report") Global Perspective Inventory (GPI) 2012-2013 Report Executive Summary display higher levels of global competence than freshmen in all of the GPI scales except for the interpersonal social responsibility
Global Perspective Inventory (GPI) 2012-2013 Report Executive Summary display higher levels of global competence than freshmen in all of the GPI scales except for the interpersonal social responsibility
Advanced ANOVA Procedures
 Advanced ANOVA Procedures Session Lecture Outline:. An example. An example. Two-way ANOVA. An example. Two-way Repeated Measures ANOVA. MANOVA. ANalysis of Co-Variance (): an ANOVA procedure whereby the
12/30/2017. PSY 5102: Advanced Statistics for Psychological and Behavioral Research 2
 PSY 5102: Advanced Statistics for Psychological and Behavioral Research 2 Selecting a statistical test Relationships among major statistical methods General Linear Model and multiple regression Special
Still important ideas
 Readings: OpenStax - Chapters 1 13 & Appendix D & E (online) Plous Chapters 17 & 18 - Chapter 17: Social Influences - Chapter 18: Group Judgments and Decisions Still important ideas Contrast the measurement
Stat 13, Lab 11-12, Correlation and Regression Analysis
 Stat 13, Lab 11-12, Correlation and Regression Analysis Part I: Before Class Objective: This lab will give you practice exploring the relationship between two variables by using correlation, linear regression
Applications. DSC 410/510 Multivariate Statistical Methods. Discriminating Two Groups. What is Discriminant Analysis
 DSC 4/5 Multivariate Statistical Methods Applications DSC 4/5 Multivariate Statistical Methods Discriminant Analysis Identify the group to which an object or case (e.g. person, firm, product) belongs:
Clincial Biostatistics. Regression
 Regression analyses Clincial Biostatistics Regression Regression is the rather strange name given to a set of methods for predicting one variable from another. The data shown in Table 1 and come from a
Question 1(25= )
") MSG500 Final 20-0-2 Examiner: Rebecka Jörnsten, 060-49949 Remember: To pass this course you also have to hand in a final project to the examiner. Open book, open notes but no calculators or computers allowed.
MSG500 Final 20-0-2 Examiner: Rebecka Jörnsten, 060-49949 Remember: To pass this course you also have to hand in a final project to the examiner. Open book, open notes but no calculators or computers allowed.
South Australian Research and Development Institute. Positive lot sampling for E. coli O157
 final report Project code: Prepared by: A.MFS.0158 Andreas Kiermeier Date submitted: June 2009 South Australian Research and Development Institute PUBLISHED BY Meat & Livestock Australia Limited Locked
What Causes Stress in Malaysian Students and it Effect on Academic Performance: A case Revisited
 Advanced Journal of Technical and Vocational Education 1 (1): 155-160, 2017 eissn: 2550-2174 RMP Publications, 2017 What Causes Stress in Malaysian Students and it Effect on Academic Performance: A case
HPS301 Exam Notes- Contents
 HPS301 Exam Notes- Contents Week 1 Research Design: What characterises different approaches 1 Experimental Design 1 Key Features 1 Criteria for establishing causality 2 Validity Internal Validity 2 Threats
LAMPIRAN A SERTIFIKAT PENGUJIAN STANDARISASI EKSTRAK ETANOL DAUN SALAM
 LAMPIRAN A SERTIFIKAT PENGUJIAN STANDARISASI EKSTRAK ETANOL DAUN SALAM 81 LAMPIRAN B SERTIFIKAT PENGUJIAN STANDARISASI EKSTRAK ETANOL HERBA SAMBILOTO 82 LAMPIRAN C HASIL UJI PENETAPAN KADAR FLAVONOID TOTAL