Supplementary Figure 1
|
|
|
- Scarlett Gordon
- 5 years ago
- Views:
Transcription
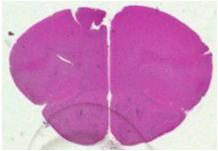
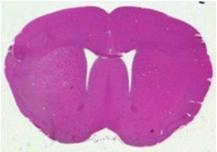
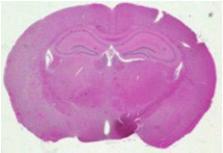
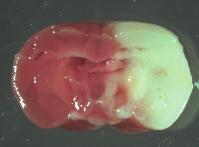
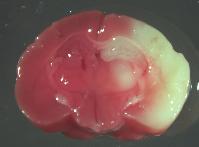
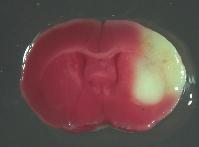
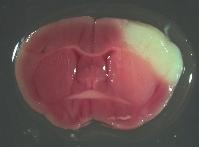
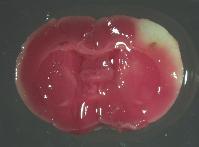
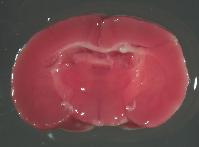
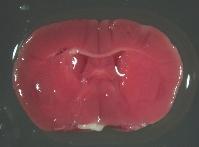
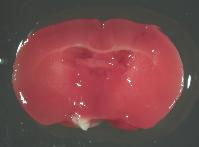
1 Supplementary Figure Bregma -1.6mm 3 : Bregma Ref) Bregma -.18mm Supplementary Figure 1 Schematic representation of the utilized brain slice for TTC staining and immunohistochemistry, which was located at -1.6 mm and -.18 mm in adult mice (Modified from the atlas of Franklin and Paxinos 38. Confirming H/I model by TTC staining, the brain tissues from the boxed ipsilateral penumbra (3) and contralateral area () were used for RT-PCR and Western blot analyses.

 () Counts () () Iba-1 GFAP (Bregma:-1.")

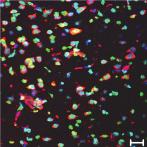
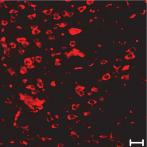
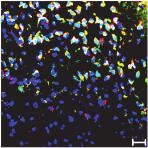
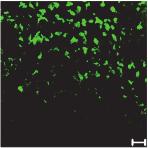
2 Supplementary Figure a 16 Iba-1 Iba GAD 5 GFAP GFAP 3 MAP 8 6 NeuN NeuN 5 Tubulin 5 Tubulin Tubulin Mouse#3 Mouse#1 Mouse# b Iba-1 Merge c Counts () () Counts () () Iba-1 GFAP (Bregma:-1.6mm) d e SSC SSC 11% % Iba-1 Iba-1 3% % 535bp 738bp 91bp 3bp 11bp GFAP TREM Iba-1 MAP NeuN nd Control Ab nd Control Ab 317bp 3
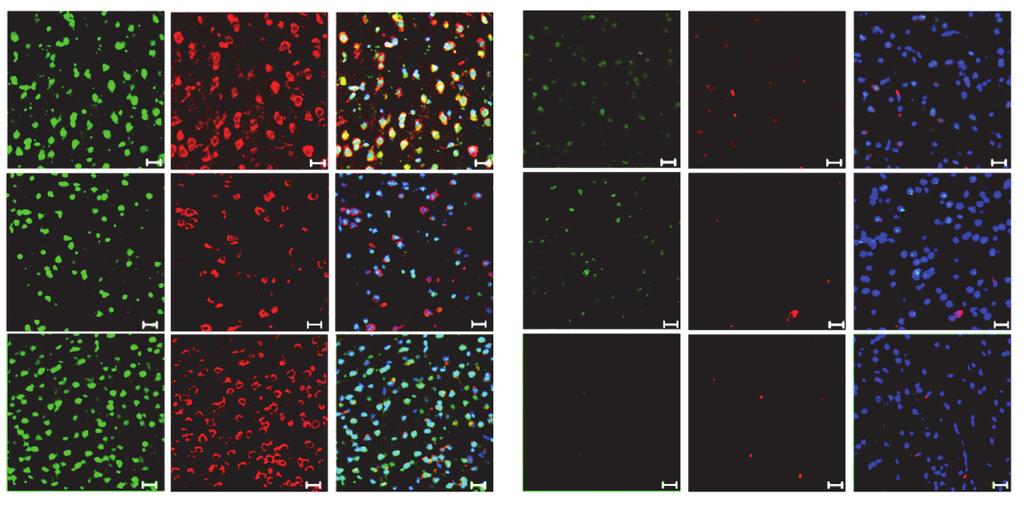
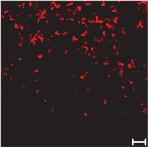
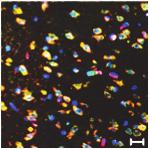
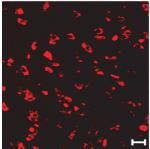
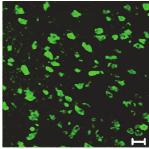
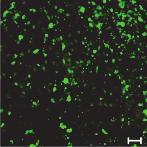
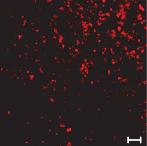
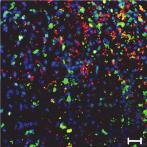
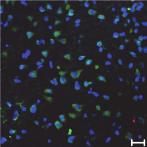
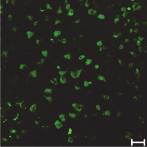
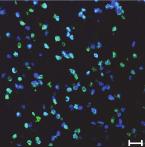
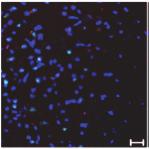
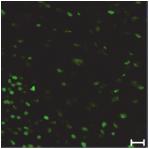
3 Supplementary Figure Expression levels of glial or neuronal markers in brain tissues from the H/I mice and primary culture cells. (a) Westernblotanalysiswasperformedonbrain tissues from the H/I mice using the indicated antibodies. (b) Immunohistochemistry was performed with (red) and Iba-1 antibodies (green) on coronal sections of the H/I mice. Scale bar: m. (c-d) Brain cells isolated from ischemic ipsilateral and contralateral hemispheres were stained with antibodies against Iba-1, GFAP, or secondary antibody (Molecular probe, #A11), and analyzed by flow cytometry. The data shown are representative of at least three independent experiments. (e) RT-PCR analysis was performed in primary cultured glial cells and neuronal cells using the indicated primers. GFAP forward: 5`-AAG CTC CAA GAT GAA ACC AAC CTG A-3`, reverse: 5`-CCA CGA TGT TCC TCT TGA GGT GG-3`; and TREM forward: 5`-ATG GGA CCT CTC CAC CAG TT, reverse: 5`-TCA CGT ACC TCC GGG TCC A; and Iba-1 forward: 5`-GGA TTT GCA GGG AGG AAA AG-3`, reverse: 5`-TGG GAT CAT CGA GGA ATT G-3`; and MAP forward: 5`-TTG GCT CAC TTG ACA ATG CTC ACC-3`, reverse: 5`-AAT ATG ACA CCT GCT CAG AGC CCA-3`; and NeuN forward: 5`-CCA GGC ACT GAG GCC AGC ACACAG C-3`, reverse: 5`-CTC CGT GGG GTC GGA AGG GTG G-3`.
4 Supplementary Figure 3 Relative Luciferase Activity (relative to normoxic PGL3 basic control ) 1 3 PGL3 Basic Luc p(1517)luc (-1517~+1) muthre A A B C B C Luc Luc P=.7 P=. muthre B muthre C C Luc Luc :% O :1% O HRE A B C Supplementary Figure 3 expression is closely linked with HIF-1 Three putative HRE sites within p(1517)luc were targeted for mutagenesis. The mutations of base pairs in each of the HREs were made using a site-directed mutagenesis kit, and confirmed using DNA sequencing. The regions of mutated HREs are indicated at the bottom. Mouse primary mixed glial cells were transfected with the luciferase reporter constructs or PGL3-basic control reporter, and incubated under hypoxic or normoxic conditions for h. Relative promoter activity is expressed as the ratio of luciferase activity/β-galactosidase activity. 5


5 Supplementary Figure a Day 1 R C R:rostral C:caudal 6
 Supplementary Figure A blocking antibody significantly reduces brain injury and edema formation after hypoxia-ischemia (a)")
 Representative images of Coronal MRI (T weighted image) brain slices after indicated time from H/I mice treated with 1 g of (n=) or anti- (n=).")
/contralateral volume] 1 and")
6 Supplementary Figure (continued) b Day 1 Day 3 Day 5 Day 7 c R Day 1 C ADC map (A) (B) % of edema: lateral volume (B)-lateral volume (A) 1 lateral volume (A) Supplementary Figure A blocking antibody significantly reduces brain injury and edema formation after hypoxia-ischemia (a) Representative images of Coronal MRI (T weighted image) brain slices after h from H/I mice treated with 1 g of (n=)oranti-(n=). (b) Representative images of Coronal MRI (T weighted image) brain slices after indicated time from H/I mice treated with 1 g of (n=) or anti- (n=). (c) Representative images of ADC maps brain slices after h from H/I mice treated with 1 g of (n=)oranti- (n=). Edema volume was quantified with Image J analyzer and were calculated with [(ipsilateral volume-contralateral volume)/contralateral volume] 1 and expressed as a percentage of the damaged ipsilateral hemisphere. 7

7 Supplementary Figure 5 a MPO Gr-1 Merge MPO + Gr-1 + cells/mm 8 6 P=.9 (Bregma:-.18mm) b c MPO 381 bp 317 bp Relative level of MPO transcript 8 P=.3 6 MPO 6 Tubulin 5 Relative level of MPO protein P=.9 Supplementary Figure 5 Neutrophil migration is increased in the ipsilateral cortex of H/I mice. (a) Antibodies against MPO and Gr-1 were used to perform immunohistochemistry on coronal sections of the H/I mice h after injury. Scale bar: m. The graph shows the mean number of MPO + Gr-1 + cells per mm (mean s.d. from three independent experiments). (b) RT-PCR analysis and (c) Western blot analysis were performed on brain tissues from H/I mice with MPO-specific primers and antibody, respectively. Relative levels of MPO transcripts and proteins are shown as graphs. The data shown are representative of at least three independent experiments (b, p=.3 compared with the contralateral control; c, p=.9 compared with the contralateral control). 8
8 Supplementary Figure 6 a Splenocytes 1% O or % O Splenocytes 1% O or % O h Primary glial cells FACS analysis of floating cells in lower chamber % of Gr-1 high CD11b high cells Glia P=.16 : % O : 1% O Murine h embryonic fibroblast (MEF) FACS analysis of floating cells in lower chamber % of Gr-1 high CD11b high cells P=.6 P=.7 : % O : 1% O MEF (1X1 5 cells) MEF 1X1 5X1 1X1 5 (cells) b Splenocytes 1% O or % O Splenocytes 1% O or % O h Primary glial cells FACS analysis of floating cells in lower chamber % of Gr-1 high CD11b high cells P=.8 1 (O, %) % of Gr-1 high CD11b high cells h FACS analysis of floating cells in lower chamber P=.9 1 (O, %) 9
9 Supplementary Figure 6 (continued) c 8 wk old C57BL/6 Sorting for BM-derived neutrophils Sorted Neutrophils Gr-1 96% 1-day-old mouse pup Neutrophils h CD11b 1% O Glial cells Analysis of floating cells in lower chamber Supplementary Figure 6 The migration of neutrophils is increased in the presence of glial cells under hypoxic conditions. (a) Splenocytes were isolated from C57BL/6 mice, and incubated in a transwell system with primary glial cells or MEF cells (C57BL/6) under hypoxic or normoxic conditions for h. The cells were analyzed by flow cytometry using antibodies against CD11b and Gr-1. The percentage of Gr-1 high CD11b high cells is expressed as the mean s.d. from three independent experiments. (b) Splenocytes (5 1 5 ) were isolated from C57BL/6 mice, and incubated in a transwell system with or without 1 5 primary cultured glial cells under hypoxic or normoxic conditions for h. The percentage of Gr-1 high CD11b high cells is expressed as the mean ± s.d. from three independent experiments. (c) Schematic illustration of our transwell system-based neutrophil transmigration assay. 1

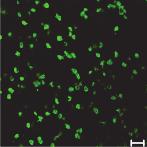
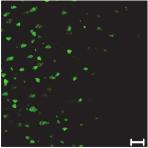
10 Supplementary Figure 7 DAPI MPO Neutrophil Merge (Bregma:-.18mm) MPO + Neutrophil + cells/mm P=.16 Supplementary Figure 7 The migration of neutrophils into ischemic ipsilateral regions is decreased in -blocking antibody-treated H/I mice. Representative confocal microscopic images of coronal sections from control - or blocking antibody-treated H/I mice. Scale bar: 5 m. 11
11 Supplementary Figure 8 a.7 - b Cortex ( h) Bregma H&E MPO Gr-1 Merge MPO Gr-1 Merge.7-1

")


12 Supplementary Figure 8 (continued) c Striatum ( h) MPO Gr-1 Merge MPO Gr-1 Merge cortex 1 striatum Bregma.7 1 Cortex ( h) MPO Gr-1 Merge MPO Gr-1 Merge 1 1 Bregma -. 13

13 Supplementary Figure 8 (continued) d Penumbra (Bregma.7) MPO Gr-1 Merge MPO Gr-1 Merge 1 day 3 days 5 days 7 days Supplementary Figure 8 The -blocking antibody reduces neutrophil migration after hypoxia-ischemia. (a) Schematic representation of the utilized brain slice for immunohistochemistry, which was located at bregma to - mm in adult mice (Modified from the atlas of Franklin and Paxinos 38 ). (b-d) Immunohistochemistry was performed on coronal sections from control - or -blocking-antibody-treated H/I mice at the indicated times after injury using antibodies against MPO and Gr-1. Scale bar: μm. 1
14 Supplementary Figure 9 a Relative HIF-1α mrna (%) P= HIF-1 +f/+f LysM-Hif-1 -/- b HIF-1 +f/+f LysM-Hif-1 -/- IL-1β 71 bp CXCL1 185 bp 317 bp Relative levels of IL-1 6 P=.19 contra Relative levels of CXCL1 HIF-1 +f/+f LysM-Hif-1 -/- HIF-1 +f/+f LysM-Hif-1 -/- 6 P=.6 Supplementary Figure 9 Similar events are observed in the primary glial cells and cortex tissues from LysM-Hif-1 -/- mice. (a) Real time quantitative RT-PCR analysis was performed in primary microglia cultured from HIF-1 +f/+f or LysM-Hif-1 -/- mice (n=6) using HIF-1 primer. (b) The transcript levels of IL-1 and CXCL1 were examined in brain tissues from the contralateral cortex and ischemic ipsilateral cortex of HIF-1 +f/+f or LysM-Hif-1 -/- mouse h after hypoxia and ischemic injury (n=3). Data shown are presented as the mean s.d. 15
15 Supplementary Figure 1 a Counts CD11b high CD5 low GFP low cells CD11b high CD5 low GFP high cells Relative MFI levels () P=. GFP low GFP high CD11b high CD5 low cells Counts GFAP high GFP low cells GFAP high GFP high cells Relative MFI levels () 3 1 P=.7 GFP low GFP high GFAP high cells b Coordinates from Bregma 1: AP +1, ML ±1.5, DV -3 : AP, ML ±1.5, DV -3 3: AP -1, ML ±1.5, DV -3 : AP -, ML ±1.5, DV -3 6 c Mice Lentivirus Number with the indicated score 1 3 n Mean Score (± s.d.) LysM- LV-GFP HIf-1α -/- LV-TIM3-GFP * Supplementary Figure 1 (a) LV-TIM3-GFP or LV-GFP was injected using an stereotaxic instrument. Five days after intracranial injection of lentiviral vectors, glial cells from the injected region were subjected to FACS analysis using antibody against (ebioscience, RMT-3-3). The graph shows the results from three mice. (b) Schematic drawing of the injection sites. (c) Neurological scoring was determined after h of H/I in mice LV-GFP (n=6) or LV-TIM3-GFP (n=6).
 (I) (C) (I) (3bp) 1bp HIF1α (9bp) bp (C) (I) (317bp) Fig.")
 1 (O,%) Fig.")
16 Supplementary Figure 11 a Blots and Gels; Figure 1 Fig.1a 1bp (C) (I) (C) (I) (3bp) 1bp HIF1α (9bp) bp (C) (I) (317bp) Fig.1b (C) (I) (C) (I) 13 (C) (I) 3 6 (33) 55 Tubulin (5) 95 7 HIF1α (1) 56 Tubulin 3 (5) b Blots and Gels; Figure Fig.c Fig.d 1 (O,%) 1 (O,%) Fig.e IP: IP:HIF1α 1 1 (O,%) 1bp (3bp) (3bp) (6bp) 7bp 6bp IP: IP:HIF1α 1 (O,%) 1 (O,%) 1 1 (O,%) 1bp (317bp) (317bp) 6bp (6bp) Primary glial cell Neuron 17
 Fig.")

 1bp HIF1 F/F HIF1")
 1bp 1 1 (O,%)")
 HIF1 F/F HIF1 / 1 1")
")
 c Blots")

17 Supplementary Figure 11 (continued) Fig.g HIF1 F/F HIF1 / Fig.h HIF1 F/F HIF1 / 1 1 (O,%) 1 1 (O,%) (3bp) 3 6 (33) 1bp HIF1 F/F HIF1 / HIF1 F/F HIF1 / 1 1 (O,%) 1bp 1 1 (O,%) HIF1α (9bp) 55 3 Tubulin (5) HIF1 F/F HIF1 / 1 1 (O,%) (317bp) 13 HIF1 F/F HIF1 / 1 1 (O,%) HIF1 (1) 95 HIF1 F/F HIF1 / 1 1 (O,%) Tubulin 56 (5) c Blots and Gels; Figure 3f Full length PARP (116) 55 3 Tubulin (5) 18
 d")

 (317bp) 7 55")
 MPO")

 bp")
 1bp CXCL1")
18 Supplementary Figure 11 (continued) d Blots and Gels; Figure Fig.a 7bp 6bp bp bp MPO (381bp) (317bp) Fig.b Tubulin (5) MPO (55~6) e Blots and Gels; Figure 5 Fig.5c Fig.5e 1 1 (O,%) 8bp 6bp bp IL-1β (71bp) bp IL-1β (71bp) 1 1 (O,%) 1bp CXCL1 (185bp) CXCL1 (185bp) 1 1 (O,%) bp (317bp) (317bp) 19
 1 1 (O,%) 1 1 (O,%) bp bp bp CXCL1(185bp) IL-1β(71bp) (317bp) g Blots and Gels; Figure 7 Fig.")
 bp (317bp) Supplementary Figure 11 Full scans of blots and gels for Figure 1 (a),")
19 Supplementary Figure 11 (continued) f Blots and Gels; Figure 6c HIF-1 +f/+f LysM-Hif-1 -/- HIF-1 +f/+f LysM-Hif-1 -/- HIF-1 +f/+f LysM-Hif-1 -/- 1 1 (O,%) 1 1 (O,%) 1 1 (O,%) bp bp bp CXCL1(185bp) IL-1β(71bp) (317bp) g Blots and Gels; Figure 7 Fig.7a Microglia HIF-1 +f/+f LysM-Hif-1 -/- Microglia HIF-1 +f/+f LysM-Hif-1 -/- #1 # #1 # #1 # #1 # bp 1bp HIF1 (16bp) 1bp GAPDH (13bp) Fig.7b HIF-1 +f/+f LysM-Hif-1 -/- HIF-1 +f/+f LysM-Hif-1 -/- bp (3bp) bp (317bp) Supplementary Figure 11 Full scans of blots and gels for Figure 1 (a), Figure (b), Figure 3 (c), Figure (d), Figure 5(e). Figure 6 (f), and Figure 7 (g).
Supplementary Table 3. 3 UTR primer sequences. Primer sequences used to amplify and clone the 3 UTR of each indicated gene are listed.
 Supplemental Figure 1. DLKI-DIO3 mirna/mrna complementarity. Complementarity between the indicated DLK1-DIO3 cluster mirnas and the UTR of SOX2, SOX9, HIF1A, ZEB1, ZEB2, STAT3 and CDH1with mirsvr and PhastCons
c Tuj1(-) apoptotic live 1 DIV 2 DIV 1 DIV 2 DIV Tuj1(+) Tuj1/GFP/DAPI Tuj1 DAPI GFP
 apoptotic live 1 DIV 2 DIV 1 DIV 2 DIV Tuj1(+) Tuj1/GFP/DAPI Tuj1 DAPI GFP") Supplementary Figure 1 Establishment of the gain- and loss-of-function experiments and cell survival assays. a Relative expression of mature mir-484 30 20 10 0 **** **** NCP mir- 484P NCP mir- 484P b Relative
Supplementary Figure 1 Establishment of the gain- and loss-of-function experiments and cell survival assays. a Relative expression of mature mir-484 30 20 10 0 **** **** NCP mir- 484P NCP mir- 484P b Relative
Toluidin-Staining of mast cells Ear tissue was fixed with Carnoy (60% ethanol, 30% chloroform, 10% acetic acid) overnight at 4 C, afterwards
 overnight at 4 C, afterwards") Toluidin-Staining of mast cells Ear tissue was fixed with Carnoy (60% ethanol, 30% chloroform, 10% acetic acid) overnight at 4 C, afterwards incubated in 100 % ethanol overnight at 4 C and embedded in
Toluidin-Staining of mast cells Ear tissue was fixed with Carnoy (60% ethanol, 30% chloroform, 10% acetic acid) overnight at 4 C, afterwards incubated in 100 % ethanol overnight at 4 C and embedded in
a) Primary cultures derived from the pancreas of an 11-week-old Pdx1-Cre; K-MADM-p53
 Primary cultures derived from the pancreas of an 11-week-old Pdx1-Cre; K-MADM-p53") 1 2 3 4 5 6 7 8 9 10 Supplementary Figure 1. Induction of p53 LOH by MADM. a) Primary cultures derived from the pancreas of an 11-week-old Pdx1-Cre; K-MADM-p53 mouse revealed increased p53 KO/KO (green,
1 2 3 4 5 6 7 8 9 10 Supplementary Figure 1. Induction of p53 LOH by MADM. a) Primary cultures derived from the pancreas of an 11-week-old Pdx1-Cre; K-MADM-p53 mouse revealed increased p53 KO/KO (green,
Figure S1. Analysis of genomic and cdna sequences of the targeted regions in WT-KI and
 Figure S1. Analysis of genomic and sequences of the targeted regions in and indicated mutant KI cells, with WT and corresponding mutant sequences underlined. (A) cells; (B) K21E-KI cells; (C) D33A-KI cells;
Supplementary Document
 Supplementary Document 1. Supplementary Table legends 2. Supplementary Figure legends 3. Supplementary Tables 4. Supplementary Figures 5. Supplementary References 1. Supplementary Table legends Suppl.
Supplemental Data. Shin et al. Plant Cell. (2012) /tpc YFP N
 /tpc YFP N") MYC YFP N PIF5 YFP C N-TIC TIC Supplemental Data. Shin et al. Plant Cell. ()..5/tpc..95 Supplemental Figure. TIC interacts with MYC in the nucleus. Bimolecular fluorescence complementation assay using
MYC YFP N PIF5 YFP C N-TIC TIC Supplemental Data. Shin et al. Plant Cell. ()..5/tpc..95 Supplemental Figure. TIC interacts with MYC in the nucleus. Bimolecular fluorescence complementation assay using
Supplementary Figure 1 a
 Supplementary Figure a Normalized expression/tbp (A.U.).6... Trip-br transcripts Trans Trans Trans b..5. Trip-br Ctrl LPS Normalized expression/tbp (A.U.) c Trip-br transcripts. adipocytes.... Trans Trans
CD31 5'-AGA GAC GGT CTT GTC GCA GT-3' 5 ' -TAC TGG GCT TCG AGA GCA GT-3'
 Table S1. The primer sets used for real-time RT-PCR analysis. Gene Forward Reverse VEGF PDGFB TGF-β MCP-1 5'-GTT GCA GCA TGA ATC TGA GG-3' 5'-GGA GAC TCT TCG AGG AGC ACT T-3' 5'-GAA TCA GGC ATC GAG AGA
Supplementary Figure 1. ROS induces rapid Sod1 nuclear localization in a dosagedependent manner. WT yeast cells (SZy1051) were treated with 4NQO at
 were treated with 4NQO at") Supplementary Figure 1. ROS induces rapid Sod1 nuclear localization in a dosagedependent manner. WT yeast cells (SZy1051) were treated with 4NQO at different concentrations for 30 min and analyzed for
Supplementary Figure 1. ROS induces rapid Sod1 nuclear localization in a dosagedependent manner. WT yeast cells (SZy1051) were treated with 4NQO at different concentrations for 30 min and analyzed for
Abbreviations: P- paraffin-embedded section; C, cryosection; Bio-SA, biotin-streptavidin-conjugated fluorescein amplification.
 Supplementary Table 1. Sequence of primers for real time PCR. Gene Forward primer Reverse primer S25 5 -GTG GTC CAC ACT ACT CTC TGA GTT TC-3 5 - GAC TTT CCG GCA TCC TTC TTC-3 Mafa cds 5 -CTT CAG CAA GGA
Supplementary Materials
 Supplementary Materials 1 Supplementary Table 1. List of primers used for quantitative PCR analysis. Gene name Gene symbol Accession IDs Sequence range Product Primer sequences size (bp) β-actin Actb gi
Nature Structural & Molecular Biology: doi: /nsmb Supplementary Figure 1
 Supplementary Figure 1 U1 inhibition causes a shift of RNA-seq reads from exons to introns. (a) Evidence for the high purity of 4-shU-labeled RNAs used for RNA-seq. HeLa cells transfected with control
Supplementary Figure 1 MicroRNA expression in human synovial fibroblasts from different locations. MicroRNA, which were identified by RNAseq as most
 Supplementary Figure 1 MicroRNA expression in human synovial fibroblasts from different locations. MicroRNA, which were identified by RNAseq as most differentially expressed between human synovial fibroblasts
Nature Immunology: doi: /ni.3836
 Supplementary Figure 1 Recombinant LIGHT-VTP induces pericyte contractility and endothelial cell activation. (a) Western blot showing purification steps for full length murine LIGHT-VTP (CGKRK) protein:
Supplementary Appendix
 Supplementary Appendix This appendix has been provided by the authors to give readers additional information about their work. Supplement to: Sherman SI, Wirth LJ, Droz J-P, et al. Motesanib diphosphate
Supplemental Information. Cancer-Associated Fibroblasts Neutralize. the Anti-tumor Effect of CSF1 Receptor Blockade
 Cancer Cell, Volume 32 Supplemental Information Cancer-Associated Fibroblasts Neutralize the Anti-tumor Effect of CSF1 Receptor Blockade by Inducing PMN-MDSC Infiltration of Tumors Vinit Kumar, Laxminarasimha
Supplementary Figures
 Supplementary Figures Supplementary Figure 1. H3F3B expression in lung cancer. a. Comparison of H3F3B expression in relapsed and non-relapsed lung cancer patients. b. Prognosis of two groups of lung cancer
Supplementary Table 2. Conserved regulatory elements in the promoters of CD36.
 Supplementary Table 1. RT-qPCR primers for CD3, PPARg and CEBP. Assay Forward Primer Reverse Primer 1A CAT TTG TGG CCT TGT GCT CTT TGA TGA GTC ACA GAA AGA ATC AAT TC 1B AGG AAA TGA ACT GAT GAG TCA CAG
Table S1. Oligonucleotides used for the in-house RT-PCR assays targeting the M, H7 or N9. Assay (s) Target Name Sequence (5 3 ) Comments
 Target Name Sequence (5 3 ) Comments") SUPPLEMENTAL INFORMATION 2 3 Table S. Oligonucleotides used for the in-house RT-PCR assays targeting the M, H7 or N9 genes. Assay (s) Target Name Sequence (5 3 ) Comments CDC M InfA Forward (NS), CDC M
SUPPLEMENTAL INFORMATION 2 3 Table S. Oligonucleotides used for the in-house RT-PCR assays targeting the M, H7 or N9 genes. Assay (s) Target Name Sequence (5 3 ) Comments CDC M InfA Forward (NS), CDC M
SUPPLEMENTARY INFORMATION
 doi: 10.1038/nature05883 SUPPLEMENTARY INFORMATION Supplemental Figure 1 Prostaglandin agonists and antagonists alter runx1/cmyb expression. a-e, Embryos were exposed to (b) PGE2 and (c) PGI2 (20μM) and
Supplemental Information. Th17 Lymphocytes Induce Neuronal. Cell Death in a Human ipsc-based. Model of Parkinson's Disease
 Cell Stem Cell, Volume 23 Supplemental Information Th17 Lymphocytes Induce Neuronal Cell Death in a Human ipsc-based Model of Parkinson's Disease Annika Sommer, Franz Maxreiter, Florian Krach, Tanja Fadler,
SUPPLEMENTARY DATA. Supplementary Table 1. Primer sequences for qrt-pcr
 Supplementary Table 1. Primer sequences for qrt-pcr Gene PRDM16 UCP1 PGC1α Dio2 Elovl3 Cidea Cox8b PPARγ AP2 mttfam CyCs Nampt NRF1 16s-rRNA Hexokinase 2, intron 9 β-actin Primer Sequences 5'-CCA CCA GCG
Supplementary Materials and Methods
 DD2 suppresses tumorigenicity of ovarian cancer cells by limiting cancer stem cell population Chunhua Han et al. Supplementary Materials and Methods Analysis of publicly available datasets: To analyze
Supplementary Figure 1
 Supplementary Figure 1 Supplementary Figure 1. Lats1/2 deleted ihbs and ihps showed decreased transcripts of hepatocyte related genes (a and b) Western blots (a) and recombination PCR (b) of control and
Formylpeptide receptor2 contributes to colon epithelial homeostasis, inflammation, and tumorigenesis
 Supplementary Data Formylpeptide receptor2 contributes to colon epithelial homeostasis, inflammation, and tumorigenesis Keqiang Chen, Mingyong Liu, Ying Liu, Teizo Yoshimura, Wei Shen, Yingying Le, Scott
Citation for published version (APA): Oosterveer, M. H. (2009). Control of metabolic flux by nutrient sensors Groningen: s.n.
: Oosterveer, M. H. (2009). Control of metabolic flux by nutrient sensors Groningen: s.n.") University of Groningen Control of metabolic flux by nutrient sensors Oosterveer, Maaike IMPORTANT NOTE: You are advised to consult the publisher's version (publisher's PDF) if you wish to cite from it.
University of Groningen Control of metabolic flux by nutrient sensors Oosterveer, Maaike IMPORTANT NOTE: You are advised to consult the publisher's version (publisher's PDF) if you wish to cite from it.
BIOLOGY 621 Identification of the Snorks
 Name: Date: Block: BIOLOGY 621 Identification of the Snorks INTRODUCTION: In this simulation activity, you will examine the DNA sequence of a fictitious organism - the Snork. Snorks were discovered on
Astaxanthin prevents and reverses diet-induced insulin resistance and. steatohepatitis in mice: A comparison with vitamin E
 Supplementary Information Astaxanthin prevents and reverses diet-induced insulin resistance and steatohepatitis in mice: A comparison with vitamin E Yinhua Ni, 1,2 Mayumi Nagashimada, 1 Fen Zhuge, 1 Lili
Beta Thalassemia Case Study Introduction to Bioinformatics
 Beta Thalassemia Case Study Sami Khuri Department of Computer Science San José State University San José, California, USA sami.khuri@sjsu.edu www.cs.sjsu.edu/faculty/khuri Outline v Hemoglobin v Alpha
ice-cold 70% ethanol with gentle vortexing, incubated at -20 C for 4 hours, and washed with PBS.
 Cell cycle analysis For cell cycle analysis, single cell suspensions of E12.5 fetal liver cells were suspended in 4 ml ice-cold 7% ethanol with gentle vortexing, incubated at -2 C for 4 hours, and washed
Supplementary Figure 1a
 Supplementary Figure 1a Hours: E-cadherin TGF-β On TGF-β Off 0 12 24 36 48 24 48 72 Vimentin βactin Fig. S1a. Treatment of AML12 cells with TGF-β induces EMT. Treatment of AML12 cells with TGF-β results
Supplementary Fig. 1 No relative growth advantage of Foxp3 negative cells.
 Supplementary Fig. 1 Supplementary Figure S1: No relative growth advantage of Foxp3 negative cells. itreg were induced from WT (A) or FIR (B) CD4 + T cells. FIR itregs were then removed from the TCR signal
Supplementary Information
 Supplementary Information Remodeling of heterochromatin structure slows neuropathological progression and prolongs survival in an animal model of Huntington s disease Junghee Lee, Yu Jin Hwang, Yunha Kim,
Supplementary Figure 1
 Supplementary Figure 1 Supplementary Figure 1: Cryopreservation alters CD62L expression by CD4 T cells. Freshly isolated (left) or cryopreserved PBMCs (right) were stained with the mix of antibodies described
Plasmids Western blot analysis and immunostaining Flow Cytometry Cell surface biotinylation RNA isolation and cdna synthesis
 Plasmids psuper-retro-s100a10 shrna1 was constructed by cloning the dsdna oligo 5 -GAT CCC CGT GGG CTT CCA GAG CTT CTT TCA AGA GAA GAA GCT CTG GAA GCC CAC TTT TTA-3 and 5 -AGC TTA AAA AGT GGG CTT CCA GAG
Journal of Cell Science Supplementary information. Arl8b +/- Arl8b -/- Inset B. electron density. genotype
 J. Cell Sci. : doi:.4/jcs.59: Supplementary information E9. A Arl8b /- Arl8b -/- Arl8b Arl8b non-specific band Gapdh Tbp E7.5 HE Inset B D Control al am hf C E Arl8b -/- al am hf E8.5 F low middle high
A smart acid nanosystem for ultrasensitive. live cell mrna imaging by the target-triggered intracellular self-assembly
 Electronic Supplementary Material (ESI) for Chemical Science. This journal is The Royal Society of Chemistry 2017 A smart ZnO@polydopamine-nucleic acid nanosystem for ultrasensitive live cell mrna imaging
Cross-talk between mineralocorticoid and angiotensin II signaling for cardiac
 ONLINE SUPPLEMENT TO Crosstalk between mineralocorticoid and angiotensin II signaling for cardiac remodeling An Di ZHANG,,3, Aurelie NGUYEN DINH CAT*,,3, Christelle SOUKASEUM *,,3, Brigitte ESCOUBET, 4,
Beta Thalassemia Sami Khuri Department of Computer Science San José State University Spring 2015
 Bioinformatics in Medical Product Development SMPD 287 Three Beta Thalassemia Sami Khuri Department of Computer Science San José State University Hemoglobin Outline Anatomy of a gene Hemoglobinopathies
Description of Supplementary Files. File Name: Supplementary Information Description: Supplementary Figures and Supplementary Tables
 Description of Supplementary Files File Name: Supplementary Information Description: Supplementary Figures and Supplementary Tables Supplementary Figure 1: (A), HCT116 IDH1-WT and IDH1-R132H cells were
Supplementary Figure 1
 Metastatic melanoma Primary melanoma Healthy human skin Supplementary Figure 1 CD22 IgG4 Supplementary Figure 1: Immunohisochemical analysis of CD22+ (left) and IgG4 (right), cells (shown in red and indicated
SUPPLEMENTARY INFORMATION
 BASELINE ISCHAEMIA a b Phd2 +/- c d Collateral growth and maintenance SMC recruitment SMC proliferation Phd2 +/- NF- B off NF- B on NF- B on NF- B on Endothelial cell Smooth muscle cell Pro-arteriogenic
Supplementary Information. Bamboo shoot fiber prevents obesity in mice by. modulating the gut microbiota
 Supplementary Information Bamboo shoot fiber prevents obesity in mice by modulating the gut microbiota Xiufen Li 1,2, Juan Guo 1, Kailong Ji 1,2, and Ping Zhang 1,* 1 Key Laboratory of Tropical Plant Resources
An epithelial circadian clock controls pulmonary inflammation and glucocorticoid action
 An epithelial circadian clock controls pulmonary inflammation and glucocorticoid action Supplementary Figure : Expression levels of toll-like receptor 4 (Tlr4) in muse lung does not change throughout the
 www.lessonplansinc.com Topic: Protein Synthesis - Sentence Activity Summary: Students will simulate transcription and translation by building a sentence/polypeptide from words/amino acids. Goals & Objectives:
SUPPORTING INFORMATION
 SUPPORTING INFORMATION Biology is different in small volumes: endogenous signals shape phenotype of primary hepatocytes cultured in microfluidic channels Amranul Haque, Pantea Gheibi, Yandong Gao, Elena
Culture Density (OD600) 0.1. Culture Density (OD600) Culture Density (OD600) Culture Density (OD600) Culture Density (OD600)
 0.1. Culture Density (OD600) Culture Density (OD600) Culture Density (OD600) Culture Density (OD600)") A. B. C. D. E. PA JSRI JSRI 2 PA DSAM DSAM 2 DSAM 3 PA LNAP LNAP 2 LNAP 3 PAO Fcor Fcor 2 Fcor 3 PAO Wtho Wtho 2 Wtho 3 Wtho 4 DTSB Low Iron 2 4 6 8 2 4 6 8 2 22 DTSB Low Iron 2 4 6 8 2 4 6 8 2 22 DTSB
A. B. C. D. E. PA JSRI JSRI 2 PA DSAM DSAM 2 DSAM 3 PA LNAP LNAP 2 LNAP 3 PAO Fcor Fcor 2 Fcor 3 PAO Wtho Wtho 2 Wtho 3 Wtho 4 DTSB Low Iron 2 4 6 8 2 4 6 8 2 22 DTSB Low Iron 2 4 6 8 2 4 6 8 2 22 DTSB
Phylogenetic analysis of human and chicken importins. Only five of six importins were studied because
 Supplementary Figure S1 Phylogenetic analysis of human and chicken importins. Only five of six importins were studied because importin-α6 was shown to be testis-specific. Human and chicken importin protein
*To whom correspondence should be addressed. This PDF file includes:
 www.sciencemag.org/cgi/content/full/science.1212182/dc1 Supporting Online Material for Partial Retraction to Detection of an Infectious Retrovirus, XMRV, in Blood Cells of Patients with Chronic Fatigue
BHP 2-7 and Nthy-ori 3-1 cells were grown in RPMI1640 medium (Hyclone) supplemented with 10% fetal bovine serum (Gibco), 2mM L-glutamine, and 100 U/mL
 supplemented with 10% fetal bovine serum (Gibco), 2mM L-glutamine, and 100 U/mL") 1 2 3 4 Materials and Methods Cell culture BHP 2-7 and Nthy-ori 3-1 cells were grown in RPMI1640 medium (Hyclone) 5 supplemented with 10% fetal bovine serum (Gibco), 2mM L-glutamine, and 100 U/mL 6 penicillin-streptomycin.
1 2 3 4 Materials and Methods Cell culture BHP 2-7 and Nthy-ori 3-1 cells were grown in RPMI1640 medium (Hyclone) 5 supplemented with 10% fetal bovine serum (Gibco), 2mM L-glutamine, and 100 U/mL 6 penicillin-streptomycin.
Supplementary information
 Supplementary information Unique polypharmacology nuclear receptor modulator blocks inflammatory signaling pathways Mi Ra Chang 1, Anthony Ciesla 1, Timothy S. Strutzenberg 1, Scott J. Novick 1, Yuanjun
A basic helix loop helix transcription factor controls cell growth
 A basic helix loop helix transcription factor controls cell growth and size in root hairs Keke Yi 1,2, Benoît Menand 1,3, Elizabeth Bell 1, Liam Dolan 1,4 Supplementary note Low soil phosphate availability
Supplementary Materials for
 www.sciencesignaling.org/cgi/content/full/10/473/eaai7696/dc1 Supplementary Materials for Astrocyte-shed extracellular vesicles regulate the peripheral leukocyte response to inflammatory brain lesions
Viral hepatitis, which affects half a billion people
 GASTROENTEROLOGY 2006;130:435 452 BASIC LIVER, PANCREAS, AND BILIARY TRACT Natural Killer Cells Ameliorate Liver Fibrosis by Killing Activated Stellate Cells in NKG2D-Dependent and Tumor Necrosis Factor
SUPPLEMENTARY RESULTS
 SUPPLEMENTARY RESULTS Supplementary Table 1. hfpr1- Flpln-CHO hfpr2-flpln-cho pec 50 E max (%) Log( /K A) Log( /K A) N pec 50 E max (%) Log( /K A) Log( /K A) n ERK1/2 phosphorylation fmlp 9.0±0.6 80±7
Supplemental Figures: Supplemental Figure 1
 Supplemental Figures: Supplemental Figure 1 Suppl. Figure 1. BM-DC infection with H. pylori does not induce cytotoxicity and treatment of BM-DCs with H. pylori sonicate, but not heat-inactivated bacteria,
Supporting Information. Mutational analysis of a phenazine biosynthetic gene cluster in
 Supporting Information for Mutational analysis of a phenazine biosynthetic gene cluster in Streptomyces anulatus 9663 Orwah Saleh 1, Katrin Flinspach 1, Lucia Westrich 1, Andreas Kulik 2, Bertolt Gust
Supplemental Methods Supplemental Table 1. Supplemental Figure 1. Supplemental Figure 2. Supplemental Figure 3. Supplemental Figure 4.
 Supplemental Methods TGF-B1 ELISA Supernatants were collected from AT2 cells cultured for 1, 2, 3, or 4 days and frozen at -80 degrees C until use in the ELISA. A commercially available mouse TGF-B1 Duo
Baseline clinical characteristics for the 81 CMML patients Routine diagnostic testing and statistical analyses... 3
 Next-Generation Sequencing Technology Reveals a Characteristic Pattern of Molecular Mutations in 72.8% of Chronic Myelomonocytic Leukemia (CMML) by Detecting Frequent Alterations in TET2, CBL, RAS, and
TetR repressor-based bioreporters for the detection of doxycycline using Escherichia
 Supplementary materials TetR repressor-based bioreporters for the detection of doxycycline using Escherichia coli and Acinetobacter oleivorans Hyerim Hong and Woojun Park * Department of Environmental
CIRCRESAHA/2004/098145/R1 - ONLINE 1. Validation by Semi-quantitative Real-Time Reverse Transcription PCR
 CIRCRESAHA/2004/098145/R1 - ONLINE 1 Expanded Materials and Methods Validation by Semi-quantitative Real-Time Reverse Transcription PCR Expression patterns of 13 genes (Online Table 2), selected with respect
Single-Molecule Analysis of Gene Expression Using Two-Color RNA- Labeling in Live Yeast
 Supplemental Figures, Tables and Results Single-Molecule Analysis of Gene Expression Using Two-Color RNA- Labeling in Live Yeast Sami Hocine 1, Pascal Raymond 2, Daniel Zenklusen 2, Jeffrey A. Chao 1 &
Expression of Selected Inflammatory Cytokine Genes in Bladder Biopsies
 Borneo Journal of Resource Science and Technology (2013) 3(2): 15-20 Expression of Selected Inflammatory Cytokine Genes in Bladder Biopsies EDMUND UI-HANG SIM *1, NUR DIANA ANUAR 2, TENG-AIK ONG 3, GUAN-
mir-1202: A Primate Specific and Brain Enriched mirna Involved in Major Depression and Antidepressant Treatment. Supplementary Information
 Title: mir-1202: A Primate Specific and Brain Enriched mirna Involved in Major Depression and Antidepressant Treatment. Authors: Juan Pablo Lopez 1, Raymond Lim 3, Cristiana Cruceanu 1, Liam Crapper 1,
Supporting Information
 Supporting Information Malapeira et al. 10.1073/pnas.1217022110 SI Materials and Methods Plant Material and Growth Conditions. A. thaliana seedlings were stratified at 4 C in the dark for 3 d on Murashige
University of Groningen. Vasoregression in incipient diabetic retinopathy Pfister, Frederick
 University of Groningen Vasoregression in incipient diabetic retinopathy Pfister, Frederick IMPORTANT NOTE: You are advised to consult the publisher's version (publisher's PDF) if you wish to cite from
Resistance to Tetracycline Antibiotics by Wangrong Yang, Ian F. Moore, Kalinka P. Koteva, Donald W. Hughes, David C. Bareich and Gerard D. Wright.
 Supplementary Data for TetX is a Flavin-Dependent Monooxygenase Conferring Resistance to Tetracycline Antibiotics by Wangrong Yang, Ian F. Moore, Kalinka P. Koteva, Donald W. Hughes, David C. Bareich and
SUPPLEMENTARY INFORMATION
 SUPPLEMENTARY INFORMATION doi:10.1038/nature10743 Supplementary Figures and Legends Supplementary Figure 1. CYP17A1 (red boxes) lies at the intersection of steroid hormone biosynthetic pathways. CYP17A1
Lezione 10. Sommario. Bioinformatica. Lezione 10: Sintesi proteica Synthesis of proteins Central dogma: DNA makes RNA makes proteins Genetic code
 Lezione 10 Bioinformatica Mauro Ceccanti e Alberto Paoluzzi Lezione 10: Sintesi proteica Synthesis of proteins Dip. Informatica e Automazione Università Roma Tre Dip. Medicina Clinica Università La Sapienza
Mutation analysis of a Chinese family with oculocutaneous albinism
 /, 2016, Vol. 7, (No. 51), pp: 84981-84988 Mutation analysis of a Chinese family with oculocutaneous albinism Xiong Wang 1, Yaowu Zhu 1, Na Shen 1, Jing Peng 1, Chunyu Wang 1, Haiyi Liu 2, Yanjun Lu 1
Isolate Sexual Idiomorph Species
 SUPLEMENTARY TABLE 1. Isolate identification, sexual idiomorph and species of each isolate used for MAT locus distribution in Paracoccidioides species. Isolate Sexual Idiomorph Species Pb01 MAT1-1 P. lutzii
SUPPLEMENTAL METHODS Cell culture RNA extraction and analysis Immunohistochemical analysis and laser capture microdissection (LCM)
") SUPPLEMENTAL METHODS Cell culture Human peripheral blood mononuclear cells were isolated from healthy donors by Ficoll density gradient centrifugation. Monocyte differentiation to resting macrophages ()
SUPPLEMENTAL METHODS Cell culture Human peripheral blood mononuclear cells were isolated from healthy donors by Ficoll density gradient centrifugation. Monocyte differentiation to resting macrophages ()
Loyer, et al. microrna-21 contributes to NASH Suppl 1/15
 Loyer, et al. microrna-21 contributes to NASH Suppl 1/15 SUPPLEMENTARY MATERIAL: Liver MicroRNA-21 is Overexpressed in Non Alcoholic Steatohepatitis and Contributes to the Disease in Experimental Models
Development of RT-qPCR-based molecular diagnostic assays for therapeutic target selection of breast cancer patients
 Development of RT-qPCR-based molecular diagnostic assays for therapeutic target selection of breast cancer patients Sangjung Park The Graduate School Yonsei University Department of Biomedical Laboratory
Mutation Screening and Association Studies of the Human UCP 3 Gene in Normoglycemic and NIDDM Morbidly Obese Patients
 Mutation Screening and Association Studies of the Human UCP 3 Gene in Normoglycemic and NIDDM Morbidly Obese Patients Shuichi OTABE, Karine CLEMENT, Séverine DUBOIS, Frederic LEPRETRE, Veronique PELLOUX,
Relationship of the APOA5/A4/C3/A1 gene cluster and APOB gene polymorphisms with dyslipidemia
 elationship of the APOA5/A4/C3/A1 gene cluster and APOB gene polymorphisms with dyslipidemia H.J. Ou 1, G. Huang 2, W. Liu 3, X.L. Ma 2, Y. Wei 4, T. Zhou 5 and Z.M. Pan 3 1 Department of Neurology, The
McAlpine PERK-GSK3 regulates foam cell formation. Supplemental Material. Supplementary Table I. Sequences of real time PCR primers.
 Mclpine PERK-GSK3 regulates foam cell formation Supplemental Material Supplementary Table I. Sequences of real time PCR primers. Primer Name Primer Sequences (5-3 ) Product Size (bp) GRP78 (human) Fwd:
Supplementary Data. Clinical Setup. References. Program for Embryo Donation
 Supplementary Data Clinical Setup Notwithstanding their value in stem cell research, the source of supernumerary human blastocysts for the derivation of new stem cell lines and the modalities of their
without LOI phenotype by breeding female wild-type C57BL/6J and male H19 +/.
 Sakatani et al. 1 Supporting Online Material Materials and methods Mice and genotyping: H19 mutant mice with C57BL/6J background carrying a deletion in the structural H19 gene (3 kb) and 10 kb of 5 flanking
PATIENTS AND METHODS. Subjects
 PATIENTS AND METHODS Subjects Twenty-nine morbidly obese subjects involved in a gastric surgery program were enrolled in the study between October 25 and March 21. Bariatric surgery was performed in patients
Supplementary Figure 1: GPCR profiling and G q signaling in murine brown adipocytes (BA). a, Number of GPCRs with 2-fold lower expression in mature
. a, Number of GPCRs with 2-fold lower expression in mature") Supplementary Figure 1: GPCR profiling and G q signaling in murine brown adipocytes (BA). a, Number of GPCRs with 2-fold lower expression in mature BA vs. preadipocytes. b, Number of GPCRs with 2-fold
Supplementary Figure 1: GPCR profiling and G q signaling in murine brown adipocytes (BA). a, Number of GPCRs with 2-fold lower expression in mature BA vs. preadipocytes. b, Number of GPCRs with 2-fold
Nucleotide Sequence of the Australian Bluetongue Virus Serotype 1 RNA Segment 10
 J. gen. Virol. (1988), 69, 945-949. Printed in Great Britain 945 Key words: BTV/genome segment lo/nucleotide sequence Nucleotide Sequence of the Australian Bluetongue Virus Serotype 1 RNA Segment 10 By
Table S1. Primers used to quantitatively amplify the human mirnas precursors and indicated genes
 Table S1. Primers used to quantitatively amplify the human mirnas precursors and indicated genes Forward primer (5 3 ) Rervese primer (5 3 ) U6 CTCGCTTCGGCAGCACA AACGCTTCACGAATTTGCGT 5S TACGGCCATACCACCCTGAA
Malignant Amelanotic Melanoma of the Pleura without Primary Skin Lesion: An Autopsy Case Report. a a*
 2009 63 6 379 384 Malignant Amelanotic Melanoma of the Pleura without Primary Skin Lesion: An Autopsy Case Report a b a a a* a b 380 63 6 Chest x ray and computed tomography (CT). A, Chest x ray on admission
The Clinical Performance of Primary HPV Screening, Primary HPV Screening Plus Cytology Cotesting, and Cytology Alone at a Tertiary Care Hospital
 The Clinical Performance of Primary HPV Screening, Primary HPV Screening Plus Cytology Cotesting, and Cytology Alone at a Tertiary Care Hospital Jung-Woo Choi MD, PhD; Younghye Kim MD, PhD; Ju-Han Lee
Activated Liver X Receptors Stimulate Adipocyte Differentiation through Induction of Peroxisome Proliferator-Activated Receptor Expression
 MOLECULAR AND CELLULAR BIOLOGY, Apr. 2004, p. 3430 3444 Vol. 24, No. 8 0270-7306/04/$08.00 0 DOI: 10.1128/MCB.24.8.3430 3444.2004 Copyright 2004, American Society for Microbiology. All Rights Reserved.
Enhanced detection and serotyping of Streptococcus pneumoniae using multiplex polymerase chain reaction
 Original article http://dx.doi.org/10.3345/kjp.2012.55.11.424 Korean J Pediatr 2012;55(11):424-429 eissn 1738-1061 pissn 2092-7258 Enhanced detection and serotyping of Streptococcus pneumoniae using multiplex
What do you think of when you here the word genome?
 What do you think of when you here the word genome? What do you think of when you here the word genome? Personal Genomics Outline Review of pre-lab work Genomics and Medicine Case Overview & Assignment
Cancer Genetics 204 (2011) 45e52
 45e52") Cancer Genetics 204 (2011) 45e52 Exon scanning by reverse transcriptaseepolymerase chain reaction for detection of known and novel EML4eALK fusion variants in nonesmall cell lung cancer Heather R. Sanders
Cancer Genetics 204 (2011) 45e52 Exon scanning by reverse transcriptaseepolymerase chain reaction for detection of known and novel EML4eALK fusion variants in nonesmall cell lung cancer Heather R. Sanders
Integration Solutions
 Integration Solutions (1) a) With no active glycosyltransferase of either type, an ii individual would not be able to add any sugars to the O form of the lipopolysaccharide. Thus, the only lipopolysaccharide
Mechanistic and functional insights into fatty acid activation in Mycobacterium tuberculosis SUPPLEMENTARY INFORMATION
 Mechanistic and functional insights into fatty acid activation in Mycobacterium tuberculosis Pooja Arora 1, Aneesh Goyal 2, Vivek T atarajan 1, Eerappa Rajakumara 2, Priyanka Verma 1, Radhika Gupta 3,
Supplementary information
 Supplementary information Full methods The conduct of the study was approved by an NHS research ethical committee prior to commencement (reference 12/WS/0288) and was conducted according to the principles
CSF1R antagonism limits local restimulation of antiviral CD8 + T cells during viral encephalitis
 Funk and Klein Journal of Neuroinflammation (2019) 16:22 https://doi.org/10.1186/s12974-019-1397-4 RESEARCH Open Access CSF1R antagonism limits local restimulation of antiviral CD8 + T cells during viral
Rapid blue-light mediated induction of protein interactions in living cells
 Nature Methods Rapid blue-light mediated induction of protein interactions in living cells Matthew J Kennedy, Robert M Hughes, Leslie A Peteya, Joel W Schwartz, Michael D Ehlers & Chandra L Tucker Supplementary
SUPPLEMENTARY INFORMATION Glucosylceramide synthase (GlcT-1) in the fat body controls energy metabolism in Drosophila
 in the fat body controls energy metabolism in Drosophila") SUPPLEMENTARY INFORMATION Glucosylceramide synthase (GlcT-1) in the fat body controls energy metabolism in Drosophila Ayako Kohyama-Koganeya, 1,2 Takuji Nabetani, 1 Masayuki Miura, 2,3 Yoshio Hirabayashi
SUPPLEMENTARY INFORMATION Glucosylceramide synthase (GlcT-1) in the fat body controls energy metabolism in Drosophila Ayako Kohyama-Koganeya, 1,2 Takuji Nabetani, 1 Masayuki Miura, 2,3 Yoshio Hirabayashi
3) Table_S1: Clinical Characteristics of Breast Cancer Patients. 5) Table_S3: Primer sequences used for qt-pcr of ChIP samples
 Table_S1: Clinical Characteristics of Breast Cancer Patients. 5) Table_S3: Primer sequences used for qt-pcr of ChIP samples") Supplemental Section: 1) Eight supplemental figures and legends 2) Supplemental Materials and Methods 3) Table_S1: Clinical Characteristics of Breast Cancer Patients 4) Table_S2: Oligonucleotide sequences
Supplemental Section: 1) Eight supplemental figures and legends 2) Supplemental Materials and Methods 3) Table_S1: Clinical Characteristics of Breast Cancer Patients 4) Table_S2: Oligonucleotide sequences
mm Distance (mm)
") b a Magnet Illumination Coverslips MPs Objective 2575 µm 1875 µm 1575 µm 1075 µm 875 µm 545 µm 20µm 2 3 0.5 0.3mm 1 1000 100 10 1 0.1 1000 100 10 1 0.1 Field Induction (Gauss) 1.5 0 5 10 15 20 Distance
b a Magnet Illumination Coverslips MPs Objective 2575 µm 1875 µm 1575 µm 1075 µm 875 µm 545 µm 20µm 2 3 0.5 0.3mm 1 1000 100 10 1 0.1 1000 100 10 1 0.1 Field Induction (Gauss) 1.5 0 5 10 15 20 Distance
Genome-wide identification of TCF7L2/TCF4 target mirnas reveals a role for mir-21 in Wnt-driven epithelial cancer
 INTERNATIONAL JOURNAL OF ONCOLOGY 40: 519-526, 2012 Genome-wide identification of TCF7L2/TCF4 target mirnas reveals a role for mir-21 in Wnt-driven epithelial cancer FENGMING LAN 1-3*, XIAO YUE 1-3,5*,
Supplementary Figure S1
 Supplementry Figure S Tissue weights (g).... Liver Hert Brin Pncres Len mss (g) 8 6 -% +% 8 6 Len mss Len mss (g) (% ody weight) Len mss (% ody weight) c Tiilis nterior weight (g).6...... Qudriceps weight