nature methods Organelle-specific, rapid induction of molecular activities and membrane tethering
|
|
|
- Deborah Lindsey
- 5 years ago
- Views:
Transcription
1 nature methods Organelle-specific, rapid induction of molecular activities and membrane tethering Toru Komatsu, Igor Kukelyansky, J Michael McCaffery, Tasuku Ueno, Lidenys C Varela & Takanari Inoue Supplementary figures and text: Supplementary Figure 1 Supplementary Figure 2 Supplementary Figure 3 Supplementary Figure 4 Supplementary Figure 5 Supplementary Figure 6 Supplementary Figure 7 Supplementary Figure 8 Supplementary Figure 9 Supplementary Table 1 Organelle targeting motifs. Colocalization analysis of the anchor units with orthogonal organelle markers. Kinetic analysis of organelle targeted translocation. Quantification of the expression level of the dimerizer constructs. Visualizing ERK phosphorylation by immunohistochemistry. Effect of rapamycin analogs on the Ras-MAPK signaling pathway. TEM images of membrane junction sites created by inducible ER-mitochondria connection. Confocal fluorescence images of NBD-labeled phosphatidylserine upon induction of synthetic ER-mitochondria tethering. Confocal fluorescence images of HeLa cells showing hetero-organelle interactions upon irap addition. A list of PCR primers used in the study. Note: Supplementary Videos 1 6 are available on the Nature Methods website.


 Mitochondria Tom20 (1-33),")
 Lysosome")
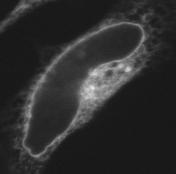
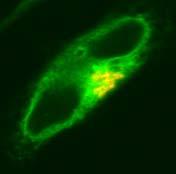
2 Supplementary Figure 1 a Giantin SARS Corona virus M protein Glucosylceramide transferase Galactosyl transferase b Organelle Targeting motif Golgi Giantin ( ) Mitochondria Tom20 (1-33), Monoamine Oxidase A ( ) ER Cytochrome b5 ( ) Lysosome Lysosomal-associated membrane protein 1 (1-417)
3 Supplementary Figure 1 Organelle targeting motifs. (a) Confocal fluorescence images of HeLa cells showing the localization of Golgi targeting motifs. Giantin retains normal Golgi morphology as well as proper localization. Scale bar indicates 20 μm. (b) Targeting motifs used in the present study to recruit proteins to mitochondria, ER, lysosome and Golgi.


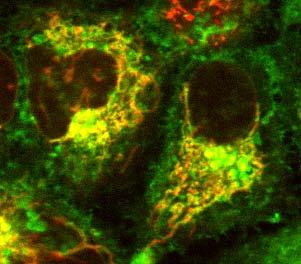
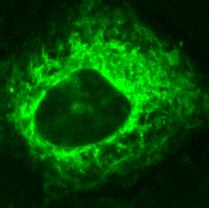
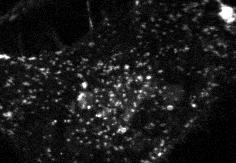
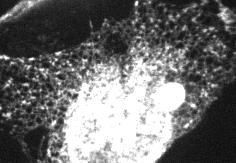
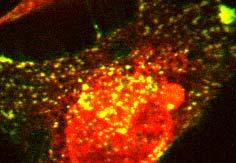
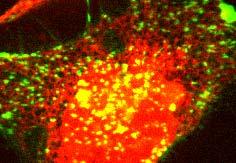
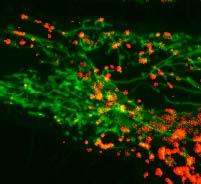
4 Supplementary Figure 2 mitochondria Tom20 CR YFP Mito Merge mitochondria CR MoA YFP Mito Merge lysosome LAMP CR Lysotracker Merge ER CR Cb5 YFP ER Merge Golgi CFP Golgi FY Giantin Merge
5 Supplementary Figure 2 Colocalization analysis of the anchor units with orthogonal organelle markers. Overlapped regions between CFP and YFP signals exhibit yellow color in the merged images presented on the right. Tom20 CFP FRB (Tom20 CR), CFP FRB MoA (CR MoA), LAMP CFP FRB (LAMP CR), CFP FRB Cb5 (CR Cb5), FKBP YFP Giantin (FY Giantin). Scale bar indicates 20 μm.
6 Supplementary Figure 3 irap 1.0 mitochondria Translocation index (Normalized) lysosome Golgi ER ER-mitochondria 0 1 min
7 Supplementary Figure 3 Kinetic analysis of organelle targeted translocation. Normalized fluorescence intensity of effector units in the cytoplasm (for mitochondria (green), lysosome (yellow) and ER (blue)) or at the specific organelle (for Golgi (red)) were plotted as the dimerization event was induced with 5 μm irap at 60 th second. CFP FKBP and FRB MoA, YFP FKBP and LAMP CFP FRB, YFP FRB and CFP FKBP Cb5, and CFP FKBP and FRB YFP Giantin were used for each assay. In the case for Golgi, the normalized fluorescence intensity was inverted to better compare with the other conditions. For ER mitochondria tethering, normalized fluorescence intensity of CFP FKBP Cb5 at the ER mitochondria junction sites were plotted (black). Error bars are SEM (n 3). Single exponential fitting provided the following time constants: 14.1 ± 3.6 s (mitochondria), 27.4 ± 2.1 s (lysosome), 92.7 ± 18.7 s (ER), 23.5 ± 4.9 s (Golgi), 52.6 ± 10.0 s (ER mitochondria tethering). The translocation kinetics is underestimated due a difficult separation of the fluorescence signal between the cytoplasm and the widespread, dynamic organelles, which is especially the case for ER targeted translocation.
8 Supplementary Figure 4 a mtor CFP FKBP Cb5 Tom20 YFP FRB DMSO irap b + + mtor FRB YFP Giantin Tom20 YFP FRB DMSO irap
9 Supplementary Figure 4 Quantification of the expression level of the dimerizer constructs. The FKBP/FRB constructs were subject to western blot analysis for a quantification of their expression level. (a) Red: anti FRB antibody, Green: anti FKBP antibody. HeLa cells were transfected with Tom20 YFP FRB and CFP FKBP Cb5 (lane1,2), Tom20 YFP FRB alone (lane3), or YFP FKBP Cb5 alone (lane4) and treat with 5 mm irap (lane 1) or DMSO (0.1% final, lane 2 4) for 15 minutes prior to western blot analysis. The expression level of Tom20 YFP FRB in relation to endogenous mtor did not change between irap and DMSO treatment (13.4 ± 5.4 fold and 13.9 ± 7.1 fold, respectively, p = 0.48, n = 6). The expression level of CFP FKBP Cb5 in relation to mtor did not change either between irap and DMSO treatment (12.5 ± 6.0 fold, and 10.3 ± 7.0 fold, respectively, p = 0.41, n = 3). (b) Green: anti FRB antibody. HeLa cells expressing Tom20 YFP FRB (lane 5) or FRB YFP Giantin (lane 6) were treated with DMSO (0.1% final, lane 2 4) for 15 minutes prior to western blot analysis.
10 Supplementary Figure 5 a b c perk Ras at PM (Lyn FRB + CFP FKBP RasGEF) Ras at Golgi (FRB YFP Giantin + CFP FKBP RasGEF) EGF + EGF CFP perk CFP perk
11 Supplementary Figure 5 Visualizing ERK phosphorylation by immunohistochemistry. The HeLa cells expressing no exogenous proteins (a), Lyn FRB and CFP FKBP RasGEF (b) or FRB YFP Giantin and CFP FKBP RasGEF (c) were stimulated with or without 100 ng/ml EGF (a) or with 5 μm irap for 15 minutes (b,c). The cells were then subject to immunohistochemistry using anti phospho ERK antibody. EGF stimulation and irapinduced Ras activation at the plasma membrane induced ERK phosphorylation preferentially in the nucleus (a,b), whereas irap induced Ras activation at the Golgi led to accumulation of phospho ERK primarily at the Golgi (c). White dotted lines contours the cell periphery based on the corresponding bright field images. Scale bar indicates 20 μm.
12 Supplementary Figure 6 Nuclear phospho ERK (a.u.) 30 0 Control 0 min 15 min EGF EGF + Rapamycin EGF + irap
13 Supplementary Figure 6 Effect of rapamycin analogs on the Ras MAPK signaling pathway. The HeLa cells were stimulated with 100 ng/ml EGF for 15 minutes in the presence or absence of rapamycin (100nM) or irap (5 μm). The cells were then subject to immunohistochemistry using anti phospho ERK antibody. EGF stimulation induced ERK phosphorylation in the nucleus (22.0 ± 1.1 arbitrary unit (a.u.), n=15), the level of which was not affected by rapamycin (21.6 ± 1.8, p = 0.88, n = 15) or irap (19.8 ± 0.9, p = 0.28, n = 15).
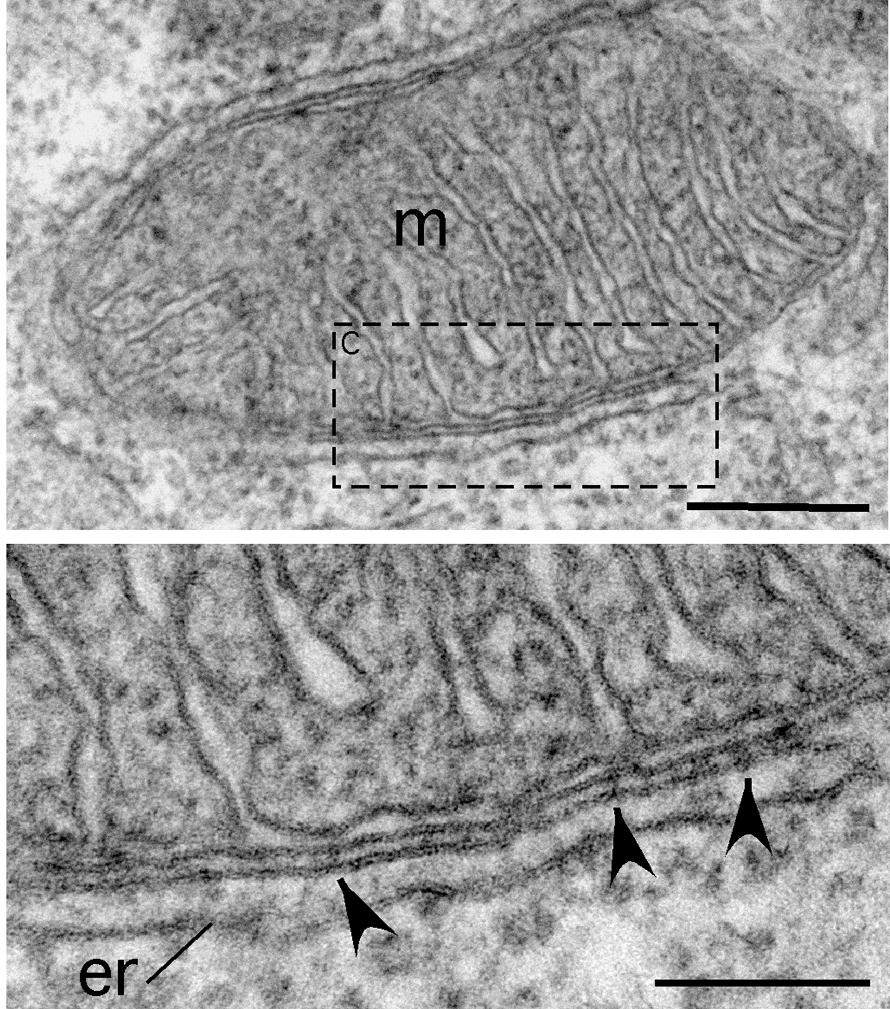
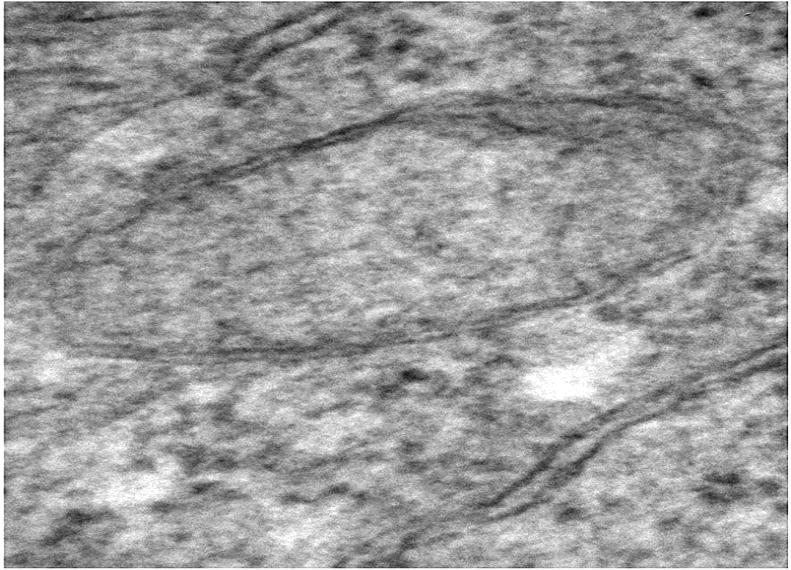
14 Supplementary Figure 7 a c er b m b er
15 Supplementary Figure 7 TEM images of membrane junction sites created by inducible ER mitochondria connection. An inset image in (a) is enlarged in (b). Black arrow heads point to the well delineated junction sites. Separations between the two organelles was calculated to be 6.6 ± 1.4 nm (minimum: 4.66 nm, maximum: 9.22 nm, n = 200). (c) In contrast, untransfected, untreated cells exhibit a good separation between the two membranes (average distance: 93.0 ± 84.2 nm, minimum: 10.1 nm, maximum: nm, n = 200). Scale bars indicate 500 nm (a) and 250 nm (b), (c).

16 Supplementary Figure 8 Tom20-YFP-FRB NBD-PS Merge +irap Tethering No tethering -irap
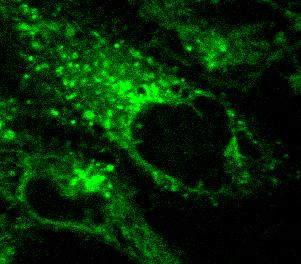
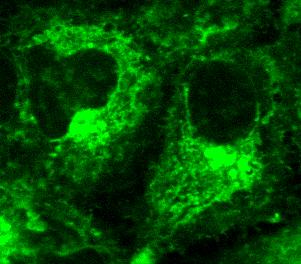
17 Supplementary Figure 8 Confocal fluorescence images of NBD labeled phosphatidylserine upon induction of synthetic ER mitochondria tethering. The HeLa cells expressing Tom20 YFP FRB and FKBP Cb5 were stained with NBD labeled PS (NBD PS). NBD PS was then visualized as ER and mitochondria became opposed to each other. The images represent before (top rows) or 15 minutes after 5 μm irap addition (middle and bottom rows). Middle rows are the cells that expressed Tom20 YFP FRB alone and thus did not induce membrane tethering event. Bottom rows are the cells that were doubly transfected and demonstrated ER mitochondria tethering. Note an accumulation of NBD PS at the junction sites in the merged image (indicated as yellow, N=3,38cells). The NBD fluorescence has a bleedthrough in the YFP channel, which, however, was a negligible extent compared to the robust YFP signal from Tom20 YFP FRB. Insets show a close up view. Scale bar indicates 20 μm.

18 Supplementary Figure 9 a CFP-Lyso YFP-ER Merge +irap -irap b CFP-ER YFP-Golgi Merge c CFP-Mito YFP-Lyso Merge +irap -irap -irap +irap
19 Supplementary Figure 9 Confocal fluorescence images of HeLa cells showing hetero organelle interactions upon irap addition. The cells were transfected with (a) YFP FKBP Cb5 (left panels), LAMP CFP FRB (middle panels), (b) CFP FKBP Cb5 (left panels) + FRB YFP Giantin (right panels) and (c) Tom20 CFP FRB (left panels), LAMP FKBP and YFP labeled lysosome marker (YFP Lyso, middle panels). Right panels show merged images (yellow) of CFP (green) and YFP (red) corresponding organelles. Among all the combinations of the anchor units we tested, only a few showed striking membrane tethering. This implies that the orientation of dimerization proteins has to be optimal to achieve efficient membrane membrane tethering. Insets show a close up view. Scale bar indicates 20 μm.
20 Supplementary Table Oligonucleotides used for the PCR Giantin Cytochrome b5 Tom20 Monoamine oxidase A LAMP RasGRF 5 ctccaactcgaggagaaccgcagcaaagcttttctgaag 3 GTAGCTGGATCCCTATAGATGGCCCGTAAAACACAGAATG 5 catatggaattcgagtgctggtggtatcaccaccgtggagtccaac 3 AGTTCAGGATCCCTAGTCCTCGGCCATGTACAG 5 catccggaattcgccaccatggtgggtcggaacagcg 3 GTAGCGGGATCCGAAGTTGGGGTCACTTCGTCTTTTG 5 catccggaattcgagtgctggtggtttctgggaaaggaacctgc cc 3 GTAGCGGGATCCTCAAGACCGTGGCAGGAGC 5 atcgttgaattcgccaccatggcggcccccgg 3 GTAGCTGGATCCGATAGTCTGGTAGCCTGCGTG 5 catgaattcttttgaaaaccactcagccctgga 3 ATTGGATCCTCAGGTGGGGAGTTTTGGTTCTAT
Supplementary Materials for
 www.sciencesignaling.org/cgi/content/full/7/334/rs4/dc1 Supplementary Materials for Rapidly rendering cells phagocytic through a cell surface display technique and concurrent Rac activation Hiroki Onuma,
Rapid parallel measurements of macroautophagy and mitophagy in
 Supplemental Figures Rapid parallel measurements of macroautophagy and mitophagy in mammalian cells using a single fluorescent biosensor Sargsyan A, Cai J, Fandino LB, Labasky ME, Forostyan T, Colosimo
Supplementary Figure S1
 Supplementary Figure S1 Supplementary Figure S1. PARP localization patterns using GFP-PARP and PARP-specific antibody libraries GFP-PARP localization in non-fixed (A) and formaldehyde fixed (B) GFP-PARPx
SUPPLEMENTARY INFORMATION
 DOI:.38/ncb3399 a b c d FSP DAPI 5mm mm 5mm 5mm e Correspond to melanoma in-situ Figure a DCT FSP- f MITF mm mm MlanaA melanoma in-situ DCT 5mm FSP- mm mm mm mm mm g melanoma in-situ MITF MlanaA mm mm
SD-1 SD-1: Cathepsin B levels in TNF treated hch
 SD-1 SD-1: Cathepsin B levels in TNF treated hch. A. RNA and B. protein extracts from TNF treated and untreated human chondrocytes (hch) were analyzed via qpcr (left) and immunoblot analyses (right) for
Supplementary material Legends to Supplementary Figures Figure S1. Figure S2. Figure S3.
 Supplementary material Legends to Supplementary Figures. Figure S1. Expression of BICD-N-MTS fusion does not affect the distribution of the Golgi and endosomes. HeLa cells were transfected with GFP-BICD-N-MTS
293T cells were transfected with indicated expression vectors and the whole-cell extracts were subjected
 SUPPLEMENTARY INFORMATION Supplementary Figure 1. Formation of a complex between Slo1 and CRL4A CRBN E3 ligase. (a) HEK 293T cells were transfected with indicated expression vectors and the whole-cell
Rapid blue-light mediated induction of protein interactions in living cells
 Nature Methods Rapid blue-light mediated induction of protein interactions in living cells Matthew J Kennedy, Robert M Hughes, Leslie A Peteya, Joel W Schwartz, Michael D Ehlers & Chandra L Tucker Supplementary
High resolution structural evidence suggests the Sarcoplasmic Reticulum forms microdomains with Acidic Stores (lyososomes) in the heart.
 in the heart.") High resolution structural evidence suggests the Sarcoplasmic Reticulum forms microdomains with Acidic Stores (lyososomes) in the heart. Daniel Aston, Rebecca A. Capel, Kerrie L. Ford, Helen C. Christian,
High resolution structural evidence suggests the Sarcoplasmic Reticulum forms microdomains with Acidic Stores (lyososomes) in the heart. Daniel Aston, Rebecca A. Capel, Kerrie L. Ford, Helen C. Christian,
Supplemental Figure 1. Western blot analysis indicated that MIF was detected in the fractions of
 Supplemental Figure Legends Supplemental Figure 1. Western blot analysis indicated that was detected in the fractions of plasma membrane and cytosol but not in nuclear fraction isolated from Pkd1 null
Supplementary Figure 1. Spatial distribution of LRP5 and β-catenin in intact cardiomyocytes. (a) and (b) Immunofluorescence staining of endogenous
 and (b) Immunofluorescence staining of endogenous") Supplementary Figure 1. Spatial distribution of LRP5 and β-catenin in intact cardiomyocytes. (a) and (b) Immunofluorescence staining of endogenous LRP5 in intact adult mouse ventricular myocytes (AMVMs)
Supplementary Figure 1. Spatial distribution of LRP5 and β-catenin in intact cardiomyocytes. (a) and (b) Immunofluorescence staining of endogenous LRP5 in intact adult mouse ventricular myocytes (AMVMs)
Nature Structural and Molecular Biology: doi: /nsmb Supplementary Figure 1
 Supplementary Figure 1 Mutational analysis of the SA2-Scc1 interaction in vitro and in human cells. (a) Autoradiograph (top) and Coomassie stained gel (bottom) of 35 S-labeled Myc-SA2 proteins (input)
Supplementary Figure 1 Expression of Crb3 in mouse sciatic nerve: biochemical analysis (a) Schematic of Crb3 isoforms, ERLI and CLPI, indicating the
 Schematic of Crb3 isoforms, ERLI and CLPI, indicating the") Supplementary Figure 1 Expression of Crb3 in mouse sciatic nerve: biochemical analysis (a) Schematic of Crb3 isoforms, ERLI and CLPI, indicating the location of the transmembrane (TM), FRM binding (FB)
Supplementary Figure 1 Expression of Crb3 in mouse sciatic nerve: biochemical analysis (a) Schematic of Crb3 isoforms, ERLI and CLPI, indicating the location of the transmembrane (TM), FRM binding (FB)
(a) Significant biological processes (upper panel) and disease biomarkers (lower panel)
 Significant biological processes (upper panel) and disease biomarkers (lower panel)") Supplementary Figure 1. Functional enrichment analyses of secretomic proteins. (a) Significant biological processes (upper panel) and disease biomarkers (lower panel) 2 involved by hrab37-mediated secretory
Supplementary Figure 1. Functional enrichment analyses of secretomic proteins. (a) Significant biological processes (upper panel) and disease biomarkers (lower panel) 2 involved by hrab37-mediated secretory
Supplementary material. Supplementary Figure legends
 Supplementary material Supplementary Figure legends Supplementary Figure 1: Senescence-associated proliferation stop in response to oncogenic N-RAS expression Proliferation of NHEM cells without (ctrl.)
Fig. S1. Subcellular localization of overexpressed LPP3wt-GFP in COS-7 and HeLa cells. Cos7 (top) and HeLa (bottom) cells expressing for 24 h human
 and HeLa (bottom) cells expressing for 24 h human") Fig. S1. Subcellular localization of overexpressed LPP3wt-GFP in COS-7 and HeLa cells. Cos7 (top) and HeLa (bottom) cells expressing for 24 h human LPP3wt-GFP, fixed and stained for GM130 (A) or Golgi97
Fig. S1. Subcellular localization of overexpressed LPP3wt-GFP in COS-7 and HeLa cells. Cos7 (top) and HeLa (bottom) cells expressing for 24 h human LPP3wt-GFP, fixed and stained for GM130 (A) or Golgi97
Supplementary Figure 1. Nature Neuroscience: doi: /nn.4547
 Supplementary Figure 1 Characterization of the Microfetti mouse model. (a) Gating strategy for 8-color flow analysis of peripheral Ly-6C + monocytes from Microfetti mice 5-7 days after TAM treatment. Living
Downregulation of the small GTPase SAR1A: a key event underlying alcohol-induced Golgi fragmentation in hepatocytes
 Downregulation of the small GTPase SAR1A: a key event underlying alcohol-induced Golgi fragmentation in hepatocytes Armen Petrosyan 1*, Pi-Wan Cheng 1,3, Dahn L. Clemens 2,3 & Carol A. Casey 2,3 1 Department
d e f Spatiotemporal quantification of subcellular ATP levels in a single HeLa cell during changes in morphology Supplementary Information
 Ca 2+ level (a. u.) Area (a. u.) Normalized distance Normalized distance Center Edge Center Edge Relative ATP level Relative ATP level Supplementary Information Spatiotemporal quantification of subcellular
crossmark Ca V subunits interact with the voltage-gated calcium channel
 crossmark THE JOURNAL OF BIOLOGICAL CHEMISTRY VOL. 291, NO. 39, pp. 20402 20416, September 23, 2016 Author s Choice 2016 by The American Society for Biochemistry and Molecular Biology, Inc. Published in
Supplementary Information
 Electronic Supplementary Material (ESI) for Analyst. This journal is The Royal Society of Chemistry 2018 Supplementary Information Spying on Protein Interactions in Living Cells with Reconstituted Scarlet
Supplementary Figure 1. The CagA-dependent wound healing or transwell migration of gastric cancer cell. AGS cells transfected with vector control or
 Supplementary Figure 1. The CagA-dependent wound healing or transwell migration of gastric cancer cell. AGS cells transfected with vector control or 3xflag-CagA expression vector were wounded using a pipette
Nature Structural & Molecular Biology: doi: /nsmb Supplementary Figure 1. Generation and validation of mtef4-knockout mice.
 Supplementary Figure 1 Generation and validation of mtef4-knockout mice. (a) Alignment of EF4 (E. coli) with mouse, yeast and human EF4. (b) Domain structures of mouse mtef4 compared to those of EF4 (E.
Supplementary information. The Light Intermediate Chain 2 Subpopulation of Dynein Regulates Mitotic. Spindle Orientation
 Supplementary information The Light Intermediate Chain 2 Subpopulation of Dynein Regulates Mitotic Spindle Orientation Running title: Dynein LICs distribute mitotic functions. Sagar Mahale a, d, *, Megha
Nature Biotechnology: doi: /nbt.3828
 Supplementary Figure 1 Development of a FRET-based MCS. (a) Linker and MA2 modification are indicated by single letter amino acid code. indicates deletion of amino acids and N or C indicate the terminus
Tumor suppressor Spred2 interaction with LC3 promotes autophagosome maturation and induces autophagy-dependent cell death
 www.impactjournals.com/oncotarget/ Oncotarget, Supplementary Materials 2016 Tumor suppressor Spred2 interaction with LC3 promotes autophagosome maturation and induces autophagy-dependent cell death Supplementary
Supplemental Materials. STK16 regulates actin dynamics to control Golgi organization and cell cycle
 Supplemental Materials STK16 regulates actin dynamics to control Golgi organization and cell cycle Juanjuan Liu 1,2,3, Xingxing Yang 1,3, Binhua Li 1, Junjun Wang 1,2, Wenchao Wang 1, Jing Liu 1, Qingsong
Trehalose, sucrose and raffinose are novel activators of autophagy in human. keratinocytes through an mtor-independent pathway
 Title page Trehalose, sucrose and raffinose are novel activators of autophagy in human keratinocytes through an mtor-independent pathway Xu Chen 1*, Min Li 1*, Li Li 1, Song Xu 1, Dan Huang 1, Mei Ju 1,
LPS LPS P6 - + Supplementary Fig. 1.
 P6 LPS - - - + + + - LPS + + - - P6 + Supplementary Fig. 1. Pharmacological inhibition of the JAK/STAT blocks LPS-induced HMGB1 nuclear translocation. RAW 267.4 cells were stimulated with LPS in the absence
Supplementary Figure 1.
 Supplementary Figure 1. Visualization of endoplasmic reticulum-mitochondria interaction by in situ proximity ligation assay. A) Illustration of targeted proteins in mitochondria (M), endoplasmic reticulum
T H E J O U R N A L O F C E L L B I O L O G Y
 T H E J O U R N A L O F C E L L B I O L O G Y Supplemental material Lu et al., http://www.jcb.org/cgi/content/full/jcb.201012063/dc1 Figure S1. Kinetics of nuclear envelope assembly, recruitment of Nup133
J. Cell Sci. 129: doi: /jcs : Supplementary information
 Movie 1. AgLDL is contained in small sub-regions of the lysosomal synapse that are acidic. J774 cells were incubated with agldl dual labeled with a ph sensitive and a ph insensitive fluorophore for 1 hr.
Supplementary Materials for
 advances.sciencemag.org/cgi/content/full/3/2/e1602038/dc1 Supplementary Materials for Mitochondrial metabolic regulation by GRP78 Manoj Prasad, Kevin J. Pawlak, William E. Burak, Elizabeth E. Perry, Brendan
SUPPLEMENTARY INFORMATION
 DOI: 1.138/ncb222 / b. WB anti- WB anti- ulin Mitotic index (%) 14 1 6 2 T (h) 32 48-1 1 2 3 4 6-1 4 16 22 28 3 33 e. 6 4 2 Time (min) 1-6- 11-1 > 1 % cells Figure S1 depletion leads to mitotic defects
Expanded View Figures
 PEX13 functions in selective autophagy Ming Y Lee et al Expanded View Figures Figure EV1. PEX13 is required for Sindbis virophagy. A, B Quantification of mcherry-capsid puncta per cell (A) and GFP-LC3
Supplementary Materials for
 www.sciencesignaling.org/cgi/content/full/6/283/ra57/dc1 Supplementary Materials for JNK3 Couples the Neuronal Stress Response to Inhibition of Secretory Trafficking Guang Yang,* Xun Zhou, Jingyan Zhu,
p = formed with HCI-001 p = Relative # of blood vessels that formed with HCI-002 Control Bevacizumab + 17AAG Bevacizumab 17AAG
 A.. Relative # of ECs associated with HCI-001 1.4 1.2 1.0 0.8 0.6 0.4 0.2 0.0 ol b p < 0.001 Relative # of blood vessels that formed with HCI-001 1.4 1.2 1.0 0.8 0.6 0.4 0.2 0.0 l b p = 0.002 Control IHC:
Project report October 2012 March 2013 CRF fellow: Principal Investigator: Project title:
 Project report October 2012 March 2013 CRF fellow: Gennaro Napolitano Principal Investigator: Sergio Daniel Catz Project title: Small molecule regulators of vesicular trafficking to enhance lysosomal exocytosis
SUPPLEMENTARY INFORMATION
 DOI: 10.1038/ncb2607 Figure S1 Elf5 loss promotes EMT in mammary epithelium while Elf5 overexpression inhibits TGFβ induced EMT. (a, c) Different confocal slices through the Z stack image. (b, d) 3D rendering
Nature Medicine: doi: /nm.4078
 Supplementary Figure 1. Cetuximab induces ER stress response in DiFi cells. (a) Scheme of SILAC proteome. (b) MS-base read out of SILAC experiment. The histogram of log 2 -transformed normalized H/L ratios
Supplementary Figure 1. Basal level EGFR across a panel of ESCC lines. Immunoblots demonstrate the expression of phosphorylated and total EGFR as
 Supplementary Figure 1. Basal level EGFR across a panel of ESCC lines. Immunoblots demonstrate the expression of phosphorylated and total EGFR as well as their downstream effectors across a panel of ESCC
SUPPLEMENTARY INFORMATION
 DOI:.38/ncb2822 a MTC02 FAO cells EEA1 b +/+ MEFs /DAPI -/- MEFs /DAPI -/- MEFs //DAPI c HEK 293 cells WCE N M C P AKT TBC1D7 Lamin A/C EEA1 VDAC d HeLa cells WCE N M C P AKT Lamin A/C EEA1 VDAC Figure
A. Generation and characterization of Ras-expressing autophagycompetent
 Supplemental Material Supplemental Figure Legends Fig. S1 A. Generation and characterization of Ras-expressing autophagycompetent and -deficient cell lines. HA-tagged H-ras V12 was stably expressed in
Influenza virus exploits tunneling nanotubes for cell-to-cell spread
 Supplementary Information Influenza virus exploits tunneling nanotubes for cell-to-cell spread Amrita Kumar 1, Jin Hyang Kim 1, Priya Ranjan 1, Maureen G. Metcalfe 2, Weiping Cao 1, Margarita Mishina 1,
SUPPLEMENTARY INFORMATION
 doi: 10.1038/nature06994 A phosphatase cascade by which rewarding stimuli control nucleosomal response A. Stipanovich*, E. Valjent*, M. Matamales*, A. Nishi, J.H. Ahn, M. Maroteaux, J. Bertran-Gonzalez,
McWilliams et al., http :// /cgi /content /full /jcb /DC1
 Supplemental material JCB McWilliams et al., http ://www.jcb.org /cgi /content /full /jcb.201603039 /DC1 THE JOURNAL OF CELL BIOLOGY Figure S1. In vitro characterization of mito-qc. (A and B) Analysis
Dynamic Partitioning of a GPI-Anchored Protein in Glycosphingolipid-Rich Microdomains Imaged by Single-Quantum Dot Tracking
 Additional data for Dynamic Partitioning of a GPI-Anchored Protein in Glycosphingolipid-Rich Microdomains Imaged by Single-Quantum Dot Tracking Fabien Pinaud 1,3, Xavier Michalet 1,3, Gopal Iyer 1, Emmanuel
Supplementary Figure 1
 Supplementary Figure 1 a γ-h2ax MDC1 RNF8 FK2 BRCA1 U2OS Cells sgrna-1 ** 60 sgrna 40 20 0 % positive Cells (>5 foci per cell) b ** 80 sgrna sgrna γ-h2ax MDC1 γ-h2ax RNF8 FK2 MDC1 BRCA1 RNF8 FK2 BRCA1
THE ROLE OF ALTERED CALCIUM AND mtor SIGNALING IN THE PATHOGENESIS OF CYSTINOSIS
 Research Foundation, 18 month progress report THE ROLE OF ALTERED CALCIUM AND mtor SIGNALING IN THE PATHOGENESIS OF CYSTINOSIS Ekaterina Ivanova, doctoral student Elena Levtchenko, MD, PhD, PI Antonella
Phosphoinositides Regulate Ciliary Protein Trafficking to Modulate Hedgehog Signaling
 Developmental Cell Supplemental Information Phosphoinositides Regulate Ciliary Protein Trafficking to Modulate Hedgehog Signaling Francesc R. Garcia-Gonzalo, Siew Cheng Phua, Elle C. Roberson, Galo Garcia
SUPPLEMENTARY INFORMATION
 Supplementary Table 1. Cell sphingolipids and S1P bound to endogenous TRAF2. Sphingolipid Cell pmol/mg TRAF2 immunoprecipitate pmol/mg Sphingomyelin 4200 ± 250 Not detected Monohexosylceramide 311 ± 18
Supplemental Data. Candat et al. Plant Cell (2014) /tpc Cytosol. Nucleus. Mitochondria. Plastid. Peroxisome. Endomembrane system
 /tpc Cytosol. Nucleus. Mitochondria. Plastid. Peroxisome. Endomembrane system") Cytosol Nucleus 32 33 34 35 36 37 38 39 40 41 42 43 44 45 46 47 48 49 50 51 1 2 3 4 5 6 7 8 9 10 11 12 13 14 15 16 17 18 19 20 21 22 23 24 25 26 27 28 29 30 31 PSORT MultiLoc YLoc SubLoc BaCelLo WoLF PSORT
Cytosol Nucleus 32 33 34 35 36 37 38 39 40 41 42 43 44 45 46 47 48 49 50 51 1 2 3 4 5 6 7 8 9 10 11 12 13 14 15 16 17 18 19 20 21 22 23 24 25 26 27 28 29 30 31 PSORT MultiLoc YLoc SubLoc BaCelLo WoLF PSORT
 Supplementary Figure Legends Supplementary Figure S1. Aurora-A is essential for SAC establishment in early mitosis. (a-c) RPE cells were treated with DMSO (a), MLN8237 (b) or BI2536 (c) for Two hours.
CD3 coated cover slips indicating stimulatory contact site, F-actin polymerization and
 SUPPLEMENTAL FIGURES FIGURE S1. Detection of MCs. A, Schematic representation of T cells stimulated on anti- CD3 coated cover slips indicating stimulatory contact site, F-actin polymerization and microclusters.
human epithelial cells were pretreated with control sirna (50 nm) or GSK-3β sirna (50 nm)
 or GSK-3β sirna (50 nm)") GSK3β facilitates IFNγ signaling Supplementary Figure Legends Figure S1. The effects of inhibiting GSK3β on IFNγinduced TNFα expression. A, A549 human epithelial cells were pretreated with control sirna
GSK3β facilitates IFNγ signaling Supplementary Figure Legends Figure S1. The effects of inhibiting GSK3β on IFNγinduced TNFα expression. A, A549 human epithelial cells were pretreated with control sirna
Supplementary Figures
 Supplementary Figures Supplementary Figure 1 Characterization of stable expression of GlucB and sshbira in the CT26 cell line (a) Live cell imaging of stable CT26 cells expressing green fluorescent protein
Supplementary Figure 1.TRIM33 binds β-catenin in the nucleus. a & b, Co-IP of endogenous TRIM33 with β-catenin in HT-29 cells (a) and HEK 293T cells
 and HEK 293T cells") Supplementary Figure 1.TRIM33 binds β-catenin in the nucleus. a & b, Co-IP of endogenous TRIM33 with β-catenin in HT-29 cells (a) and HEK 293T cells (b). TRIM33 was immunoprecipitated, and the amount of
Supplementary Figure 1.TRIM33 binds β-catenin in the nucleus. a & b, Co-IP of endogenous TRIM33 with β-catenin in HT-29 cells (a) and HEK 293T cells (b). TRIM33 was immunoprecipitated, and the amount of
Supplementary Table 1. The primers used for quantitative RT-PCR. Gene name Forward (5 > 3 ) Reverse (5 > 3 )
 Reverse (5 > 3 )") 770 771 Supplementary Table 1. The primers used for quantitative RT-PCR. Gene name Forward (5 > 3 ) Reverse (5 > 3 ) Human CXCL1 GCGCCCAAACCGAAGTCATA ATGGGGGATGCAGGATTGAG PF4 CCCCACTGCCCAACTGATAG TTCTTGTACAGCGGGGCTTG
770 771 Supplementary Table 1. The primers used for quantitative RT-PCR. Gene name Forward (5 > 3 ) Reverse (5 > 3 ) Human CXCL1 GCGCCCAAACCGAAGTCATA ATGGGGGATGCAGGATTGAG PF4 CCCCACTGCCCAACTGATAG TTCTTGTACAGCGGGGCTTG
NLRX1: 5 -GCTCCATGGCTTAGAGCATC-3 (forward) 5 -AACTCCTCCTCCGTCCTGAT-3 (reverse) β-actin
 5 -AACTCCTCCTCCGTCCTGAT-3 (reverse) β-actin") NLRX1 β-actin 1 2 3 4 5 6 1 2 3 4 5 6 NLRX1 (667 bp) β-actin (523 bp) Supplementary Figure 1: Expression of NLRX1 in human cell lines. 1: HeLa, 2: HEK293T, 3: MCF-7, 4:Ramos, 5:Jurkat, 6: THP1. The following
NLRX1 β-actin 1 2 3 4 5 6 1 2 3 4 5 6 NLRX1 (667 bp) β-actin (523 bp) Supplementary Figure 1: Expression of NLRX1 in human cell lines. 1: HeLa, 2: HEK293T, 3: MCF-7, 4:Ramos, 5:Jurkat, 6: THP1. The following
Supplementary Fig. 1 V-ATPase depletion induces unique and robust phenotype in Drosophila fat body cells.
 Supplementary Fig. 1 V-ATPase depletion induces unique and robust phenotype in Drosophila fat body cells. a. Schematic of the V-ATPase proton pump macro-complex structure. The V1 complex is composed of
Cells and reagents. Synaptopodin knockdown (1) and dynamin knockdown (2)
 and dynamin knockdown (2)") Supplemental Methods Cells and reagents. Synaptopodin knockdown (1) and dynamin knockdown (2) podocytes were cultured as described previously. Staurosporine, angiotensin II and actinomycin D were all obtained
Supplemental Methods Cells and reagents. Synaptopodin knockdown (1) and dynamin knockdown (2) podocytes were cultured as described previously. Staurosporine, angiotensin II and actinomycin D were all obtained
Compartmentalized AMPK Signaling Illuminated by Genetically Encoded Molecular Sensors and Actuators
 Resource Compartmentalized AMPK Signaling Illuminated by Genetically Encoded Molecular Sensors and Actuators Graphical Abstract Authors Takafumi Miyamoto, Elmer Rho,..., Jin Zhang, Takanari Inoue Correspondence
Supplemental Information
 Supplemental Information Tobacco-specific Carcinogen Induces DNA Methyltransferases 1 Accumulation through AKT/GSK3β/βTrCP/hnRNP-U in Mice and Lung Cancer patients Ruo-Kai Lin, 1 Yi-Shuan Hsieh, 2 Pinpin
Supplementary Information
 Supplementary Information Figure S1. Int6 gene silencing efficiency. (A) Western Blot analysis of Int6 expression at different times after sirna transfection. Int6 expression is strongly silenced in Int6
1. Microfluidic device characteristics and cell compartmentalization
 Supplementary figures: 1. Microfluidic device characteristics and cell compartmentalization Microfluidic channels were molded in PDMS (Fig. S1 A and B) over silicon masters, which were structured with
Cell membrane penetration and mitochondrial targeting by platinumdecorated
 Electronic Supplementary Material (ESI) for Nanoscale. This journal is The Royal Society of Chemistry 2016 Cell membrane penetration and mitochondrial targeting by platinumdecorated ceria nanoparticles
Loss of RhoA promotes skin tumor formation. Supplementary Figure 1. Loss of RhoA does not impair F-actin organization.
 Supplementary Figure Legends Supplementary Figure 1. Loss of RhoA does not impair F-actin organization. a. Representative IF images of F-actin staining of big and small control (left) and RhoA ko tumors
Supplementary Figure 1
 Supplementary Figure 1 6 HE-50 HE-116 E-1 HE-108 Supplementary Figure 1. Targeted drug response curves of endometrial cancer cells. Endometrial cancer cell lines were incubated with serial dilutions of
T H E J O U R N A L O F C E L L B I O L O G Y
 Supplemental material Chen et al., http://www.jcb.org/cgi/content/full/jcb.201210119/dc1 T H E J O U R N A L O F C E L L B I O L O G Y Figure S1. Lack of fast reversibility of UVR8 dissociation. (A) HEK293T
Supplementary Figure 1. BMS enhances human T cell activation in vitro in a
 Supplementary Figure 1. BMS98662 enhances human T cell activation in vitro in a concentration-dependent manner. Jurkat T cells were activated with anti-cd3 and anti-cd28 antibody in the presence of titrated
Supplementary Figure S1. Venn diagram analysis of mrna microarray data and mirna target analysis. (a) Western blot analysis of T lymphoblasts (CLS)
 Western blot analysis of T lymphoblasts (CLS)") Supplementary Figure S1. Venn diagram analysis of mrna microarray data and mirna target analysis. (a) Western blot analysis of T lymphoblasts (CLS) and their exosomes (EXO) in resting (REST) and activated
Supplementary Figure S1. Venn diagram analysis of mrna microarray data and mirna target analysis. (a) Western blot analysis of T lymphoblasts (CLS) and their exosomes (EXO) in resting (REST) and activated
SUPPLEMENTARY FIGURES
 SUPPLEMENTARY FIGURES Supplementary Figure 1. (A) Left, western blot analysis of ISGylated proteins in Jurkat T cells treated with 1000U ml -1 IFN for 16h (IFN) or left untreated (CONT); right, western
Supplementary Figure 1. Procedures for p38 activity imaging in living cells. (a) Schematic model of the p38 activity reporter. The reporter consists
 Schematic model of the p38 activity reporter. The reporter consists") Supplementary Figure 1. Procedures for p38 activity imaging in living cells. (a) Schematic model of the p38 activity reporter. The reporter consists of: (i) the YPet domain (an enhanced YFP); (ii) the
Supplementary Figure 1. Procedures for p38 activity imaging in living cells. (a) Schematic model of the p38 activity reporter. The reporter consists of: (i) the YPet domain (an enhanced YFP); (ii) the
Wenqin Hu, Cuiping Tian, Tun Li, Mingpo Yang, Han Hou & Yousheng Shu
 Distinct contributions of Na v 1.6 and Na v 1.2 in action potential initiation and backpropagation Wenqin Hu, Cuiping Tian, Tun Li, Mingpo Yang, Han Hou & Yousheng Shu Supplementary figure and legend Supplementary
Supplementary Figure S1 (a) (b)
 (b)") Supplementary Figure S1: IC87114 does not affect basal Ca 2+ level nor nicotineinduced Ca 2+ influx. (a) Bovine chromaffin cells were loaded with Fluo-4AM (1 μm) in buffer A containing 0.02% of pluronic
Supplementary Figure S1: IC87114 does not affect basal Ca 2+ level nor nicotineinduced Ca 2+ influx. (a) Bovine chromaffin cells were loaded with Fluo-4AM (1 μm) in buffer A containing 0.02% of pluronic
Supplemental Materials Molecular Biology of the Cell
 Supplemental Materials Molecular Biology of the Cell Garcia-Alvarez et al. Supplementary Figure Legends Figure S1.Expression and RNAi-mediated silencing of STIM1 in hippocampal neurons (DIV, days in vitro).
SUPPLEMENTARY INFORMATION
 DOI: 1.138/ncb3355 a S1A8 + cells/ total.1.8.6.4.2 b S1A8/?-Actin c % T-cell proliferation 3 25 2 15 1 5 T cells Supplementary Figure 1 Inter-tumoral heterogeneity of MDSC accumulation in mammary tumor
Supplementary Materials for
 www.sciencesignaling.org/cgi/content/full/7/322/ra38/dc1 Supplementary Materials for Dynamic Reprogramming of Signaling Upon Met Inhibition Reveals a Mechanism of Drug Resistance in Gastric Cancer Andrea
Folliculin directs the formation of a Rab34 RILP complex to control the nutrient-dependent dynamic distribution of lysosomes
 Published online: April 3, 26 Article Folliculin directs the formation of a RILP complex to control the nutrient-dependent dynamic distribution of lysosomes Georgina P Starling,, Yan Y Yip,, Anneri Sanger,
SUPPLEMENTARY INFORMATION
 DOI: 10.1038/ncb2988 Supplementary Figure 1 Kif7 L130P encodes a stable protein that does not localize to cilia tips. (a) Immunoblot with KIF7 antibody in cell lysates of wild-type, Kif7 L130P and Kif7
Acute lung injury in children : from viral infection and mechanical ventilation to inflammation and apoptosis Bern, R.A.
 UvA-DARE (Digital Academic Repository) Acute lung injury in children : from viral infection and mechanical ventilation to inflammation and apoptosis Bern, R.A. Link to publication Citation for published
Supplementary Information. Cofilin Regulates Nuclear Architecture through a Myosin-II Dependent Mechanotransduction Module
 Supplementary Information Cofilin Regulates Nuclear Architecture through a Myosin-II Dependent Mechanotransduction Module O Neil Wiggan, Bryce Schroder, Diego Krapf, James R. Bamurg and Jennifer G. DeLuca
Prolonged mitotic arrest induces a caspase-dependent DNA damage
 SUPPLEMENTARY INFORMATION Prolonged mitotic arrest induces a caspase-dependent DNA damage response at telomeres that determines cell survival Karolina O. Hain, Didier J. Colin, Shubhra Rastogi, Lindsey
Nature Methods: doi: /nmeth.4257
 Supplementary Figure 1 Screen for polypeptides that affect cellular actin filaments. (a) Table summarizing results from all polypeptides tested. Source shows organism, gene, and amino acid numbers used.
Activation of Nrf2 by the dengue virus causes an increase in CLEC5A, which enhances TNF-α production by mononuclear phagocytes
 Nrf2 mediates induced CLEC5A and TNFα Activation of Nrf2 by the dengue virus causes an increase in CLEC5A, which enhances TNFα production by mononuclear phagocytes YiLin Cheng 1,2, YeeShin Lin 1,2,3, ChiaLing
Supplementary Figure 1 Validation of Per2 deletion in neuronal cells in N Per2 -/- mice. (a) Western blot from liver extracts of mice held under ad
 Western blot from liver extracts of mice held under ad") Supplementary Figure 1 Validation of Per2 deletion in neuronal cells in N Per2 -/- mice. (a) Western blot from liver extracts of mice held under ad libitum conditions detecting PER2 protein in brain and
Supplementary Figure 1 Validation of Per2 deletion in neuronal cells in N Per2 -/- mice. (a) Western blot from liver extracts of mice held under ad libitum conditions detecting PER2 protein in brain and
Title: Smooth muscle cell-specific Tgfbr1 deficiency promotes aortic aneurysm formation by stimulating multiple signaling events
 Title: Smooth muscle cell-specific Tgfbr1 deficiency promotes aortic aneurysm formation by stimulating multiple signaling events Pu Yang 1, 3, radley M. Schmit 1, Chunhua Fu 1, Kenneth DeSart 1, S. Paul
SUPPLEMENTARY FIGURE LEGENDS
 SUPPLEMENTARY FIGURE LEGENDS Supplemental FIG. 1. Localization of myosin Vb in cultured neurons varies with maturation stage. A and B, localization of myosin Vb in cultured hippocampal neurons. A, in DIV
Appendix Table of Contents. 1. Appendix Figure legends S1-S13 and Appendix Table S1 and S2. 2. Appendix Figures S1-S13
 Appendix Table of Contents. Appendix Figure legends S-S3 and Appendix Table S and S. Appendix Figures S-S3 . Appendix Figure legends S-S3 and Appendix Table S and S Appendix Figure S. Western blot analysis
6. TNF-α regulates oxidative stress, mitochondrial function and autophagy in neuronal cells
 6. TNF-α regulates oxidative stress, mitochondrial function and autophagy in neuronal cells 6.1 TNF-α induces mitochondrial oxidative stress in SH-SY5Y cells. The dysregulation of mitochondria and oxidative
SUPPLEMENTARY FIGURES AND TABLE
 SUPPLEMENTARY FIGURES AND TABLE Supplementary Figure S1: Characterization of IRE1α mutants. A. U87-LUC cells were transduced with the lentiviral vector containing the GFP sequence (U87-LUC Tet-ON GFP).
F-actin VWF Vinculin. F-actin. Vinculin VWF
 a F-actin VWF Vinculin b F-actin VWF Vinculin Supplementary Fig. 1. WPBs in HUVECs are located along stress fibers and at focal adhesions. (a) Immunofluorescence images of f-actin (cyan), VWF (yellow),
Nature Immunology: doi: /ni eee Supplementary Figure 1
 eee Supplementary Figure 1 Hyphae induce NET release, but yeast do not. (a) NET release by human peripheral neutrophils stimulated with a hgc1 yeast-locked C. albicans mutant (yeast) or pre-formed WT C.
Supplementary Figure 1: Characterisation of phospho-fgfr-y463 antibody. (A)
") Supplementary Figure 1: Characterisation of phospho-fgfr-y463 antibody. (A) Cells over-expressing hfgfr1-pcdna3 (+) or pcdna3 (-) were stimulated for 10 minutes with 50ng/ml FGF2 and lysates immunoblotted
Supplementary Figure 1: Characterisation of phospho-fgfr-y463 antibody. (A) Cells over-expressing hfgfr1-pcdna3 (+) or pcdna3 (-) were stimulated for 10 minutes with 50ng/ml FGF2 and lysates immunoblotted
SUPPLEMENTARY INFORMATION
 Supplementary Figure 1. Behavioural effects of ketamine in non-stressed and stressed mice. Naive C57BL/6 adult male mice (n=10/group) were given a single dose of saline vehicle or ketamine (3.0 mg/kg,
SUPPLEMENTARY LEGENDS...
 TABLE OF CONTENTS SUPPLEMENTARY LEGENDS... 2 11 MOVIE S1... 2 FIGURE S1 LEGEND... 3 FIGURE S2 LEGEND... 4 FIGURE S3 LEGEND... 5 FIGURE S4 LEGEND... 6 FIGURE S5 LEGEND... 7 FIGURE S6 LEGEND... 8 FIGURE
Supplemental Data. Wang et al. (2013). Plant Cell /tpc
. Plant Cell /tpc") Supplemental Data. Wang et al. (2013). Plant Cell 10.1105/tpc.112.108993 Supplemental Figure 1. 3-MA Treatment Reduces the Growth of Seedlings. Two-week-old Nicotiana benthamiana seedlings germinated on
Supplemental Data. Wang et al. (2013). Plant Cell 10.1105/tpc.112.108993 Supplemental Figure 1. 3-MA Treatment Reduces the Growth of Seedlings. Two-week-old Nicotiana benthamiana seedlings germinated on
Intracellular MHC class II molecules promote TLR-triggered innate. immune responses by maintaining Btk activation
 Intracellular MHC class II molecules promote TLR-triggered innate immune responses by maintaining Btk activation Xingguang Liu, Zhenzhen Zhan, Dong Li, Li Xu, Feng Ma, Peng Zhang, Hangping Yao and Xuetao
Supplementary Information
 Nature Immunology doi:1.138/ni.2477 Supplementary Information Capillary and arteriolar pericytes attract innate leukocytes exiting through venules and instruct them with pattern recognition and motility
Supplementary Materials
 Supplementary Materials Figure S1. MTT Cell viability assay. To measure the cytotoxic potential of the oxidative treatment, the MTT [3-(4,5-dimethylthiazol- 2-yl)-2,5-diphenyl tetrazolium bromide] assay