Supplementary Information Methods Subjects The study was comprised of 84 chronic pain patients with either chronic back pain (CBP) or osteoarthritis
|
|
|
- Tamsyn Stephens
- 5 years ago
- Views:
Transcription
1 Supplementary Information Methods Subjects The study was comprised of 84 chronic pain patients with either chronic back pain (CBP) or osteoarthritis (OA). All subjects provided informed consent to procedures approved by the Northwestern University institutional review board. All participants were right-handed and were diagnosed by a clinician for back pain or osteoarthritis, had pain intensity greater than 40/100 on the visual analog scale (VAS), and had pain duration greater than 6 months. Subjects were excluded if they reported presence of other chronic painful conditions, systemic disease, psychiatric illness, or moderate and severe depression based on a Beck s Depression Inventory (BDI) score > 19. Further clinical and demographic data are provided in table 1 in the main text. Demographic data are reported as mean ± standard deviation. We divided our patient pool in half (random but matched subgroups) to form a discovery group (N = 42; 20 CPB and 22 OA; 22 men and 20 women; age: ± 8.5 years; BDI: 5.42 ± 5.06; VAS: 6.69 ± 1.78) in which voxel-wise connectivity was associated to their pain and depression scores, and an independent replication group (N = 42; 20 CBP and 22 OA; 20 men and 22 women; age: 47.9 ± 9.5 years; BDI: 6.0 ± 5.6; VAS: 6.69 ± 1.7) in which these relationships were tested for reproduction. Our control group of healthy pain-free subjects was age and sex-matched (N = 88; 38 men and 50 women; age: 44.2 ± 12.6; BDI: 1.1 ± 0.3). Data acquisition Functional MRI (fmri) and T1-weighted anatomical (T1) MRI images were acquired for each subject during a single brain imaging session. T1-MRI images were acquired with a 3T Siemens Trio whole-body scanner with echo-planar imaging (EPI) capability using the standard radio-frequency head coil with the following parameter: voxel size = 1 x 1 x 1 mm, TR = 2500ms, TE = 3.36 ms, flip angle = 90, in-plane matrix size = 256 x 256, slices = 160 and field of view = 256 mm. The fmri images were acquired on the same scanner with the following parameters: multi-slice T2*-weighted echo-planar images with TR = 2.5 s, TE = 30 ms, flip angle = 90, slice thickness = 3 mm, in-plane resolution = 64 x 64. The 36 slices covered the whole brain from the cerebellum to the vertex. Twenty-two participants had fmri scans with 244 total volumes and the remainder of participants had scans with 305 total volumes. Scans with different total volumes were divided evenly between discovery and replication groups. All participants had no task, but were asked to remain still and keep eyes open for the duration of the scan. Preprocessing Preprocessing of each subject s fmri data was performed using FSL (FMRIB's Software Library, and included brain extraction (skull removal), slice timing correction, spatial smoothing using a Gaussian kernel (fwhm = 5 mm), non-linear high-pass temporal filtering (100 s), intensity normalization, and global signal correction. Motion
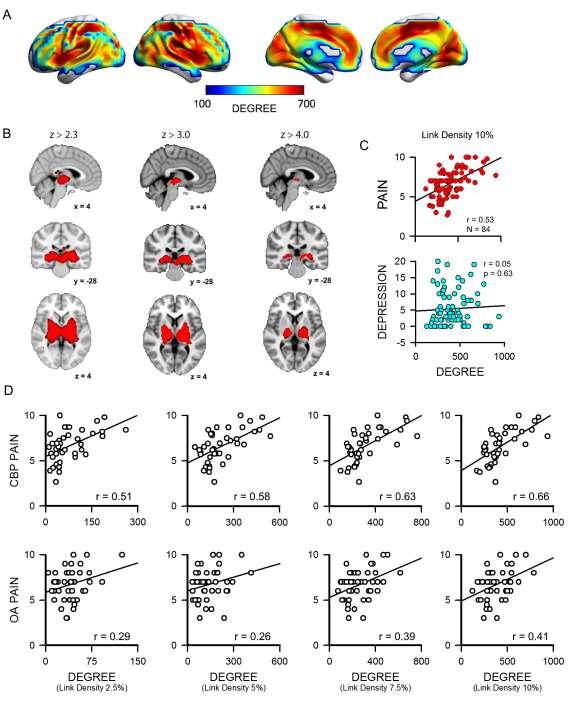
2 correction was implemented using MCFLIRT [2] to identify six rotation and translation parameters and realign volumes using linear registration. These six parameters were additionally regressed out of the BOLD signal, along with mean activity of voxels within cerebrospinal fluid and voxels in major white matter tracts. The first four volumes were removed to allow for signal stabilization. Functional images were spatially normalized to a standard 2mm brain template using a two-step registration. First, each fmri volume was registered using a 7 degree of freedom affine transformation to the subject-specific anatomical T1 image. Transformation parameters were also computed by registering all T1 brains to the standard 2mm template using 12 degrees of freedom. Combining the two transformations by matrix multiplication yielded transformation parameters normalizing fmri data to standard space. Transformations performed using these parameters were implemented using linear interpolation. Registered images were finally downsampled to 6mm isotropic standard space. Motion scrubbing Similar to the scrubbing procedure performed by [3], motion-related signal in fmri volumes were removed from patient preprocessed and registered images. Two measures were used to indicate time points with high motion, and were extracted across all gray matter voxels in the brain at every time point: 1) root mean square of the differentiated BOLD time series, and 2) spatial standard deviation. These values were then standardized across time by subtracting the mean and dividing by standard deviation. Any volume with either of these values being greater than 2.3 were removed, along with the immediately adjacent volumes. All scrubbed images retained an average of 88.9 ± 0.02% of their original volumes. Degree covariation with pain and depression The aim of the study was to determine the relationship between whole-brain functional connectivity and chronic pain, depression, and their interaction. To assess functional connectivity, we calculated the degree count of each voxel, which indicates overall how many voxels in the brain share a similar BOLD time course to its own. This measurement has been widely used to study the functional brain characteristics of disease [1], and the algorithms are thoroughly described in the Brain Connectivity Toolbox [4]. Quickly, functional images were registered into a standard 6mm isotropic space, and the analysis was performed voxel-wise only on voxels that were present in all images (5392 voxels, total). For the BOLD time course at each voxel, the Pearson correlation was calculated to those at all other voxels. A functional link between any 2 voxels was determined on whether the correlation between their BOLD time series exceeded a set threshold, and the degree at each voxel was equal to its total links. Correlation thresholds were set according to link density, which ensured each subject had the same number of total links in the entire brain. For example, a 10% link density threshold means that any 2 voxels were considered linked if their correlation was one of the strongest 10% of all possible correlations. Thus a voxel with relatively many links had a relatively high degree. Because degree is dependent on link density, to ensure the robustness of our results degree maps were generated using link densities of 2.5%, 5.0%, 7.5%, and 10%. All these yielded similar results, so most of what is reported is at 10% link density, unless otherwise indicated. To determine how a voxel s degree covaried with depression and pain in the patient, the discovery group (N = 42) degree maps were entered into a group-level general linear model using FSL s Flameo in which BDI, VAS, BDI-VAS interaction (BDI*VAS), age, sex, and pain
3 type (CBP or OA) were modeled as independent explanatory variables. The resulting z-stat maps then indicating covariation of degree with BDI and VAS were thresholded at z>2.3 with cluster-correcting for multiple comparisons at p<0.05 using FSL s Easythresh. This analysis was performed separately for the discovery and replication groups, additionally by combining both groups. Replication Using a linear fit on the data from the discovery group, by which VAS or BDI from every patient was plotted as a function of the mean degree across voxels in a significant cluster, we predicted pain and depression scores in an independent, replication group of 42 chronic pain patients. We used the following formula to predict for each patient: Y = m*d + i where Y is either the predicted VAS or BDI score and d is the mean degree across voxels, defined by the discovery group s significant cluster. The values m and i are the slope and y-intercept of the linear fit to the discovery group s data, respectively. The strength of the model was calculated based on the Pearson correlation between the predicted and actual BDI and VAS scores in the replication group. Seed-based connectivity We wanted to determine how connectivity from brain areas showing a strong covariation between degree and pain VAS differed from a healthy, pain-free population. To do this, pain covariance maps from the combined group z-stat maps were thresholded at z>4.5 yielding two clusters in the left and right thalamus. BOLD time series were averaged for these voxels for all patients, as well as a group of 88 healthy controls (age: ± 12.5 years; 38 men and 50 women), and the time series was entered into a general linear model using FSL s fsl_glm function to generate a z-stat map for each participant, which indicated functional connectivity from the thalamus to the rest of the brain. Functional connectivity of patients and healthy controls were compared by entering z-stat maps into an unpaired 2-sample t-test using FSL s Flameo, regressing out age and sex, to determine where in the brain thalamus connectivity differed between participants with and without chronic pain. The statistical contrast z-stat map was thresholded at z>2.3 and cluster-corrected (p<0.05) for multiple corrections using FSL Easythresh. Logarithmic transform of depression scores Because our patients had overall low depression, BDI scores were not normally distributed so we performed our analyses with both normal and log-transformed BDI values. To account for patients with a score of 0, for which the log transform is negative infinity, all scores were given 1 additional point. Our depression results were overall no different between analyses and thus only the non-transformed BDI data were used. Results Statistical z-value peak coordinates for the maps referred to below can be found in supplementary table 1.
4 Correlation between pain and depression BDI scores were not normally distributed, however performing a logarithmic transform on BDI scores did not change any of our overall results and are thus not reported. Additionally, the correlation between VAS and log BDI scores remained insignificant (r = 0.08, p = 0.63, supplementary figure 1). Pain / degree relationships are robust to link density As the calculation of degree at any voxel is dependent on the correlation threshold of what constitutes a link, we wanted to test the robustness of our findings as a function of link density (i.e. a 10% link density indicates a correlation between any 2 voxels that exceeds the strongest 10% of all possible correlations). We entered new degree maps into the same GLM analysis using link densities ranging from 2.5% to 10% and found overall that the strong correlation between pain intensity and thalamic degree was highly consistent (supplementary figure 2A). Likewise, prediction of pain in our replication data set remained highly significant ( 2.5%, r=0.56, p<0.001; 5%, r=0.62, p<0.001; and 7.5%, r=0.59, p<0.001) (supplementary figure 2B), and after thresholding maps such that only the top 5% z-stat voxels remained, correlation of degree and pain was always highest in the thalamus (supplementary figure 2C), regardless of link density. Replication data set was highly similar to the discovery set An equally large independent replication data set (matched for patient type, age, sex, pain intensity, pain duration, and depression) yielded similar results relating connectivity and pain, but not depression. The distribution of pain intensity (6.69 ± 1.69) and depression scores (5.33 ± 5.55) across all patients in the replication group, and the lack of correlation between the two (r = -0.04, p = 0.82) are highly similar to the discovery group (supplementary figure 3A). The group-average degree map is also similar to the discovery group, yielding relatively higher degree in sensory, default mode, and frontoparietal regions, and lower degree in subcortical and limbic areas (supplementary figure 3B). Voxel-wise correlation between the discovery and replication group mean degree maps was strong and highly significant (r = 0.92, p<<0.001) (supplementary figure 3C). Switching discovery and replication data sets We had similar findings after switching discovery and replication groups. Covariance maps (z-stat>2.3, cluster-corrected for multiple comparisons p<0.05) relating pain and degree in the original replication group were similar to the original discovery group, with the most significant clusters centering around the thalamus, and some additional clusters in the cerebellum, basal ganglia, and dorsal medial prefrontal cortex. Thresholding this map further to the highest 30% and 10% z-stat voxels resulted in clusters mainly within the thalamus, as well as the dorsal medial prefrontal cortex (supplementary figure 4A). These clusters were robust predictors of pain (top 30% r=0.52, p<0.001; top 10% r=0.49, p<0.001) (supplementary figure 4B). Degree correlation to depression could not be replicated Depression scores covaried positively with degree in the medial prefrontal cortex (mpfc) and medial orbitofrontal cortex (mofc) (z-stat>2.3, cluster-corrected for multiple comparisons p<0.05, supplementary figure 5A), and negatively with degree in the bilateral temporal-parietal
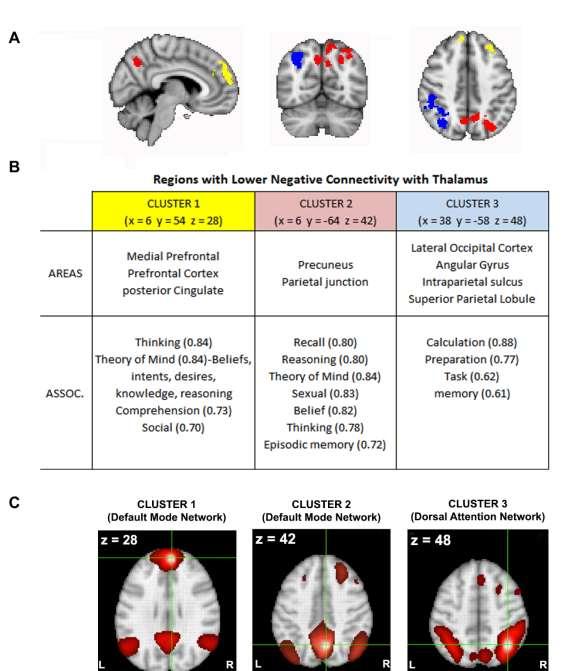
5 junction (z-stat>2.3, cluster-corrected for multiple comparisons p<0.05, supplementary figure 5B). We used a model based on the linear fit between depression and the average degree in significant clusters in the discovery group to predict depression in the replication group. Predicted and observed depression scores were not significantly correlated (supplementary figure 5C). Combined group analysis Further, combining discovery and replication group data yields similar results to the discovery and replication sets. The distribution of pain and depression scores across all patients in the discovery and replication group combined show an average pain of 6.69 ± 1.73 and average depression of 5.38 ± Combining all patients yielded no significant correlation between pain intensity and depression (r = 0.063, p = 0.569). Likewise, the mean degree map of all patients (supplementary figure 6A), and the covariation between degree and pain (zstat > 2.3, cluster-corrected for multiple comparisons p<0.05) resulted in similar maps to the discovery and replication sets alone (supplementary figure 6B). This relationship is also reflected in the correlation between pain and average degree within the covariance map, which remained highly significant (r=0.53, p<0.001). The correlation between BDI and the degree for the same voxels was not significant (r=0.05, p=0.63) (supplementary figure 6C). No clusters of voxels exhibited a significant correlation between degree and depression scores after the same correction for multiple comparisons. Because our positive findings related to depression were not reproducible, we focused the analysis in the main text on pain. When we separated our patients by pain type (CBP or OA), the correlation between pain and degree remained highly significant at different link densities; however, the relationship was overall stronger in the CBP group (supplementary figure 6D). Because our results consistently indicated that degree of the thalamus correlated highly to pain ratings, regardless of patient type, our remaining analyses were performed on both CBP and OA, combined. To ensure our results were not influenced by motion artifact, we performed motion-scrubbing on patient functional images and removed volumes to be likely affected by motion. An average of 88.9 ± 0.02% volumes were retained after scrubbing (supplementary figure 7A). At 10% link density, the average degree within the thalamic ROI shown in supplementary figure 6B was highly correlated between original and scrubbed data (r = 0.95, p<<0.001) (supplementary figure 7B). Thus, the average degree of the scrubbed data, within this ROI, remained highly correlated with pain (r = 0.49, p<<0.001) (supplementary figure 7C). Neurosynth Functional connectivity to the thalamus (see figure 3A in the main text) was compared between our patients and 88 age and sex-matched controls using a voxel-wise 2-sample t-test (z>2.3, cluster corrected for multiple comparisons at p<0.05). The map was clustered by adjacent voxels (supplementary figure 8A), resulting in 3 clusters, and the center coordinate of each cluster was entered into Neurosynth [5], a meta-analysis tool referencing over 10,000 published studies, to determine the behavioral function of each cluster. Posterior probabilities were thresholded at 0.6 (supplementary 8B). Functional connectivity maps related to each cluster coordinate, determined by Neurosynth (z>2.3), overlap the dorsal attention and default mode networks (supplementary figure 8C).
6
7 Figures and tables Supplementary figure 1
8 Supplementary figure 2
9 Supplementary figure 3
10 Supplementary figure 4 Supplementary figure 5
11 Supplementary figure 6
12 Supplementary figure 7
13 Supplementary figure 8
14 Supplementary table 1 Peak voxel coordinate peak z-values cluster size avg. z-value x y z (mm 3 ) Supp. Fig. 2A link density 2.5% link density 5.0% link density 7.5% link density 10.0% Supp. Fig. 4A all voxels top 30% top 10% Supp. Fig. 5A top bottom Supp. Fig. 6B z> z> z> Supplementary table 2
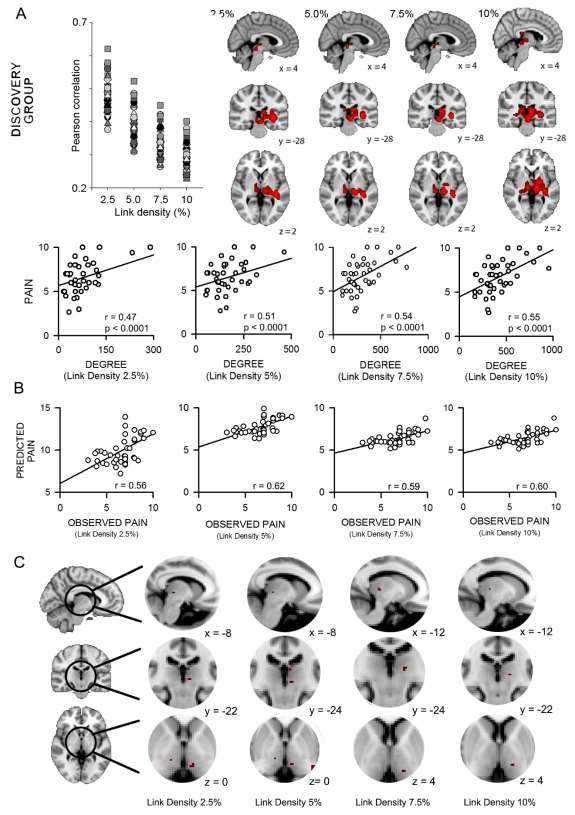
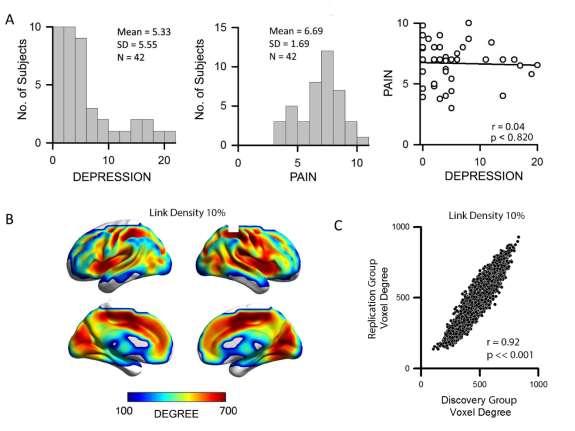
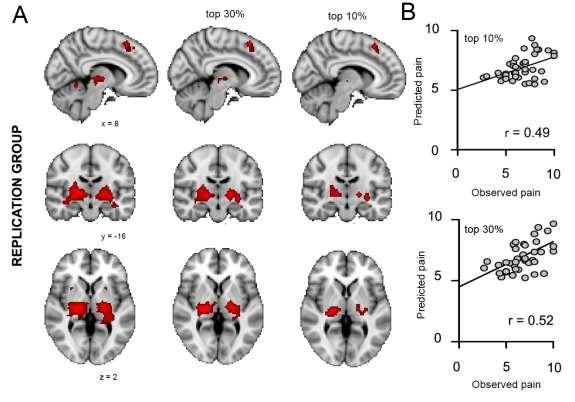
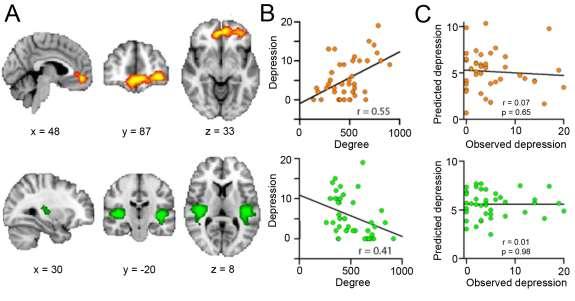
15 Figure and table legends Supplementary figure 1. Pain and depression scores are not correlated after log transformation. Depression BDI scores shown in figure 1 were log-transformed, and correlated again with VAS scores. To account for patients with a score of zero, all scores were given 1 additional point. The correlation remained insignificant. Supplementary figure 2. Functional connectivity degree in the thalamus predicts subjective pain. A) Functional connectivity degree was determined at multiple thresholds ranging from 2.5% to 10% density (i.e. 10% density means only the strongest 10% of voxel-tovoxel BOLD time course correlations constituted links). Correlation thresholds used for creating degree maps at each density is shown in the left upper panel. Data points represent single patients in the discovery group. Significant correlations between pain and degree consistently mapped to the thalamus at all link densities. Maps are thresholded at z>2.3, cluster-corrected for multiple comparisons at p<0.05. Post-hoc correlations between pain and average degree for the corresponding map are shown in scatter plots. B) Pain scores in the replication group were predicted at multiple thresholds based on the linear relationship between pain and degree in the discovery group (scatter plots in A). Correlations between predicted and observed pain in the replication group were significant, indicating connectivity degree in the thalamus is a robust predictor of subjective pain rating. C) Higher thresholding of the z-stat correlation maps shown in A demonstrate that the highest correlations between connectivity degree and VAS are located in the thalamus. For all panels, the right-most column is shown in figure 2 in the main text. Supplementary figure 3. The replication data set is highly similar to the discovery data set. A) Distribution of VAS and BDI scores across all patients in the replication group (CBP N = 40, OA N = 42) (left), and their correlation (right). B) Group-average spatial distribution of functional connectivity degree for the replication group. Blue represents relatively fewer connections, red indicates more. C) The scatter plot illustrates that the degree value at each voxel in the replication group map is highly similar to that in the discovery group. Supplementary figure 4. Exchanging discovery and replication group data yields similar results. The analyses were performed once again, this time switching the roles of the discovery and replication groups. A) Covariance maps (z-stat>2.3, cluster-corrected for multiple comparisons p<0.05) relating pain and degree in the replication group were similar to the discovery group, with the most significant clusters centering around the thalamus, with some additional clusters in the cerebellum, basal ganglia, and dorsal medial prefrontal cortex. Thresholding this map further to the highest 30% and 90% z-stat voxels resulted in clusters mainly within the thalamus. B) VAS scores in the discovery group were highly correlated to their predicted scores (top 30% r=0.52, p<0.001; top 90% r=0.49, p<0.001), based on the maps shown in A. Supplementary figure 5. The discovery data set revealed significant relationships between connectivity and depression, but results could not be replicated. A) For the discovery group, functional connectivity correlated positively with depression in the medial prefrontal orbitofrontal cortex (top panel), and negatively with depression in the posterior insula and superior temporal gyrus (bottom panel). Colored regions in the maps indicate areas of significant correlations, thresholded at z > 2.3, cluster-corrected for multiple comparisons at p < B) Scatter plots show depression as a function of the mean connectivity degree for the colored regions in discovery group (each data point represents a single participant). C) Scatter plots demonstrate the predicted depression scores in the replication group, based on their
16 average connectivity degree from these same maps. Depression rating predictions were not significant, indicating connectivity degree in these regions were not robust predictors for depression. Supplementary figure 6. Combining discovery and replication group data yields similar results to the discovery and replication sets. A) Group-average spatial distribution of connectivity degree for the replication group. Blue represents relatively fewer connections, red indicates more. B) For all patients, connectivity degree significantly correlated to pain. Red voxels indicate areas where the correlation was significant at z values ranging from 2.3 to 4.0, cluster-corrected for multiple comparisons at p < C) Each data point in the scatter plot indicates the pain rating for a single subject as a function of the mean connectivity degree in the map from panel B with z = 2.3 (top panel). Same as the plot above, except depression scores are plotted on the y-axis. This is shown to demonstrate that in areas where degree is highly correlated to pain, there is no relationship to depression (bottom panel). D) Same as the scatter plot shown in the top panel of C, except VAS scores are shown separately for CBP (top) and OA (bottom) patients. Additionally, scatter plots were generated using degree maps thresholded at link densities ranging from 2.5% to 10%. Both patient groups exhibit significant correlations to pain and degree, although correlations are slightly higher within the CBP group. Supplementary figure 7. Results were robust to motion scrubbing A) Percent of volumes remaining in functional data after scrubbing, for all patients. B) Average degree at 10% link density, within the ROI defined in supplementary figure 6B, for original and scrubbed data, are highly similar. C) Correlation between pain and average degree for scrubbed data, within the ROI defined in supplementary figure 6B, remained highly significant. Supplementary figure 8. Disrupted thalamic functional connectivity in pain patients maps to regions associated with default mode and dorsal attention networks A) Same maps as shown in figure 3B, separated into 3 different clusters. B) We highlight some functions associated with each cluster, based on Neurosynth meta-analysis. Coordinates indicate the voxel with the peak z-stat value in figure 4B, for each cluster. Each association has a posterior probability > 0.6. C) Functional connectivity for each cluster coordinate, determined by Neurosynth, maps to the default mode network for 2 clusters, and the dorsal attention network for 1 cluster. Supplementary table 1. Peak voxel coordinates and corresponding z-stat values for maps shown in each figure. References [1] Bassett DS, Bullmore ET. Human brain networks in health and disease. Curr Opin Neurol 2009;22(4): [2] Jenkinson M, Bannister P, Brady M, Smith S. Improved optimization for the robust and accurate linear registration and motion correction of brain images. Neuroimage 2002;17(2): [3] Power JD, Mitra A, Laumann TO, Snyder AZ, Schlaggar BL, Petersen SE. Methods to detect, characterize, and remove motion artifact in resting state fmri. Neuroimage 2014;84: [4] Rubinov M, Sporns O. Complex network measures of brain connectivity: uses and interpretations. Neuroimage 2010;52(3): [5] Yarkoni T, Poldrack RA, Nichols TE, Van Essen DC, Wager TD. Large-scale automated synthesis of human functional neuroimaging data. Nat Methods 2011;8(8):
17
SUPPLEMENT: DYNAMIC FUNCTIONAL CONNECTIVITY IN DEPRESSION. Supplemental Information. Dynamic Resting-State Functional Connectivity in Major Depression
 Supplemental Information Dynamic Resting-State Functional Connectivity in Major Depression Roselinde H. Kaiser, Ph.D., Susan Whitfield-Gabrieli, Ph.D., Daniel G. Dillon, Ph.D., Franziska Goer, B.S., Miranda
Supplementary Online Content
 Supplementary Online Content Green SA, Hernandez L, Tottenham N, Krasileva K, Bookheimer SY, Dapretto M. The neurobiology of sensory overresponsivity in youth with autism spectrum disorders. Published
Supporting online material. Materials and Methods. We scanned participants in two groups of 12 each. Group 1 was composed largely of
 Placebo effects in fmri Supporting online material 1 Supporting online material Materials and Methods Study 1 Procedure and behavioral data We scanned participants in two groups of 12 each. Group 1 was
Classification and Statistical Analysis of Auditory FMRI Data Using Linear Discriminative Analysis and Quadratic Discriminative Analysis
 International Journal of Innovative Research in Computer Science & Technology (IJIRCST) ISSN: 2347-5552, Volume-2, Issue-6, November-2014 Classification and Statistical Analysis of Auditory FMRI Data Using
Supporting Online Material for
 www.sciencemag.org/cgi/content/full/324/5927/646/dc1 Supporting Online Material for Self-Control in Decision-Making Involves Modulation of the vmpfc Valuation System Todd A. Hare,* Colin F. Camerer, Antonio
FMRI Data Analysis. Introduction. Pre-Processing
 FMRI Data Analysis Introduction The experiment used an event-related design to investigate auditory and visual processing of various types of emotional stimuli. During the presentation of each stimuli
Procedia - Social and Behavioral Sciences 159 ( 2014 ) WCPCG 2014
 WCPCG 2014") Available online at www.sciencedirect.com ScienceDirect Procedia - Social and Behavioral Sciences 159 ( 2014 ) 743 748 WCPCG 2014 Differences in Visuospatial Cognition Performance and Regional Brain Activation
Available online at www.sciencedirect.com ScienceDirect Procedia - Social and Behavioral Sciences 159 ( 2014 ) 743 748 WCPCG 2014 Differences in Visuospatial Cognition Performance and Regional Brain Activation
Supplementary Online Content
 Supplementary Online Content Gregg NM, Kim AE, Gurol ME, et al. Incidental cerebral microbleeds and cerebral blood flow in elderly individuals. JAMA Neurol. Published online July 13, 2015. doi:10.1001/jamaneurol.2015.1359.
Hallucinations and conscious access to visual inputs in Parkinson s disease
 Supplemental informations Hallucinations and conscious access to visual inputs in Parkinson s disease Stéphanie Lefebvre, PhD^1,2, Guillaume Baille, MD^4, Renaud Jardri MD, PhD 1,2 Lucie Plomhause, PhD
Role of the ventral striatum in developing anorexia nervosa
 Role of the ventral striatum in developing anorexia nervosa Anne-Katharina Fladung 1 PhD, Ulrike M. E.Schulze 2 MD, Friederike Schöll 1, Kathrin Bauer 1, Georg Grön 1 PhD 1 University of Ulm, Department
Group-Wise FMRI Activation Detection on Corresponding Cortical Landmarks
 Group-Wise FMRI Activation Detection on Corresponding Cortical Landmarks Jinglei Lv 1,2, Dajiang Zhu 2, Xintao Hu 1, Xin Zhang 1,2, Tuo Zhang 1,2, Junwei Han 1, Lei Guo 1,2, and Tianming Liu 2 1 School
Investigations in Resting State Connectivity. Overview
 Investigations in Resting State Connectivity Scott FMRI Laboratory Overview Introduction Functional connectivity explorations Dynamic change (motor fatigue) Neurological change (Asperger s Disorder, depression)
Twelve right-handed subjects between the ages of 22 and 30 were recruited from the
 Supplementary Methods Materials & Methods Subjects Twelve right-handed subjects between the ages of 22 and 30 were recruited from the Dartmouth community. All subjects were native speakers of English,
Supplementary Information
 Supplementary Information The neural correlates of subjective value during intertemporal choice Joseph W. Kable and Paul W. Glimcher a 10 0 b 10 0 10 1 10 1 Discount rate k 10 2 Discount rate k 10 2 10
Supporting Information
 Revisiting default mode network function in major depression: evidence for disrupted subsystem connectivity Fabio Sambataro 1,*, Nadine Wolf 2, Maria Pennuto 3, Nenad Vasic 4, Robert Christian Wolf 5,*
Supplementary information Detailed Materials and Methods
 Supplementary information Detailed Materials and Methods Subjects The experiment included twelve subjects: ten sighted subjects and two blind. Five of the ten sighted subjects were expert users of a visual-to-auditory
Reporting Checklist for Nature Neuroscience
 Corresponding Author: Manuscript Number: Manuscript Type: Alex Pouget NN-A46249B Article Reporting Checklist for Nature Neuroscience # Main Figures: 7 # Supplementary Figures: 3 # Supplementary Tables:
WHAT DOES THE BRAIN TELL US ABOUT TRUST AND DISTRUST? EVIDENCE FROM A FUNCTIONAL NEUROIMAGING STUDY 1
 SPECIAL ISSUE WHAT DOES THE BRAIN TE US ABOUT AND DIS? EVIDENCE FROM A FUNCTIONAL NEUROIMAGING STUDY 1 By: Angelika Dimoka Fox School of Business Temple University 1801 Liacouras Walk Philadelphia, PA
Functional MRI Mapping Cognition
 Outline Functional MRI Mapping Cognition Michael A. Yassa, B.A. Division of Psychiatric Neuro-imaging Psychiatry and Behavioral Sciences Johns Hopkins School of Medicine Why fmri? fmri - How it works Research
BRAIN STATE CHANGE DETECTION VIA FIBER-CENTERED FUNCTIONAL CONNECTIVITY ANALYSIS
 BRAIN STATE CHANGE DETECTION VIA FIBER-CENTERED FUNCTIONAL CONNECTIVITY ANALYSIS Chulwoo Lim 1, Xiang Li 1, Kaiming Li 1, 2, Lei Guo 2, Tianming Liu 1 1 Department of Computer Science and Bioimaging Research
Paul-Chen Hsieh, Ming-Tsung Tseng, Chi-Chao Chao, Yea-Huey Lin Wen-Yih I. Tseng, Kuan-Hong Liu, Ming-Chang Chiang, Sung-Tsang Hsieh
 IMAGING SIGNATURES OF ALTERED BRAIN RESPONSES IN SMALL-FIBER NEUROPATHY: REDUCED FUNCTIONAL CONNECTIVITY OF THE LIMBIC SYSTEM AFTER PERIPHERAL NERVE DEGENERATION Paul-Chen Hsieh, Ming-Tsung Tseng, Chi-Chao
QUANTIFYING CEREBRAL CONTRIBUTIONS TO PAIN 1
 QUANTIFYING CEREBRAL CONTRIBUTIONS TO PAIN 1 Supplementary Figure 1. Overview of the SIIPS1 development. The development of the SIIPS1 consisted of individual- and group-level analysis steps. 1) Individual-person
Table 1. Summary of PET and fmri Methods. What is imaged PET fmri BOLD (T2*) Regional brain activation. Blood flow ( 15 O) Arterial spin tagging (AST)
 Regional brain activation. Blood flow ( 15 O) Arterial spin tagging (AST)") Table 1 Summary of PET and fmri Methods What is imaged PET fmri Brain structure Regional brain activation Anatomical connectivity Receptor binding and regional chemical distribution Blood flow ( 15 O)
Table 1 Summary of PET and fmri Methods What is imaged PET fmri Brain structure Regional brain activation Anatomical connectivity Receptor binding and regional chemical distribution Blood flow ( 15 O)
Altered effective connectivity network of the thalamus in post traumatic stress disorder: a resting state FMRI study with granger causality method
 DOI 10.1186/s40535-016-0025-y RESEARCH Open Access Altered effective connectivity network of the thalamus in post traumatic stress disorder: a resting state FMRI study with granger causality method Youxue
Supplementary materials. Appendix A;
 Supplementary materials Appendix A; To determine ADHD diagnoses, a combination of Conners' ADHD questionnaires and a semi-structured diagnostic interview was used(1-4). Each participant was assessed with
Reporting Checklist for Nature Neuroscience
 Corresponding Author: Manuscript Number: Manuscript Type: Roger Thompson NNA52598C Article Reporting Checklist for Nature Neuroscience # Main Figures: 7 # Supplementary Figures: 9 # Supplementary Tables:
Functional MRI study of gender effects in brain activations during verbal working
 Functional MRI study of gender effects in brain activations during verbal working memory task Zbyněk Tüdös 1, Pavel Hok 2, Petr Hluštík 2, Aleš Grambal 3 1 Department of Radiology, Faculty of Medicine
Reporting Checklist for Nature Neuroscience
 Corresponding Author: Manuscript Number: Manuscript Type: Leonard Petrucelli RS51511B Resource Reporting Checklist for Nature Neuroscience # Main s: 6 1 table # s: 13 # Tables: 11 # Videos: 0 This checklist
A possible mechanism for impaired joint attention in autism
 A possible mechanism for impaired joint attention in autism Justin H G Williams Morven McWhirr Gordon D Waiter Cambridge Sept 10 th 2010 Joint attention in autism Declarative and receptive aspects initiating
Supplementary Figure 1. Histograms of original and phase-randomised data
 Log Supplementary Figure 1. Histograms of original and phase-randomised data BOLD signals histogram Denoised signals histogram Activity-inducing signals histogram Innovation signals histogram 20 15 10
Supplemental Information. Triangulating the Neural, Psychological, and Economic Bases of Guilt Aversion
 Neuron, Volume 70 Supplemental Information Triangulating the Neural, Psychological, and Economic Bases of Guilt Aversion Luke J. Chang, Alec Smith, Martin Dufwenberg, and Alan G. Sanfey Supplemental Information
Reporting Checklist for Nature Neuroscience
 Corresponding Author: Manuscript Number: Manuscript Type: Tali Sharot NNA549D Article Reporting Checklist for Nature Neuroscience # Main ures: 4 # lementary ures: 5 # lementary Tables: 4 # lementary Videos:
Supplementary Online Content
 Supplementary Online Content Redlich R, Opel N, Grotegerd D, et al. Prediction of individual response to electroconvulsive therapy via machine learning on structural magnetic resonance imaging data. JAMA
Supporting Information
 Supporting Information Newman et al. 10.1073/pnas.1510527112 SI Results Behavioral Performance. Behavioral data and analyses are reported in the main article. Plots of the accuracy and reaction time data
Supplemental Data. Inclusion/exclusion criteria for major depressive disorder group and healthy control group
 1 Supplemental Data Inclusion/exclusion criteria for major depressive disorder group and healthy control group Additional inclusion criteria for the major depressive disorder group were: age of onset of
Resistance to forgetting associated with hippocampus-mediated. reactivation during new learning
 Resistance to Forgetting 1 Resistance to forgetting associated with hippocampus-mediated reactivation during new learning Brice A. Kuhl, Arpeet T. Shah, Sarah DuBrow, & Anthony D. Wagner Resistance to
Reporting Checklist for Nature Neuroscience
 Corresponding Author: Manuscript Number: NNA49200 Manuscript Type: Matthew Walker & Bryce Mander Article Reporting Checklist for Nature Neuroscience # Main Figures: 4 # Supplementary Figures: 3 # Supplementary
Reporting Checklist for Nature Neuroscience
 Corresponding Author: Manuscript Number: Manuscript Type: Subhojit Roy NNA51787 Article Reporting Checklist for Nature Neuroscience # Main Figures: Eight # lementary Figures: Seven # lementary Tables:
Changes in Default Mode Network as Automaticity Develops in a Categorization Task
 Purdue University Purdue e-pubs Open Access Theses Theses and Dissertations January 2015 Changes in Default Mode Network as Automaticity Develops in a Categorization Task Farzin Shamloo Purdue University
Reporting Checklist for Nature Neuroscience
 Corresponding Author: Manuscript Number: Manuscript Type: N. P. Franks NNA49691 Article Reporting Checklist for Nature Neuroscience # Main Figures: 7 # Supplementary Figures: 9 # Supplementary Tables:
Category: Life sciences Name: Seul Lee SUNetID: seul
 Independent Component Analysis (ICA) of functional MRI (fmri) data Category: Life sciences Name: Seul Lee SUNetID: seul 05809185 Introduction Functional Magnetic Resonance Imaging (fmri) is an MRI method
Face-specific resting functional connectivity between the fusiform gyrus and posterior superior temporal sulcus
 HUMAN NEUROSCIENCE Original Research Article published: 24 September 2010 doi: 10.3389/fnhum.2010.00176 Face-specific resting functional connectivity between the fusiform gyrus and posterior superior temporal
Final Report 2017 Authors: Affiliations: Title of Project: Background:
 Final Report 2017 Authors: Dr Gershon Spitz, Ms Abbie Taing, Professor Jennie Ponsford, Dr Matthew Mundy, Affiliations: Epworth Research Foundation and Monash University Title of Project: The return of
Personal Space Regulation by the Human Amygdala. California Institute of Technology
 Personal Space Regulation by the Human Amygdala Daniel P. Kennedy 1, Jan Gläscher 1, J. Michael Tyszka 2 & Ralph Adolphs 1,2 1 Division of Humanities and Social Sciences 2 Division of Biology California
Reporting Checklist for Nature Neuroscience
 Corresponding Author: Manuscript Number: Manuscript Type: Yves De Koninck NNBC47734A Brief Communication Reporting Checklist for Nature Neuroscience # Main Figures: 3 # Supplementary Figures: 1 # Supplementary
The Neural Correlates of Moral Decision-Making in Psychopathy
 University of Pennsylvania ScholarlyCommons Neuroethics Publications Center for Neuroscience & Society 1-1-2009 The Neural Correlates of Moral Decision-Making in Psychopathy Andrea L. Glenn University
Functional MRI Study of Gender Effects in Brain Activations During Verbal Working Memory Task
 Physiol. Res. 67: 825-829, 2018 SHORT COMMUNICATION Functional MRI Study of Gender Effects in Brain Activations During Verbal Working Memory Task Z. TÜDÖS 1, P. HOK 2, P. HLUŠTÍK 2, A. GRAMBAL 3 1 Department
Funding: NIDCF UL1 DE019583, NIA RL1 AG032119, NINDS RL1 NS062412, NIDA TL1 DA
 The Effect of Cognitive Functioning, Age, and Molecular Variables on Brain Structure Among Carriers of the Fragile X Premutation: Deformation Based Morphometry Study Naomi J. Goodrich-Hunsaker*, Ling M.
Supplementary Information Appendix: Default Mode Contributions to Automated Information Processing
 Supplementary Information Appendix: Default Mode Contributions to Automated Information Processing Authors: Deniz Vatansever a,b,c,1, David K. Menon a,d, Emmanuel A. Stamatakis a,b,d Affiliations: a Division
Reporting Checklist for Nature Neuroscience
 Corresponding Author: Manuscript Number: Manuscript Type: Simon Musall NNA47695 Article Reporting Checklist for Nature Neuroscience # Main Figures: 6 # Supplementary Figures: 14 # Supplementary Tables:
SUPPLEMENTARY INFORMATION. Predicting visual stimuli based on activity in auditory cortices
 SUPPLEMENTARY INFORMATION Predicting visual stimuli based on activity in auditory cortices Kaspar Meyer, Jonas T. Kaplan, Ryan Essex, Cecelia Webber, Hanna Damasio & Antonio Damasio Brain and Creativity
SUPPLEMENTARY METHODS. Subjects and Confederates. We investigated a total of 32 healthy adult volunteers, 16
 SUPPLEMENTARY METHODS Subjects and Confederates. We investigated a total of 32 healthy adult volunteers, 16 women and 16 men. One female had to be excluded from brain data analyses because of strong movement
Nature Neuroscience: doi: /nn Supplementary Figure 1. Task timeline for Solo and Info trials.
 Supplementary Figure 1 Task timeline for Solo and Info trials. Each trial started with a New Round screen. Participants made a series of choices between two gambles, one of which was objectively riskier
Supporting Information. Demonstration of effort-discounting in dlpfc
 Supporting Information Demonstration of effort-discounting in dlpfc In the fmri study on effort discounting by Botvinick, Huffstettler, and McGuire [1], described in detail in the original publication,
Brain gray matter volume changes associated with motor symptoms in patients with Parkinson s disease
 Kang et al. Chinese Neurosurgical Journal (2015) 1:9 DOI 10.1186/s41016-015-0003-6 RESEARCH Open Access Brain gray matter volume changes associated with motor symptoms in patients with Parkinson s disease
Differential contributions of subregions of medial temporal lobe to memory system in. amnestic mild cognitive impairment: insights from fmri study
 Differential contributions of subregions of medial temporal lobe to memory system in amnestic mild cognitive impairment: insights from fmri study Jiu Chen 1, *, Xujun Duan 2, *, Hao Shu 1, Zan Wang 1,
Supporting Online Material for
 www.sciencemag.org/cgi/content/full/315/5811/515/dc1 Supporting Online Material for The Neural Basis of Loss Aversion in Decision-Making Under Risk Sabrina M. Tom, Craig R. Fox, Christopher Trepel, Russell
Reporting Checklist for Nature Neuroscience
 Corresponding Author: Manuscript Number: Manuscript Type: Bernhard Staresina A51406B Article Reporting Checklist for Nature Neuroscience # Main Figures: 5 # Supplementary Figures: 10 # Supplementary Tables:
Supplementary Online Content
 1 Supplementary Online Content Miller CH, Hamilton JP, Sacchet MD, Gotlib IH. Meta-analysis of functional neuroimaging of major depressive disorder in youth. JAMA Psychiatry. Published online September
Supplementary Materials for
 Supplementary Materials for Folk Explanations of Behavior: A Specialized Use of a Domain-General Mechanism Robert P. Spunt & Ralph Adolphs California Institute of Technology Correspondence may be addressed
Reporting Checklist for Nature Neuroscience
 Corresponding Author: Manuscript Number: Manuscript Type: Rutishauser NNA57105 Article Reporting Checklist for Nature Neuroscience # Main Figures: 8 # Supplementary Figures: 6 # Supplementary Tables: 1
Estimation of Statistical Power in a Multicentre MRI study.
 Estimation of Statistical Power in a Multicentre MRI study. PhD Student,Centre for Neurosciences Ninewells Hospital and Medical School University of Dundee. IPEM Conference Experiences and Optimisation
Combining tdcs and fmri. OHMB Teaching Course, Hamburg June 8, Andrea Antal
 Andrea Antal Department of Clinical Neurophysiology Georg-August University Goettingen Combining tdcs and fmri OHMB Teaching Course, Hamburg June 8, 2014 Classical Biomarkers for measuring human neuroplasticity
Journal of Clinical Neuroscience
 Journal of Clinical Neuroscience 20 (2013) 413 418 Contents lists available at SciVerse ScienceDirect Journal of Clinical Neuroscience journal homepage: www.elsevier.com/locate/jocn Clinical Study Functional
SUPPLEMENTARY MATERIAL. Table. Neuroimaging studies on the premonitory urge and sensory function in patients with Tourette syndrome.
 SUPPLEMENTARY MATERIAL Table. Neuroimaging studies on the premonitory urge and sensory function in patients with Tourette syndrome. Authors Year Patients Male gender (%) Mean age (range) Adults/ Children
Functional Elements and Networks in fmri
 Functional Elements and Networks in fmri Jarkko Ylipaavalniemi 1, Eerika Savia 1,2, Ricardo Vigário 1 and Samuel Kaski 1,2 1- Helsinki University of Technology - Adaptive Informatics Research Centre 2-
Supplementary Data. Structural and functional magnetic resonance imaging (fmri) minimal preprocessing for Human Connectome Project
 minimal preprocessing for Human Connectome Project") Supplementary Data Human Connectome Project Minimal Preprocessing Procedures Structural and functional magnetic resonance imaging (fmri) minimal preprocessing for Human Connectome Project (HCP) resting-state
Supplementary Data Human Connectome Project Minimal Preprocessing Procedures Structural and functional magnetic resonance imaging (fmri) minimal preprocessing for Human Connectome Project (HCP) resting-state
Reporting Checklist for Nature Neuroscience
 Corresponding Author: Manuscript Number: Manuscript Type: Daniel O'Connor NNA53650A Article Reporting Checklist for Nature Neuroscience # Main Figures: 7 # Supplementary Figures: 10 # Supplementary Tables:
Behavioural Brain Research
 Behavioural Brain Research 197 (2009) 186 197 Contents lists available at ScienceDirect Behavioural Brain Research j o u r n a l h o m e p a g e : www.elsevier.com/locate/bbr Research report Top-down attentional
Supporting Online Material for
 www.sciencemag.org/cgi/content/full/317/5835/215/dc1 Supporting Online Material for Prefrontal Regions Orchestrate Suppression of Emotional Memories via a Two- Phase Process Brendan E. Depue,* Tim Curran,
Nature Neuroscience doi: /nn Supplementary Figure 1. Characterization of viral injections.
 Supplementary Figure 1 Characterization of viral injections. (a) Dorsal view of a mouse brain (dashed white outline) after receiving a large, unilateral thalamic injection (~100 nl); demonstrating that
Activated Fibers: Fiber-centered Activation Detection in Task-based FMRI
 Activated Fibers: Fiber-centered Activation Detection in Task-based FMRI Jinglei Lv 1, Lei Guo 1, Kaiming Li 1,2, Xintao Hu 1, Dajiang Zhu 2, Junwei Han 1, Tianming Liu 2 1 School of Automation, Northwestern
Reorganization of hippocampal functional connectivity with transition to chronic back pain
 Reorganization of hippocampal functional connectivity with transition to chronic back pain Amelia A. Mutso, Bogdan Petre, Lejian Huang, Marwan N. Baliki, Souraya Torbey, Kristina M. Herrmann, Thomas J.
Supplementary Material. Functional connectivity in multiple cortical networks is associated with performance. across cognitive domains in older adults
 Supplementary Material Functional connectivity in multiple cortical networks is associated with performance across cognitive domains in older adults Emily E. Shaw 1,2, Aaron P. Schultz 1,2,3, Reisa A.
Supplementary materials for: Executive control processes underlying multi- item working memory
 Supplementary materials for: Executive control processes underlying multi- item working memory Antonio H. Lara & Jonathan D. Wallis Supplementary Figure 1 Supplementary Figure 1. Behavioral measures of
Visualization strategies for major white matter tracts identified by diffusion tensor imaging for intraoperative use
 International Congress Series 1281 (2005) 793 797 www.ics-elsevier.com Visualization strategies for major white matter tracts identified by diffusion tensor imaging for intraoperative use Ch. Nimsky a,b,
The Neural Signature of Social Norm Compliance Manfred Spitzer, Urs Fischbacher, Bärbel Herrnberger, Georg Grön, Ernst Fehr
 Neuron, volume 56 Supplemental Data The Neural Signature of Social Norm Compliance Manfred Spitzer, Urs Fischbacher, Bärbel Herrnberger, Georg Grön, Ernst Fehr Supplemental Data In order to examine the
Voxel-based morphometry in clinical neurosciences
 Voxel-based morphometry in clinical neurosciences Ph.D. Thesis Ádám Feldmann Department of Behavioural Sciences Leader of Doctoral School: Prof. Dr.Sámuel Komoly, D.Sc. Program leader: Prof. Dr.Sámuel
Reproducibility is necessary but insufficient for addressing brain science issues.
 1 Reproducibility is necessary but insufficient for addressing brain science issues. GLM promises nothing but the higher amplitude of the experimental trials on the average compared with the control trials.
Topographical functional connectivity patterns exist in the congenitally, prelingually deaf
 Supplementary Material Topographical functional connectivity patterns exist in the congenitally, prelingually deaf Ella Striem-Amit 1*, Jorge Almeida 2,3, Mario Belledonne 1, Quanjing Chen 4, Yuxing Fang
Investigations in Resting State Connectivity. Overview. Functional connectivity. Scott Peltier. FMRI Laboratory University of Michigan
 Investigations in Resting State Connectivity Scott FMRI Laboratory Overview Introduction Functional connectivity explorations Dynamic change (motor fatigue) Neurological change (Asperger s Disorder, depression)
GENDER-SPECIFIC SENSITVITY TO TIME-DISCREPANT TASK CONDITIONS OF REASONING DURING fmri
 GENDER-SPECIFIC SENSITVITY TO TIME-DISCREPANT TASK CONDITIONS OF REASONING DURING fmri by Joshua M. Roberts A Thesis Submitted to the Graduate Faculty of George Mason University in Partial Fulfillment
What do you think of the following research? I m interested in whether a low glycemic index diet gives better control of diabetes than a high
 What do you think of the following research? I m interested in whether a low glycemic index diet gives better control of diabetes than a high glycemic index diet. So I randomly assign 100 people with type
smokers) aged 37.3 ± 7.4 yrs (mean ± sd) and a group of twelve, age matched, healthy
 aged 37.3 ± 7.4 yrs (mean ± sd) and a group of twelve, age matched, healthy") Methods Participants We examined a group of twelve male pathological gamblers (ten strictly right handed, all smokers) aged 37.3 ± 7.4 yrs (mean ± sd) and a group of twelve, age matched, healthy males,
Methods Participants We examined a group of twelve male pathological gamblers (ten strictly right handed, all smokers) aged 37.3 ± 7.4 yrs (mean ± sd) and a group of twelve, age matched, healthy males,
Differences in brain structure and function between the sexes has been a topic of
 Introduction Differences in brain structure and function between the sexes has been a topic of scientific inquiry for over 100 years. In particular, this topic has had significant interest in the past
Supplementary Information. Gauge size. midline. arcuate 10 < n < 15 5 < n < 10 1 < n < < n < 15 5 < n < 10 1 < n < 5. principal principal
 Supplementary Information set set = Reward = Reward Gauge size Gauge size 3 Numer of correct trials 3 Numer of correct trials Supplementary Fig.. Principle of the Gauge increase. The gauge size (y axis)
Functional Magnetic Resonance Imaging with Arterial Spin Labeling: Techniques and Potential Clinical and Research Applications
 pissn 2384-1095 eissn 2384-1109 imri 2017;21:91-96 https://doi.org/10.13104/imri.2017.21.2.91 Functional Magnetic Resonance Imaging with Arterial Spin Labeling: Techniques and Potential Clinical and Research
Reporting Checklist for Nature Neuroscience
 Corresponding Author: Manuscript Number: Manuscript Type: Scott A. Small NNA49290 Article Reporting Checklist for Nature Neuroscience # Main Figures: 5 # Supplementary Figures: 3 # Supplementary Tables:
Supplementary Methods and Results
 Supplementary Methods and Results Subjects and drug conditions The study was approved by the National Hospital for Neurology and Neurosurgery and Institute of Neurology Joint Ethics Committee. Subjects
Title: Resting hyperperfusion of the hippocampus, midbrain and striatum
 Data supplement for Allen et al., Resting Hyperperfusion of the Hippocampus, Midbrain, and Basal Ganglia in People at High Risk for Psychosis. Am J Psychiatry (doi: 10.1176/appi.ajp.2015.15040485) Supplementary
Distinct neural bases of disruptive behavior and autism symptom severity in boys with autism spectrum disorder.
 Himmelfarb Health Sciences Library, The George Washington University Health Sciences Research Commons Pediatrics Faculty Publications Pediatrics 1-1-2017 Distinct neural bases of disruptive behavior and
Supporting Information
 Supporting Information Braver et al. 10.1073/pnas.0808187106 SI Methods Participants. Participants were neurologically normal, righthanded younger or older adults. The groups did not differ in gender breakdown
Biology of Mood & Anxiety Disorders 2012, 2:11
 Biology of Mood & Anxiety Disorders This Provisional PDF corresponds to the article as it appeared upon acceptance. Fully formatted PDF and full text (HTML) versions will be made available soon. Neural
Bayesian Inference. Thomas Nichols. With thanks Lee Harrison
 Bayesian Inference Thomas Nichols With thanks Lee Harrison Attention to Motion Paradigm Results Attention No attention Büchel & Friston 1997, Cereb. Cortex Büchel et al. 1998, Brain - fixation only -
Changes in Default Mode Network as Automaticity Develops in a Categorization Task. Farzin Shamloo, Sebastien Helie * Purdue University
 1 Changes in Default Mode Network as Automaticity Develops in a Categorization Task Farzin Shamloo, Sebastien Helie * Purdue University * Corresponding Author. Address: Department of Psychological Sciences,
Reporting Checklist for Nature Neuroscience
 Corresponding Author: Manuscript Number: Manuscript Type: Prof. Giulio Tononi N56649CZ Article Reporting Checklist for Nature Neuroscience # Main s: 5 # lementary s: 8 # lementary s: 4 # lementary Videos:
Reporting Checklist for Nature Neuroscience
 Corresponding Author: Manuscript Number: Manuscript Type: Wu Li NNA48469A Article Reporting Checklist for Nature Neuroscience # Main Figures: 6 # Supplementary Figures: 0 # Supplementary Tables: 0 # Supplementary
Brain diffusion tensor imaging changes in cerebrotendinous xanthomatosis reversed with
 Brain diffusion tensor imaging changes in cerebrotendinous xanthomatosis reversed with treatment Claudia B. Catarino, MD, PhD, 1*, Christian Vollmar, MD, PhD, 2,3* Clemens Küpper, MD, 1,4 Klaus Seelos,
Resting-State Functional Connectivity in Stroke Patients After Upper Limb Robot-Assisted Therapy: A Pilot Study
 Resting-State Functional Connectivity in Stroke Patients After Upper Limb Robot-Assisted Therapy: A Pilot Study N. Kinany 1,3,4(&), C. Pierella 1, E. Pirondini 3,4, M. Coscia 2, J. Miehlbradt 1, C. Magnin
HST.583 Functional Magnetic Resonance Imaging: Data Acquisition and Analysis Fall 2008
 MIT OpenCourseWare http://ocw.mit.edu HST.583 Functional Magnetic Resonance Imaging: Data Acquisition and Analysis Fall 2008 For information about citing these materials or our Terms of Use, visit: http://ocw.mit.edu/terms.