Intensive Longitudinal Data Analysis
|
|
|
- Bridget Carroll
- 6 years ago
- Views:
Transcription
1 Intensive Longitudinal Data Analysis Adam C. Carle, M.A., Ph.D. James M. Anderson Center for Health Systems Excellence Cincinnati Children s Hospital Medical Center University of Cincinnati College of Medicine University of Cincinnati College of Arts and Sciences MCH Epidemiology Conference 2016, Philadelphia
2 Overview What is intensive longitudinal data? Definition. Advantages. Analytical challenges. An analytical approach. Time varying effect model. Example. Conclusion. Questions.

3 About Me

4 Help Along the Way Constance Mara. Michael Seid.
5 The Challenge
6 Introduction Health services researchers often wish to understand change. Much of the historical literature has used change scores. Difference between two time points. Limited information. Statistical concerns. Different courses of change may demonstrate the same incremental difference when measured with two time points.
7 Introduction Mobility Low High Time 1 Time 2 Observation

8 Time 1

9 Time 2

10 Time 3

11 Time 4
12 Introduction Recent years have seen increased use of designs that attempt to evaluate the course of change. 3 to 4 observations. Longitudinal growth models. Multilevel models. Latent growth curve models. Begin to address the overall shape and rate of change. Still require a parametric assumption. Theory. Extensive trial and error. May miss important and meaningful variation.
13 Introduction Mobility Low High Time 1 Time 2 Time 3 Time 4 Observation

14 What to do?
15 Intensive Longitudinal Data Intensive longitudinal data (ILD) refer to data with many measurements over time. Threshold of 10 observations sometimes used to define intensive, sometimes 40.
16 EMA repeatedly collects data from participants in their natural environment. Assessments focus on current state and setting. Home, school, hospital, etc. Represent sample of participant s state. Different times of day. Different settings. Random intervals. Ecological Momentary Assessment Saul Shiffman and Arthur Stone pioneered the use of ecological momentary assessment (EMA). Collected moment to moment data on the behavior and experiences of smokers. Led to rich understanding of etiology, dependence, withdrawal, treatment effects, and relapse process.
17 Intensive Longitudinal Data The hallmark of ILD and EMA is multiple, repeated assessment. Dense over short period or sparse over long period. Event-based. Do not attempt to characterize entire experience. Focus on discrete events. Can be difficult to operationally define. Time-based. Characterize experience more broadly. Combination of event- and time-based.
18 Intensive Longitudinal Data Advances in technology allow health services researchers to collect enormous amounts of data. Mobile technology (e.g., cell phones). Wireless technology (e.g., wireless sensor technology). Data storage advances (e.g.. the cloud ). Researchers can collect real-time, continuous, biological, behavioral, and environmental data. Decreased cost and increased uptake make large sample intensive data collection possible.
19 Advantages: Methodological Self-report often uses retrospective recall. People report on what they did or how they felt during a certain period. Evidence that self-reports include error and biases. Autobiographical memory is not an HD video. Particularly problematic for summary recall. Complete and accurate recall not typical. Heuristic strategies used instead. Retrospective memory influenced by primacy, recency, availability, physical context, and mental state.
20 Advantages: Theory Research has often focused on antecedents and consequences. Little is known about dynamic processes that occur during a disease s course. ILD provide data provide fine-grain information on the entire course of experience. Disease, hospital stay, etc. Allows shift to thinking about process of disease. Size and direction of effects and relationships may vary across time. Explicit testing of temporal sequence/ordering.
21 Intensive Longitudinal Data Analysis But, how do we analyze data like this?
22 Intensive Longitudinal Data Analysis i =1,...,n; j =1,...,m i, { t ij, y ij, x ij1..., x } ijp ( ) ( ) y = t + t x + β β ε ij 0 ij 1 ij ij ij.

23 No EQUATIONS!
24 Intensive Longitudinal Data Analysis i =1,...,n; j =1,...,m i, { t ij, y ij, x ij1..., x } ijp i corresponds to a specific participant. n represents total number of participants. j designates a specific observation. m i represents the total number of observations for participant i. t ij corresponds to the measurement time of the jth observation for the ith participant. y ij corresponds to the outcome on the jth observation for the ith participant. x ijp corresponds to the pth covariate on the jth observation for the ith participant.
25 Time Varying Effect Model (TVEM) TVEMs are a semiparametric approach that do not require a predetermined specification for the shape of change. Introduced in mid 1990s. Hastie & Tibshirani, 1993; Hoover, Rice, Wu, & Yang, Allow researchers to answer questions about associations that unfold and change across time.
26 Time Varying Effect Model D0 not require a parametric assumption about change across time. Linear, quadratic, etc. Do not require covariate effects to be constant across time. Direction and strength estimated from the data. Regression coefficients can change with time. Allow variability in completeness, timing, and spacing of observations. Systematic missingness is a different story though.
27 Time Varying Effect Model ( ) ( ) y = t + t x + β β ε ij 0 ij 1 ij ij ij. Key things about this model: Single covariate for simplicity. Continuous outcome. β o (t ij ) correspond to the intercept at time j. Intercept = mean of y. When covariate(s) = 0. β 1 (t ij ) corresponds to the relationship between covariate 1 at a particular point in time (j).
28 Time Varying Effect Model β o (. ) and β 1 (. ) assumed to be continuous functions of time. Labeled as coefficient functions. Commonly depicted graphically. Can be summarized numerically.
29 Time Varying Effect Model
30 Time Varying Effect Model Goal of TVEM is to estimate the shape of the coefficient functions over time. Does not impose parametric assumptions. Assumes only that the relationship changes smoothly over time. Continuous first order derivative. Estimation? Extensive literature on topic. Broadly categorized into two methods. Spline-based methods. Kernel-based methods. We will briefly discuss P-spline methods.
31 P-Spline Estimation of TVEM Flexible and computationally efficient. Any smooth function over an interval can be approximated by a polynomial function. Runge phenomenon makes this problematic. Oscillation at boundaries. Instead, locally approximate function over smaller subinterval with lower order polynomials. Provide a good approximation over small interval. Piecewise polynomials. Spline functions. This is the spline part of P-spline.
32 P-Spline Estimation of TVEM Requires sufficient density of observations within the subinterval. To avoid overfitting the P-spline method smooths the estimated functions. Estimates may be rough, especially with large number of knots. Penalizing the coefficients, shrinking them toward zero, smooths the overall function. This can be done manually with tuning parameters. More effectively done by including random effects for the coefficients. This approach less sensitive to misspecification of error dependence.
33 Example
34 An Ecological Momentary Approach to Understanding Health Related Quality Of Life and Disease Activity among Children with Inflammatory Bowel Disease. Adam C. Carle, M.A., Ph.D. Constance A. Mara, M.A., Ph.D. Michael Seid, Ph.D.
35 Example Pediatric inflammatory bowel disease (IBD) is a chronic relapsing condition. Comprised of Crohn s disease and ulcerative colitis. Chronic recurrent episodes of gastrointestinal tract inflammation. Bloating, pain, diarrhea, fever, and malabsorption of nutrients. Treatment requires longitudinal follow-up to: Maximize therapeutic response, minimize drug toxicity, improve HRQOL, promote physical and psychological growth, and prevent complications.
36 Example Studies have shown that children with IBD report significantly poorer HRQOL. Even during periods of disease inactivity, children with IBD continue to report poorer HRQOL. Poor HRQOL in children with IBD is associated with increased healthcare utilization, even when HRQOL is not associated with disease outcome itself.
37 Example Nearly all of these studies have used crosssectional designs, despite IBD's lifelong duration and unpredictable course. Some children have frequent relapses, others experience prolonged periods of remission, and some children experience sporadic relapses. When active, severity can range dramatically.
38 Example Given chronicity and variation in course and symptomology, it would seem critical to examine children with IBD's HRQOL longitudinally. Only a handful of studies have collected longitudinal data on HRQOL in children with IBD. Just one of these collected more than two observations (3 total). All of the studies conducted relatively simple analyses focusing on difference in average reports of HRQOL from baseline to follow-up Otley, et al., with 3 data points, compared average reports between adjacent observations only.
39 Example No IBD studies have attempted to understand children with IBD's HRQOL and disease activity as they unfold in real time. Research has not yet fully addressed the lived experience of children with IBD. Studies may have missed substantial and meaningful variation in patients' HRQOL and symptomatology. In this study, we addressed these issues. We used ecological momentary assessment (EMA) and a time varying effect model for ILDA.
40 Example We collected patient reported outcomes (PROs) daily and others weekly. Examined extent to which disease activity and HRQOL change and fluctuate across time. Extent to which changes in disease activity and HRQOL corresponded to similar changes in other PROs. We also used TVEMs to examine extent to which passively collected information about cell phone use (e.g., call duration, the number of texts, etc.) correlated with PROs. Might passively collected data compliment actively reported PRO data and serve as proxy for active patient reporting?
41 Methods Longitudinal sample of 56 children with CD and UC from the ImproveCareNow (ICN) network. ICN includes 66 care centers in 34 states and includes 35% of the ~50,000 children with IBD in the US. Weekly measures "pushed" to children s phones: PROMIS fatigue and pain interference measures. PRO Measurement Information System (PROMIS). A disease activity index weekly in situ using surveys. Pediatric ulcerative colitis activity index (PUCAI) and short pediatric Crohn s disease AI (spcdai).
42 Methods Daily symptom measures pushed to phones: # of bowel movements, presence of diarrhea, bleeding in stool, stomach pain, fatigue, stress question, and the # of hours slept the previous night. Passive smart phone data collected continuously daily and matched to active data for that day. Phone call, SMS, and movement data used to measure: Call count. Call length. SMS count. SMS length. Missed calls. Average movement radius; Communication diversity.
43 Methods Children provided M=148 data points. SD= Total of 9,645 matched observations. Because some variables collected weekly rather than daily, some analyses have fewer total observations. For the current study, we limited the observations included in the analyses to those made within 300 days of a patient's first observation. In the analytical sample, each child provided an average of 107 data points (SD=73.40). Total of 7,697 matched momentary assessment observations across time and children.
44 Analyses For all of the PRO, symptom, and smart phone use variables, calculated bivariate ordinary least squares correlations. Used a Taylor linearization to adjust the standard errors to account for within patient clustering (repeated measurement). Used the Benjamini-Hochberg False Discovery Procedure to control for inflated Type I errors. Used "null" model multilevel models to partition each variable's variance into variance between and within individuals, as well as compute each variable's intraclass correlation.
45 Analyses Used TVEMs to examine each variable individually and the relationship between each variable and each of the remaining variables. Started with a series of intercept-only TVEMs to describe how the average values of each of the variables changed across the length of the study.
46 Analyses Then fit two sets of intercept and slope TVEMs. First set focused on relationships between the different patient reported variables. First set of models examined: Extent to which a given patient reported variable ( outcome ) changed across time at average levels of another patient reported variable ( predictor ). Whether change in predictor corresponded to change in outcome. How the strength of the relationship between an outcome and predictor changed across time.
47 Analyses The second set of TVEMs focused on relationships between the passively collected variables as outcomes and each of the patient reported variables as predictors) The models in this set examined: Extent to which passive variable changed across time at average levels of patient reported variable. Whether change in a patient reported variable corresponded to change in a passive variable. How the strength of the relationship between the passive variable and the patient reported variable changed across time.
48 Analyses Conducted all analyses in Stata 13. For TVEMs, we used P-spline smoothing. TVEM results presented as figures because the approach results in a large number of coefficients that are difficult to interpret in tables.
49 Results Patient reported variables: A large proportion of the variance was between individuals and the ICCs were relatively large. Mean=.59, SD=.17. Relatively dissimilar to each other on average. Across time, an individual's values relatively similar.
50 Results Mean SD Median Min Max Adolescents PROMIS Fatigue PROMIS Pain Interference PCDAI PUCAI Fatigue Stress Stomach Pain Hours Sleep # Bowel Movements
51 Results Variance Between Participants Variance Within Participants Intraclass Correlation PROMIS Fatigue PROMIS Pain Interference PCDAI PUCAI Fatigue Stress Stomach Pain Hours Sleep # Bowel Movements
52 Results PROMIS Fatigue PROMIS Pain PCDAI Score PUCAI Score Fatigue Stress Stomach Pain Hours of Sleep # of Bowel Movements PROMIS Fatigue PROMIS Pain 0.77* PCDAI Score 0.73* 0.76* PUCAI Score * N/A Fatigue 0.68* 0.52* 0.58* Stress 0.57* 0.42* 0.49* * Stomach Pain 0.53* 0.57* 0.65* 0.45* 0.58* 0.49* Hours of Sleep * * # of Bowel Movements * 0.34* 0.47* * *p<0.05 Based on Benjamini-Hochberg False Discovery Procedure All standard errors and p-values adjusted for within individual clustering.
53 Results Passive variables: Much smaller proportion of the variance between individuals and ICCs were comparatively small (mean=. 23; SD=.13). Children relatively similar to each other across time. Fair amount of variance within individual across time.
54 Results Mean SD Median Min Max Adolescents Text Length Unreturned Calls Call Duration (Minutes) Mobility Interaction Diversity Missed Interactions Aggregate Communication Number of Texts
55 Results Variance Between Participants Variance Within Participants Intraclass Correlation Text Length 1.45E E Unreturned Calls Call Duration (Minutes) Mobility Interaction Diversity Missed Interactions Aggregate Communication Number of Texts
56 Results SMS Unret. Call Length Calls Duration Mob. Int. Missed Agg. SMS Mobility Diver. Int. Comm. Count Radius PROMIS Fatigue * PROMIS Pain * 0.28* 0.04 PCDAI Score * * 0.22* PUCAI Score * 0.12* Fatigue * * Stress Stomach Pain * * 0.29* Hours of Sleep # of Bowel Movements *p<0.05 Based on Benjamini-Hochberg False Discovery Procedure All standard errors and p-values adjusted for within individual clustering.
57 Intercept Only TVEM
58 Results
59 Results
60 Results
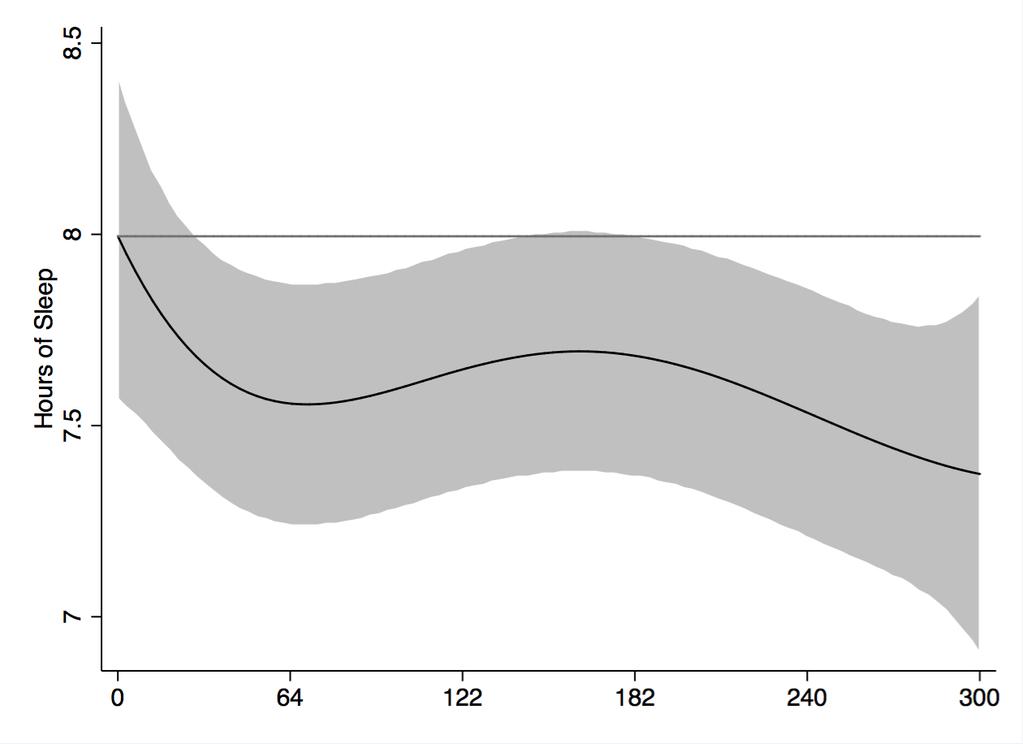
61 Results Some variability in each variable's average levels across time. For majority, changes in average value across time did not differ significantly from the initial value. In general, gray confidence interval bands encompass the line depicting initial value.
62 Results Three exceptions. Average values of PROMIS pain interference and selfreported hours of sleep both tended to decrease. PCDAI values decreased significantly as well, but not significantly until around the 200th day. Focusing on shape rather than significance, average values fluctuate relatively cyclically. Figures show increases and decreases across time, even for the variables that generally decreased across the study period
63 Results
64 Intercepts and Slopes TVEM
65 Results
66 Results Patient reported slope functions generally consistent and stable across time. Largest association between PROMIS fatigue and PROMIS pain (~0.5). Single item measures have more random measurement error than multi-item measures and are therefore less sensitive. Not surprising that largest effect size between PROMIS measures. All but reported hours of sleep and the number of bowel movements in a day were consistently significantly associated with the remaining patient reported variables.
67 Results Patient reported slope functions generally consistent and stable across time. Largest association between PROMIS fatigue and PROMIS pain (~0.5). Single item measures have more random measurement error than multi-item measures and are therefore less sensitive. Not surprising that largest effect size between PROMIS measures. All but reported hours of sleep and the number of bowel movements in a day were consistently significantly associated with the remaining patient reported variables.
68 Passive-Active TVEMs
69 Results
70 Results Relationship between aggregate communication and each patient reported variables generally small (< 0.2). Hours of sleep, bowel movements, PROMIS pain interference, and PROMIS fatigue relatively constant relationships with aggregate communication. Only relationship with pain interference is statistically significant across most of the study period. Other variables either have no or only brief periods where their association with aggregate communication differs significantly from zero.
71 Results
72 Results Relationship between aggregate communication and each patient reported variables generally small (< 0.2). Hours of sleep, bowel movements, PROMIS pain interference, and PROMIS fatigue relatively constant relationships with aggregate communication. Only relationship with pain interference is statistically significant across most of the study period. Other variables either have no or only brief periods where their association with aggregate communication differs significantly from zero.
73 Results
74 Results For remaining, focusing shape, one can see variation in the strength of the relationship. Slope functions rise and fall across time. Because confidence interval bands tend to overlap across time, periodicity could be due to chance. With the exception of stomach pain. Relationship significantly different from zero across several points in time. Vacillates from negative to positive multiple times. Sometimes increased stomach pain is associated with decreased aggregate communication. Other times increased stomach pain is associated with increased aggregate communication Size of relationship generally small though.
75 Results
76 Conclusions from Example Results suggest treatments that improve some of the common IBD symptoms will likely have a moderate and consistent impact on children's HRQOL regardless of when the improvements occur. Evidenced by consistent and moderately sized values in the slope functions. Analyses also demonstrate how more typical two time point studies miss substantial and meaningful variation in patients' HRQOL. In our IBD sample, there was significant variation for each variable within individuals across time.
77 Conclusions from Example Although we did observe some statistically significant relationships between passively collected data and active patient reports, the sizes of the relationships were relatively small. In addition, many of these relationships cyclically varied in size and occasionally in sign across time. This limits their ability to serve as potential proxies for patient reported outcomes. But, small number of individuals (not data points) so further study may show reveal different effects.
78 Challenges in ILD Studies Respondent burden. Reactivity. Compliance. Including concerns about falsification. Ethical issues. Psychometric issues. Integration across data sources. Increasingly complex research questions. Availability of ILD does not imply its appropriateness for all HSR questions. Don t force it.
79 Conclusions ILD designs allow for new and enriched understanding with respect to individual variables and relationships among variables. Shift the focus from single time points or parametric trajectories to more dynamical processes. Ecologically valid study results may differ from recall-based studies. Today we only focused on TVEM. Multiple options available.

80 Perplexed? Happy to take questions.
81 Intensive Longitudinal Data Analysis Adam C. Carle, M.A., Ph.D. James M. Anderson Center for Health Systems Excellence Cincinnati Children s Hospital Medical Center University of Cincinnati College of Medicine University of Cincinnati College of Arts and Sciences MCH Epidemiology Conference 2016, Philadelphia
Introduction to Multilevel Models for Longitudinal and Repeated Measures Data
 Introduction to Multilevel Models for Longitudinal and Repeated Measures Data Today s Class: Features of longitudinal data Features of longitudinal models What can MLM do for you? What to expect in this
Introduction to Multilevel Models for Longitudinal and Repeated Measures Data
 Introduction to Multilevel Models for Longitudinal and Repeated Measures Data Today s Class: Features of longitudinal data Features of longitudinal models What can MLM do for you? What to expect in this
Understanding and Applying Multilevel Models in Maternal and Child Health Epidemiology and Public Health
 Understanding and Applying Multilevel Models in Maternal and Child Health Epidemiology and Public Health Adam C. Carle, M.A., Ph.D. adam.carle@cchmc.org Division of Health Policy and Clinical Effectiveness
D. Gillespie, K. Hood, A. Williams, R. Stenson, C.S.J. Probert and A.B. Hawthorne Clinical Trials Methodology Conference, Bristol 2011
 Use of the Medication Event Monitoring System for assessing medication adherence for chronic conditions: Results from a 12 month trial of patients in remission with ulcerative colitis D. Gillespie, K.
Available from Deakin Research Online:
 This is the published version: Richardson, Ben and Fuller Tyszkiewicz, Matthew 2014, The application of non linear multilevel models to experience sampling data, European health psychologist, vol. 16,
Data Analysis in Practice-Based Research. Stephen Zyzanski, PhD Department of Family Medicine Case Western Reserve University School of Medicine
 Data Analysis in Practice-Based Research Stephen Zyzanski, PhD Department of Family Medicine Case Western Reserve University School of Medicine Multilevel Data Statistical analyses that fail to recognize
Epidemiology of IBD in Pediatric Patients in the US: Data from the ImproveCareNow Registry
 Epidemiology of IBD in Pediatric Patients in the US: Data from the ImproveCareNow Registry Michael D. Kappelman, MD Professor of Pediatrics and Epidemiology University of North Carolina, Chapel Hill Richard
NORTH SOUTH UNIVERSITY TUTORIAL 2
 NORTH SOUTH UNIVERSITY TUTORIAL 2 AHMED HOSSAIN,PhD Data Management and Analysis AHMED HOSSAIN,PhD - Data Management and Analysis 1 Correlation Analysis INTRODUCTION In correlation analysis, we estimate
Treatment of Pediatric IBD: What is Different?
 Treatment of Pediatric IBD: What is Different? January 13, 2017 Michael Kappelman MD, MPH University of North Carolina at Chapel Hill Overview Is Pediatric IBD the same disease? Treatment considerations
Catherine A. Welch 1*, Séverine Sabia 1,2, Eric Brunner 1, Mika Kivimäki 1 and Martin J. Shipley 1
 Welch et al. BMC Medical Research Methodology (2018) 18:89 https://doi.org/10.1186/s12874-018-0548-0 RESEARCH ARTICLE Open Access Does pattern mixture modelling reduce bias due to informative attrition
12/30/2017. PSY 5102: Advanced Statistics for Psychological and Behavioral Research 2
 PSY 5102: Advanced Statistics for Psychological and Behavioral Research 2 Selecting a statistical test Relationships among major statistical methods General Linear Model and multiple regression Special
Selection and Combination of Markers for Prediction
 Selection and Combination of Markers for Prediction NACC Data and Methods Meeting September, 2010 Baojiang Chen, PhD Sarah Monsell, MS Xiao-Hua Andrew Zhou, PhD Overview 1. Research motivation 2. Describe
Supplement for: CD4 cell dynamics in untreated HIV-1 infection: overall rates, and effects of age, viral load, gender and calendar time.
 Supplement for: CD4 cell dynamics in untreated HIV-1 infection: overall rates, and effects of age, viral load, gender and calendar time. Anne Cori* 1, Michael Pickles* 1, Ard van Sighem 2, Luuk Gras 2,
Mixed Effect Modeling. Mixed Effects Models. Synonyms. Definition. Description
 ixed Effects odels 4089 ixed Effect odeling Hierarchical Linear odeling ixed Effects odels atthew P. Buman 1 and Eric B. Hekler 2 1 Exercise and Wellness Program, School of Nutrition and Health Promotion
Models for HSV shedding must account for two levels of overdispersion
 UW Biostatistics Working Paper Series 1-20-2016 Models for HSV shedding must account for two levels of overdispersion Amalia Magaret University of Washington - Seattle Campus, amag@uw.edu Suggested Citation
Statistical Methods for Wearable Technology in CNS Trials
 Statistical Methods for Wearable Technology in CNS Trials Andrew Potter, PhD Division of Biometrics 1, OB/OTS/CDER, FDA ISCTM 2018 Autumn Conference Oct. 15, 2018 Marina del Rey, CA www.fda.gov Disclaimer
Simple Linear Regression the model, estimation and testing
 Simple Linear Regression the model, estimation and testing Lecture No. 05 Example 1 A production manager has compared the dexterity test scores of five assembly-line employees with their hourly productivity.
Multiple Regression. James H. Steiger. Department of Psychology and Human Development Vanderbilt University
 Multiple Regression James H. Steiger Department of Psychology and Human Development Vanderbilt University James H. Steiger (Vanderbilt University) Multiple Regression 1 / 19 Multiple Regression 1 The Multiple
Introduction to Machine Learning. Katherine Heller Deep Learning Summer School 2018
 Introduction to Machine Learning Katherine Heller Deep Learning Summer School 2018 Outline Kinds of machine learning Linear regression Regularization Bayesian methods Logistic Regression Why we do this
In this chapter, we discuss the statistical methods used to test the viability
 5 Strategy for Measuring Constructs and Testing Relationships In this chapter, we discuss the statistical methods used to test the viability of our conceptual models as well as the methods used to test
Background. 2 5/30/2017 Company Confidential 2015 Eli Lilly and Company
 May 2017 Estimating the effects of patient-reported outcome (PRO) diarrhea and pain measures on PRO fatigue: data analysis from a phase 2 study of abemaciclib monotherapy, a CDK4 and CDK6 inhibitor, in
Diurnal Pattern of Reaction Time: Statistical analysis
 Diurnal Pattern of Reaction Time: Statistical analysis Prepared by: Alison L. Gibbs, PhD, PStat Prepared for: Dr. Principal Investigator of Reaction Time Project January 11, 2015 Summary: This report gives
Political Science 15, Winter 2014 Final Review
 Political Science 15, Winter 2014 Final Review The major topics covered in class are listed below. You should also take a look at the readings listed on the class website. Studying Politics Scientifically
DISEASE-SPECIFIC REFERENCE EQUATIONS FOR LUNG FUNCTION IN PATIENTS WITH CYSTIC FIBROSIS
 DISEASE-SPECIFIC REFERENCE EQUATIONS FOR LUNG FUNCTION IN PATIENTS WITH CYSTIC FIBROSIS Michal Kulich, PhD, Margaret Rosenfeld, MD, MPH, Jonathan Campbell, MS, Richard Kronmal, PhD, Ron L. Gibson, MD,
Design and Analysis Plan Quantitative Synthesis of Federally-Funded Teen Pregnancy Prevention Programs HHS Contract #HHSP I 5/2/2016
 Design and Analysis Plan Quantitative Synthesis of Federally-Funded Teen Pregnancy Prevention Programs HHS Contract #HHSP233201500069I 5/2/2016 Overview The goal of the meta-analysis is to assess the effects
IAPT: Regression. Regression analyses
 Regression analyses IAPT: Regression Regression is the rather strange name given to a set of methods for predicting one variable from another. The data shown in Table 1 and come from a student project
UI α (n=150) Mean (SD) or N (%)
 Mean (SD) or N (%)") Supplementary Table 1: Descriptive characteristics of male LURN participants Overall (n=477) UI α (n=150) PVD β (n=211) non-ui γ (n=116) * Age 60.9 (13.3) 63.5 (11.5) 57.9 (14.1) 63.1 (12.8) 0.001 Race
Supplementary Table 1: Descriptive characteristics of male LURN participants Overall (n=477) UI α (n=150) PVD β (n=211) non-ui γ (n=116) * Age 60.9 (13.3) 63.5 (11.5) 57.9 (14.1) 63.1 (12.8) 0.001 Race
THE GOOD, THE BAD, & THE UGLY: WHAT WE KNOW TODAY ABOUT LCA WITH DISTAL OUTCOMES. Bethany C. Bray, Ph.D.
 THE GOOD, THE BAD, & THE UGLY: WHAT WE KNOW TODAY ABOUT LCA WITH DISTAL OUTCOMES Bethany C. Bray, Ph.D. bcbray@psu.edu WHAT ARE WE HERE TO TALK ABOUT TODAY? Behavioral scientists increasingly are using
Objective: To describe a new approach to neighborhood effects studies based on residential mobility and demonstrate this approach in the context of
 Objective: To describe a new approach to neighborhood effects studies based on residential mobility and demonstrate this approach in the context of neighborhood deprivation and preterm birth. Key Points:
First of two parts Joseph Hogan Brown University and AMPATH
 First of two parts Joseph Hogan Brown University and AMPATH Overview What is regression? Does regression have to be linear? Case study: Modeling the relationship between weight and CD4 count Exploratory
Choosing an Approach for a Quantitative Dissertation: Strategies for Various Variable Types
 Choosing an Approach for a Quantitative Dissertation: Strategies for Various Variable Types Kuba Glazek, Ph.D. Methodology Expert National Center for Academic and Dissertation Excellence Outline Thesis
OLS Regression with Clustered Data
 OLS Regression with Clustered Data Analyzing Clustered Data with OLS Regression: The Effect of a Hierarchical Data Structure Daniel M. McNeish University of Maryland, College Park A previous study by Mundfrom
Relationship of nighttime arousals and nocturnal cortisol in IBS and normal subjects. Miranda Bradford. A thesis submitted in partial fulfillment
 Relationship of nighttime arousals and nocturnal cortisol in IBS and normal subjects Miranda Bradford A thesis submitted in partial fulfillment of the requirements for the degree of Master of Science University
11/18/2013. Correlational Research. Correlational Designs. Why Use a Correlational Design? CORRELATIONAL RESEARCH STUDIES
 Correlational Research Correlational Designs Correlational research is used to describe the relationship between two or more naturally occurring variables. Is age related to political conservativism? Are
10. LINEAR REGRESSION AND CORRELATION
 1 10. LINEAR REGRESSION AND CORRELATION The contingency table describes an association between two nominal (categorical) variables (e.g., use of supplemental oxygen and mountaineer survival ). We have
Unit 1 Exploring and Understanding Data
 Unit 1 Exploring and Understanding Data Area Principle Bar Chart Boxplot Conditional Distribution Dotplot Empirical Rule Five Number Summary Frequency Distribution Frequency Polygon Histogram Interquartile
Correlation and regression
 PG Dip in High Intensity Psychological Interventions Correlation and regression Martin Bland Professor of Health Statistics University of York http://martinbland.co.uk/ Correlation Example: Muscle strength
Chapter 2 Interactions Between Socioeconomic Status and Components of Variation in Cognitive Ability
 Chapter 2 Interactions Between Socioeconomic Status and Components of Variation in Cognitive Ability Eric Turkheimer and Erin E. Horn In 3, our lab published a paper demonstrating that the heritability
2.0 Synopsis. ABT-358 M Clinical Study Report R&D/06/099. (For National Authority Use Only) to Item of the Submission: Volume:
 to Item of the Submission: Volume:") 2.0 Synopsis Abbott Laboratories Name of Study Drug: Zemplar Injection Name of Active Ingredient: Paricalcitol Individual Study Table Referring to Item of the Submission: Volume: Page: (For National Authority
2.0 Synopsis Abbott Laboratories Name of Study Drug: Zemplar Injection Name of Active Ingredient: Paricalcitol Individual Study Table Referring to Item of the Submission: Volume: Page: (For National Authority
SUPPLEMENTAL MATERIAL
 1 SUPPLEMENTAL MATERIAL Response time and signal detection time distributions SM Fig. 1. Correct response time (thick solid green curve) and error response time densities (dashed red curve), averaged across
Changes Over Time in Occurrence, Severity, and Distress of Common Symptoms During and After Radiation Therapy for Breast Cancer
 98 Journal of Pain and Symptom Management Vol. 45 No. June Original Article Changes Over Time in Occurrence, Severity, and Distress of Common Symptoms During and After Radiation Therapy for Breast Cancer
Spatiotemporal models for disease incidence data: a case study
 Spatiotemporal models for disease incidence data: a case study Erik A. Sauleau 1,2, Monica Musio 3, Nicole Augustin 4 1 Medicine Faculty, University of Strasbourg, France 2 Haut-Rhin Cancer Registry 3
Improving outcome of Inflammatory Bowel Disease in children
 Improving outcome of Inflammatory Bowel Disease in children Dinesh Pashankar, MD Pediatric Gastroenterologist Director- Pediatric IBD program Yale University School of Medicine Pediatric Gastroenterology
Fixed Effect Combining
 Meta-Analysis Workshop (part 2) Michael LaValley December 12 th 2014 Villanova University Fixed Effect Combining Each study i provides an effect size estimate d i of the population value For the inverse
Examining the relationship between daily changes in support and smoking around a selfset. quit date. Urte Scholz. University of Zurich
 Title Page with All Author Information Running Head: SOCIAL SUPPORT AND SMOKING Examining the relationship between daily changes in support and smoking around a selfset quit date Urte Scholz University
Machine Learning Statistical Learning. Prof. Matteo Matteucci
 Machine Learning Statistical Learning Pro. Matteo Matteucci Statistical Learning Outline o What Is Statistical Learning? Why estimate? How do we estimate? The trade-o between prediction accuracy & model
Doing Quantitative Research 26E02900, 6 ECTS Lecture 6: Structural Equations Modeling. Olli-Pekka Kauppila Daria Kautto
 Doing Quantitative Research 26E02900, 6 ECTS Lecture 6: Structural Equations Modeling Olli-Pekka Kauppila Daria Kautto Session VI, September 20 2017 Learning objectives 1. Get familiar with the basic idea
An informal analysis of multilevel variance
 APPENDIX 11A An informal analysis of multilevel Imagine we are studying the blood pressure of a number of individuals (level 1) from different neighbourhoods (level 2) in the same city. We start by doing
Interactive Mobile Health and Rehabilitation
 Interactive Mobile Health and Rehabilitation Table of Contents Brief Overview... 4 What Makes imhere Unique... 6 Applications... 11 Steakholders... 15 Brief Overview imhere is a mhealth platform for providing
Devils, Details, and Data: Measurement Models and Analysis Strategies for Novel Technology-Based Clinical Outcome Assessments
 Devils, Details, and Data: Measurement Models and Analysis Strategies for Novel Technology-Based Clinical Outcome Assessments ISCTM 2018 Autumn Meeting Robert M Bilder, UCLA Michael E. Tennenbaum Family
A re-randomisation design for clinical trials
 Kahan et al. BMC Medical Research Methodology (2015) 15:96 DOI 10.1186/s12874-015-0082-2 RESEARCH ARTICLE Open Access A re-randomisation design for clinical trials Brennan C Kahan 1*, Andrew B Forbes 2,
Machine Learning to Inform Breast Cancer Post-Recovery Surveillance
 Machine Learning to Inform Breast Cancer Post-Recovery Surveillance Final Project Report CS 229 Autumn 2017 Category: Life Sciences Maxwell Allman (mallman) Lin Fan (linfan) Jamie Kang (kangjh) 1 Introduction
Thank you Dr. XXXX; I am going to be talking briefly about my EMA study of attention training in cigarette smokers.
 Thank you Dr. XXXX; I am going to be talking briefly about my EMA study of attention training in cigarette smokers. 1 This work is a result of the combined efforts of myself and my research advisor, Dr.
Original Article Downloaded from jhs.mazums.ac.ir at 22: on Friday October 5th 2018 [ DOI: /acadpub.jhs ]
![Original Article Downloaded from jhs.mazums.ac.ir at 22: on Friday October 5th 2018 [ DOI: /acadpub.jhs ]](/thumbs/87/96182226.jpg "Original Article Downloaded from jhs.mazums.ac.ir at 22: on Friday October 5th 2018 [ DOI: /acadpub.jhs ]") Iranian journal of health sciences 213;1(3):58-7 http://jhs.mazums.ac.ir Original Article Downloaded from jhs.mazums.ac.ir at 22:2 +33 on Friday October 5th 218 [ DOI: 1.18869/acadpub.jhs.1.3.58 ] A New
Iranian journal of health sciences 213;1(3):58-7 http://jhs.mazums.ac.ir Original Article Downloaded from jhs.mazums.ac.ir at 22:2 +33 on Friday October 5th 218 [ DOI: 1.18869/acadpub.jhs.1.3.58 ] A New
A Comparison of Robust and Nonparametric Estimators Under the Simple Linear Regression Model
 Nevitt & Tam A Comparison of Robust and Nonparametric Estimators Under the Simple Linear Regression Model Jonathan Nevitt, University of Maryland, College Park Hak P. Tam, National Taiwan Normal University
11/24/2017. Do not imply a cause-and-effect relationship
 Correlational research is used to describe the relationship between two or more naturally occurring variables. Is age related to political conservativism? Are highly extraverted people less afraid of rejection
Multilevel Techniques for Quality Control Charts of Recovery Outcomes
 Multilevel Techniques for Quality Control Charts of Recovery Outcomes INFORMS Annual Meeting 2009 San Diego, CA October, 11 th, 2009 Linda Laganga, PhD* (Linda.Laganga@mhcd.org) CJ McKinney, MA Kate DeRoche,
Sampling Weights, Model Misspecification and Informative Sampling: A Simulation Study
 Sampling Weights, Model Misspecification and Informative Sampling: A Simulation Study Marianne (Marnie) Bertolet Department of Statistics Carnegie Mellon University Abstract Linear mixed-effects (LME)
Systematic reviews and meta-analyses of observational studies (MOOSE): Checklist.
: Checklist.") Systematic reviews and meta-analyses of observational studies (MOOSE): Checklist. MOOSE Checklist Infliximab reduces hospitalizations and surgery interventions in patients with inflammatory bowel disease:
Systematic reviews and meta-analyses of observational studies (MOOSE): Checklist. MOOSE Checklist Infliximab reduces hospitalizations and surgery interventions in patients with inflammatory bowel disease:
Weekly Prevalence of Symptoms USA vs. Colombia
 THE OVERLAP BETWEEN INFLAMMATORY BOWEL DISEASE AND FUNCTIONAL GASTROINTESTINAL DISORDERS: CHALLENGES AND TREATMENT IMPLICATIONS Miguel Saps, MD Professor of Pediatrics, Ohio State University Director of
Lecture Outline. Biost 517 Applied Biostatistics I. Purpose of Descriptive Statistics. Purpose of Descriptive Statistics
 Biost 517 Applied Biostatistics I Scott S. Emerson, M.D., Ph.D. Professor of Biostatistics University of Washington Lecture 3: Overview of Descriptive Statistics October 3, 2005 Lecture Outline Purpose
Pitfalls in Linear Regression Analysis
 Pitfalls in Linear Regression Analysis Due to the widespread availability of spreadsheet and statistical software for disposal, many of us do not really have a good understanding of how to use regression
Biostatistics II
 Biostatistics II 514-5509 Course Description: Modern multivariable statistical analysis based on the concept of generalized linear models. Includes linear, logistic, and Poisson regression, survival analysis,
REPEATED MEASURES DESIGNS
 Repeated Measures Designs The SAGE Encyclopedia of Educational Research, Measurement and Evaluation Markus Brauer (University of Wisconsin-Madison) Target word count: 1000 - Actual word count: 1071 REPEATED
Measures. David Black, Ph.D. Pediatric and Developmental. Introduction to the Principles and Practice of Clinical Research
 Introduction to the Principles and Practice of Clinical Research Measures David Black, Ph.D. Pediatric and Developmental Neuroscience, NIMH With thanks to Audrey Thurm Daniel Pine With thanks to Audrey
CRITERIA FOR USE. A GRAPHICAL EXPLANATION OF BI-VARIATE (2 VARIABLE) REGRESSION ANALYSISSys
 REGRESSION ANALYSISSys") Multiple Regression Analysis 1 CRITERIA FOR USE Multiple regression analysis is used to test the effects of n independent (predictor) variables on a single dependent (criterion) variable. Regression tests
Multiple Regression Analysis 1 CRITERIA FOR USE Multiple regression analysis is used to test the effects of n independent (predictor) variables on a single dependent (criterion) variable. Regression tests
Ecological Statistics
 A Primer of Ecological Statistics Second Edition Nicholas J. Gotelli University of Vermont Aaron M. Ellison Harvard Forest Sinauer Associates, Inc. Publishers Sunderland, Massachusetts U.S.A. Brief Contents
Analyzing diastolic and systolic blood pressure individually or jointly?
 Analyzing diastolic and systolic blood pressure individually or jointly? Chenglin Ye a, Gary Foster a, Lisa Dolovich b, Lehana Thabane a,c a. Department of Clinical Epidemiology and Biostatistics, McMaster
Education, Literacy & Health Outcomes Findings
 2014/ED/EFA/MRT/PI/05 Background paper prepared for the Education for All Global Monitoring Report 2013/4 Teaching and learning: Achieving quality for all Education, Literacy & Health Outcomes Findings
Multilevel analysis quantifies variation in the experimental effect while optimizing power and preventing false positives
 DOI 10.1186/s12868-015-0228-5 BMC Neuroscience RESEARCH ARTICLE Open Access Multilevel analysis quantifies variation in the experimental effect while optimizing power and preventing false positives Emmeke
Business Statistics Probability
 Business Statistics The following was provided by Dr. Suzanne Delaney, and is a comprehensive review of Business Statistics. The workshop instructor will provide relevant examples during the Skills Assessment
Addendum: Multiple Regression Analysis (DRAFT 8/2/07)
") Addendum: Multiple Regression Analysis (DRAFT 8/2/07) When conducting a rapid ethnographic assessment, program staff may: Want to assess the relative degree to which a number of possible predictive variables
Addendum: Multiple Regression Analysis (DRAFT 8/2/07) When conducting a rapid ethnographic assessment, program staff may: Want to assess the relative degree to which a number of possible predictive variables
Meta-analysis using HLM 1. Running head: META-ANALYSIS FOR SINGLE-CASE INTERVENTION DESIGNS
 Meta-analysis using HLM 1 Running head: META-ANALYSIS FOR SINGLE-CASE INTERVENTION DESIGNS Comparing Two Meta-Analysis Approaches for Single Subject Design: Hierarchical Linear Model Perspective Rafa Kasim
Preliminary Report on Simple Statistical Tests (t-tests and bivariate correlations)
") Preliminary Report on Simple Statistical Tests (t-tests and bivariate correlations) After receiving my comments on the preliminary reports of your datasets, the next step for the groups is to complete
Preliminary Report on Simple Statistical Tests (t-tests and bivariate correlations) After receiving my comments on the preliminary reports of your datasets, the next step for the groups is to complete
Session 6: Choosing and using HRQoL measures vs Multi-Attribute Utility Instruments QLU-C10D and EQ-5D as examples
 Session 6: Choosing and using HRQoL measures vs Multi-Attribute Utility Instruments QLU-C10D and EQ-5D as examples - Madeleine King & Richard De Abreu Lourenco- Overview Learning Objectives To discuss
SINGLE-CASE RESEARCH. Relevant History. Relevant History 1/9/2018
 SINGLE-CASE RESEARCH And Small N Designs Relevant History In last half of nineteenth century, researchers more often looked at individual behavior (idiographic approach) Founders of psychological research
MULTIPLE LINEAR REGRESSION 24.1 INTRODUCTION AND OBJECTIVES OBJECTIVES
 24 MULTIPLE LINEAR REGRESSION 24.1 INTRODUCTION AND OBJECTIVES In the previous chapter, simple linear regression was used when you have one independent variable and one dependent variable. This chapter
Households: the missing level of analysis in multilevel epidemiological studies- the case for multiple membership models
 Households: the missing level of analysis in multilevel epidemiological studies- the case for multiple membership models Tarani Chandola* Paul Clarke* Dick Wiggins^ Mel Bartley* 10/6/2003- Draft version
At the outset, we want to clear up some terminology issues. IBS is COPYRIGHTED MATERIAL. What Is IBS?
 1 What Is IBS? At the outset, we want to clear up some terminology issues. IBS is the abbreviation that doctors use for irritable bowel syndrome, often when they are talking about people with IBS. We will
Applications. DSC 410/510 Multivariate Statistical Methods. Discriminating Two Groups. What is Discriminant Analysis
 DSC 4/5 Multivariate Statistical Methods Applications DSC 4/5 Multivariate Statistical Methods Discriminant Analysis Identify the group to which an object or case (e.g. person, firm, product) belongs:
1 Online Appendix for Rise and Shine: The Effect of School Start Times on Academic Performance from Childhood through Puberty
 1 Online Appendix for Rise and Shine: The Effect of School Start Times on Academic Performance from Childhood through Puberty 1.1 Robustness checks for mover definition Our identifying variation comes
You must answer question 1.
 Research Methods and Statistics Specialty Area Exam October 28, 2015 Part I: Statistics Committee: Richard Williams (Chair), Elizabeth McClintock, Sarah Mustillo You must answer question 1. 1. Suppose
Agenda. Innovative, valid, reproducible and feasible methods for integrated assessment of determinants and behaviours. I.
 Innovative, valid, reproducible and feasible methods for integrated assessment of determinants and behaviours Ulrich Ebner-Priemer Agenda Relevant for - the assessment of PA and diet - the assessment of
Equating UDS Neuropsychological Tests: 3.0>2.0, 3.0=2.0, 3.0<2.0? Dan Mungas, Ph.D. University of California, Davis
 Equating UDS Neuropsychological Tests: 3.0>2.0, 3.0=2.0, 3.0
Statistics for Psychology
 Statistics for Psychology SIXTH EDITION CHAPTER 12 Prediction Prediction a major practical application of statistical methods: making predictions make informed (and precise) guesses about such things as
An Introduction to Bayesian Statistics
 An Introduction to Bayesian Statistics Robert Weiss Department of Biostatistics UCLA Fielding School of Public Health robweiss@ucla.edu Sept 2015 Robert Weiss (UCLA) An Introduction to Bayesian Statistics
Research and Evaluation Methodology Program, School of Human Development and Organizational Studies in Education, University of Florida
 Vol. 2 (1), pp. 22-39, Jan, 2015 http://www.ijate.net e-issn: 2148-7456 IJATE A Comparison of Logistic Regression Models for Dif Detection in Polytomous Items: The Effect of Small Sample Sizes and Non-Normality
Propensity Score Methods for Estimating Causality in the Absence of Random Assignment: Applications for Child Care Policy Research
 2012 CCPRC Meeting Methodology Presession Workshop October 23, 2012, 2:00-5:00 p.m. Propensity Score Methods for Estimating Causality in the Absence of Random Assignment: Applications for Child Care Policy
Evaluating Auditory Contexts and Their Impacts on Hearing Aid Outcomes with Mobile Phones
 Evaluating Auditory Contexts and Their Impacts on Hearing Aid Outcomes with Mobile Phones Syed Shabih Hasan, Octav Chipara Department of Computer Science/Aging Mind and Brain Initiative (AMBI) Yu-Hsiang
Analysis of Rheumatoid Arthritis Data using Logistic Regression and Penalized Approach
 University of South Florida Scholar Commons Graduate Theses and Dissertations Graduate School November 2015 Analysis of Rheumatoid Arthritis Data using Logistic Regression and Penalized Approach Wei Chen
Longitudinal data, comprising repeated measurements of
 Statistical Primer for Cardiovascular Research A Primer in Longitudinal Data Analysis Garrett M. Fitzmaurice, ScD; Caitlin Ravichandran, PhD Longitudinal data, comprising repeated measurements of the same
Inflammatory Bowel Disease
 + Inflammatory Bowel Disease Christina Kalafsky, Dietetic Intern University of Maryland College Park Children s National Medical Center Case Study January 31, 2014 + Outline n Inflammatory Bowel Disease
NIH Public Access Author Manuscript Prev Sci. Author manuscript; available in PMC 2013 June 01.
 NIH Public Access Author Manuscript Published in final edited form as: Prev Sci. 2012 June ; 13(3): 288 299. doi:10.1007/s11121-011-0264-z. Using the Time-Varying Effect Model (TVEM) to Examine Dynamic
Ulcerative Colitis. ulcerative colitis usually only affects the colon.
 Ulcerative Colitis Introduction Ulcerative colitis is an inflammatory bowel disease. It is one of the 2 most common inflammatory bowel diseases. The other one is Crohn s disease. Ulcerative colitis and
When to Use Hierarchical Linear Modeling
 Veronika Huta, a When to Use Hierarchical Linear odeling a School of psychology, University of Ottawa Abstract revious publications on hierarchical linear modeling (HL) have provided guidance on how to
Using Analytical and Psychometric Tools in Medium- and High-Stakes Environments
 Using Analytical and Psychometric Tools in Medium- and High-Stakes Environments Greg Pope, Analytics and Psychometrics Manager 2008 Users Conference San Antonio Introduction and purpose of this session
 alternate-form reliability The degree to which two or more versions of the same test correlate with one another. In clinical studies in which a given function is going to be tested more than once over
Chapter 1. Introduction
 Chapter 1 Introduction 1.1 Motivation and Goals The increasing availability and decreasing cost of high-throughput (HT) technologies coupled with the availability of computational tools and data form a
Memorial Sloan-Kettering Cancer Center
 Memorial Sloan-Kettering Cancer Center Memorial Sloan-Kettering Cancer Center, Dept. of Epidemiology & Biostatistics Working Paper Series Year 2007 Paper 14 On Comparing the Clustering of Regression Models