PepT1 Expression Helps Maintain Intestinal Homeostasis by Mediating the Differential. Expression of mirnas along the Crypt-Villus Axis
|
|
|
- Harriet McDaniel
- 5 years ago
- Views:
Transcription
1 PepT Expression Helps Maintain Intestinal Homeostasis by Mediating the Differential Expression of mirnas along the Crypt-Villus Axis Yuchen Zhang,*, Emilie Viennois, Mingzhen Zhang, Bo Xiao, 3, Moon Kwon Han, Lewins Walter, Pallavi Garg 4, Didier Merlin, Center for Diagnostics and Therapeutics, Institute for Biomedical Sciences, Georgia State University, Atlanta, Georgia, 33, USA Atlanta Veterans Affairs Medical Center, Decatur, Georgia, 333, USA 3 Institute for Clean Energy and Advanced Materials, Faculty for Materials and Energy, Southwest University, Chongqing, 475, P. R. China 4 Department of Biology, Georgia State University, Atlanta, Georgia, 33, USA * Corresponding author: Yuchen Zhang, Institute for Biomedical Sciences, Georgia State University, Atlanta, GA, Tel.: + (44) ; Fax: + (44) ; yzhang4@gsu.edu
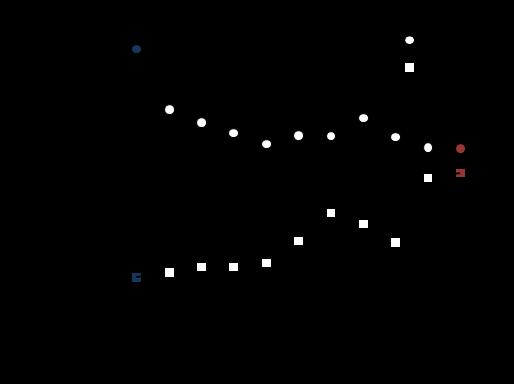
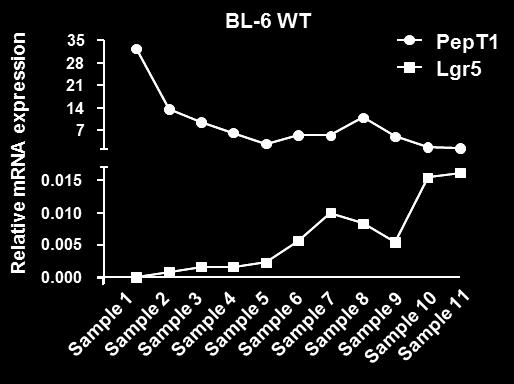
2 Supplementary Figure. Expression of PepT and Lgr5 in isolated epithelial cells of the jejunum from BL-6 WT mice. Total RNAs were extracted from the different fractions collected from BL-6 WT mice using the low-temperature method, and the expression levels of PepT (as a villus marker) and Lgr5 (as a crypt marker) were assessed by qrt-pcr. Supplementary Figure. Expression of Muc, Lgr5, and mpept in WT and KO mice. The expression levels of (a) Muc, (b) Lgr5, and (c) mpept were assessed by immunofluorescence. Muc, Lgr5 and mpept were immunostained using anti-muc, anti-lgr5, and anti-pept, respectively (FITC, green). F-actin was stained using phalloidin (TRITC, red), and cell nuclei were stained using DAPI (blue). Separate pictures were taken at for each filter, and the images were merged. Scale bar, 5 µm. Supplementary Figure 3. Clustering graph of selected mirnas. MicroRNA microarray results demonstrated that different mirna profiles were ovserved in crypts and villi of WT and PepT KO mice. We selected mirnas that exhibited P value <5 and signal strengths > 5. Supplementary Figure 4. Expression levels of selected mirnas in crypt and villus epithelial cells from BL-6 WT and PepT KO mice. The expression levels of 36 selected mirnas were verified by qrt-pcr (n= 5/group; * P< 5, P< 5, and * P< ). Supplementary Figure 5. PepT expression disturbs normal differential protein expression along the crypt-villus axis. D-DIGE DeCyder BVA (Biological Variation Analysis) showing a representative gel image with labeled sample of difference. Changes in
3 protein expression were compared between villi and crypts, with a pooled internal standard included. The master gel image shows the locations of the differentially expressed proteins in each comparison. a. 43 spots with >.-fold differences in WT villi vs. s. b. 7 spots with >.-fold differences in KO villi vs. s. Supplementary Figure 6. PepT expression altered the normal protein profile in villus and crypt, respectively. D-DIGE DeCyder BVA (Biological Variation Analysis) showing a representative gel image with labeled sample of difference. Changes in protein expression were compared between BL-6 WT and PePT KO mice, with a pooled internal standard included. The master gel image shows the locations of the differentially expressed proteins in each comparison. a. 4 spots with >.-fold differences in WT villi vs. KO villi. b. 5 spots with >.-fold differences in s vs. s.
4 Supplementary Figure


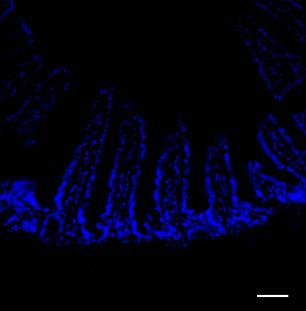
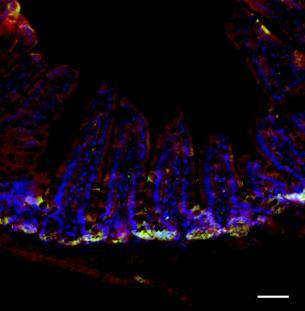
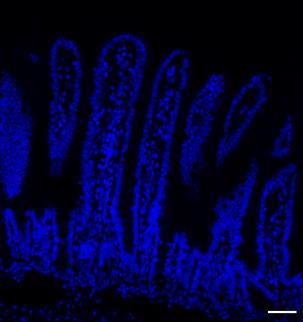
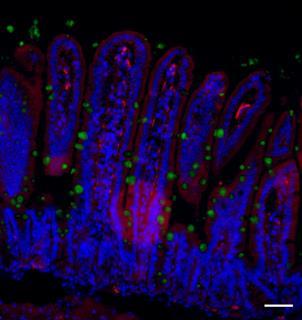
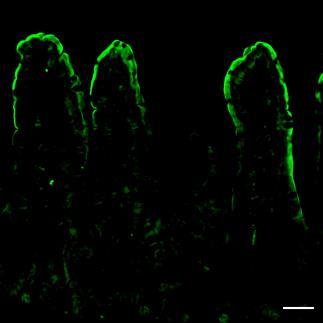
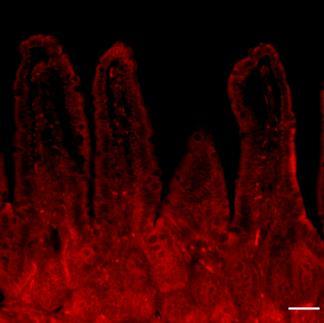
5 a BL-6 WT Muc 5 μm 5 μm 5 μm 5 μm PepT KO Muc 5 μm 5 μm 5 μm 5 μm b BL-6 WT Lgr5 5 μm 5 μm 5 μm 5 μm PepT KO Lgr5 5 μm 5 μm 5 μm 5 μm c BL-6 WT PepT 5 μm 5 μm 5 μm 5 μm PepT KO PepT Supplementary Figure 5 μm 5 μm 5 μm 5 μm
6 Supplementary Figure 3
7 8 * mirna--5p mirna-3-3p mirna-4-5p 6 4 mirna-4-5p * 4 mirna-5-3p mirna-5a-5p 3 mirna-6-5p mirna-8a-5p. mirna-8b-5p. 3 * mirna-8a-5p mirna-9-5p mirna-94-3p Supplementary Figure 4
8 mirna-9b-5p 3 mirna-c-5p mirna-3-3p. mirna-a-5p mirna--3p mirna-5-5p 4 mirna--3p. mirna-3-3p mirna--3p 3 mirna-6a-5p mirna-9c-3p mirna-3c-5p *. * Supplementary Figure 4
9 mirna-3-3p mirna-3-5p mirna-36-3p. *.5. mirna-33-5p * mirna-345-5p.5 *. 4 3 * mirna-34a-5p 3 mirna-375-3p 4 mirna mirna-65-3p 3 mirna-79 mirna-7-5p 8 * mirna-98-5p 6 4 * Supplementary Figure 4


10 MW: -~5 kda MW: -~5 kda MW: -~5 kda MW: -~5 kda a 4 WT Villus 4 WT Crypt ph:3- ph:3- b 337 KO Villus KO Crypt ph:3-386 ph:3- Supplementary Figure 5


11 MW: -~5 kda MW: -~5 kda MW: -~5 kda MW: -~5 kda a WT Villus KO Villus ph:3- ph:3- b WT Crypt KO Crypt ph:3-335 ph:3-335 Supplementary Figure 6
12 Supplementary Table. List of primers used in this study Primer Sequences 36B4 F TCCAGGCTTTGGGCATCA 36B4 R CTTTATCAGCTGCACATCACTCAGA mpept F CTCCATCTTCTACCTGTCCATCAACGCA mpept R GCTACGGTTCCTGAAGCGGTTTTTGACT mmu-mir-4-5p F CATAAAGTAGAAAGCACTACT mmu-mir-6-5p F TAGCAGCACGTAAATATTGGCG mmu-mir--3p F AAGCTGCCAGTTGAAGAACTGT mmu-mir-94-3p F CCAGTGGGGCTGCTGTTATCTG mmu-mir-33-5p F GTGCATTGTAGTTGCATTGCA mmu-mir-3-3p F TGTCAGTTTGTCAAATACCCCA mmu-mir-3-5p F TATTGCACATTACTAAGTTGCA mmu-mir-4-5p F CAGTGGTTTTACCCTATGGTAG mmu-mir-5a-5p F TAGCAGCACATAATGGTTTGTG mmu-mir-3-3p F TGCTATGCCAACATATTGCCATC mmu-mir-36-3p F CCTCTGGGCCCTTCCTCCAGT mmu-mir-9c-3p F TAGCACCATTTGAAATCGGTTA
13 mmu-mir-3-3p F GTGAAATGTTTAGGACCACTAG mmu-mir-9b-5p F AGTTTTGCAGGTTTGCATCCAGC mmu-mir-6a-5p F TTCAAGTAATCCAGGATAGGCT mmu-mir-3-3p F AGCAGCATTGTACAGGGCTATGA mmu-mir-9-5p F CTGACCTATGAATTGACAGCC mmu-mir-98-5p F TGAGGTAGTAAGTTGTATTGTT mmu-mir-3c-5p F TGTAAACATCCTACACTCTCAGC mmu-mir-5-5p F ATGACCTATGATTTGACAGAC mmu-mir--3p F TAACAGTCTCCAGTCACGGCCA mmu-mir--3p F AGCTACATTGTCTGCTGGGTTTC mmu-mir-a-5p F TAAAGTGCTTATAGTGCAGGTAG mmu-mir-8a-5p F AACATTCAACGCTGTCGGTGAGT mmu-mir-79 F GGAGGCAGAGGCAGGAGGA mmu-mir-484 F TCAGGCTCAGTCCCCTCCCGAT mmu-mir-8a-5p F TAAGGTGCATCTAGTGCAGATAG mmu-mir-8b-5p F AACATTCATTGCTGTCGGTGGGT mmu-mir-65-3p F AATGGCGCCACTAGGGTTGTG mmu-mir-34a-5p F TGGCAGTGTCTTAGCTGGTTGT
14 mmu-mir-c-5p F CGTCTTACCCAGCAGTGTTTGG mmu-mir-375-3p F TTTGTTCGTTCGGCTCGCGTGA mmu-mir-7-5p F CTCCTTCACCCGGGCGGTACC mmu-mir-345-5p F GCTGACCCCTAGTCCAGTGCTT mmu-mir-5-3p F TCAGTGCATGACAGAACTTGG mmu-mir--5p F AACCCGTAGATCCGAACTTGTG Muc F GACCTGACAATGTGCCCAGA Muc R GGCAAACACAGTCCTTGCAG Lgr5 F CTGCCCATCACACTGTCACT Lgr5 R GCAGAGGCGATGTAGGAGAC
Serum mirna signature diagnoses and discriminates murine colitis subtypes and predicts ulcerative colitis in humans
 Serum mirna signature diagnoses and discriminates murine colitis subtypes and predicts ulcerative colitis in humans Emilie Viennois 1*, Yuan Zhao 1, 2, Moon Kwon Han 1, Bo Xiao 1, 3, Mingzhen Zhang 1,
SUPPLEMENTARY INFORMATION
 DOI:.38/ncb3399 a b c d FSP DAPI 5mm mm 5mm 5mm e Correspond to melanoma in-situ Figure a DCT FSP- f MITF mm mm MlanaA melanoma in-situ DCT 5mm FSP- mm mm mm mm mm g melanoma in-situ MITF MlanaA mm mm
Supplementary Figure 1: Hsp60 / IEC mice are embryonically lethal (A) Light microscopic pictures show mouse embryos at developmental stage E12.
 Light microscopic pictures show mouse embryos at developmental stage E12.") Supplementary Figure 1: Hsp60 / IEC mice are embryonically lethal (A) Light microscopic pictures show mouse embryos at developmental stage E12.5 and E13.5 prepared from uteri of dams and subsequently genotyped.
Supplementary Figure 1: Hsp60 / IEC mice are embryonically lethal (A) Light microscopic pictures show mouse embryos at developmental stage E12.5 and E13.5 prepared from uteri of dams and subsequently genotyped.
ROCK/Cdc42-mediated microglial motility and gliapse formation lead to phagocytosis of degenerating dopaminergic neurons in vivo
 Supplementary Information ROCK/Cdc42-mediated microglial motility and gliapse formation lead to phagocytosis of degenerating dopaminergic neurons in vivo Carlos Barcia* 1,2, Carmen M Ros 1,2, Valentina
SUPPLEMENTARY INFORMATION
 DOI: 10.1038/ncb2211 a! mir-143! b! mir-103/107! let-7a! mir-144! mir-122a! mir-126-3p! mir-194! mir-27a! mir-30c! Figure S1 Northern blot analysis of mir-143 expression dependent on feeding conditions.
Supplemental Table 1. Primers used for RT-PCR analysis of inflammatory cytokines Gene Primer Sequence
 Supplemental Table 1. Primers used for RT-PCR analysis of inflammatory cytokines Gene Primer Sequence IL-1α Forward primer 5 -CAAGATGGCCAAAGTTCGTGAC-3' Reverse primer 5 -GTCTCATGAAGTGAGCCATAGC-3 IL-1β
Supplementary Fig. S1. Schematic diagram of minigenome segments.
 open reading frame 1565 (segment 5) 47 (-) 3 5 (+) 76 101 125 149 173 197 221 246 287 open reading frame 890 (segment 8) 60 (-) 3 5 (+) 172 Supplementary Fig. S1. Schematic diagram of minigenome segments.
Supporting Information
 Supporting Information M1 macrophage-derived nanovesicles potentiate the anticancer efficacy of immune checkpoint inhibitors Yeon Woong Choo, 1, Mikyung Kang, 2, Han Young Kim, 1 Jin Han, 1 Seokyung Kang,
F-actin VWF Vinculin. F-actin. Vinculin VWF
 a F-actin VWF Vinculin b F-actin VWF Vinculin Supplementary Fig. 1. WPBs in HUVECs are located along stress fibers and at focal adhesions. (a) Immunofluorescence images of f-actin (cyan), VWF (yellow),
Santulli G. et al. A microrna-based strategy to suppress restenosis while preserving endothelial function
 ONLINE DATA SUPPLEMENTS Santulli G. et al. A microrna-based strategy to suppress restenosis while preserving endothelial function Supplementary Figures Figure S1 Effect of Ad-p27-126TS on the expression
Figure S1. Reduction in glomerular mir-146a levels correlate with progression to higher albuminuria in diabetic patients.
 Supplementary Materials Supplementary Figures Figure S1. Reduction in glomerular mir-146a levels correlate with progression to higher albuminuria in diabetic patients. Figure S2. Expression level of podocyte
Suppl Video: Tumor cells (green) and monocytes (white) are seeded on a confluent endothelial
 and monocytes (white) are seeded on a confluent endothelial") Supplementary Information Häuselmann et al. Monocyte induction of E-selectin-mediated endothelial activation releases VE-cadherin junctions to promote tumor cell extravasation in the metastasis cascade
Supplementary Information Häuselmann et al. Monocyte induction of E-selectin-mediated endothelial activation releases VE-cadherin junctions to promote tumor cell extravasation in the metastasis cascade
Supplementary Figure 1.TRIM33 binds β-catenin in the nucleus. a & b, Co-IP of endogenous TRIM33 with β-catenin in HT-29 cells (a) and HEK 293T cells
 and HEK 293T cells") Supplementary Figure 1.TRIM33 binds β-catenin in the nucleus. a & b, Co-IP of endogenous TRIM33 with β-catenin in HT-29 cells (a) and HEK 293T cells (b). TRIM33 was immunoprecipitated, and the amount of
Supplementary Figure 1.TRIM33 binds β-catenin in the nucleus. a & b, Co-IP of endogenous TRIM33 with β-catenin in HT-29 cells (a) and HEK 293T cells (b). TRIM33 was immunoprecipitated, and the amount of
Genotype analysis by Southern blots of nine independent recombinated ES cell clones by
 Supplemental Figure 1 Selected ES cell clones show a correctly recombined conditional Ngn3 allele Genotype analysis by Southern blots of nine independent recombinated ES cell clones by hybridization with
MII. Supplement Figure 1. CapZ β2. Merge. 250ng. 500ng DIC. Merge. Journal of Cell Science Supplementary Material. GFP-CapZ β2 DNA
 A GV GVBD MI DNA CapZ β2 CapZ β2 Merge B DIC GFP-CapZ β2 Merge CapZ β2-gfp 250ng 500ng Supplement Figure 1. MII A early MI late MI Control RNAi CapZαβ DNA Actin Tubulin B Phalloidin Intensity(A.U.) n=10
Supplementary Figure 1. Confocal immunofluorescence showing mitochondrial translocation of Drp1. Cardiomyocytes treated with H 2 O 2 were prestained
 Supplementary Figure 1. Confocal immunofluorescence showing mitochondrial translocation of Drp1. Cardiomyocytes treated with H 2 O 2 were prestained with MitoTracker (red), then were immunostained with
TRAF6 ubiquitinates TGFβ type I receptor to promote its cleavage and nuclear translocation in cancer
 Supplementary Information TRAF6 ubiquitinates TGFβ type I receptor to promote its cleavage and nuclear translocation in cancer Yabing Mu, Reshma Sundar, Noopur Thakur, Maria Ekman, Shyam Kumar Gudey, Mariya
Supplemental Information. Metabolic Maturation during Muscle Stem Cell. Differentiation Is Achieved by mir-1/133a-mediated
 Cell Metabolism, Volume 27 Supplemental Information Metabolic Maturation during Muscle Stem Cell Differentiation Is Achieved by mir-1/133a-mediated Inhibition of the Dlk1-Dio3 Mega Gene Cluster Stas Wüst,
Supplementary Material
 Supplementary Material Summary: The supplementary information includes 1 table (Table S1) and 4 figures (Figure S1 to S4). Supplementary Figure Legends Figure S1 RTL-bearing nude mouse model. (A) Tumor
Supplemental Materials. STK16 regulates actin dynamics to control Golgi organization and cell cycle
 Supplemental Materials STK16 regulates actin dynamics to control Golgi organization and cell cycle Juanjuan Liu 1,2,3, Xingxing Yang 1,3, Binhua Li 1, Junjun Wang 1,2, Wenchao Wang 1, Jing Liu 1, Qingsong
Supplementary Figure 1: Co-localization of reconstituted L-PTC and dendritic cells
 a CD11c Na + K + ATPase Na + K + ATPase CD11c x-y CD11c Na + K + ATPase Na + K + ATPase CD11c x-z c b x-y view BoNT NAPs CD11c BoNT CD11c NAPs BoNT NAPs CD11c 90 x-z view Apical Basolateral Supplementary
mir-7a regulation of Pax6 in neural stem cells controls the spatial origin of forebrain dopaminergic neurons
 Supplemental Material mir-7a regulation of Pax6 in neural stem cells controls the spatial origin of forebrain dopaminergic neurons Antoine de Chevigny, Nathalie Coré, Philipp Follert, Marion Gaudin, Pascal
Supplementary Figure 1: si-craf but not si-braf sensitizes tumor cells to radiation.
 Supplementary Figure 1: si-craf but not si-braf sensitizes tumor cells to radiation. (a) Embryonic fibroblasts isolated from wildtype (WT), BRAF -/-, or CRAF -/- mice were irradiated (6 Gy) and DNA damage
SUPPLEMENTARY INFORMATION
 b 350 300 250 200 150 100 50 0 E0 E10 E50 E0 E10 E50 E0 E10 E50 E0 E10 E50 Number of organoids per well 350 300 250 200 150 100 50 0 R0 R50 R100 R500 1st 2nd 3rd Noggin 100 ng/ml Noggin 10 ng/ml Noggin
Supplementary Figure 1. SA-β-Gal positive senescent cells in various cancer tissues. Representative frozen sections of breast, thyroid, colon and
 Supplementary Figure 1. SA-β-Gal positive senescent cells in various cancer tissues. Representative frozen sections of breast, thyroid, colon and stomach cancer were stained with SA-β-Gal and nuclear fast
(A) Cells grown in monolayer were fixed and stained for surfactant protein-c (SPC,
 Cells grown in monolayer were fixed and stained for surfactant protein-c (SPC,") Supplemental Figure Legends Figure S1. Cell line characterization (A) Cells grown in monolayer were fixed and stained for surfactant protein-c (SPC, green) and co-stained with DAPI to visualize the nuclei.
Supplemental Figure Legends Figure S1. Cell line characterization (A) Cells grown in monolayer were fixed and stained for surfactant protein-c (SPC, green) and co-stained with DAPI to visualize the nuclei.
Table S1. Primers used to quantitatively amplify the human mirnas precursors and indicated genes
 Table S1. Primers used to quantitatively amplify the human mirnas precursors and indicated genes Forward primer (5 3 ) Rervese primer (5 3 ) U6 CTCGCTTCGGCAGCACA AACGCTTCACGAATTTGCGT 5S TACGGCCATACCACCCTGAA
Supplemental Figure 1: Lrig1-Apple expression in small intestine. Lrig1-Apple is observed at the crypt base and in insterstial cells of Cajal, but is
 Supplemental Figure 1: Lrig1-Apple expression in small intestine. Lrig1-Apple is observed at the crypt base and in insterstial cells of Cajal, but is not co-expressed in DCLK1-positive tuft cells. Scale
SUPPLEMENTARY INFORMATION
 doi:10.1038/nature12652 Supplementary Figure 1. PRDM16 interacts with endogenous EHMT1 in brown adipocytes. Immunoprecipitation of PRDM16 complex by flag antibody (M2) followed by Western blot analysis
Supplementary Table 1. List of primers used in this study
 Supplementary Table 1. List of primers used in this study Gene Forward primer Reverse primer Rat Met 5 -aggtcgcttcatgcaggt-3 5 -tccggagacacaggatgg-3 Rat Runx1 5 -cctccttgaaccactccact-3 5 -ctggatctgcctggcatc-3
X P. Supplementary Figure 1. Nature Medicine: doi: /nm Nilotinib LSK LT-HSC. Cytoplasm. Cytoplasm. Nucleus. Nucleus
 a b c Supplementary Figure 1 c-kit-apc-eflu780 Lin-FITC Flt3-Linc-Kit-APC-eflu780 LSK Sca-1-PE-Cy7 d e f CD48-APC LT-HSC CD150-PerCP-cy5.5 g h i j Cytoplasm RCC1 X Exp 5 mir 126 SPRED1 SPRED1 RAN P SPRED1
Supplementary Figures
 Supplementary Figures Supplementary Figure 1 Characterization of stable expression of GlucB and sshbira in the CT26 cell line (a) Live cell imaging of stable CT26 cells expressing green fluorescent protein
Figure SⅠ: Expression of mir-155, mir-122 and mir-196a in allografts compared with
 Figure SⅠ: Expression of mir-155, mir-122 and mir-196a in allografts compared with isografts (control) at the 2nd week, 4th and 8th week by RT-PCR. At the advanced stage, the expression of these three
SUPPLEMENTARY INFORMATION
 DOI: 10.1038/ncb2607 Figure S1 Elf5 loss promotes EMT in mammary epithelium while Elf5 overexpression inhibits TGFβ induced EMT. (a, c) Different confocal slices through the Z stack image. (b, d) 3D rendering
TEB. Id4 p63 DAPI Merge. Id4 CK8 DAPI Merge
 a Duct TEB b Id4 p63 DAPI Merge Id4 CK8 DAPI Merge c d e Supplementary Figure 1. Identification of Id4-positive MECs and characterization of the Comma-D model. (a) IHC analysis of ID4 expression in the
Relative SOD1 activity. Relative SOD2 activity. Relative SOD activity (Infected:Mock) + CP + DDC
 + CP + DDC") Supplementary Figure 1. SOD1 activity is significantly increased relative to SOD1 levels. SOD1 and SOD2 activities in the infected mork13 cells are shown normalised to their corresponding levels and relative
Supplementary Figure 1. SOD1 activity is significantly increased relative to SOD1 levels. SOD1 and SOD2 activities in the infected mork13 cells are shown normalised to their corresponding levels and relative
Supplementary Figure 1: Expression of Gli1-lacZ in E17.5 ovary and mesonephros. a,
 Supplementary Figure 1: Expression of Gli1-lacZ in E17.5 ovary and mesonephros. a, Transverse sections of E17.5 ovary and mesonephros from Gli1-LacZ reporter embryos (n=3) after LacZ staining (blue). The
Lentiviral Delivery of Combinatorial mirna Expression Constructs Provides Efficient Target Gene Repression.
 Supplementary Figure 1 Lentiviral Delivery of Combinatorial mirna Expression Constructs Provides Efficient Target Gene Repression. a, Design for lentiviral combinatorial mirna expression and sensor constructs.
Supplementary Figure 1
 A B D Relative TAp73 mrna p73 Supplementary Figure 1 25 2 15 1 5 p63 _-tub. MDA-468 HCC1143 HCC38 SUM149 MDA-468 HCC1143 HCC38 SUM149 HCC-1937 MDA-MB-468 ΔNp63_ TAp73_ TAp73β E C Relative ΔNp63 mrna TAp73
Supplementary Figure 1. H-PGDS deficiency does not affect GI tract functions and anaphylactic reaction. (a) Representative pictures of H&E-stained
 Representative pictures of H&E-stained") 1 2 3 4 5 6 7 8 9 10 11 Supplementary Figure 1. H-PGDS deficiency does not affect GI tract functions and anaphylactic reaction. (a) Representative pictures of H&E-stained jejunum sections ( 200 magnification;
1 2 3 4 5 6 7 8 9 10 11 Supplementary Figure 1. H-PGDS deficiency does not affect GI tract functions and anaphylactic reaction. (a) Representative pictures of H&E-stained jejunum sections ( 200 magnification;
Supplementary Figure 1
 Supplementary Figure 1 14 12 SEM4C PLXN2 8 SEM4C C 3 Cancer Cell Non Cancer Cell Expression 1 8 6 6 4 log2 ratio Expression 2 1 4 2 2 p value.1 D Supplementary Figure 1. Expression of Sema4C and Plexin2
Supplementary Figure 1
 Supplementary Figure 1 A B mir-141, human cell lines mir-2c, human cell lines mir-141, hepatocytes mir-2c, hepatocytes Relative RNA.1.8.6.4.2 Relative RNA.3.2.1 Relative RNA 1.5 1..5 Relative RNA 2. 1.5
Supplementary Table 1. The primers used for quantitative RT-PCR. Gene name Forward (5 > 3 ) Reverse (5 > 3 )
 Reverse (5 > 3 )") 770 771 Supplementary Table 1. The primers used for quantitative RT-PCR. Gene name Forward (5 > 3 ) Reverse (5 > 3 ) Human CXCL1 GCGCCCAAACCGAAGTCATA ATGGGGGATGCAGGATTGAG PF4 CCCCACTGCCCAACTGATAG TTCTTGTACAGCGGGGCTTG
770 771 Supplementary Table 1. The primers used for quantitative RT-PCR. Gene name Forward (5 > 3 ) Reverse (5 > 3 ) Human CXCL1 GCGCCCAAACCGAAGTCATA ATGGGGGATGCAGGATTGAG PF4 CCCCACTGCCCAACTGATAG TTCTTGTACAGCGGGGCTTG
Supplementary Materials for
 www.sciencesignaling.org/cgi/content/full/2/1/ra81/dc1 Supplementary Materials for Delivery of MicroRNA-126 by Apoptotic Bodies Induces CXCL12- Dependent Vascular Protection Alma Zernecke,* Kiril Bidzhekov,
T H E J O U R N A L O F C E L L B I O L O G Y
 Supplemental material Díaz et al., http://www.jcb.org/cgi/content/full/jcb.201209151/dc1 T H E J O U R N A L O F C E L L B I O L O G Y Figure S1. Hypoxia induces invadopodia formation in different epithelial
Social deficits in Shank3-deficient mouse models of autism are rescued by histone deacetylase (HDAC) inhibition
 inhibition") SUPPLEMENTARY INFORMATION Articles https://doi.org/10.1038/s41593-018-0110-8 In the format provided by the authors and unedited. Social deficits in Shank3-deficient mouse models of autism are rescued by
SUPPLEMENTARY INFORMATION Articles https://doi.org/10.1038/s41593-018-0110-8 In the format provided by the authors and unedited. Social deficits in Shank3-deficient mouse models of autism are rescued by
Supplementary Information
 Supplementary Information GADD34-deficient mice develop obesity, nonalcoholic fatty liver disease, hepatic carcinoma and insulin resistance Naomi Nishio and Ken-ichi Isobe Department of Immunology, Nagoya
Supplementary materials and methods.
 Supplementary materials and methods. Microarray printing and data analysis. The LNA-modified oligonucleotide probe set for all annotated mirnas from mouse (Mus musculus) and human (Homo sapiens) in the
Supplementary Materials for
 www.sciencesignaling.org/cgi/content/full/7/310/ra11/dc1 Supplementary Materials for STAT3 Induction of mir-146b Forms a Feedback Loop to Inhibit the NF-κB to IL-6 Signaling Axis and STAT3-Driven Cancer
Supplementary Figure 1: Experimental design. DISCOVERY PHASE VALIDATION PHASE (N = 88) (N = 20) Healthy = 20. Healthy = 6. Endometriosis = 33
 (N = 20) Healthy = 20. Healthy = 6. Endometriosis = 33") DISCOVERY PHASE (N = 20) Healthy = 6 Endometriosis = 7 EAOC = 7 Quantitative PCR (mirnas = 1113) a Quantitative PCR Verification of Candidate mirnas (N = 24) VALIDATION PHASE (N = 88) Healthy = 20 Endometriosis
DISCOVERY PHASE (N = 20) Healthy = 6 Endometriosis = 7 EAOC = 7 Quantitative PCR (mirnas = 1113) a Quantitative PCR Verification of Candidate mirnas (N = 24) VALIDATION PHASE (N = 88) Healthy = 20 Endometriosis
Supplementary Materials for
 www.sciencetranslationalmedicine.org/cgi/content/full/4/117/117ra8/dc1 Supplementary Materials for Notch4 Normalization Reduces Blood Vessel Size in Arteriovenous Malformations Patrick A. Murphy, Tyson
Supplementary Figure 1 IMQ-Induced Mouse Model of Psoriasis. IMQ cream was
 Supplementary Figure 1 IMQ-Induced Mouse Model of Psoriasis. IMQ cream was painted on the shaved back skin of CBL/J and BALB/c mice for consecutive days. (a, b) Phenotypic presentation of mouse back skin
Supplementary Figure 1
 Combination index (CI) Supplementary Figure 1 2. 1.5 1. Ishikawa AN3CA Nou-1 Hec-18.5...2.4.6.8 1. Fraction affected (Fa) Supplementary Figure 1. The synergistic effect of PARP inhibitor and PI3K inhibitor
Downregulation of the small GTPase SAR1A: a key event underlying alcohol-induced Golgi fragmentation in hepatocytes
 Downregulation of the small GTPase SAR1A: a key event underlying alcohol-induced Golgi fragmentation in hepatocytes Armen Petrosyan 1*, Pi-Wan Cheng 1,3, Dahn L. Clemens 2,3 & Carol A. Casey 2,3 1 Department
Supplemental Figures Supplemental Figure 1:
 Supplemental Figures Supplemental Figure 1: Representative FACS data showing Concurrent Brain cell type Acquisition using either Percoll PLUS (top row) or myelin removal beads (bottom two rows). Debris
Supplementary Figure 1. Electroporation of a stable form of β-catenin causes masses protruding into the IV ventricle. HH12 chicken embryos were
 Supplementary Figure 1. Electroporation of a stable form of β-catenin causes masses protruding into the IV ventricle. HH12 chicken embryos were electroporated with β- Catenin S33Y in PiggyBac expression
JCB. Supplemental material. Gu et al.,
 Supplemental material Gu et al., http://www.jcb.org/cgi/content/full/jcb.201010075/dc1 T H E J O U R N A L O F C E L L B I O L O G Y Figure S1. S1P directly induces actin assembly. Actin assembly at the
SUPPLEMENTARY INFORMATION
 Supplemental Figure 1. Furin is efficiently deleted in CD4 + and CD8 + T cells. a, Western blot for furin and actin proteins in CD4cre-fur f/f and fur f/f Th1 cells. Wild-type and furin-deficient CD4 +
SUPPLEMENTARY INFORMATION
 -. -. SUPPLEMENTARY INFORMATION DOI: 1.1/ncb86 a WAT-1 WAT- BAT-1 BAT- sk-muscle-1 sk-muscle- mir-133b mir-133a mir-6 mir-378 mir-1 mir-85 mir-378 mir-6a mir-18 mir-133a mir- mir- mir-341 mir-196a mir-17
SUPPLEMENTARY LEGENDS...
 TABLE OF CONTENTS SUPPLEMENTARY LEGENDS... 2 11 MOVIE S1... 2 FIGURE S1 LEGEND... 3 FIGURE S2 LEGEND... 4 FIGURE S3 LEGEND... 5 FIGURE S4 LEGEND... 6 FIGURE S5 LEGEND... 7 FIGURE S6 LEGEND... 8 FIGURE
Supplementary Materials for
 www.sciencesignaling.org/cgi/content/full/8/375/ra41/dc1 Supplementary Materials for Actin cytoskeletal remodeling with protrusion formation is essential for heart regeneration in Hippo-deficient mice
Supplementary legends
 Supplementary legends Supplemental figure S1. Apelin-TAMRA is functional and induces apelin receptor internalization. HEK-293T cells transiently expressing YFP tagged APJ were incubated for 1 hour with:
Supplementary information
 Supplementary information Human Cytomegalovirus MicroRNA mir-us4-1 Inhibits CD8 + T Cell Response by Targeting ERAP1 Sungchul Kim, Sanghyun Lee, Jinwook Shin, Youngkyun Kim, Irini Evnouchidou, Donghyun
A Normal Exencephaly Craniora- Spina bifida Microcephaly chischisis. Midbrain Forebrain/ Forebrain/ Hindbrain Spinal cord Hindbrain Hindbrain
 A Normal Exencephaly Craniora- Spina bifida Microcephaly chischisis NTD Number of embryos % among NTD Embryos Exencephaly 52 74.3% Craniorachischisis 6 8.6% Spina bifida 5 7.1% Microcephaly 7 1% B Normal
High Fat Diets Induce Colonic Epithelial Cell Stress and Inflammation that is Reversed by IL-22
 Supplementary Information High Fat Diets Induce Colonic Epithelial Cell Stress and Inflammation that is Reversed by IL-22 Max Gulhane 1, Lydia Murray 1, Rohan Lourie 1, Hui Tong 1, Yong H. Sheng 1, Ran
The antibodies against 5-bromo-2 -deoxyuridine specifically recognize
 Supplementary information for The antibodies against 5-bromo-2 -deoxyuridine specifically recognize trifluridine incorporated into DNA Hiroyuki Kitao *, Yosuke Morodomi, Shinichiro Niimi, Mamoru Kiniwa,
Department of Pharmaceutical Sciences, School of Pharmacy, Northeastern University, Boston, MA 02115, USA 2
 Pancreatic Cancer Cell Exosome-Mediated Macrophage Reprogramming and the Role of MicroRNAs 155 and 125b2 Transfection using Nanoparticle Delivery Systems Mei-Ju Su 1, Hibah Aldawsari 2, and Mansoor Amiji
Loss of RhoA promotes skin tumor formation. Supplementary Figure 1. Loss of RhoA does not impair F-actin organization.
 Supplementary Figure Legends Supplementary Figure 1. Loss of RhoA does not impair F-actin organization. a. Representative IF images of F-actin staining of big and small control (left) and RhoA ko tumors
The Role of MicroRNAs in NEC Misty Good, MD
 The Role of MicroRNAs in NEC Misty Good, MD Neonatologist, Assistant Professor of Pediatrics Division of Newborn Medicine, Children s Hospital of Pittsburgh Department of Pediatrics, University of Pittsburgh
SUPPLEMENTARY MATERIAL
 SYPPLEMENTARY FIGURE LEGENDS SUPPLEMENTARY MATERIAL Figure S1. Phylogenic studies of the mir-183/96/182 cluster and 3 -UTR of Casp2. (A) Genomic arrangement of the mir-183/96/182 cluster in vertebrates.
a. b. c. d. e. f. g. h. i. j. k. l. m. n. o. p.
 a. b. c. d. e. f. g. h. i. j. k. l. 2.5 2 1.5 1.5 IL-1β 12 8 6 4 2 IL-1β 9 8 7 6 4 3 3 2.9 IL-1β m. n. o. p. 1.8 1.6 1.4 1.2 1.8.6.4.2 6h LPS 2 15 1 5 6h LPS 2 6h LPS 6 4 3 6h LPS Supplementary Figure
PKCζ Promotes Breast Cancer Invasion by Regulating Expression of E-cadherin and Zonula Occludens-1 (ZO-1) via NFκB-p65
 via NFκB-p65") SUPPLEMENTARY INFORMATION TITLE: PKCζ Promotes Breast Cancer Invasion by Regulating Expression of E-cadherin and Zonula Occludens-1 (ZO-1) via NFκB-p65 RUNNING TITLE: PKCζ-NFκB Signaling in Breast Cancer
SUPPLEMENTARY INFORMATION TITLE: PKCζ Promotes Breast Cancer Invasion by Regulating Expression of E-cadherin and Zonula Occludens-1 (ZO-1) via NFκB-p65 RUNNING TITLE: PKCζ-NFκB Signaling in Breast Cancer
SUPPLEMENTARY INFORMATION
 doi:10.1038/nature10188 Supplementary Figure 1. Embryonic epicardial genes are down-regulated from midgestation stages and barely detectable post-natally. Real time qrt-pcr revealed a significant down-regulation
Supplementary Figure 1. Expression of phospho-sik3 in normal and osteoarthritic articular cartilage in the knee. (a) Semiserial histological sections
 Semiserial histological sections") Supplementary Figure 1. Expression of phospho-sik3 in normal and osteoarthritic articular cartilage in the knee. (a) Semiserial histological sections of normal cartilage were stained with safranin O-fast
Supplementary Figure 1. Expression of phospho-sik3 in normal and osteoarthritic articular cartilage in the knee. (a) Semiserial histological sections of normal cartilage were stained with safranin O-fast
Nature Immunology: doi: /ni Supplementary Figure 1. Gene expression profile of CD4 + T cells and CTL responses in Bcl6-deficient mice.
 Supplementary Figure 1 Gene expression profile of CD4 + T cells and CTL responses in Bcl6-deficient mice. (a) Gene expression profile in the resting CD4 + T cells were analyzed by an Affymetrix microarray
Nature Medicine: doi: /nm.4322
 1 2 3 4 5 6 7 8 9 10 11 Supplementary Figure 1. Predicted RNA structure of 3 UTR and sequence alignment of deleted nucleotides. (a) Predicted RNA secondary structure of ZIKV 3 UTR. The stem-loop structure
Nature Structural & Molecular Biology: doi: /nsmb Supplementary Figure 1. Differential expression of mirnas from the pri-mir-17-92a locus.
 Supplementary Figure 1 Differential expression of mirnas from the pri-mir-17-92a locus. (a) The mir-17-92a expression unit in the third intron of the host mir-17hg transcript. (b,c) Impact of knockdown
Supplementary Figures
 Supplementary Figures Supplementary Figure 1. Confirmation of Dnmt1 conditional knockout out mice. a, Representative images of sorted stem (Lin - CD49f high CD24 + ), luminal (Lin - CD49f low CD24 + )
SUPPLEMENTARY INFORMATION
 doi:1.138/nature1554 a TNF-α + in CD4 + cells [%] 1 GF SPF 6 b IL-1 + in CD4 + cells [%] 5 4 3 2 1 Supplementary Figure 1. Effect of microbiota on cytokine profiles of T cells in GALT. Frequencies of TNF-α
Supplementary Materials and Methods
 Supplementary Materials and Methods Hepatocyte toxicity assay. Freshly isolated hepatocytes were incubated for overnight with varying concentrations (-25 µm) of sodium glycochenodeoxycholate (GCDC) or
Supplementary Figure 1. IDH1 and IDH2 mutation site sequences on WHO grade III
 Supplementary Materials: Supplementary Figure 1. IDH1 and IDH2 mutation site sequences on WHO grade III patient samples. Genomic DNA samples extracted from punch biopsies from either FFPE or frozen tumor
SUPPLEMENTARY INFORMATION
 DOI: 10.1038/ncb2638 Figure S1 Morphological characteristics of fetal testes and ovaries from 6.5-20 developmental weeks. Representative images of Hematoxylin and Eosin staining of testes and ovaries over
T H E J O U R N A L O F C E L L B I O L O G Y
 T H E J O U R N A L O F C E L L B I O L O G Y Supplemental material Amelio et al., http://www.jcb.org/cgi/content/full/jcb.201203134/dc1 Figure S1. mir-24 regulates proliferation and by itself induces
The subcortical maternal complex controls symmetric division of mouse zygotes by
 The subcortical maternal complex controls symmetric division of mouse zygotes by regulating F-actin dynamics Xing-Jiang Yu 1,2, Zhaohong Yi 1, Zheng Gao 1,2, Dan-dan Qin 1,2, Yanhua Zhai 1, Xue Chen 1,
Supplemental Table S1
 Supplemental Table S. Tumorigenicity and metastatic potential of 44SQ cell subpopulations a Tumorigenicity b Average tumor volume (mm ) c Lung metastasis d CD high /4 8. 8/ CD low /4 6./ a Mice were injected
Figure S1. (A) Schematic diagram of dnrar transgene allele. (B) X-Gal staining of testis from
 Schematic diagram of dnrar transgene allele. (B) X-Gal staining of testis from") Figure S1. (A) Schematic diagram of dnrar transgene allele. (B) X-Gal staining of testis from germ cell mutants (dnrar flox/flox, Stra8-Cre +, RARElacZ) (A ), controls (dnrar flox/flox, RARElacZ) (B ),
Figure S1. (A) Schematic diagram of dnrar transgene allele. (B) X-Gal staining of testis from germ cell mutants (dnrar flox/flox, Stra8-Cre +, RARElacZ) (A ), controls (dnrar flox/flox, RARElacZ) (B ),
Balancing intestinal and systemic inflammation through cell type-specific expression of
 Supplementary Information Balancing intestinal and systemic inflammation through cell type-specific expression of the aryl hydrocarbon receptor repressor Olga Brandstätter 1,2,6, Oliver Schanz 1,6, Julia
Supplemental Figures
 Supplemental Figures Supplemental Figure 1. Fasting-dependent regulation of the SREBP ortholog SBP-1 and lipid homeostasis mediated by the SIRT1 ortholog SIR-2.1 in C. elegans. (A) Wild-type or sir-2.1(lof)
Supplementary Figure 1. Deletion of Smad3 prevents B16F10 melanoma invasion and metastasis in a mouse s.c. tumor model.
 A B16F1 s.c. Lung LN Distant lymph nodes Colon B B16F1 s.c. Supplementary Figure 1. Deletion of Smad3 prevents B16F1 melanoma invasion and metastasis in a mouse s.c. tumor model. Highly invasive growth
Adaptor protein complexes-1 and 3 are involved at distinct stages of flavivirus
 SUPPLETARY INFORATION Adaptor protein complexes-1 and 3 are involved at distinct stages of flavivirus life-cycle Tanvi Agrawal, 1 Peter Schu 2 and Guruprasad R. edigeshi 1* 1 accine and Infectious isease
Nature Methods: doi: /nmeth Supplementary Figure 1
 Supplementary Figure 1 Finite-element analysis of cell cluster dynamics in different cluster trap architectures. (a) Cluster-Chip (b) Filter (c) A structure identical to the Cluster-Chip except that one
Gallic acid prevents isoproterenol-induced cardiac hypertrophy and fibrosis through regulation of JNK2 signaling and Smad3 binding activity
 Gallic acid prevents isoproterenol-induced cardiac hypertrophy and fibrosis through regulation of JNK2 signaling and Smad3 binding activity Yuhee Ryu 1,+, Li Jin 1,2+, Hae Jin Kee 1,, Zhe Hao Piao 3, Jae
Supplemental Figure 1. (A) The localization of Cre DNA recombinase in the testis of Cyp19a1-Cre mice was detected by immunohistchemical analyses
 The localization of Cre DNA recombinase in the testis of Cyp19a1-Cre mice was detected by immunohistchemical analyses") Supplemental Figure 1. (A) The localization of Cre DNA recombinase in the testis of Cyp19a1-Cre mice was detected by immunohistchemical analyses using an anti-cre antibody; testes at 1 week (left panel),
Supplemental Figure 1. (A) The localization of Cre DNA recombinase in the testis of Cyp19a1-Cre mice was detected by immunohistchemical analyses using an anti-cre antibody; testes at 1 week (left panel),
Effects of UBL5 knockdown on cell cycle distribution and sister chromatid cohesion
 Supplementary Figure S1. Effects of UBL5 knockdown on cell cycle distribution and sister chromatid cohesion A. Representative examples of flow cytometry profiles of HeLa cells transfected with indicated
Rescue of mutant rhodopsin traffic by metformin-induced AMPK activation accelerates photoreceptor degeneration Athanasiou et al
 Supplementary Material Rescue of mutant rhodopsin traffic by metformin-induced AMPK activation accelerates photoreceptor degeneration Athanasiou et al Supplementary Figure 1. AICAR improves P23H rod opsin
Selective filtering defect at the axon initial segment in Alzheimer s disease mouse models. Yu Wu
 Selective filtering defect at the axon initial segment in Alzheimer s disease mouse models Yu Wu Alzheimer s Disease (AD) Mouse models: APP/PS1, PS1δE9, APPswe, hps1 Wirths, O. et al, Acta neuropathologica
Supplementary Figure 1.
 Supplementary Figure 1. Visualization of endoplasmic reticulum-mitochondria interaction by in situ proximity ligation assay. A) Illustration of targeted proteins in mitochondria (M), endoplasmic reticulum
Title page. Title: MicroRNA-155 Controls Exosome Synthesis and Promotes Gemcitabine Resistance in
 Title page Title: MicroRNA- Controls Synthesis and Promotes Gemcitabine Resistance in Pancreatic Ductal Adenocarcinoma Authors Manabu Mikamori, Daisaku Yamada, Hidetoshi Eguchi, Shinichiro Hasegawa, Tomoya
(A) RT-PCR for components of the Shh/Gli pathway in normal fetus cell (MRC-5) and a
 RT-PCR for components of the Shh/Gli pathway in normal fetus cell (MRC-5) and a") Supplementary figure legends Supplementary Figure 1. Expression of Shh signaling components in a panel of gastric cancer. (A) RT-PCR for components of the Shh/Gli pathway in normal fetus cell (MRC-5) and
Supplementary figure legends Supplementary Figure 1. Expression of Shh signaling components in a panel of gastric cancer. (A) RT-PCR for components of the Shh/Gli pathway in normal fetus cell (MRC-5) and
Title: Vectorization of biomacromolecules into cells using extracellular vesicles with enhanced internalization induced by macropinocytosis
 Scientific Reports Supplementary information Title: Vectorization of biomacromolecules into cells using extracellular vesicles with enhanced internalization induced by macropinocytosis Authors: Ikuhiko