Supplementary Fig. S1. Schematic diagram of minigenome segments.
|
|
|
- Jasmine Wright
- 5 years ago
- Views:
Transcription
1 open reading frame 1565 (segment 5) 47 (-) 3 5 (+) open reading frame 890 (segment 8) 60 (-) 3 5 (+) 172 Supplementary Fig. S1. Schematic diagram of minigenome segments. Plasmids expressing short virus-like RNA genome segments were constructed by internal deletions of the non-coding regions and/or the open reading frames of segment 5 and segment 8. Each construct was designed to be approximately 24 nucleotides longer than the previous, representing the number of nucleotides believed to be associated with NP in the RNP structure. Sizes of the vrnas are shown in nucleotides. Arrows indicate the approximate positions for binding of the primers to negative (above) and positive (below) sense RNAs during primer extension assays (see Supplementary Table S1). = non-coding region.
2 pcdna-px pcdna-np vrna mrna 5S rrna pcdna-np mrna Relative RNA level (cf. 1µg NP) Supplementary Fig. S2. Replication and transcription of short vrna-like gene segments in vivo is sensitive to the concentration of NP. Primer extension analysis of the accumulation of vrna and mrna following in vivo reconstitution of vrnps from the 76 nucleotide long vrnalike template in the presence of varying concentrations of polymerase and NP. The indicated amount in µg of each of the polymerase subunit-expressing plasmids (pcdna-px) and 0.5µg of the plasmid expressing the 76 nucleotide long RNA template were transfected together with the amount of NP-expressing plasmid (pcdna-np) shown in µg (in a total of 6µg). Polymerase was omitted as a negative control. Analysis of the 5S rrna levels served as an internal control. The level of mrna derived from the NP-expressing plasmid is also shown. Quantification was performed by phosphorimage analysis. RNA levels detected in the negative control were set to 0. Graphs depicting the vrna and mrna levels accumulating in the presence of varying concentrations of NP relative to those accumulating in the presence of 1µg NP at the same concentration of polymerase are shown.

3 NP - wt R416A E339A G1(4) - G1(4)/R416A G1(4)/E339A E339A/R416A pcdna-np αranbp5 αnp Supplementary Fig. S3. The expression levels of wild type and mutant NPs are proportional to the amount of NP-expressing plasmid transfected. Western blot analysis of the expression levels of wild type and mutant NP from cell lysates following in vivo reconstitution of vrnps from trimeric polymerase and the 221 nucleotide long vrna-like template in the presence of varying concentrations of NP. 0.5µg of each of the polymerase subunit-expressing plasmids and the plasmid expressing the 221 nucleotide long RNA template were transfected together with the amount of NP-expressing plasmid shown in µg (in a total of 5µg). RanBP5 was detected as a loading control. Size markers are shown in kda.


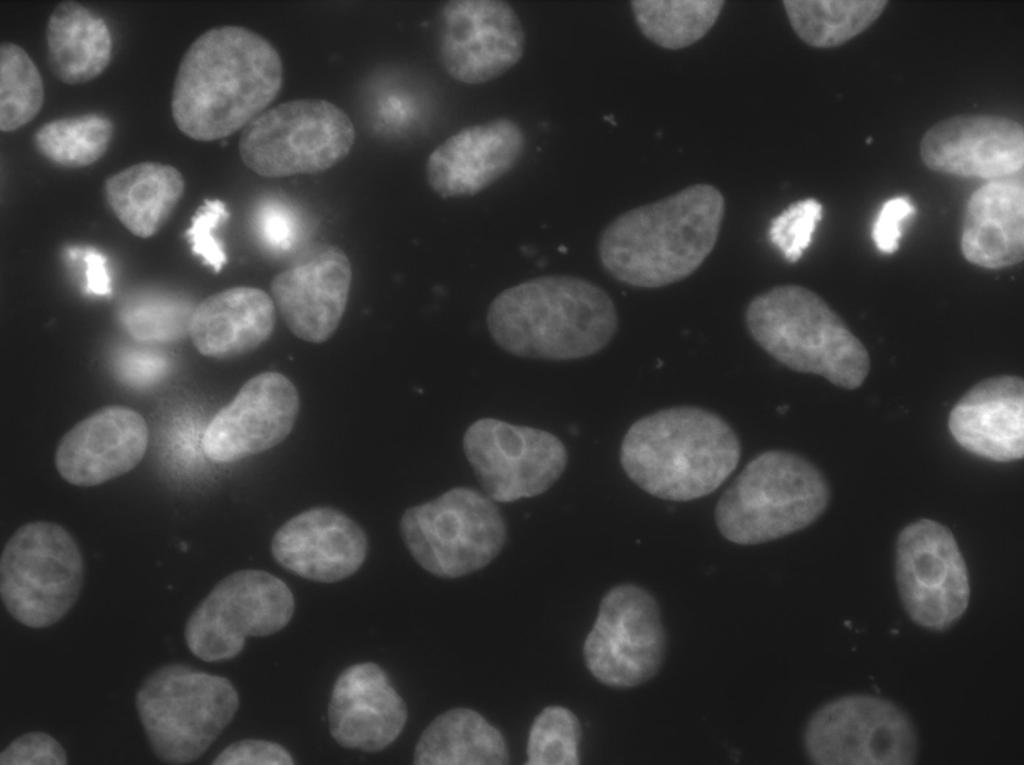
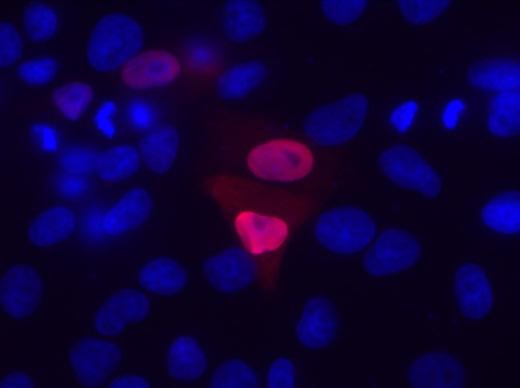
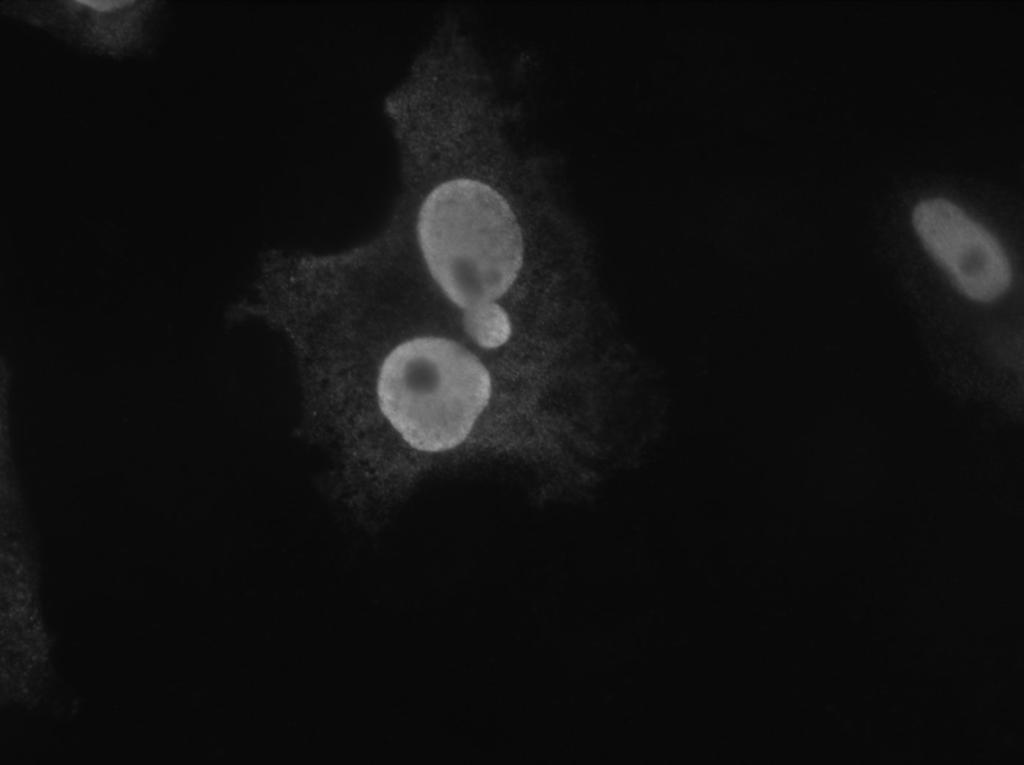
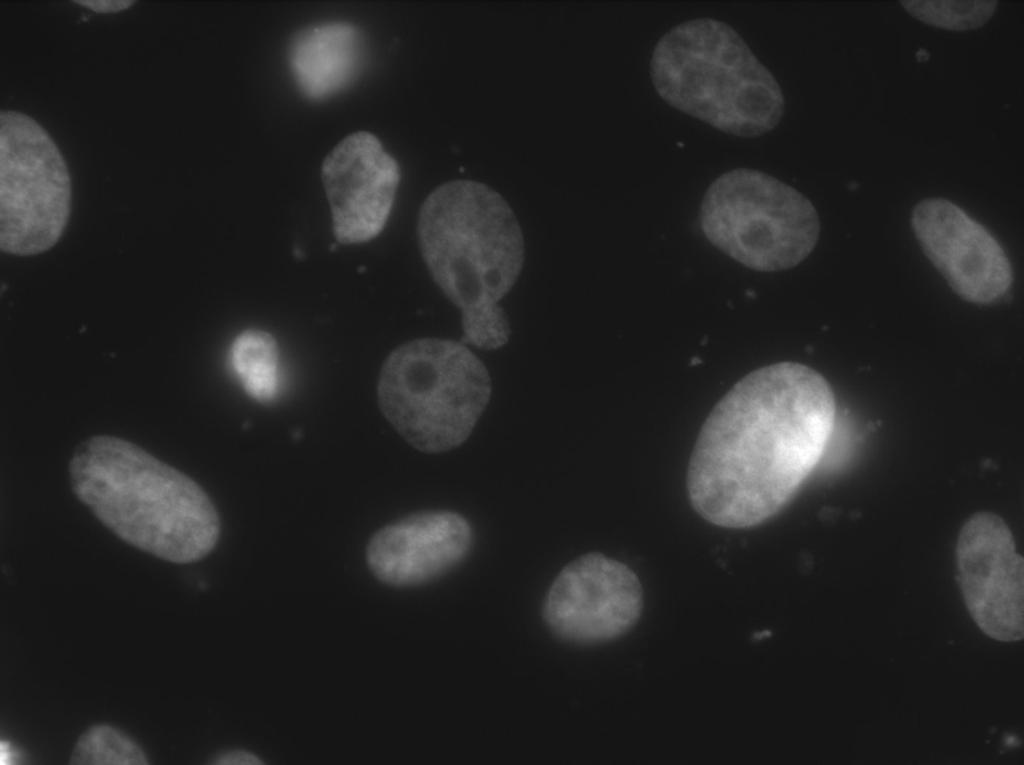
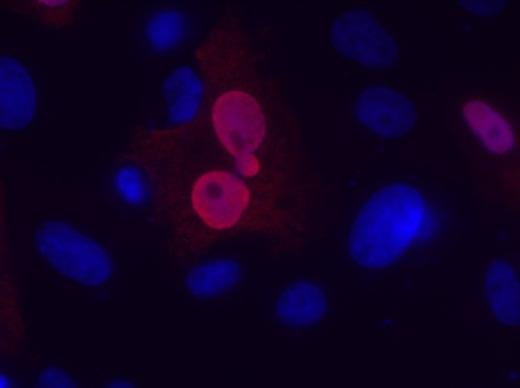
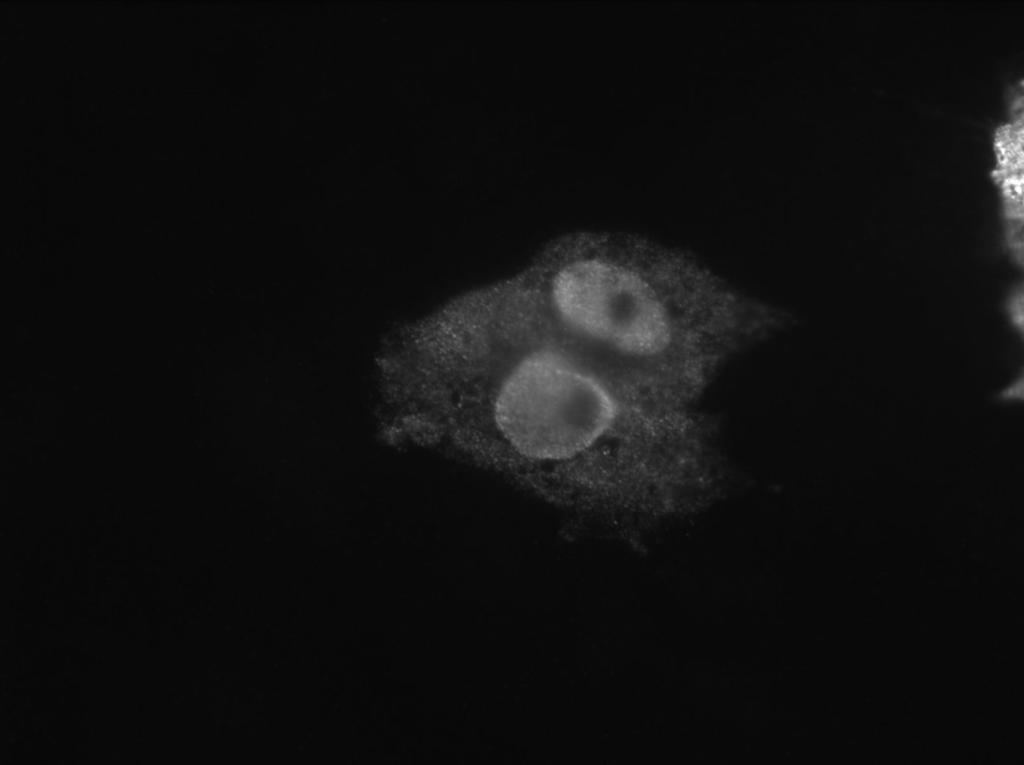
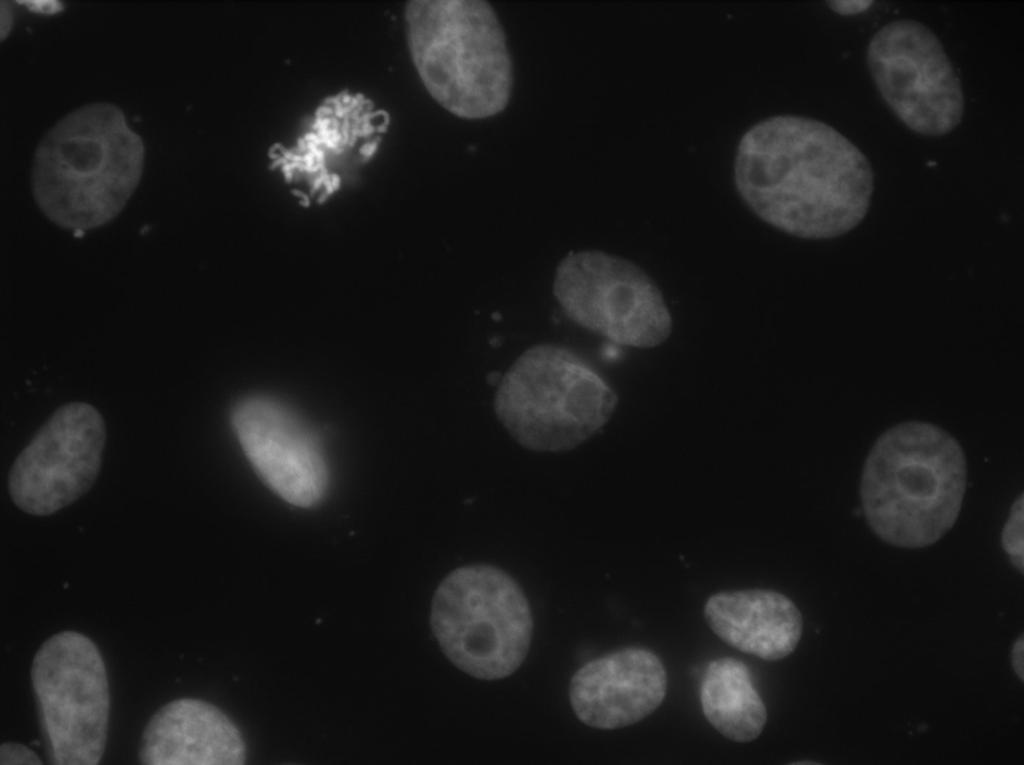
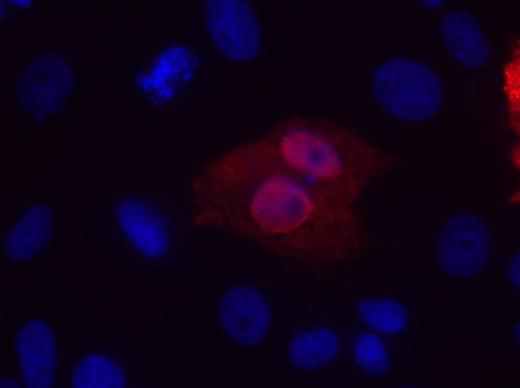
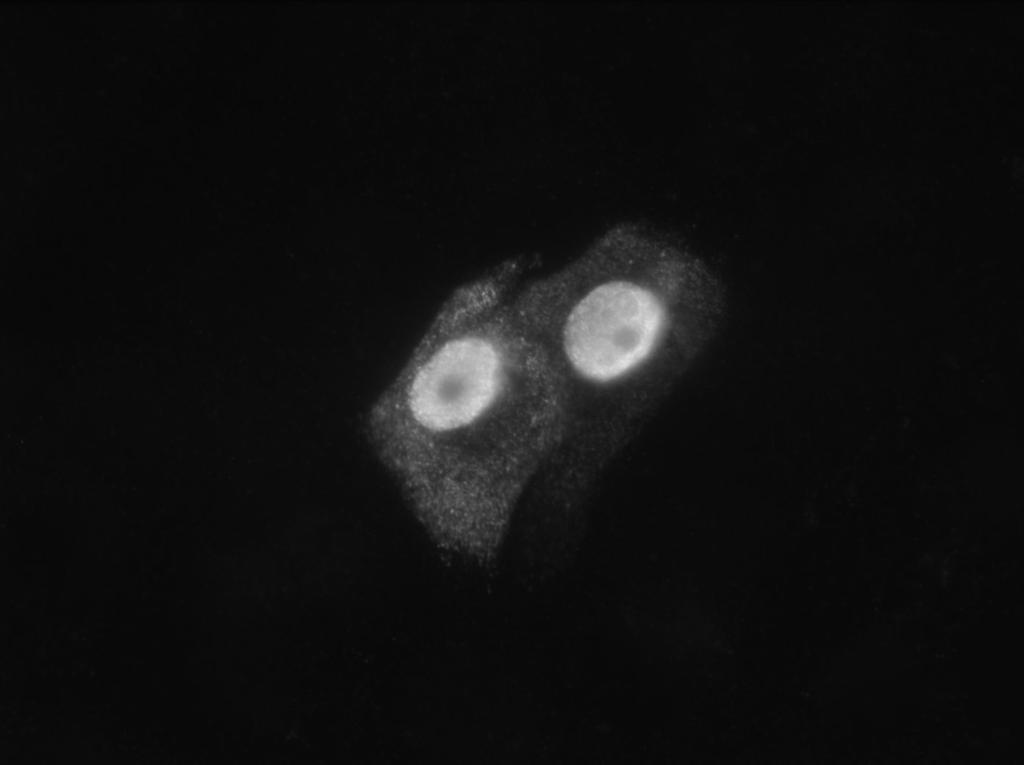
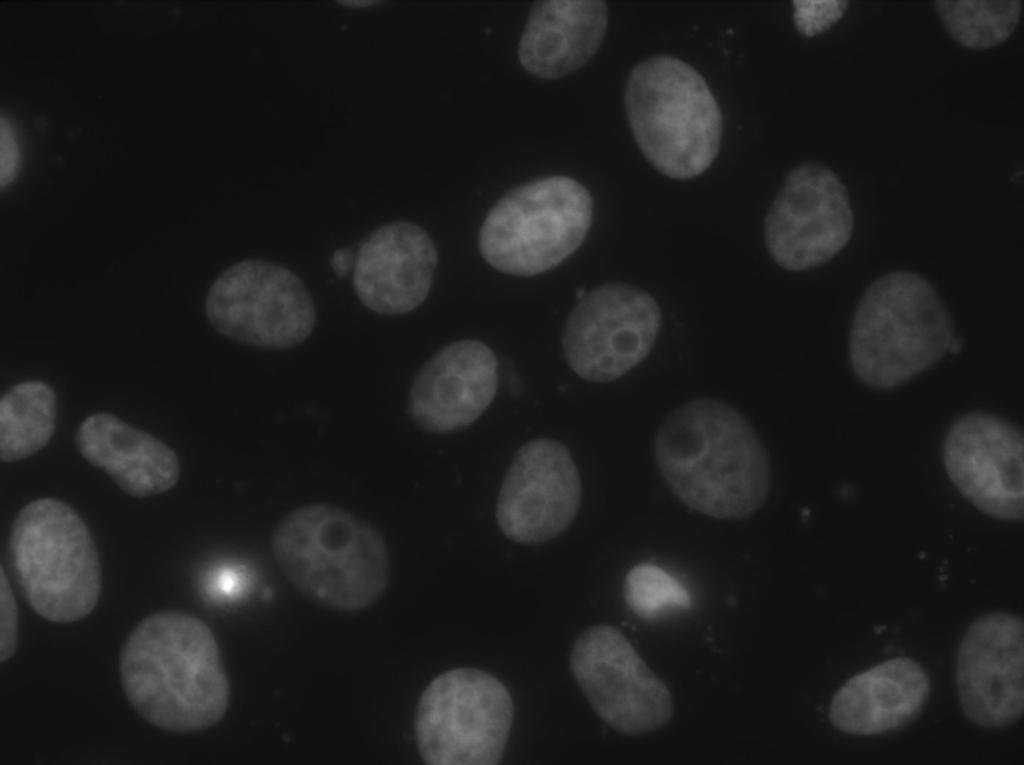
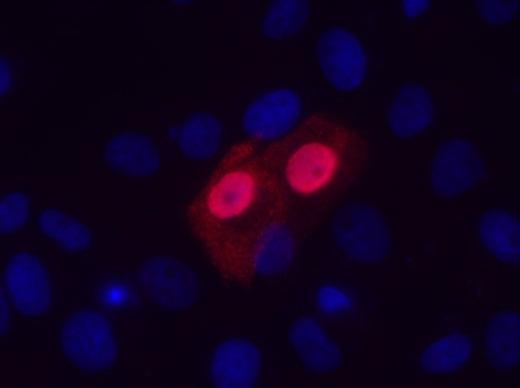
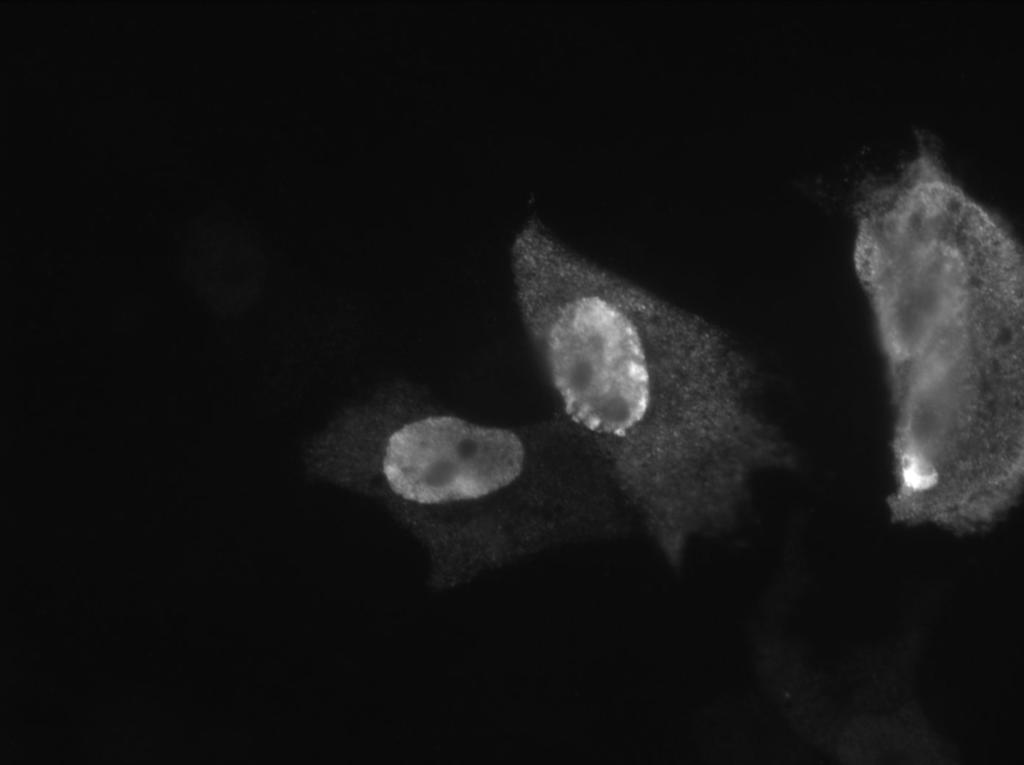
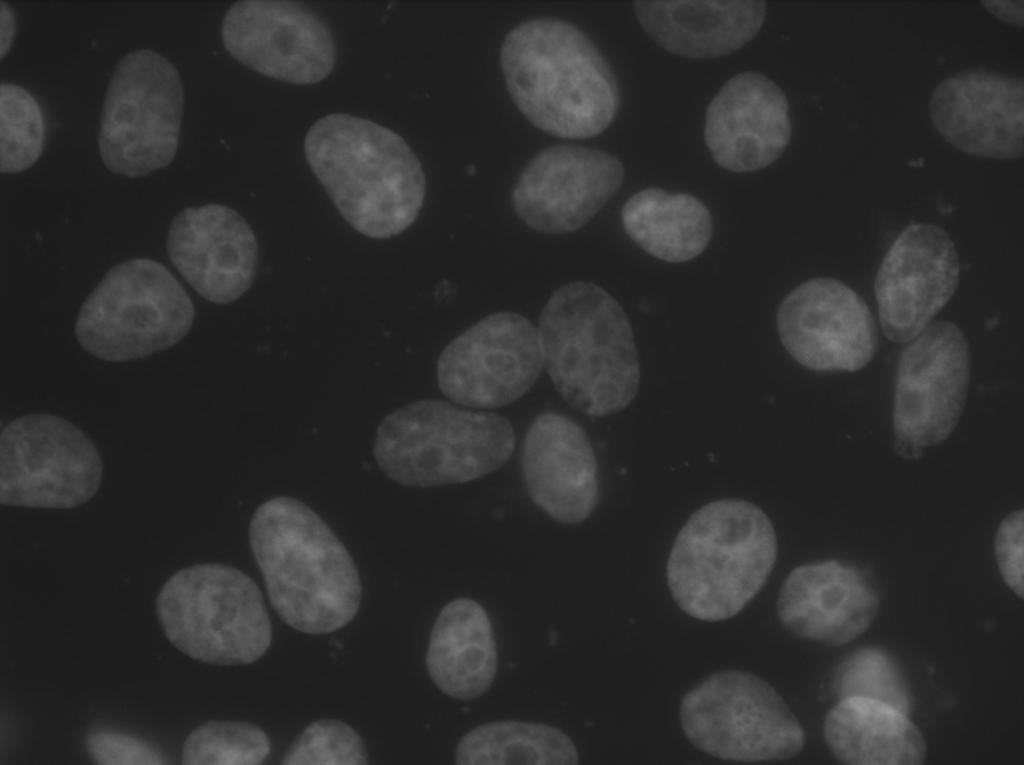
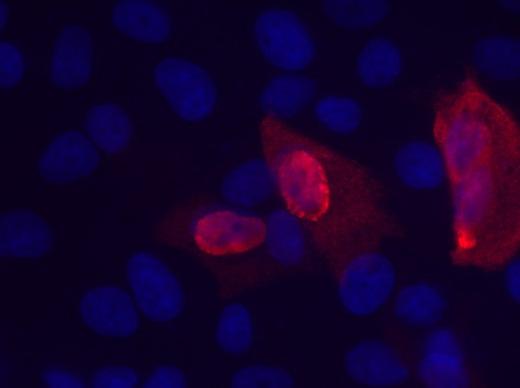
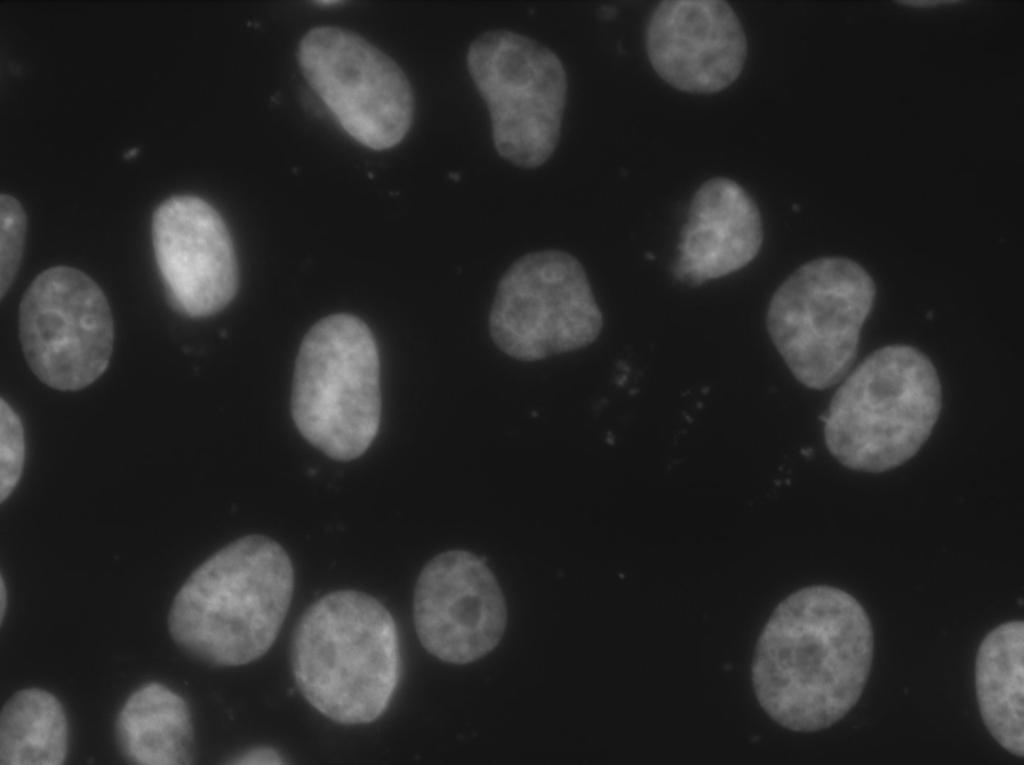
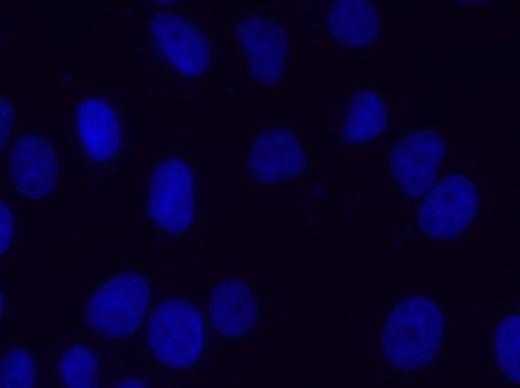
4 NP DAPI merged -NP wild type R416A E339A G1(4) G1(4)/R416A G1(4)/E339A Supplementary Fig. S4. Mutant NPs display similar sub-cellular localisation patterns to that of wild type NP. Images of cellular distribution of wild type and mutant NPs in transfected Vero cells. Nuclei were stained with DAPI. Scale bar = 20µm.

 NP. 0.")
. NP was omitted in the negative control. Analysis of the 5S rrna levels served as an internal control.")

5 NP R416A pcdna-np wt NP vrna mrna 5S rrna pcdna-np mrna αnp α β-actin Relative RNA level (cf. wt NP) 37 Supplementary Fig. S5. Oligomerisation mutant NP is less efficient than wild type NP at supporting replication and transcription of intermediate length vrna-like gene segments in vivo. Primer extension analysis of the accumulation of vrna and mrna following in vivo reconstitution of vrnps from trimeric polymerase and the 221 nucleotide long vrna-like template in the presence of varying concentrations of wild type or mutant (R416A) NP. 0.5µg of each of the polymerase subunit-expressing plasmids and the plasmid expressing the 221 nucleotide long RNA template were transfected together with the amount of NP-expressing plasmid shown in µg (in a total of 5µg). NP was omitted in the negative control. Analysis of the 5S rrna levels served as an internal control. The levels of mrna derived from the NPexpressing plasmid are also shown, as are the NP expression levels with β-actin detected as a loading control. Size markers are shown in kda. Quantification of RNA was performed by phosphorimage analysis. RNA levels detected in the negative control were set to 0. A graph depicting the vrna and mrna levels accumulating in the presence of varying concentrations of mutant NP relative to those accumulating in the presence of the same concentration of wild type NP is shown.
6 Supplementary Table S1: Details of template-specific primers used for detecting different RNA species in primer extension following in vivo RNP reconstitution. Template length (nucleotides) Primer (length in nucleotides) Primer binding site 1 Viral RNA species 2 Reverse transcript length (nucleotides) 1565 (segment 5) (segment 8) based on 5 to 3 numbering of the template sequence in the positive sense. 2 mrna transcribed from pcdna-np is detected by primers 76+ and 149+ to yield reverse transcripts of 117 and 145 nucleotides, respectively. 149-(21) vrna (24) 6-29 vrna 42 mrna (23) 24-2 crna (24) 8-31 vrna 69 mrna (23) crna (24) 8-31 vrna 94 mrna (23) crna (23) vrna 67 mrna (23) crna (21) vrna (21) vrna (21) vrna (21) vrna (21) vrna (21) vrna (20) vrna 75 mrna (20) crna (20) 8-27 vrna 53 mrna (19) 21-3 crna (20) vrna 75 mrna (20) crna 51
Supplementary Figure 1. SC35M polymerase activity in the presence of Bat or SC35M NP encoded from the phw2000 rescue plasmid.
 1 2 3 4 5 6 7 8 9 10 11 12 13 14 15 16 17 18 19 20 21 22 23 24 25 26 27 Supplementary Figure 1. SC35M polymerase activity in the presence of Bat or SC35M NP encoded from the phw2000 rescue plasmid. HEK293T
Nature Medicine: doi: /nm.4322
 1 2 3 4 5 6 7 8 9 10 11 Supplementary Figure 1. Predicted RNA structure of 3 UTR and sequence alignment of deleted nucleotides. (a) Predicted RNA secondary structure of ZIKV 3 UTR. The stem-loop structure
Supplementary Table 1. List of primers used in this study
 Supplementary Table 1. List of primers used in this study Gene Forward primer Reverse primer Rat Met 5 -aggtcgcttcatgcaggt-3 5 -tccggagacacaggatgg-3 Rat Runx1 5 -cctccttgaaccactccact-3 5 -ctggatctgcctggcatc-3
The accumulation of influenza A virus segment 7 spliced mrnas is regulated by the NS1 protein
 Journal of General Virology (2012), 93, 113 118 DOI 10.1099/vir.0.035485-0 Short Communication Correspondence Ervin Fodor ervin.fodor@path.ox.ac.uk Received 24 June 2011 Accepted 12 September 2011 The
Nature Structural and Molecular Biology: doi: /nsmb Supplementary Figure 1
 Supplementary Figure 1 Mutational analysis of the SA2-Scc1 interaction in vitro and in human cells. (a) Autoradiograph (top) and Coomassie stained gel (bottom) of 35 S-labeled Myc-SA2 proteins (input)
Figure S1. Reduction in glomerular mir-146a levels correlate with progression to higher albuminuria in diabetic patients.
 Supplementary Materials Supplementary Figures Figure S1. Reduction in glomerular mir-146a levels correlate with progression to higher albuminuria in diabetic patients. Figure S2. Expression level of podocyte
A Normal Exencephaly Craniora- Spina bifida Microcephaly chischisis. Midbrain Forebrain/ Forebrain/ Hindbrain Spinal cord Hindbrain Hindbrain
 A Normal Exencephaly Craniora- Spina bifida Microcephaly chischisis NTD Number of embryos % among NTD Embryos Exencephaly 52 74.3% Craniorachischisis 6 8.6% Spina bifida 5 7.1% Microcephaly 7 1% B Normal
Supplementary Figure 1. EC-specific Deletion of Snail1 Does Not Affect EC Apoptosis. (a,b) Cryo-sections of WT (a) and Snail1 LOF (b) embryos at
 Cryo-sections of WT (a) and Snail1 LOF (b) embryos at") Supplementary Figure 1. EC-specific Deletion of Snail1 Does Not Affect EC Apoptosis. (a,b) Cryo-sections of WT (a) and Snail1 LOF (b) embryos at E10.5 were double-stained for TUNEL (red) and PECAM-1 (green).
Supplementary Figure 1. EC-specific Deletion of Snail1 Does Not Affect EC Apoptosis. (a,b) Cryo-sections of WT (a) and Snail1 LOF (b) embryos at E10.5 were double-stained for TUNEL (red) and PECAM-1 (green).
SUPPLEMENTARY FIGURES
 SUPPLEMENTARY FIGURES Supplementary Figure 1. (A) Left, western blot analysis of ISGylated proteins in Jurkat T cells treated with 1000U ml -1 IFN for 16h (IFN) or left untreated (CONT); right, western
Unexpected complexity in the interference activity of a cloned influenza defective interfering RNA
 Meng et al. Virology Journal (2017) 14:138 DOI 10.1186/s12985-017-0805-6 RESEARCH Unexpected complexity in the interference activity of a cloned influenza defective interfering RNA Open Access Bo Meng
TRAF6 ubiquitinates TGFβ type I receptor to promote its cleavage and nuclear translocation in cancer
 Supplementary Information TRAF6 ubiquitinates TGFβ type I receptor to promote its cleavage and nuclear translocation in cancer Yabing Mu, Reshma Sundar, Noopur Thakur, Maria Ekman, Shyam Kumar Gudey, Mariya
Supplementary Figure 1. Prevalence of U539C and G540A nucleotide and E172K amino acid substitutions among H9N2 viruses. Full-length H9N2 NS
 Supplementary Figure 1. Prevalence of U539C and G540A nucleotide and E172K amino acid substitutions among H9N2 viruses. Full-length H9N2 NS nucleotide sequences (a, b) or amino acid sequences (c) from
A. List of selected proteins with high SILAC (H/L) ratios identified in mass
 ratios identified in mass") Supplementary material Figure S1. Interaction between UBL5 and FANCI A. List of selected proteins with high SILAC (H/L) ratios identified in mass spectrometry (MS)-based analysis of UBL5-interacting proteins,
Supplementary material Figure S1. Interaction between UBL5 and FANCI A. List of selected proteins with high SILAC (H/L) ratios identified in mass spectrometry (MS)-based analysis of UBL5-interacting proteins,
SUPPLEMENTARY INFORMATION
 doi:10.1038/nature12652 Supplementary Figure 1. PRDM16 interacts with endogenous EHMT1 in brown adipocytes. Immunoprecipitation of PRDM16 complex by flag antibody (M2) followed by Western blot analysis
Supplementary Figure 1. HOPX is hypermethylated in NPC. (a) Methylation levels of HOPX in Normal (n = 24) and NPC (n = 24) tissues from the
 Methylation levels of HOPX in Normal (n = 24) and NPC (n = 24) tissues from the") Supplementary Figure 1. HOPX is hypermethylated in NPC. (a) Methylation levels of HOPX in Normal (n = 24) and NPC (n = 24) tissues from the genome-wide methylation microarray data. Mean ± s.d.; Student
Supplementary Figure 1. HOPX is hypermethylated in NPC. (a) Methylation levels of HOPX in Normal (n = 24) and NPC (n = 24) tissues from the genome-wide methylation microarray data. Mean ± s.d.; Student
Supplementary Figure 1.TRIM33 binds β-catenin in the nucleus. a & b, Co-IP of endogenous TRIM33 with β-catenin in HT-29 cells (a) and HEK 293T cells
 and HEK 293T cells") Supplementary Figure 1.TRIM33 binds β-catenin in the nucleus. a & b, Co-IP of endogenous TRIM33 with β-catenin in HT-29 cells (a) and HEK 293T cells (b). TRIM33 was immunoprecipitated, and the amount of
Supplementary Figure 1.TRIM33 binds β-catenin in the nucleus. a & b, Co-IP of endogenous TRIM33 with β-catenin in HT-29 cells (a) and HEK 293T cells (b). TRIM33 was immunoprecipitated, and the amount of
Ubiquitination and deubiquitination of NP protein regulates influenza A virus RNA replication
 Manuscript EMBO-2010-74756 Ubiquitination and deubiquitination of NP protein regulates influenza A virus RNA replication Tsai-Ling Liao, Chung-Yi Wu, Wen-Chi Su, King-Song Jeng and Michael Lai Corresponding
Reverse Genetics of RNA Viruses
 Reverse Genetics of RNA Viruses Reverse Genetics (RG) he creation of a virus with a fulllength copy of the viral genome he most powerful tool in modern virology RG of RNA viruses Generation or recovery
Tyrosine phosphorylation and protein degradation control the transcriptional activity of WRKY involved in benzylisoquinoline alkaloid biosynthesis
 Supplementary information Tyrosine phosphorylation and protein degradation control the transcriptional activity of WRKY involved in benzylisoquinoline alkaloid biosynthesis Yasuyuki Yamada, Fumihiko Sato
Supplementary Figure 1. Establishment of prostacyclin-secreting hmscs. (a) PCR showed the integration of the COX-1-10aa-PGIS transgene into the
 PCR showed the integration of the COX-1-10aa-PGIS transgene into the") Supplementary Figure 1. Establishment of prostacyclin-secreting hmscs. (a) PCR showed the integration of the COX-1-10aa-PGIS transgene into the genomic DNA of hmscs (PGI2- hmscs). Native hmscs and plasmid
Supplementary Figure 1. Establishment of prostacyclin-secreting hmscs. (a) PCR showed the integration of the COX-1-10aa-PGIS transgene into the genomic DNA of hmscs (PGI2- hmscs). Native hmscs and plasmid
Supplementary Figure 1. AdipoR1 silencing and overexpression controls. (a) Representative blots (upper and lower panels) showing the AdipoR1 protein
 Representative blots (upper and lower panels) showing the AdipoR1 protein") Supplementary Figure 1. AdipoR1 silencing and overexpression controls. (a) Representative blots (upper and lower panels) showing the AdipoR1 protein content relative to GAPDH in two independent experiments.
Supplementary Figure 1. AdipoR1 silencing and overexpression controls. (a) Representative blots (upper and lower panels) showing the AdipoR1 protein content relative to GAPDH in two independent experiments.
Downregulation of the small GTPase SAR1A: a key event underlying alcohol-induced Golgi fragmentation in hepatocytes
 Downregulation of the small GTPase SAR1A: a key event underlying alcohol-induced Golgi fragmentation in hepatocytes Armen Petrosyan 1*, Pi-Wan Cheng 1,3, Dahn L. Clemens 2,3 & Carol A. Casey 2,3 1 Department
Supplementary Figure S1 Supplementary Figure S2
 Supplementary Figure S A) The blots shown in Figure B were qualified by using Gel-Pro analyzer software (Rockville, MD, USA). The ratio of LC3II/LC3I to actin was then calculated. The data are represented
Supplementary Figure 1. Quantile-quantile (Q-Q) plots. (Panel A) Q-Q plot graphical
 plots. (Panel A) Q-Q plot graphical") Supplementary Figure 1. Quantile-quantile (Q-Q) plots. (Panel A) Q-Q plot graphical representation using all SNPs (n= 13,515,798) including the region on chromosome 1 including SORT1 which was previously
Supplementary Figure 1. Quantile-quantile (Q-Q) plots. (Panel A) Q-Q plot graphical representation using all SNPs (n= 13,515,798) including the region on chromosome 1 including SORT1 which was previously
SUPPLEMENTARY FIGURES AND TABLES
 SUPPLEMENTARY FIGURES AND TABLES Supplementary Figure S1: CaSR expression in neuroblastoma models. A. Proteins were isolated from three neuroblastoma cell lines and from the liver metastasis of a MYCN-non
(a) Schematic diagram of the FS mutation of UVRAG in exon 8 containing the highly instable
 Schematic diagram of the FS mutation of UVRAG in exon 8 containing the highly instable") Supplementary Figure 1. Frameshift (FS) mutation in UVRAG. (a) Schematic diagram of the FS mutation of UVRAG in exon 8 containing the highly instable A 10 DNA repeat, generating a premature stop codon
Supplementary Figure 1. Frameshift (FS) mutation in UVRAG. (a) Schematic diagram of the FS mutation of UVRAG in exon 8 containing the highly instable A 10 DNA repeat, generating a premature stop codon
Supplementary Information
 Supplementary Information mediates STAT3 activation at retromer-positive structures to promote colitis and colitis-associated carcinogenesis Zhang et al. a b d e g h Rel. Luc. Act. Rel. mrna Rel. mrna
Conditional and reversible disruption of essential herpesvirus protein functions
 nature methods Conditional and reversible disruption of essential herpesvirus protein functions Mandy Glaß, Andreas Busche, Karen Wagner, Martin Messerle & Eva Maria Borst Supplementary figures and text:
 http://nmhm.washingtondc.museum/collections/archives/agalleries/1918flu/ncp1603.jpg 1 https://assets-production-webvanta-com.s3-us-west- 2 2.amazonaws.com/000000/47/62/original/images/img_109_influenza/Spanish_flu_death_chart.jpg
Supplementary Figure 1. MAT IIα is Acetylated at Lysine 81.
 IP: Flag a Mascot PTM Modified Mass Error Position Gene Names Score Score Sequence m/z [ppm] 81 MAT2A;AMS2;MATA2 35.6 137.28 _AAVDYQK(ac)VVR_ 595.83-2.28 b Pre-immu After-immu Flag- WT K81R WT K81R / Flag
(A) SW480, DLD1, RKO and HCT116 cells were treated with DMSO or XAV939 (5 µm)
 SW480, DLD1, RKO and HCT116 cells were treated with DMSO or XAV939 (5 µm)") Supplementary Figure Legends Figure S1. Tankyrase inhibition suppresses cell proliferation in an axin/β-catenin independent manner. (A) SW480, DLD1, RKO and HCT116 cells were treated with DMSO or XAV939
Supplementary Figure Legends Figure S1. Tankyrase inhibition suppresses cell proliferation in an axin/β-catenin independent manner. (A) SW480, DLD1, RKO and HCT116 cells were treated with DMSO or XAV939
Supplementary information. MARCH8 inhibits HIV-1 infection by reducing virion incorporation of envelope glycoproteins
 Supplementary information inhibits HIV-1 infection by reducing virion incorporation of envelope glycoproteins Takuya Tada, Yanzhao Zhang, Takayoshi Koyama, Minoru Tobiume, Yasuko Tsunetsugu-Yokota, Shoji
Supplementary information
 Supplementary information Human Cytomegalovirus MicroRNA mir-us4-1 Inhibits CD8 + T Cell Response by Targeting ERAP1 Sungchul Kim, Sanghyun Lee, Jinwook Shin, Youngkyun Kim, Irini Evnouchidou, Donghyun
(A) RT-PCR for components of the Shh/Gli pathway in normal fetus cell (MRC-5) and a
 RT-PCR for components of the Shh/Gli pathway in normal fetus cell (MRC-5) and a") Supplementary figure legends Supplementary Figure 1. Expression of Shh signaling components in a panel of gastric cancer. (A) RT-PCR for components of the Shh/Gli pathway in normal fetus cell (MRC-5) and
Supplementary figure legends Supplementary Figure 1. Expression of Shh signaling components in a panel of gastric cancer. (A) RT-PCR for components of the Shh/Gli pathway in normal fetus cell (MRC-5) and
Supplementary Figure 1
 Supplementary Figure 1 6 HE-50 HE-116 E-1 HE-108 Supplementary Figure 1. Targeted drug response curves of endometrial cancer cells. Endometrial cancer cell lines were incubated with serial dilutions of
Relative SOD1 activity. Relative SOD2 activity. Relative SOD activity (Infected:Mock) + CP + DDC
 + CP + DDC") Supplementary Figure 1. SOD1 activity is significantly increased relative to SOD1 levels. SOD1 and SOD2 activities in the infected mork13 cells are shown normalised to their corresponding levels and relative
Supplementary Figure 1. SOD1 activity is significantly increased relative to SOD1 levels. SOD1 and SOD2 activities in the infected mork13 cells are shown normalised to their corresponding levels and relative
The Blueprint of Life: DNA to Protein. What is genetics? DNA Structure 4/27/2011. Chapter 7
 The Blueprint of Life: NA to Protein Chapter 7 What is genetics? The science of heredity; includes the study of genes, how they carry information, how they are replicated, how they are expressed NA Structure
The Blueprint of Life: DNA to Protein
 The Blueprint of Life: NA to Protein Chapter 7 What is genetics? The science of heredity; includes the y; study of genes, how they carry information, how they are replicated, how they are expressed 1 NA
Supplementary Figure S1. Venn diagram analysis of mrna microarray data and mirna target analysis. (a) Western blot analysis of T lymphoblasts (CLS)
 Western blot analysis of T lymphoblasts (CLS)") Supplementary Figure S1. Venn diagram analysis of mrna microarray data and mirna target analysis. (a) Western blot analysis of T lymphoblasts (CLS) and their exosomes (EXO) in resting (REST) and activated
Supplementary Figure S1. Venn diagram analysis of mrna microarray data and mirna target analysis. (a) Western blot analysis of T lymphoblasts (CLS) and their exosomes (EXO) in resting (REST) and activated
SUPPLEMENTARY FIGURES AND TABLE
 SUPPLEMENTARY FIGURES AND TABLE Supplementary Figure S1: Characterization of IRE1α mutants. A. U87-LUC cells were transduced with the lentiviral vector containing the GFP sequence (U87-LUC Tet-ON GFP).
HEK293FT cells were transiently transfected with reporters, N3-ICD construct and
 Supplementary Information Luciferase reporter assay HEK293FT cells were transiently transfected with reporters, N3-ICD construct and increased amounts of wild type or kinase inactive EGFR. Transfections
SUPPLEMENTARY INFORMATION
 DOI: 10.1038/ncb2566 Figure S1 CDKL5 protein expression pattern and localization in mouse brain. (a) Multiple-tissue western blot from a postnatal day (P) 21 mouse probed with an antibody against CDKL5.
ISG15 sirna # Ctrl sirna+ifn+wt. Virus titer (Pfu/ml) hours post infection. d USP18 sirna #2 IFN
 hours post infection. d USP18 sirna #2 IFN") a ISG15 sirna Ctrl #1 #2 ISG15 conjugates IB: ISG15 Virus titer (Pfu/ml) b ISG15 sirna #2 10 7 Ctrl sirna+ifn+wt Ctrl sirna+ifn+67 10 6 ISG15 sirna+ifn+wt ISG15 sirna+ifn+67 10 5 10 4 10 3 Free ISG15 10
a ISG15 sirna Ctrl #1 #2 ISG15 conjugates IB: ISG15 Virus titer (Pfu/ml) b ISG15 sirna #2 10 7 Ctrl sirna+ifn+wt Ctrl sirna+ifn+67 10 6 ISG15 sirna+ifn+wt ISG15 sirna+ifn+67 10 5 10 4 10 3 Free ISG15 10
SUPPLEMENTARY LEGENDS...
 TABLE OF CONTENTS SUPPLEMENTARY LEGENDS... 2 11 MOVIE S1... 2 FIGURE S1 LEGEND... 3 FIGURE S2 LEGEND... 4 FIGURE S3 LEGEND... 5 FIGURE S4 LEGEND... 6 FIGURE S5 LEGEND... 7 FIGURE S6 LEGEND... 8 FIGURE
CHARACTERIZING THE ROLE OF N TERMINUS OF INFLUENZA A NUCLEOPROTEIN FOR LOCATION AND VIRAL RNP ACTIVITY
 California State University, San Bernardino CSUSB ScholarWorks Electronic Theses, Projects, and Dissertations Office of Graduate Studies 6-2018 CHARACTERIZING THE ROLE OF N TERMINUS OF INFLUENZA A NUCLEOPROTEIN
SUPPLEMENTARY INFORMATION
 DOI: 1.138/ncb222 / b. WB anti- WB anti- ulin Mitotic index (%) 14 1 6 2 T (h) 32 48-1 1 2 3 4 6-1 4 16 22 28 3 33 e. 6 4 2 Time (min) 1-6- 11-1 > 1 % cells Figure S1 depletion leads to mitotic defects
The RNA Polymerase of Influenza Virus, Bound to the 5 End of Virion RNA, Acts in cis To Polyadenylate mrna
 JOURNAL OF VIROLOGY, Oct. 1998, p. 8214 8219 Vol. 72, No. 10 0022-538X/98/$04.00 0 Copyright 1998, American Society for Microbiology. All Rights Reserved. The RNA Polymerase of Influenza Virus, Bound to
Lack of cadherins Celsr2 and Celsr3 impairs ependymal ciliogenesis, leading to fatal
 Lack of cadherins Celsr2 and Celsr3 impairs ependymal ciliogenesis, leading to fatal hydrocephalus Fadel TISSIR, Yibo QU, Mireille MONTCOUQUIOL, Libing ZHOU, Kouji KOMATSU, Dongbo SHI, Toshihiko FUJIMORI,
effects on organ development. a-f, Eye and wing discs with clones of ε j2b10 show no
 Supplementary Figure 1. Loss of function clones of 14-3-3 or 14-3-3 show no significant effects on organ development. a-f, Eye and wing discs with clones of 14-3-3ε j2b10 show no obvious defects in Elav
Nature Structural & Molecular Biology: doi: /nsmb Supplementary Figure 1. Generation and validation of mtef4-knockout mice.
 Supplementary Figure 1 Generation and validation of mtef4-knockout mice. (a) Alignment of EF4 (E. coli) with mouse, yeast and human EF4. (b) Domain structures of mouse mtef4 compared to those of EF4 (E.
Supplementary Figure 1: Characterisation of phospho-fgfr-y463 antibody. (A)
") Supplementary Figure 1: Characterisation of phospho-fgfr-y463 antibody. (A) Cells over-expressing hfgfr1-pcdna3 (+) or pcdna3 (-) were stimulated for 10 minutes with 50ng/ml FGF2 and lysates immunoblotted
Supplementary Figure 1: Characterisation of phospho-fgfr-y463 antibody. (A) Cells over-expressing hfgfr1-pcdna3 (+) or pcdna3 (-) were stimulated for 10 minutes with 50ng/ml FGF2 and lysates immunoblotted
HIF-inducible mir-191 promotes migration in breast cancer through complex regulation of TGFβ-signaling in hypoxic microenvironment.
 HIF-inducible mir-9 promotes migration in breast cancer through complex regulation of TGFβ-signaling in hypoxic microenvironment. Neha Nagpal, Hafiz M Ahmad, Shibu Chameettachal3, Durai Sundar, Sourabh
s u p p l e m e n ta ry i n f o r m at i o n
 Figure S1 Characterization of tet-off inducible cell lines expressing GFPprogerin and GFP-wt lamin A. a, Western blot analysis of GFP-progerin- or GFP-wt lamin A- expressing cells before induction (0d)
NS2/NEP protein regulates transcription and replication of the influenza virus RNA genome
 Journal of General Virology (2009), 90, 1398 1407 DOI 10.1099/vir.0.009639-0 NS2/NEP protein regulates transcription and replication of the influenza virus RNA genome Nicole C. Robb,3 Matt Smith,34 Frank
Table S1. Primer sequences used for qrt-pcr. CACCATTGGCAATGAGCGGTTC AGGTCTTTGCGGATGTCCACGT ACTB AAGTCCATGTGCTGGCAGCACT ATCACCACTCCGAAGTCCGTCT LCOR
 Table S1. Primer sequences used for qrt-pcr. ACTB LCOR KLF6 CTBP1 CDKN1A CDH1 ATF3 PLAU MMP9 TFPI2 CACCATTGGCAATGAGCGGTTC AGGTCTTTGCGGATGTCCACGT AAGTCCATGTGCTGGCAGCACT ATCACCACTCCGAAGTCCGTCT CGGCTGCAGGAAAGTTTACA
Supplemental Figure 1
 Supplemental Figure 1 1a 1c PD-1 MFI fold change 6 5 4 3 2 1 IL-1α IL-2 IL-4 IL-6 IL-1 IL-12 IL-13 IL-15 IL-17 IL-18 IL-21 IL-23 IFN-α Mut Human PD-1 promoter SBE-D 5 -GTCTG- -1.2kb SBE-P -CAGAC- -1.kb
Supplementary Figure 1 Transcription assay of nine ABA-responsive PP2C. Transcription assay of nine ABA-responsive PP2C genes. Total RNA was isolated
 Supplementary Figure 1 Transcription assay of nine ABA-responsive PP2C genes. Transcription assay of nine ABA-responsive PP2C genes. Total RNA was isolated from 7 day-old seedlings treated with or without
NLRX1: 5 -GCTCCATGGCTTAGAGCATC-3 (forward) 5 -AACTCCTCCTCCGTCCTGAT-3 (reverse) β-actin
 5 -AACTCCTCCTCCGTCCTGAT-3 (reverse) β-actin") NLRX1 β-actin 1 2 3 4 5 6 1 2 3 4 5 6 NLRX1 (667 bp) β-actin (523 bp) Supplementary Figure 1: Expression of NLRX1 in human cell lines. 1: HeLa, 2: HEK293T, 3: MCF-7, 4:Ramos, 5:Jurkat, 6: THP1. The following
NLRX1 β-actin 1 2 3 4 5 6 1 2 3 4 5 6 NLRX1 (667 bp) β-actin (523 bp) Supplementary Figure 1: Expression of NLRX1 in human cell lines. 1: HeLa, 2: HEK293T, 3: MCF-7, 4:Ramos, 5:Jurkat, 6: THP1. The following
Supplementary Figure 1
 Supplementary Figure 1 Supplementary Figure 1 Schematic depiction of the tandem Fc GDF15. Supplementary Figure 2 Supplementary Figure 2 Gfral mrna levels in the brains of both wild-type and knockout Gfral
Unité de Génétique Moléculaire des Virus Respiratoires, URA 1966 CNRS, Institut Pasteur, 25 rue du Dr. Roux, PARIS Cedex 15, France
 Virology 345 (2006) 73 87 www.elsevier.com/locate/yviro Recombinant influenza A viruses harboring optimized dicistronic NA segment with an extended native 5V terminal sequence: Induction of heterospecific
MicroRNA sponges: competitive inhibitors of small RNAs in mammalian cells
 MicroRNA sponges: competitive inhibitors of small RNAs in mammalian cells Margaret S Ebert, Joel R Neilson & Phillip A Sharp Supplementary figures and text: Supplementary Figure 1. Effect of sponges on
Supplementary Table 1. The primers used for quantitative RT-PCR. Gene name Forward (5 > 3 ) Reverse (5 > 3 )
 Reverse (5 > 3 )") 770 771 Supplementary Table 1. The primers used for quantitative RT-PCR. Gene name Forward (5 > 3 ) Reverse (5 > 3 ) Human CXCL1 GCGCCCAAACCGAAGTCATA ATGGGGGATGCAGGATTGAG PF4 CCCCACTGCCCAACTGATAG TTCTTGTACAGCGGGGCTTG
770 771 Supplementary Table 1. The primers used for quantitative RT-PCR. Gene name Forward (5 > 3 ) Reverse (5 > 3 ) Human CXCL1 GCGCCCAAACCGAAGTCATA ATGGGGGATGCAGGATTGAG PF4 CCCCACTGCCCAACTGATAG TTCTTGTACAGCGGGGCTTG
Doctoral Degree Program in Marine Biotechnology, College of Marine Sciences, Doctoral Degree Program in Marine Biotechnology, Academia Sinica, Taipei,
 Cyclooxygenase 2 facilitates dengue virus replication and serves as a potential target for developing antiviral agents Chun-Kuang Lin 1,2, Chin-Kai Tseng 3,4, Yu-Hsuan Wu 3,4, Chih-Chuang Liaw 1,5, Chun-
Rescue of mutant rhodopsin traffic by metformin-induced AMPK activation accelerates photoreceptor degeneration Athanasiou et al
 Supplementary Material Rescue of mutant rhodopsin traffic by metformin-induced AMPK activation accelerates photoreceptor degeneration Athanasiou et al Supplementary Figure 1. AICAR improves P23H rod opsin
Phosphoinositides Regulate Ciliary Protein Trafficking to Modulate Hedgehog Signaling
 Developmental Cell Supplemental Information Phosphoinositides Regulate Ciliary Protein Trafficking to Modulate Hedgehog Signaling Francesc R. Garcia-Gonzalo, Siew Cheng Phua, Elle C. Roberson, Galo Garcia
SUPPLEMENTARY INFORMATION
 DOI:.38/ncb3399 a b c d FSP DAPI 5mm mm 5mm 5mm e Correspond to melanoma in-situ Figure a DCT FSP- f MITF mm mm MlanaA melanoma in-situ DCT 5mm FSP- mm mm mm mm mm g melanoma in-situ MITF MlanaA mm mm
Supplementary Material
 Supplementary Material Summary: The supplementary information includes 1 table (Table S1) and 4 figures (Figure S1 to S4). Supplementary Figure Legends Figure S1 RTL-bearing nude mouse model. (A) Tumor
Supplemental information contains 7 movies and 4 supplemental Figures
 1 2 3 4 5 6 7 8 9 10 11 12 13 14 15 16 17 18 19 20 21 22 23 24 25 26 27 Supplemental information contains 7 movies and 4 supplemental Figures Movies: Movie 1. Single virus tracking of A4-mCherry-WR MV
Supplementary Figure S1: Defective heterochromatin repair in HGPS progeroid cells
 Supplementary Figure S1: Defective heterochromatin repair in HGPS progeroid cells Immunofluorescence staining of H3K9me3 and 53BP1 in PH and HGADFN003 (HG003) cells at 24 h after γ-irradiation. Scale bar,
Hepatitis B Antiviral Drug Development Multi-Marker Screening Assay
 Hepatitis B Antiviral Drug Development Multi-Marker Screening Assay Background ImQuest BioSciences has developed and qualified a single-plate method to expedite the screening of antiviral agents against
Supplementary Figure 1
 Combination index (CI) Supplementary Figure 1 2. 1.5 1. Ishikawa AN3CA Nou-1 Hec-18.5...2.4.6.8 1. Fraction affected (Fa) Supplementary Figure 1. The synergistic effect of PARP inhibitor and PI3K inhibitor
Supplementary Information
 Supplementary Information HBV maintains electrostatic homeostasis by modulating negative charges from phosphoserine and encapsidated nucleic acids Authors: Pei-Yi Su 1,2,3, Ching-Jen Yang 2, Tien-Hua Chu
Gallic acid prevents isoproterenol-induced cardiac hypertrophy and fibrosis through regulation of JNK2 signaling and Smad3 binding activity
 Gallic acid prevents isoproterenol-induced cardiac hypertrophy and fibrosis through regulation of JNK2 signaling and Smad3 binding activity Yuhee Ryu 1,+, Li Jin 1,2+, Hae Jin Kee 1,, Zhe Hao Piao 3, Jae
Supplementary Materials for
 www.sciencesignaling.org/cgi/content/full/9/439/ra78/dc1 Supplementary Materials for Small heterodimer partner mediates liver X receptor (LXR) dependent suppression of inflammatory signaling by promoting
T H E J O U R N A L O F C E L L B I O L O G Y
 T H E J O U R N A L O F C E L L B I O L O G Y Supplemental material Krenn et al., http://www.jcb.org/cgi/content/full/jcb.201110013/dc1 Figure S1. Levels of expressed proteins and demonstration that C-terminal
SUPPLEMENTARY INFORMATION
 sirna pool: Control Tetherin -HA-GFP HA-Tetherin -Tubulin Supplementary Figure S1. Knockdown of HA-tagged tetherin expression by tetherin specific sirnas. HeLa cells were cotransfected with plasmids expressing
GPR120 *** * * Liver BAT iwat ewat mwat Ileum Colon. UCP1 mrna ***
 a GPR120 GPR120 mrna/ppia mrna Arbitrary Units 150 100 50 Liver BAT iwat ewat mwat Ileum Colon b UCP1 mrna Fold induction 20 15 10 5 - camp camp SB202190 - - - H89 - - - - - GW7647 Supplementary Figure
Relative activity (%) SC35M
 SC35M") a 125 Bat (H17N) b 125 A/WSN (H1N1) Relative activity (%) 0 75 50 25 Relative activity (%) 0 75 50 25 0 Pos. Neg. PA PB1 Pos. Neg. NP PA PB1 PB2 0 Pos. Neg. NP PA PB1 PB2 SC35M Bat Supplementary Figure
a 125 Bat (H17N) b 125 A/WSN (H1N1) Relative activity (%) 0 75 50 25 Relative activity (%) 0 75 50 25 0 Pos. Neg. PA PB1 Pos. Neg. NP PA PB1 PB2 0 Pos. Neg. NP PA PB1 PB2 SC35M Bat Supplementary Figure
marker. DAPI labels nuclei. Flies were 20 days old. Scale bar is 5 µm. Ctrl is
 Supplementary Figure 1. (a) Nos is detected in glial cells in both control and GFAP R79H transgenic flies (arrows), but not in deletion mutant Nos Δ15 animals. Repo is a glial cell marker. DAPI labels
Cells and reagents. Synaptopodin knockdown (1) and dynamin knockdown (2)
 and dynamin knockdown (2)") Supplemental Methods Cells and reagents. Synaptopodin knockdown (1) and dynamin knockdown (2) podocytes were cultured as described previously. Staurosporine, angiotensin II and actinomycin D were all obtained
Supplemental Methods Cells and reagents. Synaptopodin knockdown (1) and dynamin knockdown (2) podocytes were cultured as described previously. Staurosporine, angiotensin II and actinomycin D were all obtained
Inhibition of Cdk5 Promotes β-cell Differentiation from Ductal Progenitors
 Inhibition of Cdk5 Promotes β-cell Differentiation from Ductal Progenitors Ka-Cheuk Liu, Gunter Leuckx, Daisuke Sakano, Philip A. Seymour, Charlotte L. Mattsson, Linn Rautio, Willem Staels, Yannick Verdonck,
Figure 1. Possible role of oncogene activation, receptor, G-protein mutation, or tumor
 Figures Part of introduction Figure 1. Possible role of oncogene activation, receptor, G-protein mutation, or tumor supressor gene deletion in the induction of thyroid carcinoma. ( by James A Fagin, M.D.)
Nature Immunology: doi: /ni.3866
 Nature Immunology: doi:10.1038/ni.3866 Supplementary Figure 1 The effect of TIPE2 on chemotaxis. a, The expression of TIPE2 in dhl-60c, dhl-60t, TIPE2-expressing and 15/16Q-expressing dhl-60t neutrophils
33VASTVNGATSANNHGEPPS51PADARPR58
 Pro-rich region Trans-membrane region 214 246 359 381 UL50 1 397 211SSRTAS216PPPPPR222 NLS CR1 CR2 CR3 CR4 UL53 1 376 11RERRS15ALRS19LLRKRRR25 33VASTVNGATSANNHGEPPS51PADARPR58 FIG S1. UL97 phosphorylation
p = formed with HCI-001 p = Relative # of blood vessels that formed with HCI-002 Control Bevacizumab + 17AAG Bevacizumab 17AAG
 A.. Relative # of ECs associated with HCI-001 1.4 1.2 1.0 0.8 0.6 0.4 0.2 0.0 ol b p < 0.001 Relative # of blood vessels that formed with HCI-001 1.4 1.2 1.0 0.8 0.6 0.4 0.2 0.0 l b p = 0.002 Control IHC:
Recombinant Protein Expression Retroviral system
 Recombinant Protein Expression Retroviral system Viruses Contains genome DNA or RNA Genome encased in a protein coat or capsid. Some viruses have membrane covering protein coat enveloped virus Ø Essential
Supplementary figures
 Supplementary figures Supplementary Figure 1. B cells stimulated with pokeweed mitogen display normal mitotic figures but not cells infected with B95-8. The figures show cells stimulated with pokeweed
T H E J O U R N A L O F C E L L B I O L O G Y
 Supplemental material Chairoungdua et al., http://www.jcb.org/cgi/content/full/jcb.201002049/dc1 T H E J O U R N A L O F C E L L B I O L O G Y Figure S1. Expression of CD9 and CD82 inhibits Wnt/ -catenin
Trim29 gene-targeting strategy. (a) Genotyping of wildtype mice (+/+), Trim29 heterozygous mice (+/ ) and homozygous mice ( / ).
 Genotyping of wildtype mice (+/+), Trim29 heterozygous mice (+/ ) and homozygous mice ( / ).") Supplementary Figure 1 Trim29 gene-targeting strategy. (a) Genotyping of wildtype mice (+/+), Trim29 heterozygous mice (+/ ) and homozygous mice ( / ). (b) Immunoblot analysis of TRIM29 in lung primary
Supplementary Figure 1 Trim29 gene-targeting strategy. (a) Genotyping of wildtype mice (+/+), Trim29 heterozygous mice (+/ ) and homozygous mice ( / ). (b) Immunoblot analysis of TRIM29 in lung primary
Different De Novo Initiation Strategies Are Used by Influenza Virus RNA Polymerase on Its crna and Viral RNA Promoters during Viral RNA Replication
 JOURNAL OF VIROLOGY, Mar. 2006, p. 2337 2348 Vol. 80, No. 5 0022-538X/06/$08.00 0 doi:10.1128/jvi.80.5.2337 2348.2006 Copyright 2006, American Society for Microbiology. All Rights Reserved. Different De
Supplementary Information. Supplementary Figure 1
 Supplementary Information Supplementary Figure 1 1 Supplementary Figure 1. Functional assay of the hcas9-2a-mcherry construct (a) Gene correction of a mutant EGFP reporter cell line mediated by hcas9 or
Supplementary Figure 1. Electroporation of a stable form of β-catenin causes masses protruding into the IV ventricle. HH12 chicken embryos were
 Supplementary Figure 1. Electroporation of a stable form of β-catenin causes masses protruding into the IV ventricle. HH12 chicken embryos were electroporated with β- Catenin S33Y in PiggyBac expression
Supplementary Figure 1. Deletion of Smad3 prevents B16F10 melanoma invasion and metastasis in a mouse s.c. tumor model.
 A B16F1 s.c. Lung LN Distant lymph nodes Colon B B16F1 s.c. Supplementary Figure 1. Deletion of Smad3 prevents B16F1 melanoma invasion and metastasis in a mouse s.c. tumor model. Highly invasive growth
Supplementary Figure 1 hlrrk2 promotes CAP dependent protein translation.
 ` Supplementary Figure 1 hlrrk2 promotes CAP dependent protein translation. (a) Overexpression of hlrrk2 in HeLa cells enhances total protein synthesis in [35S] methionine/cysteine incorporation assays.
Control GST GST-RAP. α2-mg. 170 kda. b-actin. 42 kda LRP-1
 % of max Supplementary Figure 1 Control GST GST-RP 17 kda α2-mg 42 kda b-actin Gate: CD11c+ (DCs) Gate: F4/8+ (Mfs) IgG Cd11cCre + Lrp1 fl/fl LRP-1 Supplementary figure 1. () MDCs were pretreated with
SUPPLEMENTARY INFORMATION. Supplementary Figures S1-S9. Supplementary Methods
 SUPPLEMENTARY INFORMATION SUMO1 modification of PTEN regulates tumorigenesis by controlling its association with the plasma membrane Jian Huang 1,2#, Jie Yan 1,2#, Jian Zhang 3#, Shiguo Zhu 1, Yanli Wang
mock! A3AC106S! A3BE255Q! 86.7! 90.1! 88.0! 89.8! 89.0!
 a A3A A3Bi7 A3Btok A3Bwh A3Blan mock V5 DAPI merge 5 µm b edited A3A A3Bi7 A3Btok A3Blan A3Bwh A3BF38L A3BW359L mock A3AC16S A3BE255Q 79.5 79.7 8.4 81.3 82.5 83.9 85.3 86.7 88. 89. 89.8 9.1 HBV 3DPCR Td/
MII. Supplement Figure 1. CapZ β2. Merge. 250ng. 500ng DIC. Merge. Journal of Cell Science Supplementary Material. GFP-CapZ β2 DNA
 A GV GVBD MI DNA CapZ β2 CapZ β2 Merge B DIC GFP-CapZ β2 Merge CapZ β2-gfp 250ng 500ng Supplement Figure 1. MII A early MI late MI Control RNAi CapZαβ DNA Actin Tubulin B Phalloidin Intensity(A.U.) n=10
Scaffold function of long noncoding RNA HOTAIR in protein ubiquitination
 Yoon et al, page Scaffold function of long noncoding RNA HOTAIR in protein ubiquitination Je-Hyun Yoon,, Kotb Abdelmohsen, Jiyoung Kim, Xiaoling Yang, Jennifer L. Martindale, Kumiko Tominaga-Yamanaka,
WDR62 is associated with the spindle pole and mutated in human microcephaly
 WDR62 is associated with the spindle pole and mutated in human microcephaly Adeline K. Nicholas, Maryam Khurshid, Julie Désir, Ofélia P. Carvalho, James J. Cox, Gemma Thornton, Rizwana Kausar, Muhammad